GATA3 suppresses metastasis and modulatesthe tumour microenvironment by regulatingmicroRNA-29b expressionJonathan Chou1,2, Jeffrey H. Lin1,4, Audrey Brenot1,4, Jung-whan Kim1,5, Sylvain Provot1,3 and Zena Werb1,2,6
Despite advances in our understanding of breast cancer, patients with metastatic disease have poor prognoses. GATA3 is atranscription factor that specifies and maintains mammary luminal epithelial cell fate, and its expression is lost in breast cancer,correlating with a worse prognosis in human patients. Here, we show that GATA3 promotes differentiation, suppresses metastasisand alters the tumour microenvironment in breast cancer by inducing microRNA-29b (miR-29b) expression. Accordingly,miR-29b is enriched in luminal breast cancers and loss of miR-29b, even in GATA3-expressing cells, increases metastasis andpromotes a mesenchymal phenotype. Mechanistically, miR-29b inhibits metastasis by targeting a network of pro-metastaticregulators involved in angiogenesis, collagen remodelling and proteolysis, including VEGFA, ANGPTL4, PDGF, LOX and MMP9,and targeting ITGA6, ITGB1 and TGFB, thereby indirectly affecting differentiation and epithelial plasticity. The discovery that aGATA3-miR-29b axis regulates the tumour microenvironment and inhibits metastasis opens up possibilities for therapeuticintervention in breast cancer.
One of the classical hallmarks of cancer is the ability for tumour cellsto invade and metastasize1. Metastasis is a multi-stage process thatincludes extracellular matrix remodelling, blood vessel recruitment,tumour cell entry and exit from circulation, and survival at a distantorgan2. The tumourmicroenvironment is increasingly recognized as animportant contributor to malignant progression and metastasis3,4. Inaddition to remodelling the microenvironment to facilitate metastasis,cancer cells also turn on embryonic morphogenesis regulators toundergo the epithelial-to-mesenchymal transition (EMT) and turnoff differentiation programs5, allowing cancer cells to gain motility,modify cell adhesion and acquire stem-like properties6.In contrast to EMT, differentiation is associated with less aggressive
tumours and better prognosis. GATA3 is a transcription factor thatspecifies and maintains luminal epithelial cell differentiation in themammary gland7–9. Loss of GATA3 is involved in breast cancerpathogenesis8–10 and a low GATA3 level is associated with poorprognosis11–13. Mutations in GATA3 that diminish or abolish itsDNA-binding ability are commonly found in human breast cancers,and GATA3 was recently found to be one of three genes mutatedin >10% of all breast cancers14,15. In several mouse models ofbreast cancer, Gata3 expression inversely correlates with tumour
1Department of Anatomy, University of California, San Francisco, San Francisco, California 94143-0452, USA. 2Biomedical Sciences Program, University of California,San Francisco, San Francisco, California 94143-0452, USA. 3INSERM U606, Université Paris 7, Hôpital Lariboisière, 75010 Paris, France. 4These authorscontributed equally to this work. 5Present address: Salk Institute for Biological Studies, La Jolla, California 92037, USA.6Correspondence should be addressed to Z.W. (e-mail: [email protected])
Received 24 September 2012; accepted 10 December 2012; published online 27 January 2013; DOI: 10.1038/ncb2672
progression and metastasis: loss of GATA3 coincides with loss ofdifferentiation, the transition from adenoma to carcinoma and theonset of tumour dissemination. Reintroduction of Gata3 into MMTV-PyMT carcinomas induces differentiation, suppresses dissemination10
and reduces tumour-initiating capacity16. However, how GATA3induces tumour differentiation and inhibits dissemination, and whatmolecular and cellular events lie downstreamofGATA3 are unknown.MicroRNAs (miRNAs) are small, non-coding RNAs that modulate
gene expression post-transcriptionally, either by inhibiting translationor by causing degradation through binding to the 3′ untranslatedregions (UTRs) of target messenger RNAs (ref. 17). miRNAs areboth positive and negative regulators of cancer metastasis18–20.Precedence for GATA-mediated miRNA regulation has recently beenestablished: GATA1 promotes erythrocyte differentiation throughmiR-451, suggesting that GATA factors use miRNAs to make cell fatedecisions21. In the mammary gland, miRNAs such as let-7 promotemammary differentiation and regulate self-renewal22,23. However,miRNAs downstream of GATA3 have yet to be investigated.In this study, we predicted that GATA3 coordinates gene
expression networks involved in metastasis through miRNA-mediatedmechanisms.We investigated themolecular pathways by whichGATA3
NATURE CELL BIOLOGY VOLUME 15 | NUMBER 2 | FEBRUARY 2013 201
regulates differentiation and metastasis, and identified miR-29b,a miRNA downstream of GATA3 that modulates the tumourmicroenvironment, metastasis and epithelial plasticity.
RESULTSGATA3 suppresses lung metastases from human and mousebreast cancerHuman breast cancers are classified into several subtypes that areprognostic of outcome24. Clinically, basal, triple-negative breast cancersaremore aggressive and poorly differentiated25. In human breast cancerlines26, GATA3 is expressed at a higher level in luminal versus basal Aand basal B subtypes (Fig. 1a), consistent with its luminal localization(Supplementary Fig. S1a).We overexpressed mouse Gata3 in basal 4T1 cells to evaluate
metastasis in an immunocompetent model, and human GATA3 inbasal MDA-MB-231 cells (referred to as MDA231), lines with lowendogenous GATA3 (Fig. 1b and Supplementary Figs S1b,c and S2a,b).Orthotopic transplant of stably transduced 4T1-Gata3 cells into BALB/cmice gave rise to tumours similar in size to 4T1-Control cells, butshowed a significant decrease in the number and size of spontaneouslung metastases (Fig. 1c–f). Interestingly, whereas primary 4T1-Gata3tumours expressed GATA3, the lung metastases were mostly GATA3-low (Fig. 1g and Supplementary Fig. S1d), suggesting that metastaticcells lost GATA3 expression. We did not observe any difference inproliferation in vivo or in culture (Supplementary Fig. S1e,f), suggestingthat GATA3 causes no intrinsic defects on viability, and that the differ-ence in metastasis depends on in vivomicroenvironment interactions.Indeed, 4T1-Gata3 tumours exhibited significant decreases in tumourvasculature and macrophage infiltrates (Fig. 1h,i). Consistent with this,we found a twofold reduction in serum VEGF-A levels in mice bearingorthotopic 4T1-Gata3 primary tumours (Supplementary Fig. S1g),suggesting that GATA3 regulates VEGF-A in vivo.Human MDA231-GATA3 cells injected into nude mice formed
smaller tumours than MDA231-Control cells, with decreased tumourvasculature and macrophage infiltrates and secreted less VEGF-A(Supplementary Fig. S2c–g). MDA231-GATA3 cells showed nodifference in proliferation in culture or in viable tumour areas, butexpressed higher levels of apoptotic markers and exhibited morenecrosis in vivo (Supplementary Fig. S2h–k). These data supportthe concept that microenvironment interactions are critical forGATA3-mediated metastasis inhibition.We next examined whether GATA3 only limits the ability of
tumour cells to disseminate from the primary site, or if it alsoaffects the later stages of metastasis, for example, colonization.Accordingly, we inoculated the cells directly into the circulationby intravenous (i.v.) injection (through the tail vein) to formexperimental metastases. For both 4T1 and MDA231 cells, GATA3decreased lung metastases (Fig. 1j and Supplementary Fig. S2l). Wevalidated that these experimental metastases maintained GATA3overexpression (Fig. 1k). Thus, sustained GATA3 expression alsoinhibits the late steps of metastasis.To determine whether GATA3-expressing cells can compete with
control cells, we labelled 4T1 cells with RFP (control) or Gata3–GFP,mixed them in a 1:1 ratio, and co-injected them i.v. After 2 weeks, wefound that 4T1-Gata3–GFP cells accounted for only∼20% of the totalmetastatic cells in the lung, whereas 4T1-RFP cells accounted for∼80%
(Fig. 1l). These results indicate that GATA3 confers a competitivedisadvantage in vivo.
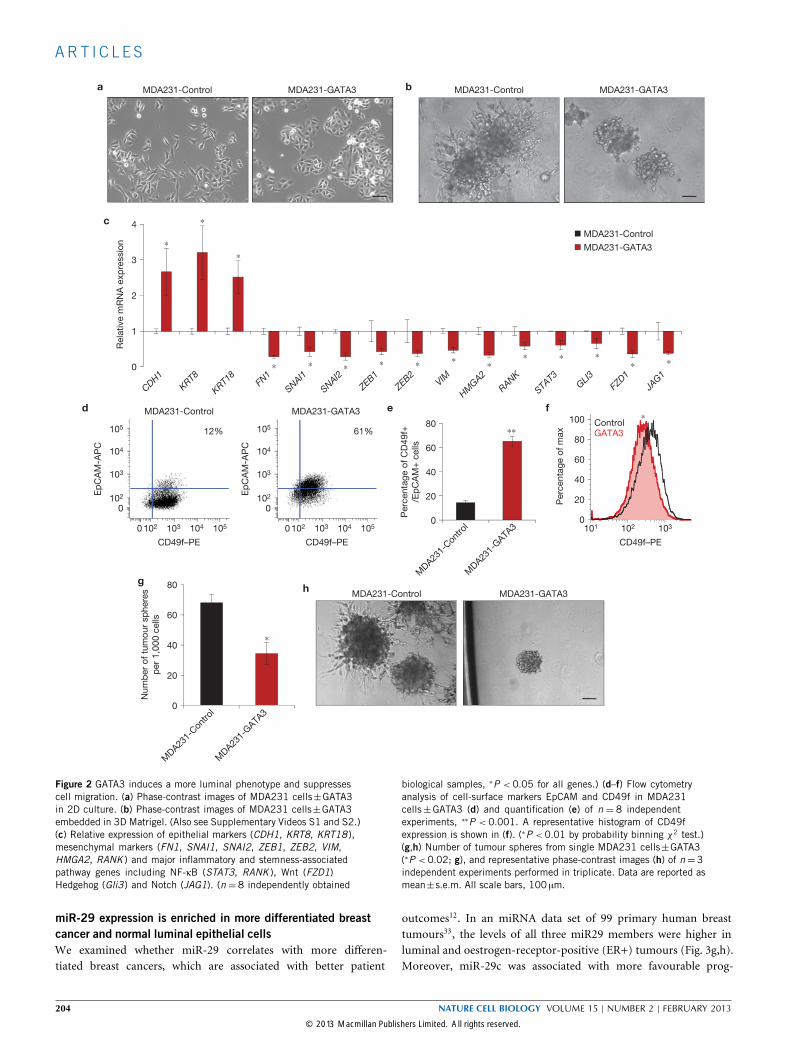
GATA3 promotes differentiation and limits cell migrationAs GATA3 regulates luminal fate, we sought to determine whetherGATA3-mediated metastasis suppression involves cell differentiation.In two-dimensional cell culture, MDA231-Control cells had a morespindle-shaped, mesenchymal morphology, whereas MDA231-GATA3cells exhibited a more epithelial phenotype (Fig. 2a). In a wound-scratch assay, MDA231-Control cells migrated as single cells toclose the wound, whereas MDA231-GATA3 cells migrated as acollective sheet (Supplementary Fig. S3a). In three-dimensional (3D)Matrigel culture, which better mimics physiological conditions27,28,GATA3-overexpressing MDA231 and Hs578T human basal cells wereless invasive than their controls (Fig. 2b and Supplementary Fig. S3b–dand Videos S1 and S2).Using quantitative PCR (qPCR), we found that GATA3 increased
the level of expression of luminal genes and decreased the level ofexpression of basal, EMT, stemness and inflammatory genes (Fig. 2cand Supplementary Fig. S3e,f). Despite these gene expression changes,4T1-Gata3 cells were morphologically similar to 4T1-Control cells(Supplementary Fig. S3g). GATA3 also induced basal cells to adopt aluminal cell surface phenotype characterized by decreased CD49f (inte-grin α6) and increased EpCAM expression29 (Fig. 2d–f). Furthermore,MDA231-GATA3 and 4T1-Gata3 cells formed fewer, smaller and lessinvasive tumour spheres from single cells (Fig. 2g,h and SupplementaryFig. S3h). Taken together, these results indicate that GATA3 promotesa luminal differentiation program and opposes the basal/EMT state.
GATA3 promotes miR-29b expressionIn addition to the cell-intrinsic effects of GATA3 on differentiation,we were intrigued by the observation that GATA3-expressing tumourshad reduced serum VEGF-A and tumour vasculature. However, theVEGFA promoter lacked clear GATA3-binding sites, and GATA3did not decrease the activity of a luciferase reporter containing theVEGFA promoter (Supplementary Fig. S3i). We therefore reasonedthat GATA3 regulates VEGFA and perhaps other pro-metastatic genesindirectly through miRNAs and conducted a screen in MDA231cells±GATA3 using qPCR miRNA arrays. Of 88 miRNAs evaluated,miR-29b was the most upregulated miRNA in MDA231-GATA3 cells(Fig. 3a,b and Supplementary Table S1), and the expression level ofmiR-29b was also increased in Hs578T-GATA3 cells (SupplementaryFig. S4a). The miR-29 family consists of three members with the sameseed sequence: miR-29a, miR-29b and miR-29c (Supplementary Fig.S4b). We also found that miR-29a and miR-29c were increased byGATA3 (Supplementary Fig. S4c), withmiR-29a being∼400-foldmoreabundant than miR-29c at basal levels.The miR29a/b1 promoter, which was previously identified30,
contains three GATA3-binding sites (Supplementary Fig. S4d).GATA3 increased the activity of the miR29a/b1-promoter reporter(Fig. 3c), and deleting the GATA sites diminished GATA3-mediatedreporter induction, demonstrating that these sites are necessaryand functional (Fig. 3d).As previous studies showed that miR-29b is negatively regulated
by TGF-β and NF-κB (refs 30–32) we also examined whether GATA3inhibits the TGF-β and NF-κB pathways, thereby regulating miR-29b
202 NATURE CELL BIOLOGY VOLUME 15 | NUMBER 2 | FEBRUARY 2013
Figure 1 GATA3 suppresses spontaneous and experimental breastcancer metastases to the lungs. (a) GATA3 expression levels from basalA, basal B and luminal breast cancer cell lines. Microarray data set isadapted from ref. 25. ∗∗ one-way analysis of variance P <0.001. (b)Relative Gata3 levels in 4T1 cells±Gata3 measured by qPCR (n =8independently obtained biological samples, ∗∗P <0.001). (c–g) BALB/cmice were injected with 4T1 cells±Gata3 into the inguinal mammaryfat pad. Tumours were allowed to grow for three weeks and measured (c)and immunohistochemical staining for GATA3 in primary tumours wasperformed (d). The lungs were collected and examined for metastases(e). (n =12 independent mice per group, ∗P <0.01.) RepresentativeH&E images (f) and immunohistochemical staining for GATA3 (g) inlung metastases are shown. (h,i) CD31 immunohistochemical meanintensity (h) and F4/80 immunohistochemical mean intensity (i) in
primary 4T1±Gata3 tumours. (Values derived from n=8 independenttumours per group, and 10 random fields per tumour.) Representativeimages are shown below the graphs (∗P < 0.05). (j) BALB/c micewere injected i.v. with 4T1 cells±Gata3. Bioluminescence imagingwas performed on day 14 post-injection and mice were euthanizedimmediately after imaging (n = 10 independent mice per group).(k) GATA3 immunohistochemical staining of 4T1±Gata3 experimentali.v. injected lung metastases. (l) BALB/c mice were co-injected i.v. 1:1with control cells labelled with RFP (4T1-RFP) and Gata3-expressingcells labelled in GFP (4T1-Gata3–GFP). Mice were euthanized on day12 post-injection and the percentages of RFP- and GFP-positive cellswere determined by flow cytometry (n = 12 independent mice pergroup; ∗∗P <0.002, paired t -test). Data are reported as mean±s.e.m.Scale bars, 200 µm (d,f,g,k) and 100 µm (h,i).
indirectly. Indeed, GATA3 inhibited TGF-β and NF-κB reporteractivities and suppressed TGF-β-induced EMT and components ofthe TGF-β pathway transcriptionally (Fig. 3e,f and SupplementaryFig. S4e–g). Stimulation with recombinant TGF-β, TNF-α or sRANKL
decreasedmiR-29a andmiR-29b levels in control, but not GATA3, cells(Supplementary Fig. S4h,i). Thus, GATA3 inducesmiR-29b expressiondirectly (by binding the GATA sites on the promoter) and indirectly(by inhibiting the TGF-β and NF-κB pathways).
NATURE CELL BIOLOGY VOLUME 15 | NUMBER 2 | FEBRUARY 2013 203
Figure 2 GATA3 induces a more luminal phenotype and suppressescell migration. (a) Phase-contrast images of MDA231 cells±GATA3in 2D culture. (b) Phase-contrast images of MDA231 cells±GATA3embedded in 3D Matrigel. (Also see Supplementary Videos S1 and S2.)(c) Relative expression of epithelial markers (CDH1, KRT8, KRT18 ),mesenchymal markers (FN1, SNAI1, SNAI2, ZEB1, ZEB2, VIM,HMGA2, RANK ) and major inflammatory and stemness-associatedpathway genes including NF-κB (STAT3, RANK ), Wnt (FZD1)Hedgehog (Gli3) and Notch (JAG1). (n = 8 independently obtained
biological samples, ∗P < 0.05 for all genes.) (d–f) Flow cytometryanalysis of cell-surface markers EpCAM and CD49f in MDA231cells±GATA3 (d) and quantification (e) of n = 8 independentexperiments, ∗∗P < 0.001. A representative histogram of CD49fexpression is shown in (f). (∗P <0.01 by probability binning χ2 test.)(g,h) Number of tumour spheres from single MDA231 cells±GATA3(∗P <0.02; g), and representative phase-contrast images (h) of n =3independent experiments performed in triplicate. Data are reported asmean±s.e.m. All scale bars, 100 µm.
miR-29 expression is enriched in more differentiated breastcancer and normal luminal epithelial cellsWe examined whether miR-29 correlates with more differen-tiated breast cancers, which are associated with better patient
outcomes12. In an miRNA data set of 99 primary human breasttumours33, the levels of all three miR29 members were higher inluminal and oestrogen-receptor-positive (ER+) tumours (Fig. 3g,h).Moreover, miR-29c was associated with more favourable prog-
204 NATURE CELL BIOLOGY VOLUME 15 | NUMBER 2 | FEBRUARY 2013
Figure 3 miR-29b is induced by GATA3, enriched in luminal, goodprognostic breast cancers, and associated with reduced metastatic potential.(a,b) Eighty-eight miRNAs were screened using qPCR miRNA arrays inMDA231 cells±GATA3 (a) and miR-29b expression was further validatedby TaqMan qPCR (b). (n = 8 independently obtained biological samples,∗P <0.05.) (c) MDA231 cells were co-transfected with an miR-29a/b1–Lucreporter and pcDNA-EGFP (control) or increasing amounts of pcDNA-GATA3.Firefly luciferase was normalized to Renilla luciferase and plotted relativeto the control. (n = 5 independent experiments performed in triplicate,∗P < 0.05.) (d) MDA231 cells were co-transfected with pcDNA-eGFP orpcDNA- GATA3 and the miR-29a/b1–Luc reporters containing GATA sitedeletions. The non-mutated (WT) reporter was used as the control. Fireflyluciferase was normalized to Renilla luciferase and plotted relative to thecontrol. (n=3 independent experiments performed in triplicate, ∗P <0.05.)(e,f) Relative TGF-β–Luc reporter activity (e) and NFκB–Luc reporteractivity (f) in MDA231 cells±GATA3, with and without TGF-β1, sRANKL or
TNF-α stimulation. (n=5 independent experiments performed in triplicate,∗P <0.05.) (g,h) Relative miR-29a, miR-29b and miR-29c expression inprimary human basal-like, HER2, luminal A and luminal B breast cancers(g), and in primary human oestrogen-receptor (ER)-positive and negativetumours (h). Microarray data set is adapted from ref. 32. (n =93 primarybreast tumour samples, ∗ Kruskal–Wallis test statistic, P <0.05.) (i) RelativemiR-29a, miR-29b and miR-29c expression in primary mouse basal andluminal breast cancers. Microarray data set is adapted from ref. 36. (n=41primary tumours from individual mice and 5 normal mammary glands,∗∗∗P <0.001.) (j) Relative miR-29b expression in 67NR, 168FARN, 4TO7and 4T1 cells, with metastatic capability shown below. Microarray dataset adapted from ref. 37. (k) Relative Gata3 and miR-29b expression inprimary normal mammary epithelial cells, adenoma and carcinoma cellsfrom MMTV-PyMT mice, with metastatic capability shown below. (n = 6independently obtained biological samples per group, ∗P <0.05.) Data arereported as mean±s.e.m.
noses in a meta-analysis of over 1,000 breast cancers34 and withluminal differentiation in an independent data set of over 100human breast tumours35.
We then used a miRNA data set of mouse breast tumours36
and found that miR-29 members were expressed at higher levelsin luminal when compared with basal models (Fig. 3i). In normal
NATURE CELL BIOLOGY VOLUME 15 | NUMBER 2 | FEBRUARY 2013 205
epithelial cells isolated from the mouse mammary gland, all miR-29members were expressed at higher levels in the luminal fraction(Supplementary Fig. S5a–c).
We next examined whethermiR-29b is inversely related tometastaticability. Using a data set of syngeneic cell lines with varying metastaticcapabilities37,38, we found that expression of miR-29b was lowest incells with the highest metastatic capacities (Fig. 3j and SupplementaryFig. S5d). In the MMTV-PyMT model, which mimics progressivestages of human luminal breast cancer39, adenoma and carcinoma cellshad decreased Gata3 and miR-29b expression levels compared withnormal epithelium (Fig. 3k), with the lowest levels at the carcinomastage coinciding with metastasis. Together, these results demonstratethat miR-29 expression correlates with more favourable outcomes,more differentiated phenotypes in normal and cancer cells andreduced metastatic potential.
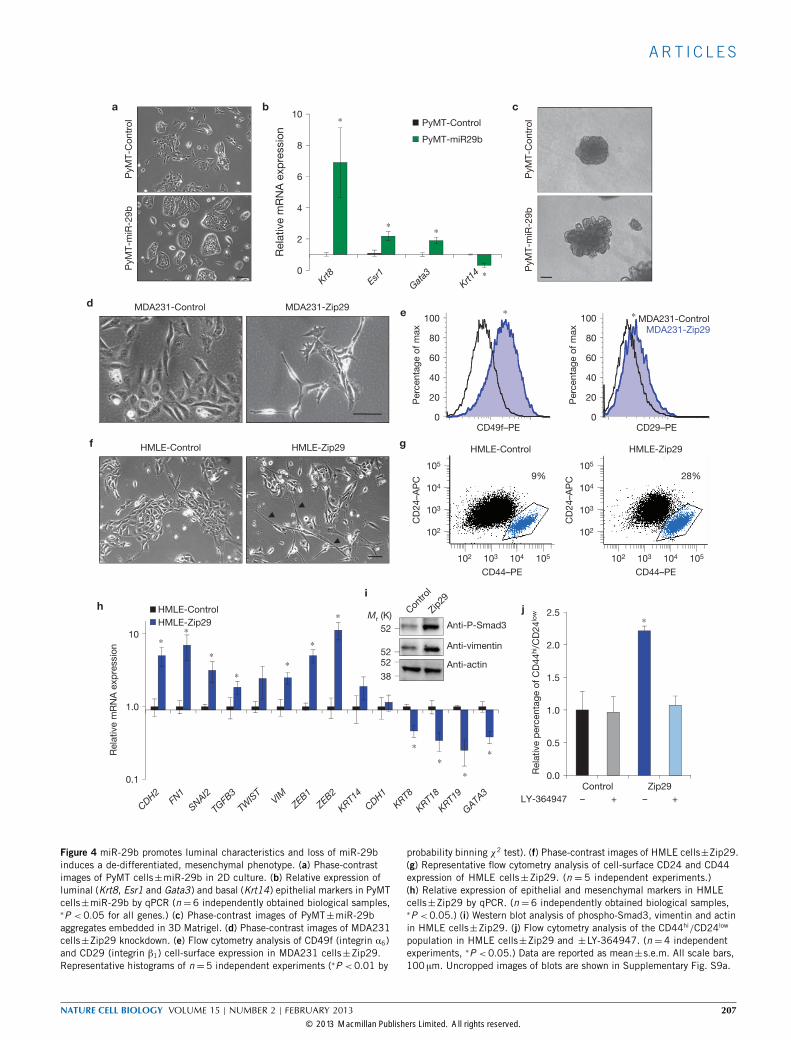
miR-29b promotes and maintains luminal differentiationWe next examined whether miR-29b promotes luminal characteristics.MMTV-PyMT tumours become less differentiated during tumourprogression39. Stable overexpression of miR-29b in a primary cell linederived from a late-stage MMTV-PyMT carcinoma resulted in a moreepithelial phenotype, higher luminal marker and lower basal markerexpression levels (Fig. 4a,b). In addition, miR-29b promoted branchingof PyMT cell aggregates in 3D Matrigel (Fig. 4c), a feature of normalbranching morphogenesis40.We then examined whether loss of miR-29b induces a de-
differentiated, mesenchymal phenotype. We generated miR-29b-knockdown cells using miR-Zip29b lentiviruses, which stablyknockdown endogenous miRNAs. Although miR-29b levels decreasedas expected, we also observed decreases in miR-29a and miR-29c levels,probably owing to their similar sequences (Supplementary Fig. S6a,d).MDA231-Zip29 cells were more elongated, protrusive and spindle-like,expressed lower GATA3 and had increased levels of CD49f and CD29(Fig. 4d,e and Supplementary Fig. S6b), two markers of the basal/stemcell population that have miR-29b-binding sites. Loss of miR-29b inmouse 4TO7 cells also caused a spindle-like morphology and increasedmesenchymalmarker levels (Supplementary Fig. S6c,d).We extended our findings to normal humanmammary cells (HMLE),
which exhibit phenotypic plasticity in vitro6. HMLE-Zip29 cells weremore elongated and spindle-like and had increased mesenchymal anddecreased epithelial marker expression levels. The EMT program haspreviously been linked to stem-like traits6. Loss of miR-29b increasedthe CD44hi/CD24low stem-cell-enriched compartment and increasedthe level of stem cell marker expression (Fig. 4f–i and SupplementaryFig. S6e,f). Loss of miR-29 also increased basal/stem cell markers inPyMT and 4T1 cells (Supplementary Fig. S6g–j).HMLE-Zip29 cells had higher basal levels of phospho-Smad3
(Fig. 4i), suggesting that miR-29b knockdown increases uncheckedTGF-β signalling, which promotes EMT. Consistent with this,inhibiting TGF-β signalling using LY-364947 in HMLE-Zip29 cellsreversed the increased CD44hi/CD24low population (Fig. 4j). Takentogether, these results indicate that miR-29b promotes differentiation,and loss of miR-29b causes de-differentiation and increases the level ofmesenchymal marker expression characteristic of a progenitor-likestate, which is mediated, at least in part, by an increased levelof TGF-β signalling.
miR-29b downregulates pro-metastatic genes that modifythe tumour microenvironment and indirectly regulateepithelial plasticityWe used prediction algorithms to generate a list of candidate miR-29btargets41–43. Although transcription factors associated with EMT (forexample, SNAI1, TWIST or ZEB1) did not have miR-29b-binding sitesin their 3′ UTRs,TGFB, a potent inducer of EMT and de-differentiationcontainedmiR-29b-binding sites (Fig. 5a). In addition, ITGA6 (CD49f)and ITGB1 (CD29), which maintain and enhance stemness44 and arecommonly used markers to identify the basal population, containedmiR-29b-binding sites in their 3′ UTRs. Interestingly, we identifiedmiR-29b sites in many microenvironmental genes involved inangiogenesis, collagen remodelling and matrix degradation, includingANGPTL4, LOX,MMP2,MMP9, PDGF and VEGF (Fig. 5a), whichhave been implicated in promoting metastasis4,45. To determinewhether miR-29b modulates these genes directly, we cloned these 3′
UTRs into luciferase reporters and co-transfected them with eithermiR-29b or control mimic. For all 3′ UTRs tested, miR-29b decreasedluciferase activity by 40–80% (Fig. 5b), which was partially relievedwhen the miR-29b sites were mutated (Fig. 5c), indicating that thesesites are functional and specific for miR-29b.We stably transduced 4T1 and MDA231 cells with miR-29b and
confirmed its overexpression (Fig. 5d). In both 4T1 and MDA231cells, miR-29b repressed endogenous mRNA levels of target genes(Fig. 5e and Supplementary Fig. S7a,b). We validated a subset oftargets at the protein level by western blot and cell surface staining,and found that miR-29b decreased the levels of ANGPTL4, ITGA6(CD49f), LOX and VEGF-A (Fig. 5f,g). These results suggest thatmiR-29b downregulates a cohort of pro-metastatic genes involved indifferentiation andmodifying the tumourmicroenvironment.
miR-29b expression suppresses lung metastasisTo determine whether miR-29b suppresses metastasis, we injectedmice with 4T1-Control or 4T1-miR-29b cells orthotopically. Althoughthere was no difference in primary tumour size, 4T1-miR-29b tumourshad significantly fewer blood vessels and a decreased level of fibrillarcollagen (Fig. 6a–c). Importantly, mice with 4T1-miR-29b tumourshad fewer and smaller metastases (Fig. 6d). miR-29b also significantlyreduced the size and number of experimental lung metastases in both4T1 andMDA231 cells (Fig. 6e and Supplementary Fig. S7c–e).As miR-29b levels decrease during tumour progression in MMTV-
PyMT mice, we examined whether any miR-29b targets increasein parallel. In carcinomas, where miR-29b levels were lowest, theexpression level of manymiR-29b targets increased (Fig. 6f). Moreover,PyMT-miR-29b cells showed decreased target expression levels(Supplementary Fig. S7f–h) and significantly reduced lung metastasis(Fig. 6g,h). Conversely, loss of miR-29b in PyMT, 4T1 and MDA231cells increased spontaneous and experimental lung metastases andEMT markers in vivo (Fig. 6i,j and Supplementary Fig. S8a–f). Takentogether, these results show that miR-29b functions as a metastasissuppressor in human andmousemodels of breast cancer.
miR-29b suppresses metastasis by repressingmicroenvironmental targetsTo gain further insight into how miR-29b suppresses metastasis, weexamined whether the levels of miR-29b targets increase after miR-29
206 NATURE CELL BIOLOGY VOLUME 15 | NUMBER 2 | FEBRUARY 2013
Figure 4 miR-29b promotes luminal characteristics and loss of miR-29binduces a de-differentiated, mesenchymal phenotype. (a) Phase-contrastimages of PyMT cells±miR-29b in 2D culture. (b) Relative expression ofluminal (Krt8, Esr1 and Gata3) and basal (Krt14) epithelial markers in PyMTcells±miR-29b by qPCR (n=6 independently obtained biological samples,∗P < 0.05 for all genes.) (c) Phase-contrast images of PyMT±miR-29baggregates embedded in 3D Matrigel. (d) Phase-contrast images of MDA231cells±Zip29 knockdown. (e) Flow cytometry analysis of CD49f (integrin α6)and CD29 (integrin β1) cell-surface expression in MDA231 cells±Zip29.Representative histograms of n=5 independent experiments (∗P <0.01 by
probability binning χ2 test). (f) Phase-contrast images of HMLE cells±Zip29.(g) Representative flow cytometry analysis of cell-surface CD24 and CD44expression of HMLE cells±Zip29. (n = 5 independent experiments.)(h) Relative expression of epithelial and mesenchymal markers in HMLEcells±Zip29 by qPCR. (n =6 independently obtained biological samples,∗P <0.05.) (i) Western blot analysis of phospho-Smad3, vimentin and actinin HMLE cells±Zip29. (j) Flow cytometry analysis of the CD44hi/CD24low
population in HMLE cells±Zip29 and ±LY-364947. (n =4 independentexperiments, ∗P <0.05.) Data are reported as mean±s.e.m. All scale bars,100 µm. Uncropped images of blots are shown in Supplementary Fig. S9a.
Figure 5 miR-29b targets pro-metastatic genes involved in remodelling thetumour microenvironment and tumour differentiation. (a) Computationallypredicted interactions between miR-29b and the 3′ UTRs of severalmRNAs involved in differentiation, EMT, angiogenesis, ECM crosslinkingand ECM proteolysis. The miR-29b seed sequence is in red and thecomplementary binding sites are in green. The mutations generated withinthe 3′ UTRs for c are in purple. (b,c) The wild-type (b) and mutant (c) 3′
UTRs of the indicated miR-29b targets were cloned into dual luciferasereporters and co-transfected with miR-29b or cel-67 control mimic. Renilla
luciferase activity was measured 48h post-transfection and normalized tofirefly luciferase (n = 5 independent experiments performed in triplicate,∗P <0.05). (d,e) Relative miR-29b expression (d) and mRNA expressionof indicated miR-29b targets (e) in stably transduced 4T1 cells±miR-29b(n=8 independently obtained biological samples, ∗P <0.05.) (f,g) Westernblot (f) and flow cytometer analysis (g) of 4T1 cells±miR-29b for ANGPTL4,LOX, VEGF-A and ITGA6 (CD49f). (∗P <0.01 by probability binning χ2 test).Data are reported as mean±s.e.m. Uncropped images of blots are shown inSupplementary Fig. S9b.
Figure 6 miR-29b inhibits lung metastasis and loss of miR-29b increaseslung metastasis. (a) BALB/c mice were injected with 4T1 cells±miR-29binto the mammary fat pad to form primary orthotopic tumours. Tumourswere allowed to grow for three weeks and measured (n =8 independentmice per group). (b,c) Representative images of 4T1±miR-29b primaryorthotopic tumours stained for CD31 to evaluate tumour vasculature (b)or picrosirius red to evaluate fibrillar collagen (c). (d) Representative H&Eimages of lung metastases frommice injected with primary 4T1±miR-29btumours. (e) BALB/c mice were injected i.v. with 4T1 cells±miR-29band bioluminescence imaging was performed on day 14 post-injection.Mice were euthanized immediately after imaging (n = 10 independentmice per group.) Representative H&E images of the lung metastases
are shown below. (f) Relative expression of miR-29b targets in primarynormal mammary epithelial cells and primary MMTV-PyMT adenomaand carcinoma cells measured by qPCR (n = 6 independently obtainedbiological samples, ∗P <0.05). (g,h) FVB/n mice were injected i.v. withPyMT cells±miR-29b, and euthanized at six weeks. A representative set ofgross lungs (g) and H&E images of the lung metastases (h) are shown (n=8independent mice per group). (i,j) FVB/n mice were injected i.v. with PyMTcells±Zip29 to knockdown endogenous miR-29b, and bioluminescentimaging was performed on week three (i). The graph depicts the numberof surface lung metastases per lung lobe (j; n =8 independent mice pergroup, ∗P <0.05). Data are reported as mean±s.e.m. Scale bars, 100 µm(b–d), 200 µm (e), 1 cm (g) and 1mm (h).
Figure 7 miR-29b knockdown increases the level of expression ofits target genes and miR-29b suppresses metastasis by repressingfour microenvironmental targets. (a) Relative expression of miR-29btargets in Zip29-knockdown cells by qPCR (n = 5 independentlyobtained biological samples, ∗P <0.05). (b) The 3′UTR reporters of theindicated miR-29b targets were co-transfected with anti-miR-29b orcontrol inhibitor into HEK293T cells. (n =3 independent experiments
performed in triplicate, ∗P < 0.05.) (c,d) BALB/c mice were injectedi.v. with 4T1 cells±miR-29b re-expressing ANGPTL4, LOX, MMP9or VEGF-A, and euthanized at two weeks. Representative fluorescencemicrographs of lungs were taken on a dissection microscope (c) andGFP fluorescence intensity was quantified (d). (n=8 independent miceper group, ∗P <0.01.) Data are reported as mean±s.e.m.Scale bar, 1mm.
knockdown. Many miR-29b targets we identified were upregulatedafter miR-29 loss, including ANGPTL4, LOX,MMP9, VEGFA, ITGA6and ITGB1 (Figs 7a and 4e). Moreover, miR-29 knockdown increasedthe level of 3′ UTR luciferase reporters of miR-29b targets (Fig. 7b),further validating these as bona fide targets.We examined whether restoring the expression of four miR-29b
targets, with known roles in angiogenesis and ECM remodelling,would increase metastasis. miR-29b alone inhibited metastasis, andre-expression of ANGPTL4, LOX, MMP9 or VEGF-A in 4T1-miR-29b cells restored lung metastasis (Fig. 7c,d), indicating that
miR-29b suppresses metastasis, at least in part, by regulating thesemicroenvironmental genes.
Regulation of miR-29b mediates the ability of GATA3 tosuppress metastasis and promote differentiationTo determine whether GATA3-mediated metastasis suppression anddifferentiation requires miR-29b, we knocked down miR-29b inMDA231-GATA3 cells. GATA3 overexpression promoted epithelialclustering, and concomitant loss of miR-29b abrogated the effects ofGATA3, resulting in elongated, spindle-like cells (Fig. 8a). Similarly,
210 NATURE CELL BIOLOGY VOLUME 15 | NUMBER 2 | FEBRUARY 2013
Figure 8 miR-29b is an important downstream target of GATA3 thatmediates its ability to promote luminal differentiation and suppressmetastasis. (a) Phase-contrast images of MDA231 cells±GATA3±Zip29.(b) Relative expression of miR-29b targets ANGPTL4, LOX, MMP9,PDGFC and VEGFA in MDA231 cells±GATA3±Zip29 by qPCR (n = 6independently obtained biological samples, ∗P < 0.05). (c) The 3′UTRreporters of the indicated miR-29b targets were transfected into MDA231cells±GATA3±Zip29 and the luciferase activity was measured. (n = 3independent experiments performed in triplicate.) (d) Bioluminescentimaging of mice injected i.v. with MDA231 cells±GATA3±Zip29at fourweeks post-injection (n = 8 independent mice per group). (e,f) BALB/c
mice were injected with 4T1 cells±Gata3±Zip29 into the mammary fatpad. Tumours were allowed to grow for four weeks and lungs were examinedfor spontaneous metastases (e). Representative H&E images are shown (f).(n =10 independent mice per group, ∗P <0.05.) (g,h) BALB/c mice wereinjected i.v. with 4T1 cells±Gata3±Zip29 knockdown and euthanized twoweeks post injection. The number of lung surface metastases was quantified(g) and immunofluorescence staining was performed for E-cadherin (green)and vimentin (red; h; n =8 independent mice per group, ∗∗P <0.01). (i)Proposed model of how GATA3 promotes differentiation and suppressesbreast cancer metastasis through regulation of miR-29b. Data are reportedas mean±s.e.m. Scale bars, 100 µm (a), 200 µm (f) and 50 µm (h).
loss of miR-29 in T47D luminal breast cancer cells, which highlyexpress endogenous GATA3, caused a mesenchymal morphologyaccompanied by an increase in the levels of EMT markers and targetexpression (Supplementary Fig. S8g–i). Thus, tumour cells acquiremesenchymal characteristics in the absence of miR-29b, even with highlevels of GATA3 expression.We examined whether GATA3 downregulated miR-29b targets, and
found that the levels of expression and 3′ UTR reporters of miR-29btargets, including ANGPTL4, LOX,MMP9 andVEGFA, were decreasedby GATA3; this inhibition was partially reversed in GATA3-Zip29 cells(Fig. 8b,c). Significantly, we found that miR-29 knockdown reversedGATA3-mediated suppression of experimental and spontaneousmetastases and increased the vimentin expression level (Fig. 8d–hand Supplementary Fig. S8j), indicating that perturbation of miR-29battenuates the anti-metastatic and pro-differentiation functions ofGATA3. Together, our results demonstrate that miR-29b is animportant node downstream of GATA3 that controls differentiationand the expression of pro-metastatic genes involved in modifyingthe tumour microenvironment, ultimately leading to metastasissuppression (Fig. 8i).
DISCUSSIONIn this study, we show that GATA3 promotes luminal differentiationand suppresses lung metastasis through miR-29b, an anti-metastaticmicroRNA that promotes differentiation and regulates the tumourmicroenvironment (Fig. 8g). We demonstrate that GATA3 increasesthe level of expression of miR-29b, which is exquisitely positionedto inhibit several steps required for metastasis: a network of mRNAsinvolved in stemness/EMT, angiogenesis, proteolysis, ECM signallingand ECM remodelling have miR-29b-binding sites and are bonafide miR-29b targets. Although we did not find miR-29b sites inclassical EMT-promoting transcription factors, ITGA6 (CD49f) andITGB1 (CD29), markers of the basal/stem cell population previouslyimplicated in maintaining and enhancing stemness44, and TGFB2 andTGFB3, all had miR-29b-binding sites. As miRNAs act pleiotropicallyand modulate a range of biological processes, they represent anideal set of targets through which transcription factors such asGATA3 can operate.The loss of GATA3 triggers fibroblastic transformation and cell
invasion46, and coincides with the onset of angiogenesis, inflammatorycell recruitment, and dissemination10. It has been shown that GATA3reduces tumour vasculature and macrophage infiltrates, componentsof the tumour microenvironment that promote metastasis16,47. Inhuman breast cancer, GATA3 correlates with higher E-cadherin andER expression levels13. These observations suggest that promotingdifferentiation in primary tumours limits metastasis by both non-cell-autonomous mechanisms (for example, angiogenesis, inflammation,ECM remodelling) and cell-autonomous mechanisms (for example,increased cell adhesion).In breast cancer, the level of miR-29b expression is highest
in good prognostic, well-differentiated, luminal-type cancers andinhibits metastasis, the main cause of cancer-related deaths. miR-29b promoted luminal differentiation; conversely, loss of miR-29bpromoted mesenchymal traits and metastasis. Concomitant lossof miR-29b in GATA3-expressing cells restored metastasis andabrogated the ability of GATA3 to promote differentiation, indicating
that miR-29b is an important node that exerts its anti-metastaticeffects by cell-intrinsic and cell-extrinsic mechanisms. We found thatmiR-29b-mediated metastasis inhibition depended on repression ofits targets. Of these, ANGPTL4 affects lung seeding by disruptingendothelial cell junctions45; LOX increases tissue fibrosis and integrin-mediated survival signalling48; MMP9 remodels the ECM and releasessequestered VEGF-A (ref. 49); and VEGF-A promotes angiogenesis.Interestingly, dysregulation of themiR-29 family has been implicated intissue fibrosis50–52 and many cancers, including leukaemia, lung cancer,liver cancer, rhabdomyosarcoma andmelanoma32,53–55.TGF-β signalling activates the promoters of many of the same
genes that are miR-29b targets, including LOX, MMPs and VEGFA(refs 56–58), and is a potent inducer of EMT. We found that GATA3inhibited TGF-β and that TGFB2 and TGFB3 are miR-29b targets.Therefore, to repress TGF-β-induced activation of its target genes,GATA3 inhibits the signalling network directly at the transcriptionallevel and indirectly at the post-transcriptional level through miR-29b(that is, degradation and translational inhibition of already-madeTGFB mRNAs). This multi-tiered system ensures efficient GATA3-mediated inhibition of TGF-β signalling. Interestingly, miR-29b alsoincreased GATA3, and loss of miR-29b decreased GATA3, suggestingthat GATA3 and miR-29b form a positive feedback loop and actcollaboratively to reinforce fate decisions. The exactmechanisms of howGATA3 and miR-29b function in cell-type-specific manners remain tobe further investigated.Our work on miR-29b adds to the growing body of evidence
implicating miRNA-mediated regulation of cancer and the tumourmicroenvironment. Previous studies have shown that many microR-NAs play important pro- and anti-metastatic roles by regulatingdiverse cellular processes used during metastasis20,59,60. Future workaimed at identifying other GATA3 targets and determining theirfunction will allow us to further understand the role of GATA3 indevelopment and cancer.Rather than functioning as a classical tumour suppressor, GATA3
defines a distinct class of pro-differentiation factors capable of alsomodifying the tumour microenvironment. The identification of oneGATA3 target,miR-29b, illustrates how epithelial plasticity, the tumourmicroenvironment and metastasis are linked. Finally, miRNAs arebeing pursued as potential anti-cancer agents61,62. Whether increasingmiR-29b levels in primary breast tumours improves patient survivalwill ultimately determine the therapeutic use of miR-29b mimics. �
METHODSMethods and any associated references are available in the onlineversion of the paper.
Note: Supplementary Information is available in the online version of the paper
ACKNOWLEDGEMENTSWe thankmembers of theWerb laboratory for discussions, P. Shahi, J. Dai and J. Taifor experimental assistance and E. Atamaniuc, Y. Yu, and H. Capili for technicalassistance. We thank T. Rambaldo and M. Kissner for flow cytometer assistance,the UCSF Biological Imaging Development Center for microscopy assistance,J. Debnath, G. Bergers, and D. Sheppard for discussions, and A. Goga, V. Weaver,J. Mott, P. Gonzalez, K. Xie and E. Raines for reagents. We also thank C. Choi fordiscussion and support. This research was supported by funds from the NationalCancer Institute (R01CA129523 to Z.W.), a Developmental Research grant from theBay Area Breast Cancer SPORE (P50 CA058207 to Z.W.), a Department of DefensePredoctoral Fellowship (W81XWH-10-1-0168 to J.C.) and the UCSF MedicalScientist Training Program (J.C.).We dedicate this work to thememory of L. Verber.
212 NATURE CELL BIOLOGY VOLUME 15 | NUMBER 2 | FEBRUARY 2013
AUTHOR CONTRIBUTIONSJ.H.L. and A.B. contributed equally to this work. J.C. designed and performedexperiments, with assistance from J.H.L., A.B., J-w.K. and S.P. Z.W. designedexperiments and supervised research. J.C. and Z.W. wrote the manuscript, and allauthors discussed the results and provided comments and feedback.
COMPETING FINANCIAL INTERESTSThe authors declare no competing financial interests.
Published online at www.nature.com/doifinder/10.1038/ncb2672Reprints and permissions information is available online at www.nature.com/reprints
1. Hanahan, D. & Weinberg, R. A. Hallmarks of cancer: the next generation. Cell 144,646–674 (2011).
2. Valastyan, S. & Weinberg, R. A. Tumor metastasis: molecular insights and evolvingparadigms. Cell 147, 275–292 (2011).
3. Hanahan, D. & Coussens, L. M. Accessories to the crime: functions of cells recruitedto the tumor microenvironment. Cancer Cell 21, 309–322 (2012).
4. Lu, P., Weaver, V. M. & Werb, Z. The extracellular matrix: a dynamic niche in cancerprogression. J. Cell Biol. 196, 395–406 (2012).
5. Yang, J. & Weinberg, R. A. Epithelial-mesenchymal transition: at the crossroads ofdevelopment and tumor metastasis. Dev. Cell 14, 818–829 (2008).
6. Mani, S. A. et al. The epithelial-mesenchymal transition generates cells withproperties of stem cells. Cell 133, 704–715 (2008).
7. Chou, J., Provot, S. & Werb, Z. GATA3 in development and cancer differentiation:cells GATA have it! J. Cell Physiol. 222, 42–49 (2010).
8. Asselin-Labat, M. L. et al. Gata-3 is an essential regulator of mammary-glandmorphogenesis and luminal-cell differentiation. Nat. Cell Biol. 9, 201–209 (2007).
9. Kouros-Mehr, H., Slorach, E. M., Sternlicht, M. D. & Werb, Z. GATA-3 maintainsthe differentiation of the luminal cell fate in the mammary gland. Cell 127,1041–1055 (2006).
10. Kouros-Mehr, H. et al. GATA-3 links tumor differentiation and dissemination in aluminal breast cancer model. Cancer Cell 13, 141–152 (2008).
11. Yoon, N. K. et al. Higher levels of GATA3 predict better survival in women with breastcancer. Hum. Pathol. 41, 1794–1801 (2010).
12. Mehra, R. et al. Identification of GATA3 as a breast cancer prognostic marker byglobal gene expression meta-analysis. Cancer Res. 65, 11259–11264 (2005).
13. Jacquemier, J. et al. Association of GATA3, P53, Ki67 status and vascularperitumoral invasion are strongly prognostic in luminal breast cancer. Breast CancerRes. 11, R23 (2009).
14. Usary, J. et al. Mutation of GATA3 in human breast tumors. Oncogene 23,7669–7678 (2004).
15. Network, C. G. A. Comprehensive molecular portraits of human breast tumours.Nature 490, 61–70 (2012).
16. Asselin-Labat, M. L. et al. Gata-3 negatively regulates the tumor-initiating capacityof mammary luminal progenitor cells and targets the putative tumor suppressorcaspase-14. Mol. Cell Biol. 31, 4609–4622 (2011).
17. Bartel, D. P. MicroRNAs: target recognition and regulatory functions. Cell 136,215–233 (2009).
18. Ma, L., Teruya-Feldstein, J. & Weinberg, R. A. Tumour invasion and metastasisinitiated by microRNA-10b in breast cancer. Nature 449, 682–688 (2007).
19. Tavazoie, S. F. et al. Endogenous human microRNAs that suppress breast cancermetastasis. Nature 451, 147–152 (2008).
20. Valastyan, S. et al. A pleiotropically acting microRNA, miR-31, inhibits breast cancermetastasis. Cell 137, 1032–1046 (2009).
21. Dore, L. C. et al. A GATA-1-regulated microRNA locus essential for erythropoiesis.Proc. Natl Acad. Sci. USA 105, 3333–3338 (2008).
22. Ibarra, I., Erlich, Y., Muthuswamy, S. K., Sachidanandam, R. & Hannon, G. J. A rolefor microRNAs in maintenance of mouse mammary epithelial progenitor cells. GenesDev. 21, 3238–3243 (2007).
23. Yu, F. et al. let-7 regulates self renewal and tumorigenicity of breast cancer cells.Cell 131, 1109–1123 (2007).
24. Sorlie, T. et al. Gene expression patterns of breast carcinomas distinguishtumor subclasses with clinical implications. Proc. Natl Acad. Sci. USA 98,10869–10874 (2001).
25. Foulkes, W. D., Smith, I. E. & Reis-Filho, J. S. Triple-negative breast cancer. NewEngl. J. Med. 363, 1938–1948 (2010).
26. Neve, R. M. et al. A collection of breast cancer cell lines for the study of functionallydistinct cancer subtypes. Cancer Cell 10, 515–527 (2006).
27. Debnath, J. & Brugge, J. S. Modelling glandular epithelial cancers in three-dimensional cultures. Nat. Rev. Cancer 5, 675–688 (2005).
28. Lee, G. Y., Kenny, P. A., Lee, E. H. & Bissell, M. J. Three-dimensional culturemodels of normal and malignant breast epithelial cells. Nat. Methods 4,359–365 (2007).
29. Visvader, J. E. Keeping abreast of the mammary epithelial hierarchy and breasttumorigenesis. Genes Dev. 23, 2563–2577 (2009).
30. Mott, J. L. et al. Transcriptional suppression of mir-29b-1/mir-29a promoter byc-Myc, hedgehog, and NF-κB. J. Cell Biochem. 110, 1155–1164 (2010).
31. Winbanks, C. E. et al. TGF-β regulates miR-206 and miR-29 to controlmyogenic differentiation through regulation of HDAC4. J. Biol. Chem. 286,13805–13814 (2011).
32. Wang, H. et al. NF-κB-YY1-miR-29 regulatory circuitry in skeletal myogenesis andrhabdomyosarcoma. Cancer Cell 14, 369–381 (2008).
33. Blenkiron, C. et al. MicroRNA expression profiling of human breast cancer identifiesnew markers of tumor subtype. Genome Biol. 8, R214 (2007).
34. Buffa, F. M. et al. microRNA-associated progression pathways and potentialtherapeutic targets identified by integrated mRNA and microRNA expression profilingin breast cancer. Cancer Res. 71, 5635–5645 (2011).
35. Enerly, E. et al. miRNA-mRNA integrated analysis reveals roles for miRNAs in primarybreast tumors. PLoS One 6, e16915 (2011).
36. Zhu, M. et al. Integrated miRNA and mRNA expression profiling of mouse mammarytumor models identifies miRNA signatures associated with mammary tumor lineage.Genome Biol. 12, R77 (2011).
37. Aslakson, C. J. & Miller, F. R. Selective events in the metastatic process defined byanalysis of the sequential dissemination of subpopulations of a mouse mammarytumor. Cancer Res. 52, 1399–1405 (1992).
38. Dykxhoorn, D. M. et al. miR-200 enhances mouse breast cancer cell colonization toform distant metastases. PLoS One 4, e7181 (2009).
39. Lin, E. Y. et al. Progression to malignancy in the polyoma middle T oncoproteinmouse breast cancer model provides a reliable model for human diseases. Am. J.Pathol. 163, 2113–2126 (2003).
40. Ewald, A. J., Brenot, A., Duong, M., Chan, B. S. & Werb, Z. Collective epithelialmigration and cell rearrangements drive mammary branching morphogenesis. Dev.Cell 14, 570–581 (2008).
41. Lewis, B. P., Burge, C. B. & Bartel, D. P. Conserved seed pairing, often flanked byadenosines, indicates that thousands of human genes are microRNA targets. Cell120, 15–20 (2005).
42. Betel, D., Wilson, M., Gabow, A., Marks, D. S. & Sander, C. The microRNA.orgresource: targets and expression. Nucl. Acids Res. 36, D149–D153 (2008).
43. Krek, A. et al. Combinatorial microRNA target predictions. Nat. Genet. 37,495–500 (2005).
44. Yu, K. R. et al. CD49f enhances multipotency and maintains stemness through thedirect regulation of OCT4 and SOX2. Stem Cells 30, 876–887 (2012).
45. Padua, D. et al. TGFβ primes breast tumors for lung metastasis seeding throughangiopoietin-like 4. Cell 133, 66–77 (2008).
46. Yan, W., Cao, Q. J., Arenas, R. B., Bentley, B. & Shao, R. GATA3 inhibits breastcancer metastasis through the reversal of epithelial-mesenchymal transition. J. Biol.Chem. 285, 14042–14051 (2010).
47. Chu, I. M. et al. GATA3 inhibits lysyl oxidase-mediated metastases of human basaltriple-negative breast cancer cells. Oncogene 31, 2017–2027 (2012).
48. Levental, K. R. et al. Matrix crosslinking forces tumor progression by enhancingintegrin signaling. Cell 139, 891–906 (2009).
49. Du, R. et al. HIF1α induces the recruitment of bone marrow-derived vascularmodulatory cells to regulate tumor angiogenesis and invasion. Cancer Cell 13,206–220 (2008).
50. van Rooij, E. et al. Dysregulation of microRNAs after myocardial infarctionreveals a role of miR-29 in cardiac fibrosis. Proc. Natl Acad. Sci. USA 105,13027–13032 (2008).
51. Roderburg, C. et al. Micro-RNA profiling reveals a role for miR-29 in human andmurine liver fibrosis. Hepatology 53, 209–218 (2010).
52. Wang, B. et al. Suppression of microRNA-29 expression by TGF-β1 promotescollagen expression and renal fibrosis. J. Am. Soc. Nephrol. 2, 252–265 (2011).
53. Fabbri, M. et al. MicroRNA-29 family reverts aberrant methylation in lung cancerby targeting DNA methyltransferases 3A and 3B. Proc. Natl Acad. Sci. USA 104,15805–15810 (2007).
54. Nguyen, T. et al. Downregulation of microRNA-29c is associated with hyperme-thylation of tumor-related genes and disease outcome in cutaneous melanoma.Epigenetics 6, 388–394 (2010).
55. Xiong, Y. et al. Effects of microRNA-29 on apoptosis, tumorigenicity, and prognosisof hepatocellular carcinoma. Hepatology 51, 836–845 (2009).
56. Sethi, A., Mao, W., Wordinger, R. J. & Clark, A. F. Transforming growth factor-βinduces extracellular matrix protein cross-linking lysyl oxidase (LOX) genes inhuman trabecular meshwork cells. Invest. Ophthalmol. Vis. Sci. 52,5240–5250 (2011).
57. Dumont, N. & Arteaga, C. L. Transforming growth factor-β and breast cancer:tumor promoting effects of transforming growth factor-β. Breast Cancer Res. 2,125–132 (2000).
58. Sanchez-Elsner, T. et al. Synergistic cooperation between hypoxia and transforminggrowth factor-β pathways on human vascular endothelial growth factor geneexpression. J. Biol. Chem. 276, 38527–38535 (2001).
59. Hurst, D. R., Edmonds, M. D. & Welch, D. R. Metastamir: the field of metastasis-regulatory microRNA is spreading. Cancer Res. 69, 7495–7498 (2009).
60. Lujambio, A. & Lowe, S. W. The microcosmos of cancer. Nature 482,347–355 (2012).
61. Ma, L. et al. Therapeutic silencing of miR-10b inhibits metastasis in a mousemammary tumor model. Nat. Biotechnol. 28, 341–347 (2010).
62. Kota, J. et al. Therapeutic microRNA delivery suppresses tumorigenesis in a murineliver cancer model. Cell 137, 1005–1017 (2009).
NATURE CELL BIOLOGY VOLUME 15 | NUMBER 2 | FEBRUARY 2013 213
METHODSAnimal studies. All animal experiments were performed at UCSF, and reviewedand approved by the UCSF IACUC. Mice were housed under pathogen-freeconditions in the UCSF barrier facility. BALB/c and nude mice were purchasedfrom Simonsen Laboratories. FVB/n mice, originally from Jackson Laboratories,were bred in-house. For experimental metastasis experiments, age-matched femalemice were injected i.v. (through the tail vein) with 1× 10⁵ cells (4T1), 5× 10⁵
cells (MDA-MB-231) or 5–10× 105 cells (PyMT) in PBS. For primary tumoursand spontaneous metastasis assays, age-matched female mice were injected with theindicated number of cells in 1:1 DMEM/Matrigel (BD Biosciences) into the fourthmammary fat pad without clearing. Tumour measurements were made blinded,using a caliper at least once per week, and volumeswere calculated using the formula:V=0.52×(length)2×width. Bioluminescence imagingwas performedusing an IVISSpectrum and image radiance values were normalized using Living Image (CaliperLifeScience).
Cell culture. MDA-MB-231, T47D, Hs578T, HEK293T, GP2, 4T1 and 4TO7 cellswere obtained from the ATCC, LBNL or UCSF Cell Culture Facility, and grown instandard conditions (DMEM with 10% FBS). The immortalized human mammaryepithelial cells (HMLE) were obtained from J. Debnath (UCSF, San Francisco, CA)and W. Hahn (Harvard University, USA) and maintained in MEGM (Lonza) aspreviously described63. The PyMT cell line was generated by isolating a late-stageMMTV-PyMT/FVB tumour, dissociating the cells in collagenase, and culturing inDMEM/F12 media supplemented with 5% FBS, insulin and hydrocortisone. ForTGF-β stimulation, cells were serum-starved for 18–24 h before adding TGF-β1 orTGF-β2 (R&D Systems) at 5 ngml−1. For TGF-βR inhibition, cells were grown instandard conditions with 10 µm LY-364947 (Calbiochem) or dimethylsulphoxide(Sigma). For cells embedded in Matrigel, cells were aggregated overnight onultralow attachment plates (Corning) and then embedded into growth-factor-reduced Matrigel (BD Biosciences) the next day. Cells were grown in serum-freemedia supplemented with insulin–transferrin (Invitrogen) and 50 ngml−1 of EGF(Invitrogen) or 2.5 nM FGF2 (Sigma).
Lentiviral and retroviral production. Viral production was carried out usingcalcium-phosphate-mediated transfection of HEK293T or GP2 cells. Virus wasconcentrated by ultracentrifugation, and added to cells with Polybrene. Stablytransduced cells were selected in puromycin, G418 or hygromycin for at least 5 daysor selected by FACS.
Plasmids. Several plasmids were obtained from Addgene including: pcDNA-miR-29b from J. Mendell (Johns Hopkins University School of Medicine, Baltimore,MD; plasmid 21121; ref. 64), pcDNA-GATA3 from G. Hotamisligil (HarvardSchool of Public Health, Boston, MA; plasmid 1332; ref. 65), p3TP-Lux fromJ. Massagué (Memorial Sloan-Kettering Cancer Center, New York, NY; plasmid11767; ref. 66), SBE4-Luc from B. Vogelstein (Johns Hopkins University Schoolof Medicine, Baltimore, MD; plasmid 16495; ref. 67), pWZL Blast VEGF-A fromR. Weinberg (MIT, Cambridge, MA; plasmid 10909; ref. 68) and pBabe Angptl4from J. Massagué (Memorial Sloan-Kettering Cancer Center, New York, NY;plasmid 19156; ref. 45). Several plasmids were gifts, including: pBM-IRES–puroand pBM-Mmp9 from E. Raines69 (University of Washington, Seattle, WA) andG. Bergers (UCSF, San Francisco, CA), pMSCV-miR-29b from A. Goga (UCSF,San Francisco, CA), pLV-LOX from V. Weaver (UCSF, San Francisco, CA),pGL3-V2774 (containing the VEGFA promoter) from K. Xie (MD Anderson,Houston, TX) and pGL3-miR29–Luc (containing the miR29a/b1 promoter) fromJ. Mott30 (University of Nebraska, Omaha, NE). The pMSCV-Luciferase retroviruswas generated using XhoI and EcoRI from pGL3 (Promega). The pmiRZip-29b(System Biosciences) to stably knockdown miR-29b expression was used followingthe manufacturer’s instructions and contained the following shRNA sequence: 5′-GTAGCACCGTTTGAAATCAATGCTCTTCCTGTCAGAACACTGATTTCAAAT-GGTGCTATTTTT-3′.
For the 3′ UTR luciferase reporters, the 3′ UTRs were PCR amplified fromgenomic DNA, cloned into pCR2.1 by TOPO cloning (Invitrogen) and verified bysequencing. Fragments were then digested with XhoI, SgfI and/or NotI and clonedinto the psiCheck2 reporter (Promega). The psicheck2-ITGB1 3′ UTR plasmid was agift from P. Gonzalez44 (Duke University, Durham, NC). Site-directed mutagenesisto mutate the miR-29b seed in the 3′ UTR reporters or to delete the GATA sitesin the pGL3-miR29–Luc reporter was performed according to the manufacturer’sinstructions (Stratagene). Allmutantswere verified by sequencing. Primer sequencesused to generate the wild-type and mutant 3′ UTRs and the GATA mutants aredetailed in Supplementary Tables S3–S5.
miRNA PCR arrays and qPCR. Total RNA was isolated from cells usingthe miRNeasy Mini Kit (Qiagen). For miRNA PCR arrays (SABiosciences),MDA231 cells±GATA3were screened according to the manufacturer’s instructions.
Complementary DNA was synthesized using the RT2 miRNA First Strand Kit(SABiosciences). Data were analysed using SABiosciences software. For qPCR,cDNA was synthesized using the Superscript III RT First Strand Kit (Invitrogen).qPCR was performed using FastStart Universal SYBR Green master mix (Roche)in an Eppendorf Mastercycler realplex machine. Ct values were normalized toactin and GAPDH, and relative expression was calculated using the 211Ct method.For quantification of miRNA expression, TaqMan probes were used according tothe manufacturer’s protocol (Applied Biosystems). Ct values were normalized toRNU48 (human samples) or snoRNA202 (mouse samples). Primer sequences forqPCRwere found using theHarvard Primer Bank and are detailed in SupplementaryTable S2.
Serum cytokine analysis and ELISA. Sera from mice bearing 4T1 primarytumours were collected when the mice were euthanized. Samples (n= 5 per group)were analysed in duplicate by Eve Technologies, using a multiplex bead platform.For analysis of secreted VEGF-A from cells in vitro, supernatants were collectedin triplicate 48 h after serum-starvation and analysed by ELISA (enzyme-linkedimmunosorbent assay) according to manufacturer’s instructions (R&D Systems).
Cell viability assays. Cell viability over several days was measured using theCellTiter MTT Assay according to the manufacturer’s instructions (Promega). Cellswere seeded in triplicate at the same initial density, and attenuance at 590 nm wasread on sequential days using a plate reader (Bio-Rad).
Luciferase assays. For 3′ UTR assays, HEK293T or MDA231 cells were co-transfected with the indicated sicheck2 wild-type or mutant reporter and eithermiR-29b, control cel-67, anti-miR-29b or anti-control mimic (100 nM final) usingDharmafect Duo (Dharmacon).
For the TGF-β and NF-κB reporter assays, the SBE4-Luc, p3TP-Lux or pGL-NF κB-Luc reporter was co-transfected with Renilla luciferase (pRL-TK) usingLipofectamine 2000 (Invitrogen) into MDA231 cells. Cells were serum-starvedovernight, and then stimulated with 5 ngml−1 TGF-β (R&D), 500 ngml−1 sRANKL(Invitrogen) or 100,ngml−1 TNF-α (Peprotech) for 24 h.
For the miR-29a/b1 promoter reporter assays, the pGL3-miR-29–Luc wild-typeor mutant reporter was co-transfected with pRL-TK and either pcDNA-eGFP(control) or pcDNA–GATA3 into MDA231 cells. Lysates were collected 48 h post-transfection. Renilla and firefly luciferase activities were measured using the Dual-Luciferase Reporter System and a GloMax luminometer (Promega). Transfectionefficiency was normalized to the control luciferase.
Immunostaining and histology. Tissues were fixed in 4% PFA overnight,and paraffin processed or embedded into OCT for frozen sections. Standardhaematoxylin and eosin (H&E) staining was performed for routine histology.Picrosirius red staining was performed as previously described48 and fibrillarcollagen visualized using crossed polarizers. Standard antigen retrieval wasperformed using citrate or proteinase K for immunohistochemistry9. The TSAAmplification Kit (Perkin Elmer #NEL700A001KT) was used according to themanufacturer’s instructions. Primary antibodies were incubated overnight, andsecondary antibodies were incubated for 1 h. The following antibodies were usedat the indicated concentrations: CD31 (BD Pharmingen #553370, 1:50), F4/80(Invitrogen #MF48000, 1:100), phospho-histone H3 (Cell Signaling #9701, 1:100),cleaved caspase-3 (Cell Signaling #9661, 1:100), GATA3 (R&D #AF2605 1:50 andAbcam#ab32858, 1:100), E-cadherin (Zymed #13-1900, 1:500), biotinylated anti-rat(Jackson #112-067-003, 1:300), biotinylated anti-rabbit (Dako #E0431, 1:300) andbiotinylated anti-goat (Jackson #305-067-003, 1:300). Fluorescent antibodies 488-anti-rabbit and 568-anti-rat were from Molecular Probes (Invitrogen #A11008 and#A11077, 1:600), and confocal microscopy was performed on a Nikon C1si confocalmicroscope. Image analysis was performed using ImageJ or Nikon software.
Time-lapse microscopy. Bright-field time-lapse videos were collected on a ZeissAxiovert S-100 microscope. The temperature was held at 37 ◦C and CO2 was held at5% by using a CTI Controller 3700 and Temperature Control combination. Imageswere acquired every 20min and assembled into videos usingMetaMorph (MolecularDevices).
Western blotting. Cells were lysed in RIPA buffer plus protease inhibitors (Roche)or directly in Lamelli Buffer with dithiothreitol. Protein concentrationwasmeasuredusing the BCA Protein Assay Kit (Thermo Scientific). Lysates were subjected toSDS–PAGE, transferred to PVDF membranes, blocked in 5% BSA, incubatedwith primary antibody overnight and visualized using ECL Detection Reagents(Pierce). Exposures were acquired using a LAS-4000 Imager (Fuji). Antibodies usedinclude: actin (Santa Cruz #sc-47778, 1:1,000), LOX (Novus #NB100-2527, 1:500),VEGF-A (Abcam #ab46154, 1:1,000), ANGPTL4 (Invitrogen # 40-9800, 1:250),GATA3 (R&D #AF2605 1:1,000), phospho-Smad3 (Cell Signaling #9520, 1:1,000),
vimentin (Cell Signaling #5741, 1:1,000), nucleolin (Abcam #ab22758, 1:1,000),HRP anti-rabbit and HRP anti-mouse (GE Healthcare #NA9340 and #NXA931,1:5000) and HRP anti-goat (Invitrogen #811620, 1:5000).
Flow cytometry. To sort primary mouse mammary epithelial cells into basal andluminal fractions, mammary glands from adult virgin females were digested withcollagenase. Organoids were collected by brief centrifugation and digested withtrypsin to dissociate into single cells. The cells were stained with antibodies againstCD49f, CD24 and lineagemarkers (CD45, CD31, Ter119) (eBioscience #17-0495-82,48-0242-82, 12-0451, 11-0311-85, 11-5921-82, respectively; all used at 1:150),as described previously70. Antibodies against CD29, GATA3, CD44, CD24 andEpCAM (eBioscience #12-0299-71, 12-0241-81, 50-9966-41, 12-0441, 17-0247-41and 50-9326-41, respectively; all used at 1:150) were used to stain cell lines. Forthe GATA3 stain, cells were permeabilized using 0.2% Triton X-100. Analysis andcell sorting were performed on an LSRII or FACS Aria II (Becton Dickinson), andanalysed using FlowJo (TreeStar) or FACSDiva software (BD Biosciences).
Statistical analysis. Statistical analysis was performed using Prism 4 software(GraphPad Software). All data are presented as mean± s.e.m., unless otherwisestated. When two groups were compared, the two-tailed Student t -test was used,unless otherwise stated. When three or more groups were compared, the one-wayanalysis of variance test was used, followed by Tukey’s test to determine significancebetween groups. To compare histograms collected from the flow cytometer, weused the probability binning χ 2 test on FlowJo (TreeStar). We considered P < 0.05as significant.
Accession numbers for data sets. The data set generated has been deposited toGEOunder the primary accession number GSE42468. Eight reference accession datasets were reanalysed in the study, including six from the GEO database (GSE7842,GSE19783, GSE22220, GSE23938, GSE23977 and GSE23978) and two from theArrayExpress database (E-MEXP-2289 and E-TABM-157).
63. Elenbaas, B. et al. Human breast cancer cells generated by oncogenic transformationof primary mammary epithelial cells. Genes Dev. 15, 50–65 (2001).
64. Hwang, H. W., Wentzel, E. A. & Mendell, J. T. A hexanucleotide element directsmicroRNA nuclear import. Science 315, 97–100 (2007).
65. Tong, Q. et al. Function of GATA transcription factors in preadipocyte-adipocytetransition. Science 290, 134–138 (2000).
66. Wrana, J. L. et al. TGF β signals through a heteromeric protein kinase receptorcomplex. Cell 71, 1003–1014 (1992).
67. Zawel, L. et al. Human Smad3 and Smad4 are sequence-specific transcriptionactivators. Mol. Cell 1, 611–617 (1998).
68. Watnick, R. S., Cheng, Y. N., Rangarajan, A., Ince, T. A. & Weinberg, R. A. Rasmodulates Myc activity to repress thrombospondin-1 expression and increase tumorangiogenesis. Cancer Cell 3, 219–231 (2003).
69. Gough, P. J., Gomez, I. G., Wille, P. T. & Raines, E. W. Macrophage expression ofactive MMP-9 induces acute plaque disruption in apoE-deficient mice. J. Clin. Invest.116, 59–69 (2006).
70. Stingl, J. et al. Purification and unique properties of mammary epithelial stem cells.Nature 439, 993–997 (2006).