Page 1
GATXGENERAL AMERICAN TRANSPORTATION CORPORATION
(NASA-CR-124397) VACUUM N73-32367DISTILLATION/VAPOR FILTRATION WATERRECOVERY, PHASES 1 AND 2 Interim Report(General American Transportation Corp.) Unclas134 p HC $8.75 CSCL 13H G3/15 15534
GENERAL AMERICAN RESEARCH DIVISION
7449 NORTH NATCHEZ AVENUE, NILES. ILLINOIS 60648 312/647-9000
https://ntrs.nasa.gov/search.jsp?R=19730023635 2018-06-25T20:40:58+00:00Z
Page 2
GENERAL AMERICAN RESEARCH DIVISION
GENERAL AMERICAN TRANSPORTATION CORPORATION
7449 NORTH NATCHEZ AVENUE
NILES, ILLINOIS 60648
VACUUM DISTILLATION/VAPOR FILTRATION
WATER RECOVERY
Interim Report for Phases I and II
Contract No. NAS 8-27467
GARD Project No. 1528
Chemical & Environmental Systems GroupEngineering Research Department
R. J. HoneggerG. A. RemusE. K. Krug
Life Support and Environmental BranchGeorge C. Marshall Space Flight Center
National Aeronautics and Space AdministrationMarshall Space Flight Center, Alabama
July 1973
GENERAL AMERICAN RESEARCH DIVISION
Page 3
FOREWORD
This report summarizes the results for the design, manufacture and check-
out testing of a Vacuum Distillation/Vapor Filtration (VD/VF) water recovery
system. The report is arranged in two parts. Part I describes the activities
for developing an evaporator and catalytic oxidation unit during Phase I of the
program. Part II describes the activities accomplished during Phase II for
developing a condenser and integrating and testing the evaporator, catalytic
oxidation unit, condenser and auxiliary components. The work was conducted
for the George C. Marshall Space Flight Center of the National Aeronautics
and Space Administration, under Contract No. NAS 8-27467 by the General Ameri-
can Research Division of the General American Transportation Corporation during
the period from 25 June 1971 to 31 March 1973.
The NASA Project Monitor was Mr. James L. Moses of the Life Support and
Environmental Branch, Propulsion and Thermodynamics Division. Personnel in
the Chemical and Environmental Systems Group at GARD performed the activities
under the direction of Mr. George A. Remus; Mr. Robert J. Honegger served as
Project Engineer and Mr. Edwin K. Krug served as Engineering Assistant.
GENERAL AMERICAN RESEARCH DIVISION
ii
Page 4
ABSTRACT
A vacuum distillation/vapor filtration (VD/VF) water recovery system was
designed, fabricated, and check-out tested. The system employs vacuum distil-
lation, vapbr-phase catalytic oxidation, and condensation as the basic pro-
cesses for recovering potable water from urine. Both the evaporator and con-
denser utilize a rotating impeller to create an artificial gravity for separ-
ation of liquid and vapor in zero gravity. Each impeller is driven through
a magnetic coupling, thus eliminating shaft seals. A six-day performance test
indicated good system thermal efficiency and water recovered from urine was
of good quality as determined by selected analyses. Total organic carbon was
less than 12 mg/l, pH varied between 6.0 and 6.9, turbidity was below 1
Jackson Unit, and ammonia concentration was less than 1 mg/1 as indicated by
daily analyses of recovered water.
GENERAL AMERICAN RESEARCH DIVISiON
iii
Page 5
TABLE OF CONTENTS
PART I: DESIGN, MANUFACTURE, AND CHECKOUT TESTING OF EVAPORATOR
Section Page
1 INTRODUCTION AND SUMMARY ................................ 1
2 WATER RECOVERY BY VACUUM DISTILLATION/VAPOR FILTRATION.. 6
2.1 Introduction....................................... 6
2.2 Design Requirements................................ 6
3 LABORATORY SUPPORT TESTING............................ .. 9
3.1 Laboratory Test Apparatus and Procedures ........... 11
3.1.1 Test Apparatus ................................ 113.1.2 Test Procedure............................... 17
3.2 Laboratory Test Results............................. 18
3.2.1 Distillation Test Results ................... 183.2.2 Evaluation of Mechanical Features............ 243.2.3 Oxidation Catalyst Test Results ............. 28
4 EVAPORATOR DEVELOPMENT .................................. 39
4.1 Design.............................................. 39
4.1.1 Evaporator Size Determination............... 394.1.2 Evaporator Components....................... 424.1.3 Evaporator Operation......................... 46
4.2 Fabrication and Assembly........................... 494.3 System Check-Out Tests............................. 54
5 CONCLUSIONS AND RECOMMENDATIONS ......................... 62
5.1 Conclusions......................................... 625.2 Recommendations .................................... 63
GENERAL AMERICAN RESEARCH DIVISION
iv
Page 6
TABLE OF CONTENTS
PART II: DESIGN, MANUFACTURE, AND TESTING OF ZERO-GRAVITY CONDENSER:
INTEGRATION OF EVAPORATOR, CONDENSER, AND AUXILIARY COMPONENTS
Section Page
1 INTRODUCTION AND SUMMARY ................................. 65
2 CONDENSER DEVELOPMENT................................... 68
2.1 Design Requirements................................ 68
2.2 Support Testing of Lab Condenser................... 69
2.3 Design of Zero-Gravity Condenser................... 78
2.4 Fabrication and Assembly........................... 81
2.5 Condenser Check-Out Testing........................ 81
3 SYSTEM TESTING............................... .. ......... 87
3.1 Test Set-Up and Instrumentation.................... 87
3.2 Operation and Monitoring........................... 87
3.3 Water Quality Analysis Procedures.................. 90
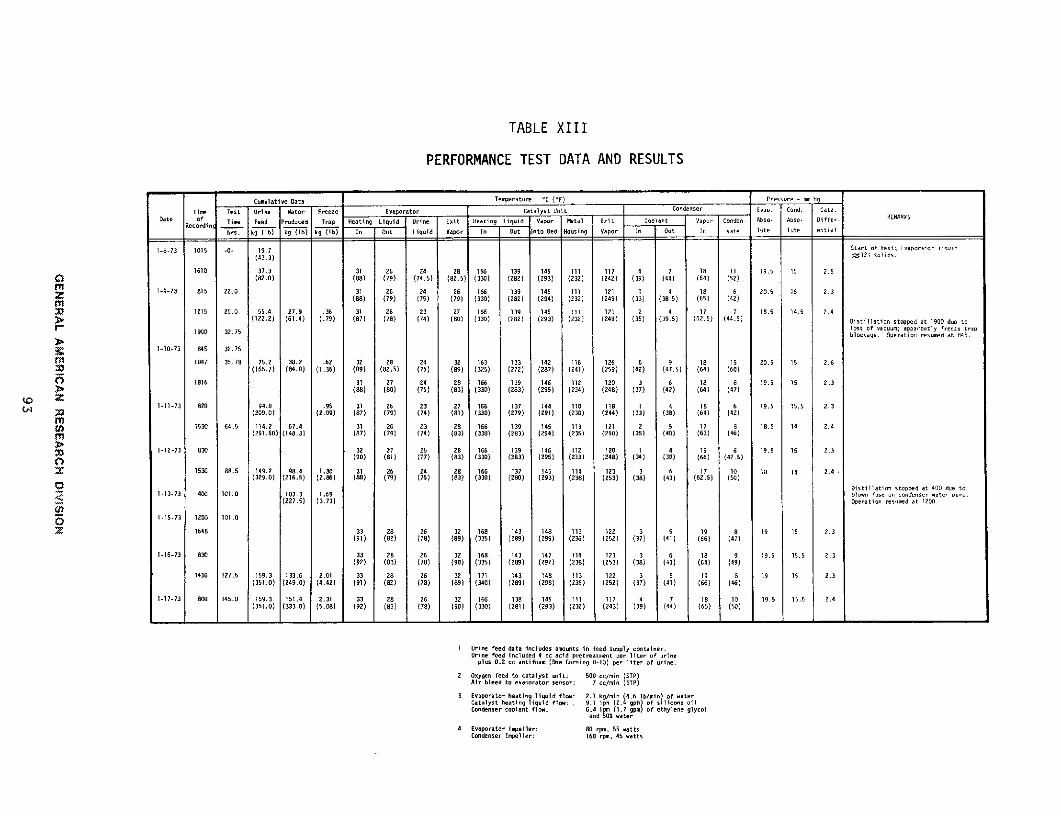
3.4 Processing Test Results............................ 92
3.4.1 Evaporator Heat Utilization................. 923.4.2 Urine Distillation.......................... 92
3.4.3 Evaporator Heat Transfer Coefficient......... 94
3.4.4 Water Yield.................................. 94
3.4.5 Catalyst Heat Utilization................... 97
3.4.6 Condenser Heat Rejection.................... 97
3.4.7 Condenser Heat Transfer Coefficient......... 983.4.8 Condenser Venting and Condenser Efficiency.. 98
3.5 Product Water Quality.............................. 993.6 Mechanical Performance............................. 101
4 CONCLUSIONS AND RECOMMENDATIONS......................... 103
4.1 Conclusions........................................ 103
4.2 Recommendations.................................... 104
APPENDIX: DESIGN CALCULATIONS.......................... A-I
GENERAL AMERICAN RESEARCH DIVISION
V
Page 7
LIST OF FIGURES AND ILLUSTRATIONS
Figure No. Title Page
1 BLOCK FLOW DIAGRAM 4
2 EVAPORATOR AND CATALYST BED ASSEMBLY 5
3 LAB TEST FLOW DIAGRAM 14
4 LABORATORY TEST SET-UP 15
5 BPE vs. DURATION OF TEST 21
6 LAB DISTILLATION UNIT WITH ROTARY SHAFT SEAL 26
7 LAB DISTILLATION UNIT WITH MAGNETIC COUPLING 27
8 DAILY VARIATION OF TOTAL CARBON CONTENT 30
9 DAILY VARIATION OF TOTAL ORGANIC CRRBON CONTENT 31
10 DAILY VARIATION OF pH 32
11 DAILY VARIATION OF AMMONIA CONTENT 33
12 DAILY VARIATION OF CONDUCTIVITY 35
13 DAILY VARIATION OF TURBIDITY 36
14 EVAPORATOR ASSEMBLY 41
15 VACUUM EVAPORATOR ASSEMBLY 50
16 IMPELLER-DEMISTER ASSEMBLY 51
17 POWER DRIVE ASSEMBLY 52
18 CATALYTIC OXIDATION UNIT 53
19 CHECK-OUT TEST SET-UP 55
20 ZERO-GRAVITY CONDENSER 67
21 LABORATORY TEST CONDENSER UNIT 71
22 FLOW DIAGRAM FOR LAB TEST CONDENSER 72
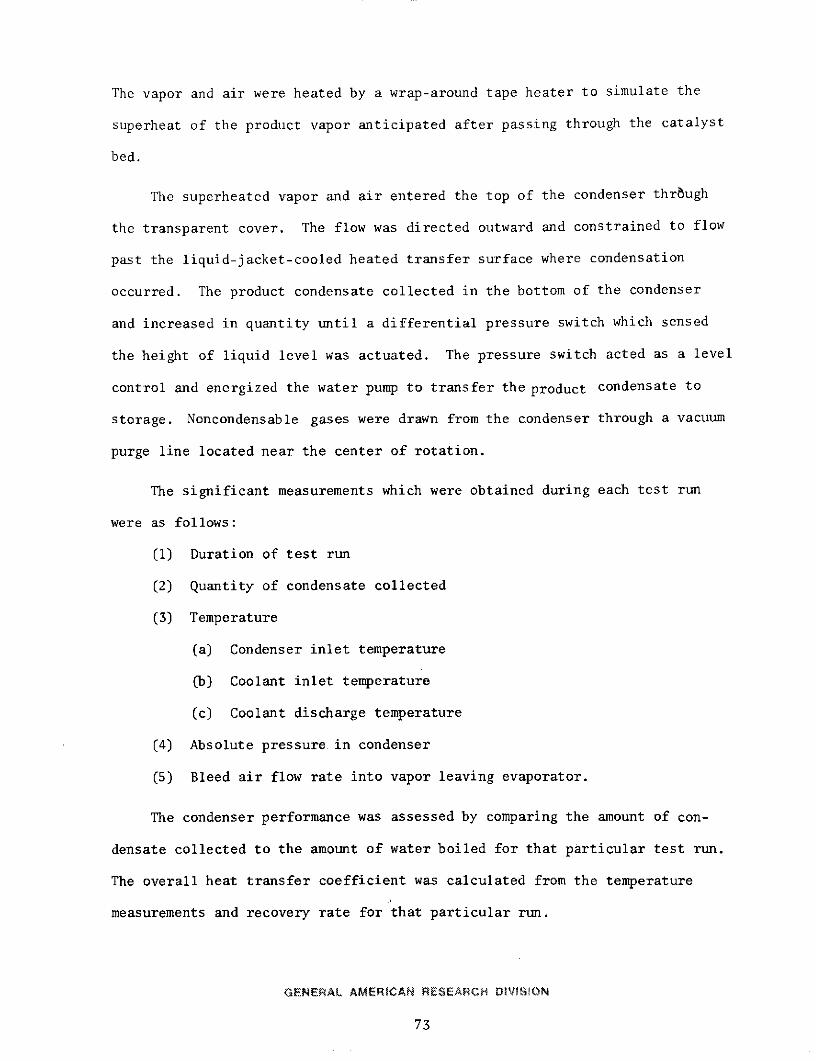
23 MODIFIED CONFIGURATION OF COOLANT JACKET: LAB
TEST CONDENSER 77
24 ZERO-GRAVITY CONDENSER ASSEMBLY 80
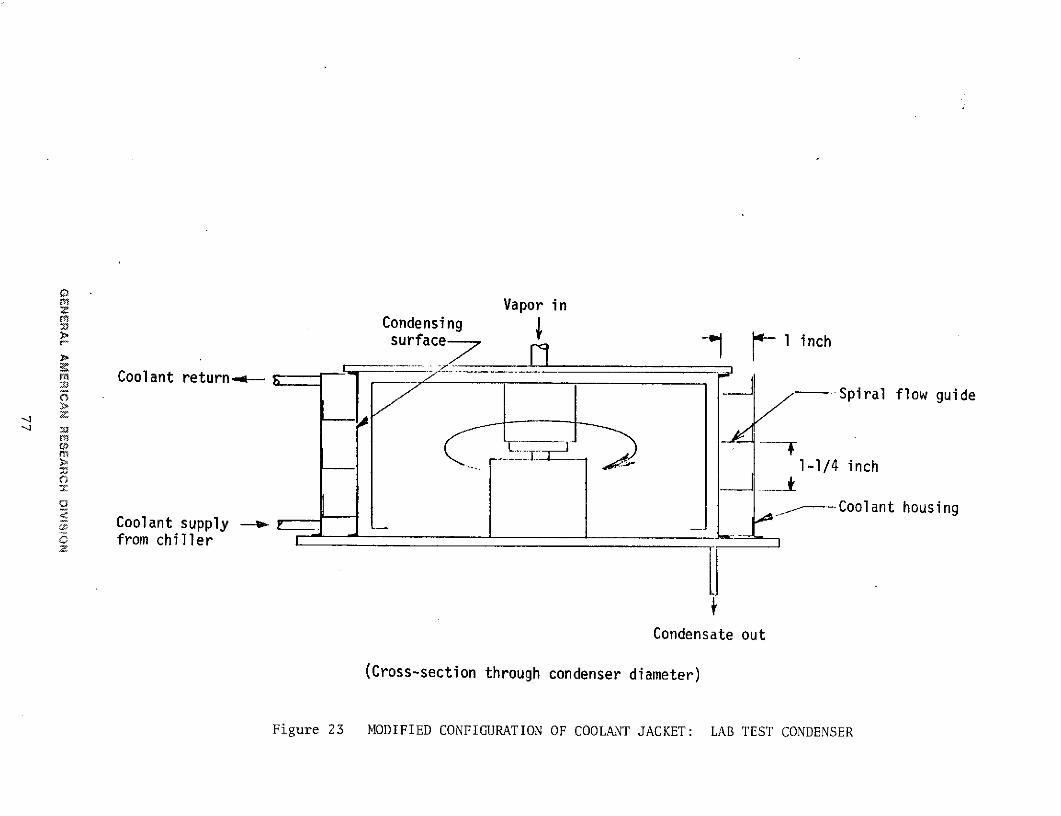
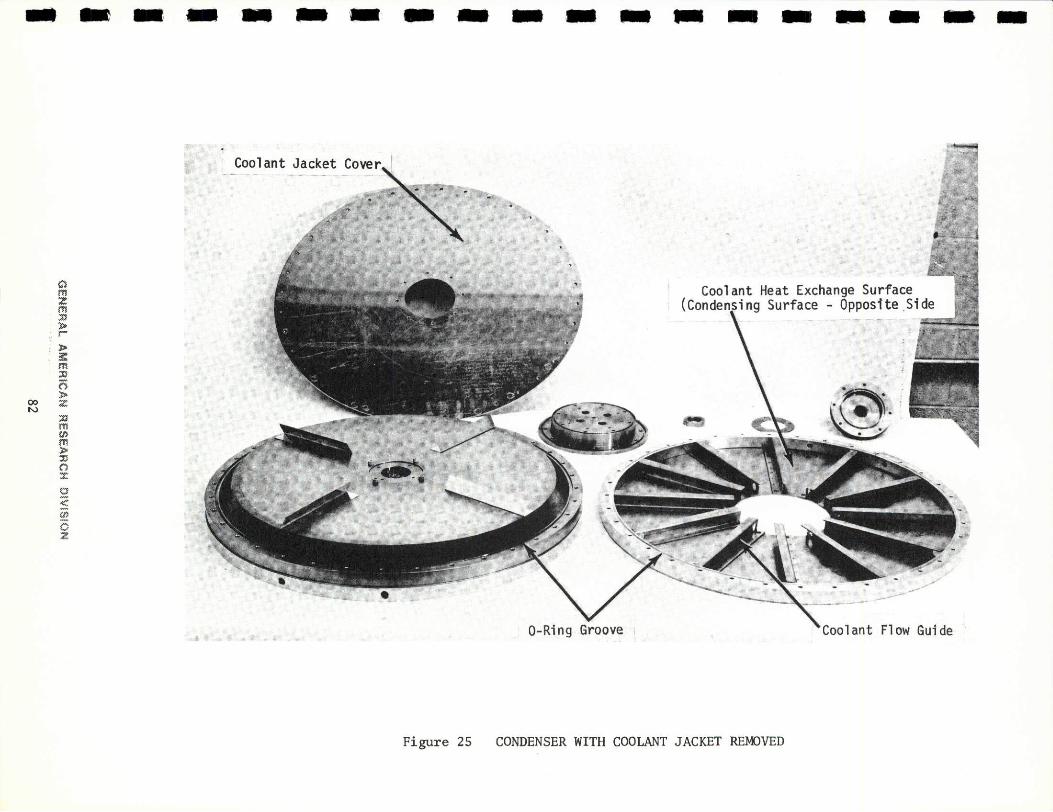
25 CONDENSER WITH COOLANT JACKET REMOVED 82
26 IMPELLER SUBASSEMBLY 83
27 FLOW DIAGRAM FOR SYSTEM PERFORMANCE TESTS 88
28 WATER YIELD vs. SLUDGE SOLIDS CONCENTRATION 96
GENERAL AMERICAN RESEARCH DIVIStON
vi
Page 8
LIST OF TABLES
Table No. Title Page
I LABORATORY TEST COMPONENTS 12
II LABORATORY SYSTEM DISTILLATION PERFORMANCE SUMMARY:BATCH #1 18
III EVAPORATOR TEMPERATURE AND PRESSURE HISTORY 20
IV DISTILLATION HEAT TRANSFER COEFFICIENT vs. TESTDURATION 23
V OZIDATION CATALYST TEST PARAMETERS AND TEST RESULTS 29
VI CATALYST PERFORMANCE SUMMARY: FIRST DISTILLATION
BATCH 37
VII CATALYST PERFORMANCE SUMMARY: SECOND DISTILLATION
BATCH 38
VIII EVAPORATOR CHECK-OUT TEST WITH WATER 56
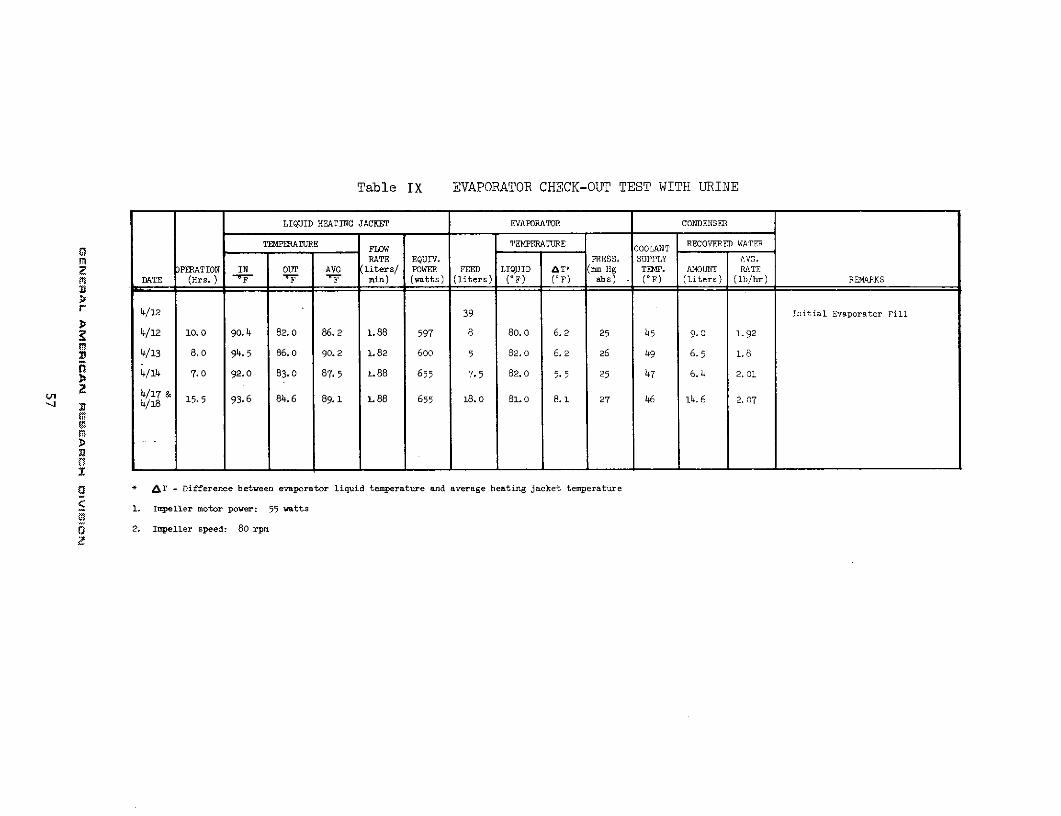
IX EVAPORATOR CHECK-OUT TEST WITH URINE 57
X LAB CONDENSER TEST DATA AND RESULTS: LOW COOLANT
VELOCITY,'.01 FPS 76
XI LAB CONDENSER TEST DATA AND RESULTS: IMPROVED
COOLANT VELOCITY,/.35 FPS 79
XII PROCESS TEST PARAMETERS AND INSTRUMENTATION 89
XIII PERFORMANCE TEST DATA AND RESULTS 93
XIV WATER QUALITY ANALYSES 100
GENERAL AMERICAN RESEARCH DIVISION
vii
Page 9
PART I
DESIGN, MANUFACTURE, AND CHECKOUT TESTING OF EVAPORATOR
Section 1
INTRODUCTION AND SUMMARY
This report summarizes the activities of the General American Research
Division (GARD) to develop an evaporator for vacuum distillation/vapor filtra-
tion (VD/VF) water reclamation. The evaporator development was conducted as
Phase I of an anticipated program to develop a complete VD/VF water recovery
system for spacecraft applications.
1.1 Background
Current manned space vehicles do not include water reclamation require-
ments and/or equipment because most of these vehicles utilize water-producing
fuel cells for auxiliary power. Future space missions, such as the foreseeable
Space Station, will most likely utilize solar cells instead of fuel cells;
thus, another source of water must be provided. Life-support system require-
ments envision supporting 12 men continuously, using 180-day resupply intervals.
Studies conducted to determine the most economical approach for supplying
the life-support needs of large-crew, long-duration space missions have indi-
cated that it is essential to recover water from urine and respiration and
perspiration condensates. The basic life-support systems can be modularized
by using six-man capacity units, based on studies considering the overall in-
tegration of spacecraft systems.
GENERAL AMERICAN RESEARCH DIVISION
1
Page 10
1.2 Program Objectives
The ultimate program objectives were to develop and to evaluate a vacuum
distillation/vapor filtration (VD/VF) water recovery system. As a functional
model, the system is to convert urine and condensate waste water from six men
into potable water on a steady-state basis. The system is to be designed for
180-day operating durations and to function on the ground, in zero-g aircraft,
and in orbit.
In Phase I of the program, which is described in this part of the report,
the objetive was to develop an evaporator subsystem for water recovery by
vacuum distillation/vapor filtration.
To accomplish this objective, a six-man capacity evaporator subsystem was
designed, manufactured, and check-out tested. Prior to development of the
evaporator, laboratory support tests were conducted to provide realistic in-
formation on which to base certain design features. These support tests pro-
vided information on distillation heat-transfer coefficients, operating char-
acteristics of a magnetic coupling as compared to a rotary shaft seal, and
operating characteristics of a bubble-type sensor for liquid level control in
both normal and zero-gravity operation. Design calculations were prepared to
determine the optimum size and shape of the evaporator. Based on laboratory
support-test data and basic design calculations, the overall design for the
evaporator was prepared and reviewed with NASA personnel for their approval.
Detail drawings were then completed for fabrication of component parts and
subassemblies. When assembled, the evaporator subsystem was check-out tested
to verify the adequacy of its basic features.
GENERAL AMERICAN RESEARCH DIVISION
2
Page 11
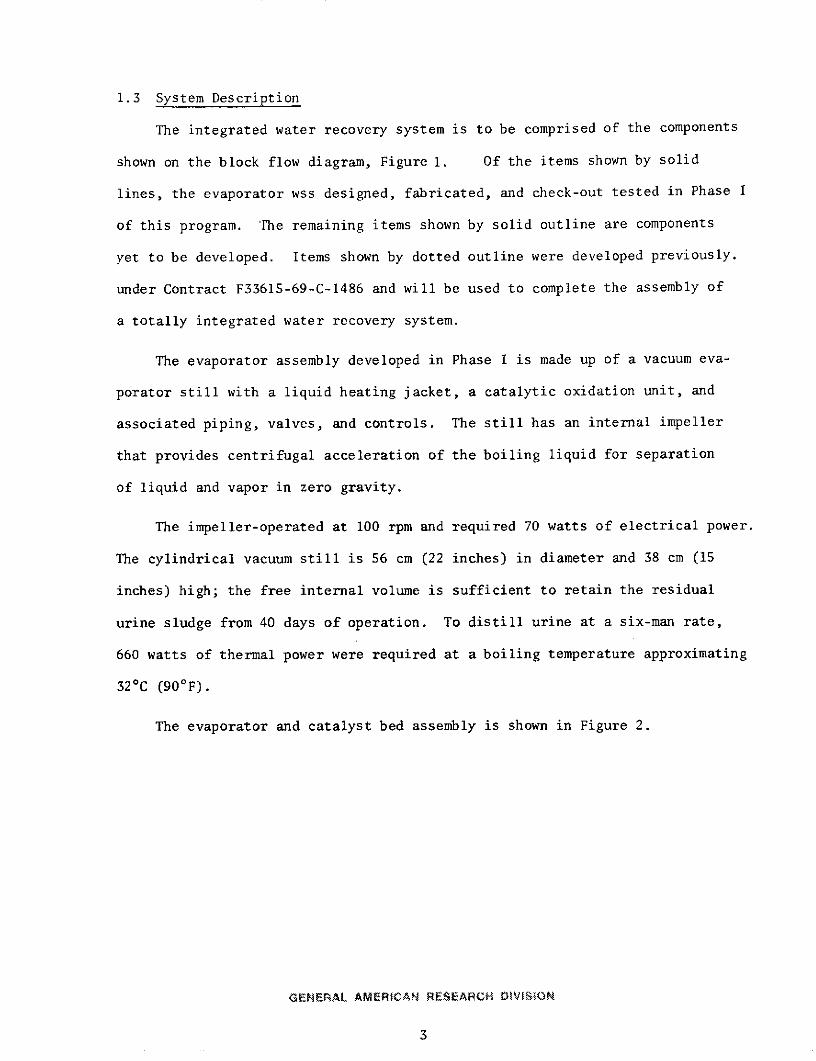
1.3 System Description
The integrated water recovery system is to be comprised of the components
shown on the block flow diagram, Figure 1. Of the items shown by solid
lines, the evaporator wss designed, fabricated, and check-out tested in Phase I
of this program. The remaining items shown by solid outline are components
yet to be developed. Items shown by dotted outline were developed previously.
under Contract F33615-69-C-1486 and will be used to complete the assembly of
a totally integrated water recovery system.
The evaporator assembly developed in Phase I is made up of a vacuum eva-
porator still with a liquid heating jacket, a catalytic oxidation unit, and
associated piping, valves, and controls. The still has an internal impeller
that provides centrifugal acceleration of the boiling liquid for separation
of liquid and vapor in zero gravity.
The impeller-operated at 100 rpm and required 70 watts of electrical power.
The cylindrical vacuum still is 56 cm (22 inches) in diameter and 38 cm (15
inches) high; the free internal volume is sufficient to retain the residual
urine sludge from 40 days of operation. To distill urine at a six-man rate,
660 watts of thermal power were required at a boiling temperature approximating
320C (900 F).
The evaporator and catalyst bed assembly is shown in Figure 2.
GENERAL AMERICAN RESEARCH DIVISION
3
Page 12
Ale' U4E1AI- COAIES4 7W
P4M1 h L LV//E WA SA r, A
£>seoezAt~' 7~ ~ u~' ~~I1 P -7r& L/#/qJ
Z f Irgw DIIICOA741A1-J-C._r-,
>I E , "
LCUU PU#7
I-,
PAAMS CI XL7 '~M AIWN ~ I2 WAT~WASTE1
44DIA144 44~lLJsAIU'rOFF
141 VAL VE- W/A MR' S r04(E
SL U /4VAI TA/
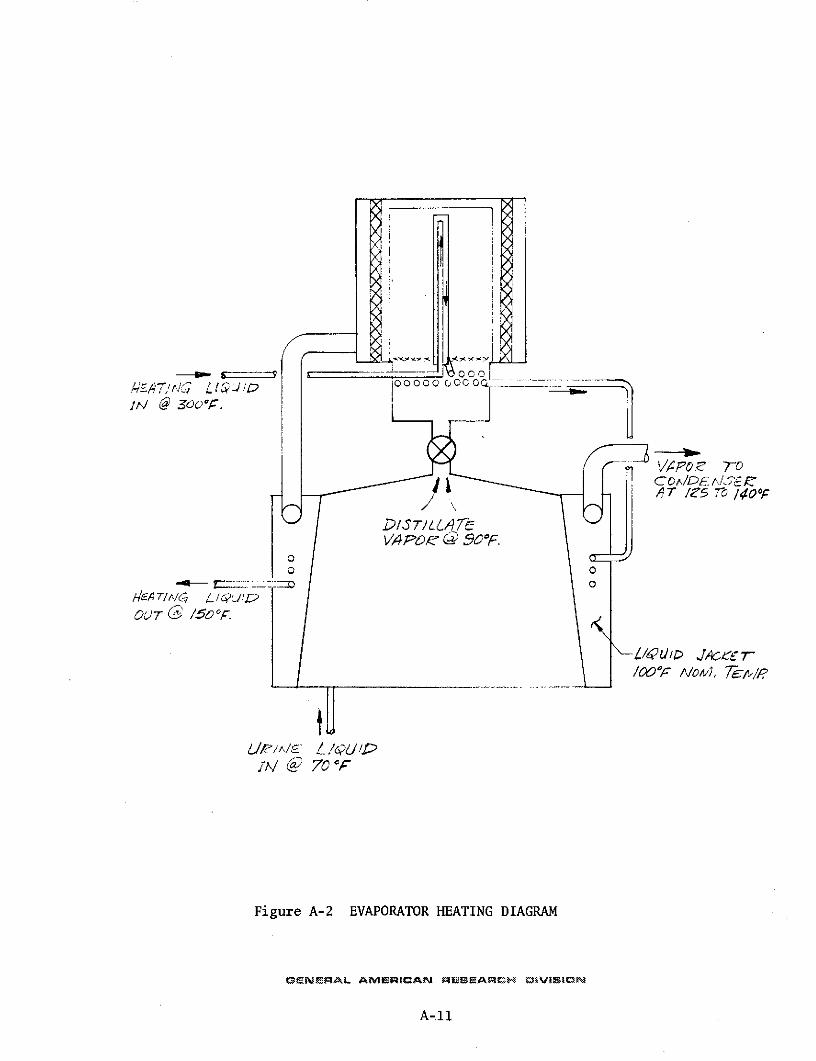
Figure 1 BLOCK FLOW DIAGRAM
Page 13
Figure 2. EVAPORATOR AND CATALYST BED ASSEMBLY
Q N L AMrvE~RI I3CAN B AR H V
I5
Page 14
Section 2
WATER RECOVERY BY VACUUM DISTILLATION/VAPOR FILTRATION
2.1 Introduction
Water recovery by vacuum distillation/vapor filtration entails a distil-
lation process in which urine is distilled under vacuum at a low temperature.
As urine is distilled, solids are left behind and accumulate as residual sludge.
The raw distilled vapor contains some small amounts of entrained mist and co-
distilled organic vapors. The distilled vapor, along with oxygen fed into the
vapor ducting, are passed through an oxidation catalyst operating at 150 0C to
remove the organic contaminant and then through a microporous vapor filter to
remove bacteria and generate sterile vapor which is subsequently condensed to
potable water.
2.2 Design Requirements
The design requirements for the evaporator developed in Phase I were as
follows:
.a) Incorporate a rotating vaned impeller to provide artificial
gravity for liquid-vapor phase separation and improved
heat transfer from the heating jacket surface to the liquid
urine.
b) Have capacity to evaporate the combined urine and respiratory
outputs, and recover water from these outputs at the same
rate specified for the system under contract F33615-69-C-1486,
namely, to recover 3.41 kg/day (7.5 lb/day) of water from the 1.58 kg
(3.5 lb) of urine and 1.83 kg (5.0 lb) of respiratory water generated
by each man. For the 6-man system the recovery rate was thus 20.4 kg/day
GENERAL AMERICAN RESEARCH DIVISION
6
Page 15
(45 lb/day) of water from the combined input total of 23.6
kg/day (51 lb/day). The evaporator volume was to be large
enough to operate for 40 days without removing urine sludge,
and to contain sufficient liquid volume so that the concen-
trated residue would maintain the accumulated solids in solu-
tion; the sludge could be removed after 40 days operation, or
periodically at shorter intervals if desired, by means of a
sludge removal pump.
c) Utilize the liquid-vapor interface to sense the quan-
tity of liquid in the evaporator in conjunction with provid-
ing an automatic feed control; a pneumatic-mechanical sensor
was to be used in the urine environment.
d) Utilize a water-filled jacket around the evaporator to transfer
heat to the urine liquid. Heating elements were to be lo-
cated in wells extending into the water jacket. Water can
be circulated within the jacket to remove excess heat when
required, thus providing positive temperature control when
isotope heat sources are used.
e) Provide sufficient boiling liquid/vapor interface area
to provide a low velocity for vapor leaving the liquid sur-
face and thus minimize entrainment of droplets.
f) Rotate the impeller at low speed to minimize wear on
rotating parts, but at sufficient speed to provide the neces-
sary velocity for liquid/vapor separation and adequate boiling.
rpMERAL AMtCCAN RESEARCH VIS7
7
Page 16
g) Attach mesh or sponge to the rotating impeller to be used
to provide zero-gravity vapor de-misting capability.
h) Utilize a microporous membrane to filter entrained fine
droplets from distilled vapor, and to act partially as a barrier
to bacteria. The membrane was to be readily removed and
replaced, if required, after thermal power shut-down and
evaporator repressurization.
i) Include an oxidation catalyst bed designed to provide 40 days
of operation without replacement. The housing was to be
designed to permit easy removal and replacement of the cata-
lyst cartridge after thermal power shut-down and evaporator
repressurization.
j) Incorporate appropriately located sight glasses to permit
both visual observation and camera-film recording of the
liquid/vapor profile during laboratory or low-gravity test-
ing, when appropriate.
GENERAL AMERICAN RESEARCH DIVISION
8
Page 17
SECTION 3
LABORATORY SUPPORT TESTING
Experimental investigations were conducted to evaluate: a) heat trans-
fer rates between the heating bath and urine, b) a mechanical drive assembly
for the rotating impeller, and c) a level sensing device for controlling the
urine feed rate and liquid level in the vacuum still. Vapors from the lab
distillation unit were also passed through a proprietary oxidation catalyst
bed to evaluate the reduction of trace organic contaminants. The catalyst
evaluation tasks were conducted under company sponsorship.
The system performed well mechanically with the exception of the rotary
shaft seal for the impeller, which sporadically leaked seal-coolant water in-
to the vacuum evaporator. The impeller drive for the laboratory unit was re-
placed by a magnetic coupling with a static vacuum barrier. The magnetic
coupling and drive assembly were operated for a period of 218 hours with no
apparent problems.
The bench-scale 3-man capacity evaluation evaporator was operated for a
total of 442 hours with no residue removal. A total of 198 liters of feed was
added to the system; 186 liters of water were recovered and 12 liters of res-
idue containing 62% solids were accumulated. The bench-scale evaporator was
then emptied and recharged with fresh pretreated urine and operated for an
additional 110 hours. The vapors in both test runs were passed through the
oxidation catalyst for a total of 552 hours.
As anticipated, the boiling temperature of the urine gradually increased
relative to the distillate vapor temperature as the test progressed. Near the
end of the first batch, the boiling point elevation increased at a more rapid
GErNERAL AMERICAN RESEARCH DiVISIOC
9
Page 18
rate; however, the 40C (70 F) elevation at the end of the batch was lower
than predicted for a 62% solids concentration. Since the heating jacket liquid
temperature remained essentially constant, the gradual elevation of the urine
boiling temperature resulted in a lower heating temperature difference and a
gradual decrease in the water boil-off rate. The overall heat transfer co-
efficient remained constant, and the heating surface remained free of scale,
during the entire test.
The liquid level sensor and feed control performed adequately throughout
the 552 hours of testing with one exception. When the urine residue was con-
centrated beyond 40% solids, the feed line tended to plug with solids during
overnight shutdown. Both the feed and liquid level sensing lines entered the
evaporator at the bottom and were relatively small in size. Precipitated sol-
ids which settled on the bottom during overnight shutdown occasionally plugged
the feed line and required manual unplugging on start-up of the next run.
This was overcome in the final system by relocating and enlarging the feed
and sensing lines.
The proprietary oxidation catalyst functioned satisfactorily throughout
the 552 hours of operation; it reduced the total carbon and total organic car-
bon content of the product condensate to acceptable levels. During the course
of testing the oxygen feed rate needed to reduce the total organic carbon con-
tent of the exit vapor was investigated by varying the oxygen feed rate between
10 cc/min and 230 cc/min (STP). Based on the organic carbon analyses of the
recovered water, an oxygen flow of 150 cc/min (STP) is required for a six-man
urine distillation rate.
GENERAL AMERICAN RESEARCH DIVISION
10
Page 19
3.1 Laboratory Test Apparatus and Procedures
3.1.1 Test Apparatus
The laboratory test apparatus consisted of hardware that was fabricated
and/or purchased specifically for the program, plus standard laboratory equip-
ment to support testing. Components of the system are listed in Table I, which
also shows the function, model, and manufacturer of each item. The main compo-
nents of the system were made of stainless steel, and all instrumentation was
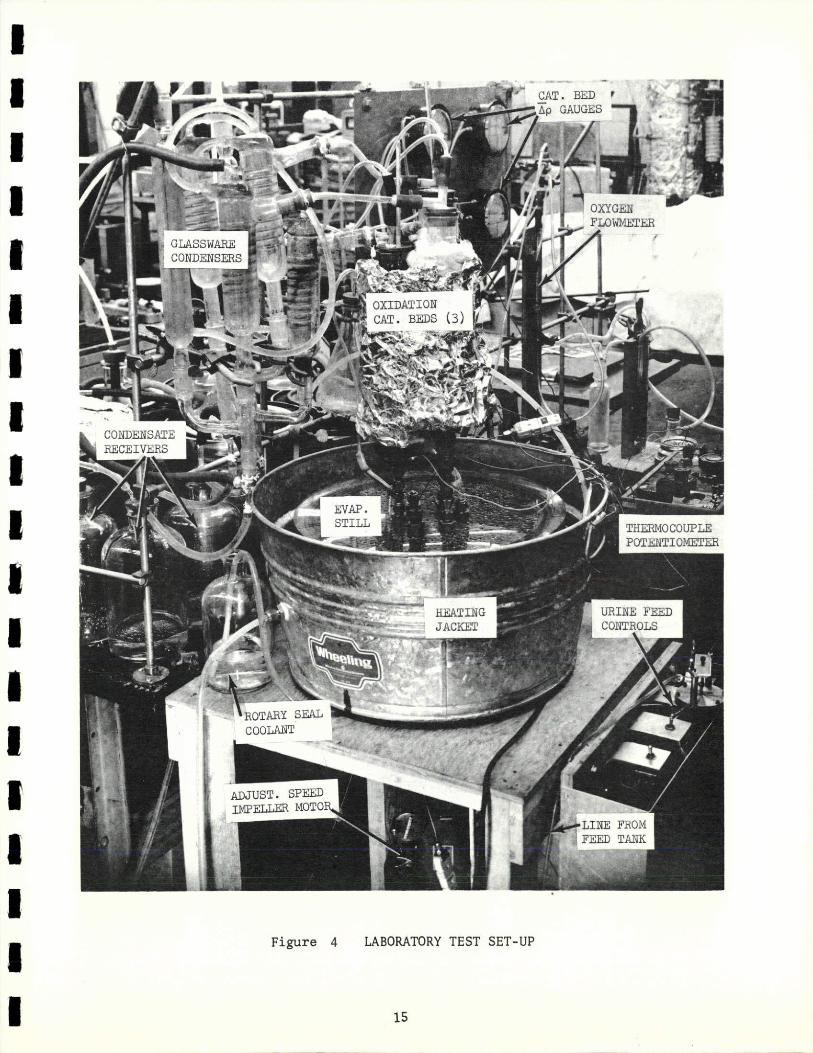
corrosion resistant. Figure 3 is a schematic representation of the test set-up
and shows the relationship of the components as well as the flow path of the
vapors. Figure 4 is a photograph of the entire system.
The evaporator was a 39-cm (15-3/8-inch) diameter by 19.7-cm (7-3/4-inch)
high stainless steel cylinder with a 0.8-mm (1/32-inch) thick wall; the cylinder
was flanged on both ends. The bottom flange was gasketed and bolted to a plate
which also served as a mount for the impeller drive motor, shaft seal, bearings,
and supports. The flanged top of the evaporator was covered by a transparent
Lexan plate. The internal impeller had four identical vanes; there was approxi-
mately a 12.7-mm (1/2-inch) clearance between the vanes and the evaporator wall.
A variable speed motor rotated the impeller through a water-jacketed dynamic
shaft seal.
Two oxidation catalyst beds were mounted directly above the Lexan plate;
one bed contained catalyst, while the other was empty and served as a control
reference. Each bed was heated by an external wrap-around tape heater and con-
trolled by a variable voltage transformer. A differential pressure gauge was
connected at the inlet and outlet of each bed. The pressure differential indi-
cated on each gauge served as a relative indicator of the instantaneous vapor
flow rate through the respective bed. Oxygen flow for the beds was controlled
by a fine needle valve and measured with a glass tube rotameter; the oxygen
GENERAL AMERICAN RESEARCH DIVISON
11
Page 20
TABLE I
LABORATORY TEST COMPONENTS
COMPONENT FUNCTION MODEL MANUFACTURER
Evaporator Evaporation --- GARD-Fabricated
Heating Jacket Supply heat to the ---
evaporator wall GARD-Fabricated
Adjustable Speed To drive the JK1 Zero-Max
Drive Motor impeller blades
Ice Bath To act as areference for thepotentiometer
Rotary Seal --- --- Syntron Division,FMC Corporation
Condensate To collect con- ---
Receivers densate deliveredfrom the condensers
Glassware To condense water
Condensers vapors
Catalyst Bed To oxidize organic --- GARD-Fabricated
material to CO2 , H20
Oxygen Flow- To monitor 02 flow 1906D Fisher-Porter Company
meter to catalyst
Thermocouples To monitor evapo- Type K
rator liquid and
vapor termperatures
Potentiometer To give readout from 2730 Rubicon Instruments
thermocouples
Magnehelic To monitor pressure 2005C Dwyer Instrument Co.
drop across beds
Dry Ice-Acetone To condense vapors
Trap not condensed byglassware condensers
Urine Metering Monitors the amount --- GARD-Fabricatkd
Control of urine to be addedfor each timer cycle
GENEVRAL AMERICAN RESEAMC9H IVISION
12
Page 21
TABLE I
LABORATORY TEST COMPONENTS(Concluded)
COMPONENT FUNCTION MODEL MANUFACTURER
Variac To adjust power 236 Superior Electric Co.
to catalyst bed Powerstatand heating jacket
Duoseal Vacuum To pull vacuum 1502 Welch Scientific Co.
Pump
Recirculating To circulate H 0 3052 Lab Line Instrument Co.
Water Bath through H20 jacket
Submersion Heater To provide heat
to recirculatingH20 bath
Chiller Supply coolant CFF50A Remcor Products
for condensers
Pressure Switch To control liquid 1822 E. W. Dwyer Manufacturirg
level by sensing CompanyAP
Absolute and Monitor pressure in --- Manostat Corporation
Differential evaporatorManometer
Manometer Monitor pressure --- Sargent-Welch
in condenser
Feed Solenoid To allow urine 803436 ASCO
Valve feed from meter-ing control
Repeat Cycle Control ON-OFF --- Industrial Timer Corp.
Timer activity of feedsolenoid valve
Pilot Strip To plug in all --- Cole Palmermajor supportingelectrical equip-ment
Thermocouples To monitor water --- ---
jacket, ambient,and catalysttemperatures
GENERAL AVIERICAN RESEARCH IVISON
13
Page 22
Oxygen Flow Empty Unheatedfor Catalyst \Reactor Shell /-Catalyst Bed
Liquid LevelSwitch
Bleed Air P-HeatingSP Liquid -- - Return
M I I ondensei
rI -* Return
SEvaporator- coolant
2 Condensate i - To VacuumCondensate Pump
0 TReceiver-
Li Impellern Vane
Timer
SMetering Feed Condensate from -CondensateControl Catalytically from
Treated Vapor UntreatedVapor
Urine Storage MEASUREMENTS
Tank T - TemperatureP - Absolute Pressure
&P - Differential PressureW - Flow Rate
Figure 3 LAB TEST FLOW DIAGRAM
Page 23
.CAT. BEDs Ap GAUGES
rI
OXYGEN
GLASSWARECONDENSERS
OXIDATIONcAT. BES (3)
SONDENSATERECEIVERS
I STILL T
ING URINE
JACKET CONTROLS
ROTARY SEALCOOLANT
IADJUST. SPEED
Figure 4 LABORATORY TEST SET-UP
15
Page 24
entered both through the top of the still and through the liquid-level sensing
system.
The liquid level control system consisted of a differential pressure
switch measuring the head of liquid in the still, a metering pump, and a timer.
One leg of the pressure switch connects to the vapor space in the evaporator;
the other leg is submerged in the rotating body of liquid. Oxygen is fed into
the evaporator through the submerged leg, and the difference in pressure be-
tween the vapor space and oxygen feed line actuates the switch. The switch al-
lows the metering pump to feed approximately 100 cc of liquid at a given time
interval determined by the timer setting. Feed liquid enters the evaporator
at fixed intervals; however, if the level gets too high, the pressure switch
cuts off power to the metering pump until the level drops to the desired level.
Operation of this system is independent of ambient gravity levels.
A circulating water bath provided the thermal input to the-heat transfer
jacket. The open top jacket was constructed from 50.8-cm (20-inch) galvanized
tub which was modified to attach to the bottom plate of the still.
Individual condensers and condensate receivers were connected to each
catalyst bed to permit measurement and analysis of the condensate from each
bed. The condensers were cooled by a water-glycol loop connected between the
condensers and a small chiller. A laboratory vacuum pump was used for system
pumpdown and to purge the noncondensable gases during operation.
Process temperatures were measured with mercury thermometers and/or
thermocouples connected to a potentiometer. Absolute mercury manometers were
connected to the vapor discharge line from the still and to the vacuum purge
line from the condensers to indicate evaporator and condenser absolute
pressures.
GENERAL AMERICAN RESEARCH DVISION
16
Page 25
3.1.2 Test Procedures
All urine processed was collected from male in-plant personnel in
approximately one-liter containers. Prior to setting out the collection
flask, a 4-cc volume of chemical pretreatment was placed in it. Within 3 to
4 hours of the time the flask was set out, it was returned to the laboratory
and the contents emptied into the urine feed tank.
The chemical pretreatment was a 4:1:4 mixture by weight of sulfuric
acid, chromium trioxide, and distilled water. This particular pretreatment
mixture has been used previously by GARD and other water recovery investiga-
tors and functions satisfactorily to inhibit biological decomposiiton of
urea. (Without a suitable inhibitor, urea, the principle organic compound
in urine, would decompose and give off unacceptable amounts of ammonia.)
At the initiation of the test, it was planned to mix an antifoam
compound with the pretreatment acid at the time the acid was prepared and
store this mixture in a single container. The intent was to make only one
addition of pretreatment to the urine prior to distillation. In actual
practice, however, the antifoam compound did not readily mix with the
acid and it was necessary to separately treat the fresh urine with acid
and with antifoam.
The laboratory test unit was operated approximately 8 hours/day during
the normal working days of the week. During overnight and weekend shut-
downs the still was repressurized to atmospheric pressure. At the beginning
of each run, 1 cc of Dow Corning H-10 antifoam compound, diluted into
50 cc of water, was injected into the liquid within the still. As the tests
progressed, additional antifoam was added during a run to reduce the amount
of foam in the vapor space in the evaporator. Process measurements were
GENERAL AMERICAN RESEARCH DIVISION
17
Page 26
taken and recorded at 3 to 4 hour intervals. Water samples for evaluating
catalyst bed performance were obtained at the end of each day and represented
the entire day's run. The performance of the catalyst bed was assessed by
analyzing daily samples of condensate collected before and after the bed for
total carbon, total organic carbon, pH, ammonia, conductivity, and turbidity.
3.2 Laboratory Test Results
3.2.1 Distillation Test Results
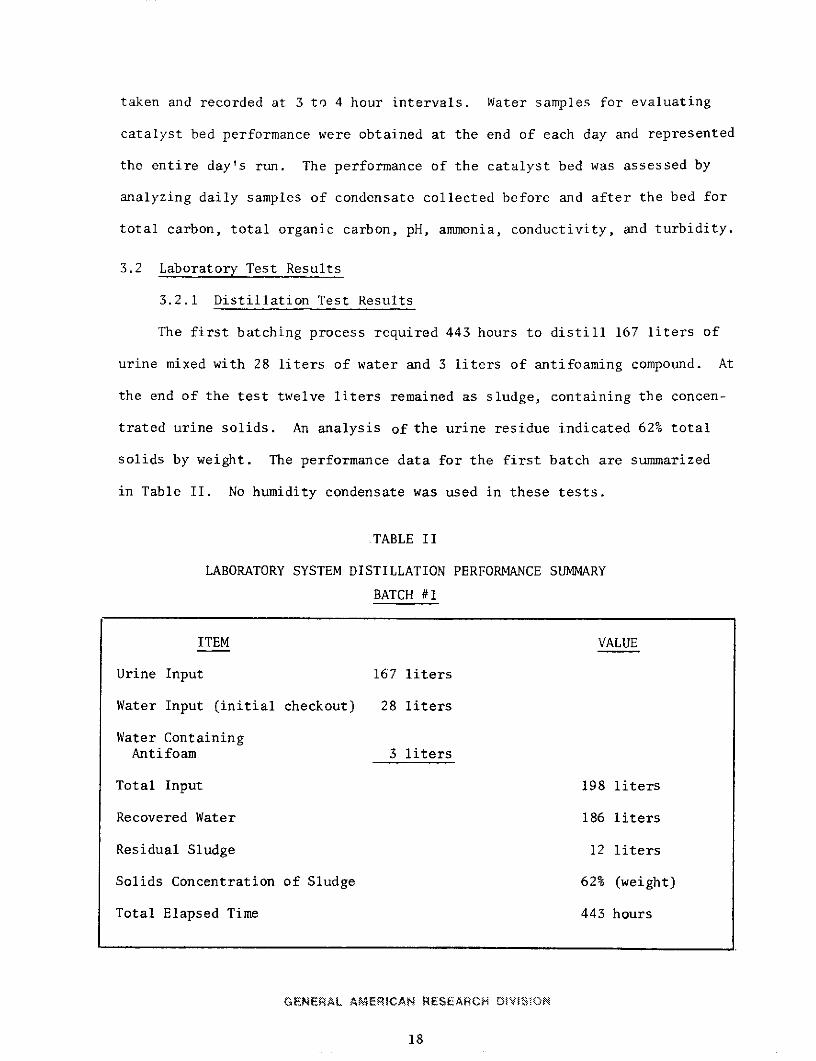
The first batching process required 443 hours to distill 167 liters of
urine mixed with 28 liters of water and 3 liters of antifoaming compound. At
the end of the test twelve liters remained as sludge, containing the concen-
trated urine solids. An analysis of the urine residue indicated 62% total
solids by weight. The performance data for the first batch are summarized
in Table II. No humidity condensate was used in these tests.
TABLE II
LABORATORY SYSTEM DISTILLATION PERFORMANCE SUMMARY
BATCH #1
ITEM VALUE
Urine Input 167 liters
Water Input (initial checkout) 28 liters
Water ContainingAntifoam 3 liters
Total Input 198 liters
Recovered Water 186 liters
Residual Sludge 12 liters
Solids Concentration of Sludge 62% (weight)
Total Elapsed Time 443 hours
GENERAL AMERICAN RESEARCH DVISiON
18
Page 27
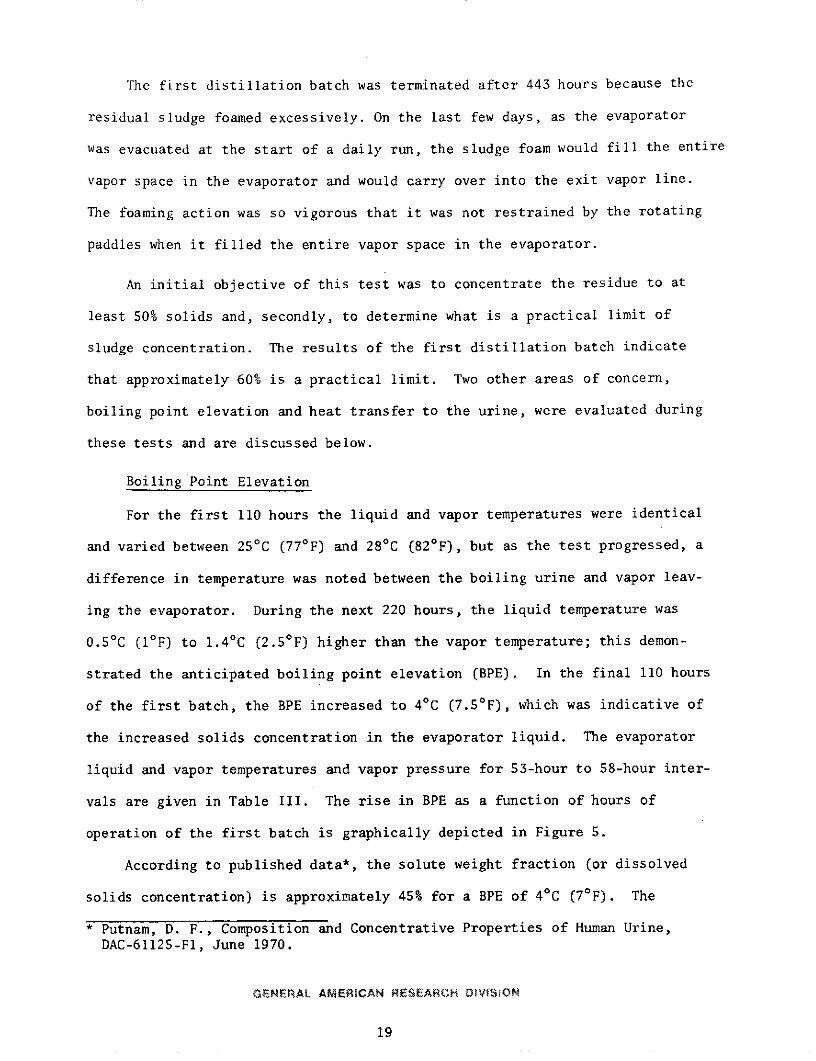
The first distillation batch was terminated after 443 hours because the
residual sludge foamed excessively. On the last few days, as the evaporator
was evacuated at the start of a daily run, the sludge foam would fill the entire
vapor space in the evaporator and would carry over into the exit vapor line.
The foaming action was so vigorous that it was not restrained by the rotating
paddles when it filled the entire vapor space in the evaporator.
An initial objective of this test was to concentrate the residue to at
least 50% solids and, secondly, to determine what is a practical limit of
sludge concentration. The results of the first distillation batch indicate
that approximately 60% is a practical limit. Two other areas of concern,
boiling point elevation and heat transfer to the urine, were evaluated during
these tests and are discussed below.
Boiling Point Elevation
For the first 110 hours the liquid and vapor temperatures were identical
and varied between 250C (770 F) and 280C (820 F), but as the test progressed, a
difference in temperature was noted between the boiling urine and vapor leav-
ing the evaporator. During the next 220 hours, the liquid temperature was
0.50C (10F) to 1.40 C (2.50 F) higher than the vapor temperature; this demon-
strated the anticipated boiling point elevation (BPE). In the final 110 hours
of the first batch, the BPE increased to 40C (7.50 F), which was indicative of
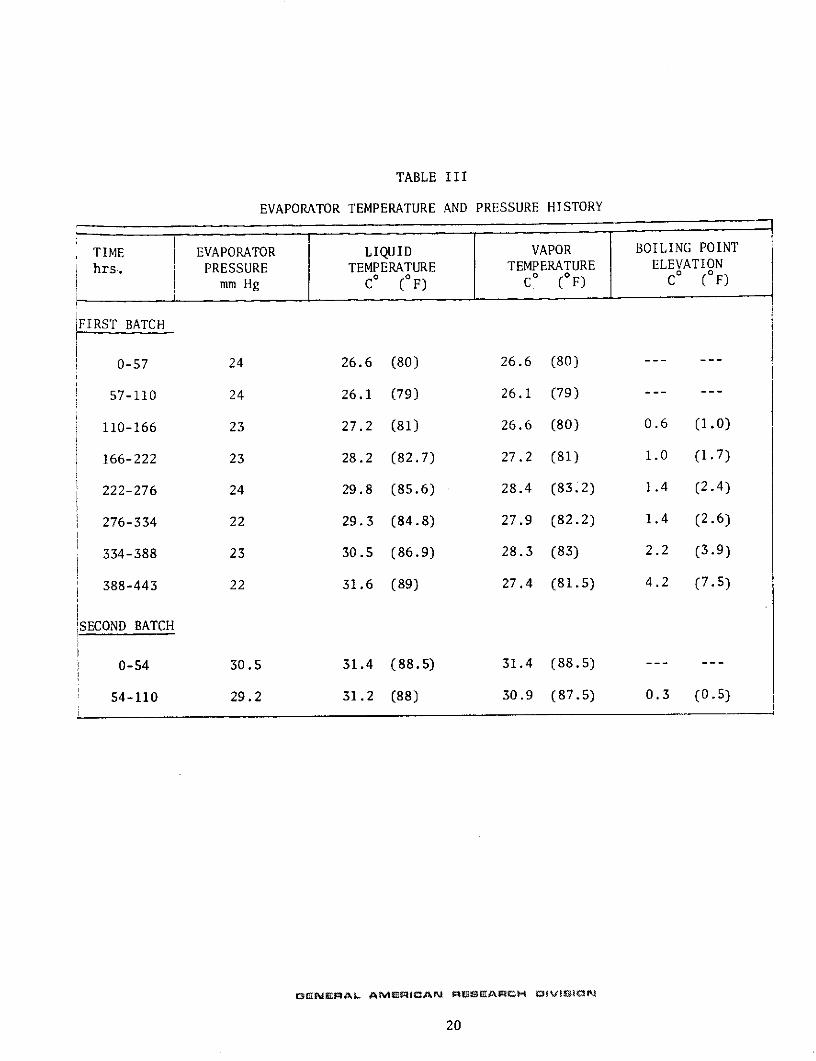
the increased solids concentration in the evaporator liquid. The evaporator
liquid and vapor temperatures and vapor pressure for 53-hour to 58-hour inter-
vals are given in Table III. The rise in BPE as a function of hours of
operation of the first batch is graphically depicted in Figure 5.
According to published data*, the solute weight fraction (or dissolved
solids concentration) is approximately 45% for a BPE of 40C (70 F). The
* Putnam, D. F., Composition and Concentrative Properties of Human Urine,DAC-61125-Fl, June 1970.
GENERAL AMERICAN RESEARCH DIVISION
19
Page 28
TABLE III
EVAPORATOR TEMPERATURE AND PRESSURE HISTORY
TIME EVAPORATOR LIQUID VAPOR BOILING POINT
hrs. PRESSURE TEMPERATURE TEMPERATURE ELEVATION
mm Hg C0 (OF) C0 (OF) C0 (oF)
FIRST BATCH
0-57 24 26.6 (80) 26.6 (80) --- ---
57-110 24 26.1 (79) 26.1 (79)
110-166 23 27.2 (81) 26.6 (80) 0.6 (1.0)
166-222 23 28.2 (82.7) 27.2 (81) 1.0 (1.7)
222-276 24 29.8 (85.6) 28.4 (83.2) 1.4 (2.4)
276-334 22 29.3 (84.8) 27.9 (82.2) 1.4 (2.6)
334-388 23 30.5 (86.9) 28.3 (83) 2.2 (3.9)
388-443 22 31.6 (89) 27.4 (81.5) 4.2 (7.5)
SECOND BATCH
0-54 30.5 31.4 (88.5) 31.4 (88.5) ---
54-110 29.2 31.2 (88) 30.9 (87.5) 0.3 (0.5)
GENERAL AMERICAN RSEAICZH IWVISION
20
Page 29
4.2
Boi lingPointElevation
(0C)1.4 --
1ii10 334 443
Test Duration, (Hours)
Figure 5 BPE vs. DURATION OF TEST
actual concentration of total solids was 62%. When the evaporator was drained
after the first batch, it was noted that approximately 1.27 cm of precipitate
covered the entire bottom of the evaporator. This precipitate was mixed into
the residue drained from the evaporator and was included as part of the sam-
ple that was analyzed for total solids. Presumably, the precipitated solids
in the residual sludge account for the difference between the 45% solids lev-
el expected for a 4cC BPE and the 62% solids actually measured.
When the second distillation batch was started with fresh urine, the li-
quid and vapor temperatures returned again to equal values--with no elevation
of boiling point--for the first 54 hours. During the next 56 hour interval a
slight boiling point elevation of 0.3')C was observed.
Overall Heat Transfer Coefficient
An objective of the distillation tests was to determine the overall heat
transfer coefficient from the liquid heating jacket to the boiling urine and
also to determine the variation of this coefficient as a function of hours of
operation. It was found that the overall heat transfer coefficient remained
essentially constant near 36.7 cal/hr-cm2-_c (75 BTU/hr-ft2-cF) for the dura-
tion of the tests.
GENERAL AMERICAN RESEARCH DIVSZON
21
Page 30
The distillation rate, temperature difference (AT) for heat transfer, and
overall heat transfer coefficient are given in Table IV for approximately 55-
hour increments of the test duration. As the test progressed, the AT from
heating fluid to urine decreased from a high value of 6.4 C (11.5 F) near the
beginning of the test to a low value of 3.8 C (6.9 F) near the end of the test.
Of significant note, the recovery rate varied in direct proportion to this AT,
which indicates that the overall heat transfer coefficient remained essentially
constant. The AT and distillation rate decreased mainly because the method
of controlling heat input in the lab unit depended on control of the tempera-
ture level of the liquid heating jacket.
During the normal batch evaporation process, as the urine liquid temper-
ature increases due to boiling point elevation, the available temperature dif-
ference for heat transfer decreases (assuming that both the evaporator pres-
sure and liquid heating jacket temperature remain constant). To maintain a
constant distillation rate the method of control should measure the AT be-
tween the evaporating liquid and the heating jacket rather than the tempera-
ture level of the heating jacket. On the basis of these tests, it appears
that a AT-actuated control should be used to maintain the distillation rate
on a full-scale system.
During the second distillation bath of 110 hours, the overall heat trans-
fer coefficient remained essentially constant near 36.7 Cal/hr-cm2-oC (75 Btu/
hr-ft2- F). The average distillation rate of 5.2 cc/min and average AT of
3.80C was lower than for the corresponding 110 hours of the first batch. The
lower AT was probably due to carryover of foam in the vapor exit tube near
the end of the first batch.
GENERAL AMERICAN RESEARCH DIVISION
22
Page 31
TABLE IV
DISTILLATION HEAT TRANSFER COEFFICIENT vs. TEST DURATION
(1) (2)TIME DISTILLATION RATE AT2 Uhrs. cc/min UC (cF) cal/hr-cm -C (BTU/hr-ft -
IRST BATCH
0-57 8.9 5.6 (10.0) 43.0 (88)
57-110 8.8 6.4 (11.5) 37.7 (77)
110-166 7.1 5.0 (9.0) 38.2 (78)
166-222 7.5 5.4 (9.7) 37.7 (77)
222-276 7.3 4.9 (8.9) 39.6 (81)
276-334 5.8 4.2 (7.6) 37.2 (76)
334-388 5.5 3.8 (6.9) 38.6 (79)
388-443 5.3 3.9 (7.0) 36.7 (75)
SECOND BATCH
0-54 5.5 3.9 (7.0) 38.2 (78)
54-110 4.9 3.6 (6.5) 36.7 (75)
1Temperature difference between liquid jacket and boiling urine.
2Overall heat transfer coefficient from liquid jacket to boiling urine.
GENERAL AMERICAN RESEARCH DOI)iN
23
Page 32
The foam carryover apparently caused partial blockage in the oxidation
catalyst bed; the required pressure differential for transporting vapor from
the evaporator to the condenser was higher at the beginning of the second
batch than in the first batch. The pressure drop through the catalyst bed was
the operating parameter which limited the distillation rate rather than the
temperature difference between heating jacket and evaporator liquid as in the
first batch.
If the evaporator vapor pressure and temperature were allowed to increase
further, the pressure differential between evaporator and condenser would in-
crease and, as a result, the distillation rate could be increased. However,
the vapor temperature in the evaporator would then be higher than ambient tem-
perature and some of the generated vapor would condense within the evaporator
and then need to be re-evaporatored again. Under these conditions the actual
evaporation rate would be higher than the recovery rate. The calculations ne-
cessary to determine the overall heat transfer coefficient required that the
evaporation rate be known. Since evaporation rate cannot be measured easily,
but recovery rate is the same as evaporation rate if there is no refluxing of
generated vapor within the evaporator, the recovery rate was measured and as-
sumed equal to evaporation rate. Thus, an operational restraint to avoid re-
fluxing was to maintain the evaporator pressure below 30 mm Hg absolute cor-
responding to a saturation pressure of 29CC (850 F).
3.2.2 Evaluation of Mechanical Features
The rotating impeller functioned adequately to keep the main body of li-
quid in motion. When the evaporator was drained after the first batching pro-
cess, the boiling surface was free of scum and solids build-up.
GENERAL AMERICANl RSEARCH DiViSiO
24
Page 33
The feed control and liquid level sensing system functioned satisfactorily.
Near the end of the first batch, the sensing line and the feed line became
plugged with urine solids, which settled out during overnight shutdown. The
small line sizes and their vertical orientation were factors that contributed
to the plugging.
Initially, the rotating impeller was driven through a rotary shaft seal.
An assembly drawing of the rotary seal test configuration is shown in Figure 6.
During testing, the rotary shaft seal assembly failed at the connection that
seals the rotating shaft to the rotating seal face. Upon disassembly and re-
pair, it was observed that a small slice into the rubber connection allowed
gross leakage of seal coolant (water at atmospheric pressure) into the vacuum
evaporator. From the nature of the seal defect, it appeared that the defect
could have been initiated during assembly of the seal on the shaft. On numer-
ous occasions there was sporadic leakage of the seal coolant into the evapora-
tor.
Because of these problems the impeller drive for the laboratory unit
was changed from a rotary seal system to a magnetic coupling. With the mag-
netic drive assembly a static barrier exists between the external drive and the
internal impeller and its support bearings inside the vacuum chamber. An
assembly drawing of the magnetic drive for the lab system is shown in Figure
7. After converting to the magnetic drive, the lab system was operated for
218 hours without apparent problems in the drive. As anticipated, the impel-
ler speed had to be increased gradually from rest to normal rotation speed
to prevent the magnets from uncoupling.
GENERAL AMERICAN RESEARCH DIVVSON
25
Page 34
CLEAR PLAST/C .COVEe2 IMPELLEC VAAIE4)WELDED T SA4F7T
V/APO OUTLET
//EAT/A/5 JACEr
VACUUM S/-LL WALL
1MFAPLLE SAF7-
Se4 SE R A TE
TDYA 4/IC S14FT zE4L
1/VPELLE' BEAR11JGS
S//AFT COUPLIA/TO 41TO S
Foicgo Mouv6rLG UOACSET
Figure 6 LAB DISTILLATION UNIT WITH ROTARY SHAFT SEAL
Page 35
CLEAP -L/C CCVE -4/ CL'D S/GE
Iv/PLLEk' VAA/E (4) 27/IPELLEP? E-EA-hAGS ,~-I///FLLEE h/L/B
/P T /-D IVEII ,AIA IJETVIPO F CUTLET
-- -d'&I- /,4GAE TICS7T 4IC SEAL PLATE
--- /ET//i6 JCA~.ET
2- VAui4 STLL WALL
MAE/e BACPLATE
ri
D iicaL EAC YET
t - A sICE PLATE PAE
/F C5UPL/E PLATE
Figure 7 LAB DISTILLATION UNIT WITH MAGNETIC COUPLING
Page 36
3.2.3 Oxidation Catalyst Test Results
The vapors from the lab distillation unit were passed through a proprie-
tary catalyst bed to evaluate the catalyst's ability to promote oxidation of
the trace contaminants in the distillate vapor. The catalyst evaluation was
conducted under company sponsorship. The distillation system was operated
for 443 hours with urine feed; 86 liters of condensate recovered from the va-
por were passed through this catalyst bed during the first batching process.
The daily analyses of the product water and pertinent operating parameters of
the system are given in Table V.
The contaminant concentration level in the condensate collected from ca-
talytically treated vapor was directly affected by the quantity of oxygen flow
to the bed. By experimentally varying the oxygen flow, it was determined that
150 cc/min (STP) was required for a six-man urine distillation rate, with dis-
tillation at 32uC (901F).
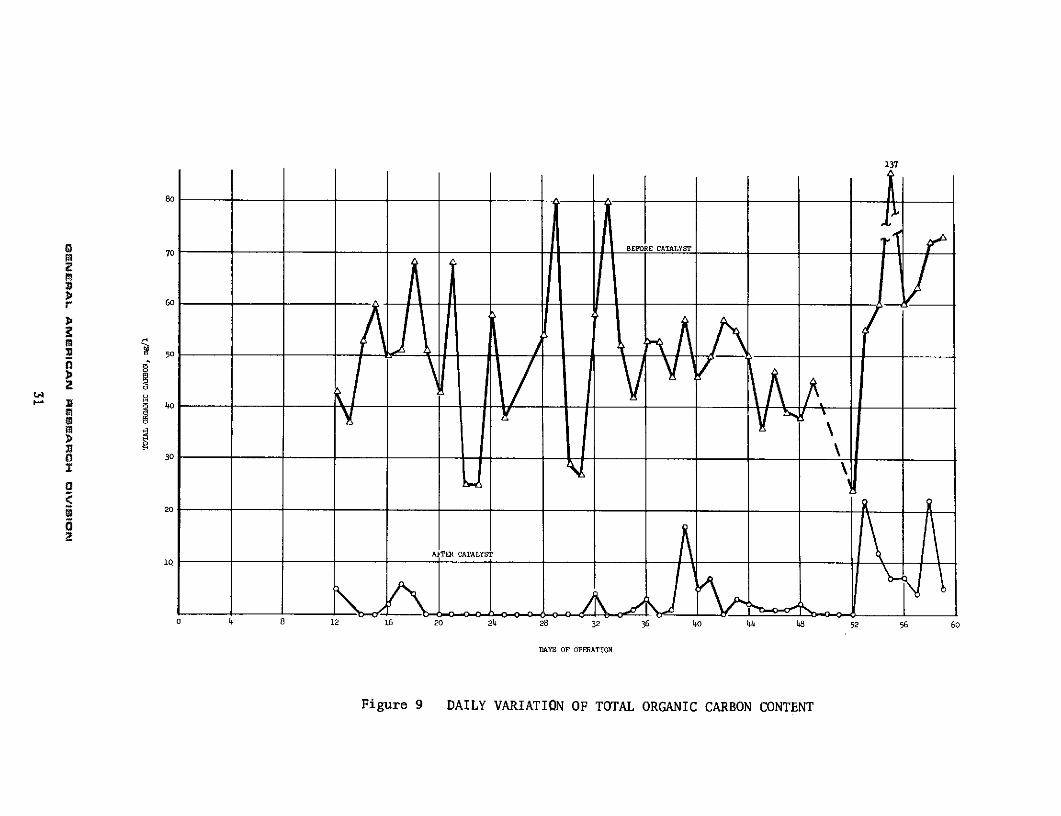
The daily variation of total carbon (TC) and total organic carbon (TOC)
content is shown in Figures 8 and 9 respectively. The carbon containing
contaminants are primarily organic carbon compounds in the condensate collect-
ed from raw vapor. Both TC and TOC concentration are reduced in the conden-
sate from catalytically treated vapor, but the TC content is higher than TOC.
Apparently some of the carbon containing compounds are converted to carbonates
and possibly dissolved CO2 which then appear as inorganic carbon in the water.
The most significant result, however, is that TOC concentration is reduced to
a very low and acceptable level.
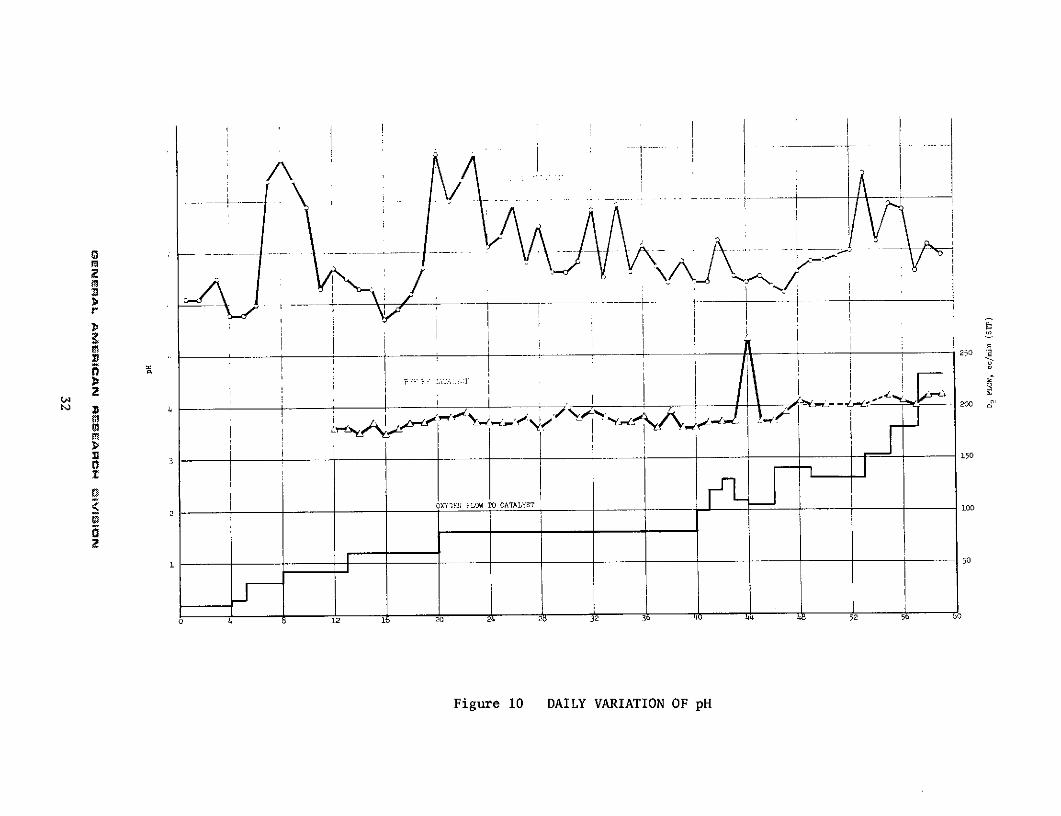
Figures 10 and 11 illustrate the daily fluctuations of pH and ammonia
concentration, respectively. These are discussed together because their
fluctuations seem to be related; also, the pH and ammonia concentrations after
CGENERAL AMERICAN RESEARCH DIVISIN
28
Page 37
TABLE V
OXIDATION CATALYST TEST PARAMETERS AND TEST RESULTS
TOTAL
TEMPERATURE PRESSURE TOTAL CARBON ORGANIC CARBON pH AMMONIA CONDUCTIVITY TURBIDITY
HEATING EVAP. EVAP. CATALYST BEFORE AFTER BEFORE AFTER BEFORE AFTER BBEFORE AFTER BEFORE AFTER BEFORE AFTER
SAMPLE DATE AMBIENT BATH LIQUID VAPOR BED EVAP. COND. CATALYST CATALYST CATALYST CATALYST CATALYST CATALYST CATALYST CATALYST CATALYST CATALYSI CATALYST CATALYST
NUMBER (1971) *F F °F -F -F mHg mmHg mg/i mg/l g/i mg/l mg/l mg/l mhos mhos JTU JTU
1 9/16 77 90 81 73 127 26 15 -- 6 -- -- -- 6.1 -- 0 -- 10 -- .4
2 9/17 -- -- -- -- -- -- -- -- 3 -- -- -- 6.1 -- 0 -- 15 -- .6
3 9/20 80 89 77 77 68 24 5 -- 4 .. .. -- 6.4 -- -- 9 -- .5
4 9/22 82 89 79 79 o09 23 5 -- 1 -- -- -- 5.8 -- 0.5 -- 14 -- .6
5 9/23 81 90 81 81 114 24 5 -- o -- -- -- 5.8 -- 1.2 -- 15 -- .4
6 9/24 75 89 80 80 101 22 5 -- o -- -- -- 6.0 -- .5 -- 15 -- .4
7 9/27 78 91 81 81 98 25 4 -- 12 -- -- -- 8.4 -- 7.5 -- 45 -- .3
8 9/28 79 90 81 81 111 25 4 -- 33 .. -- -- 8.8 -- 118 -- 85 -- .5
9 9/29 76 91 82 82 114 26 12 -- 22 -- -- -- 8.4 -- 7.3 -- 58 -- .7
10 9/30 80 90 -- -- 115 25 8 -- -- -- -- -- 7.9 -- 0 -- 56 -- .4
11 10/1 80 91 79 79 109 25 8 -- -- .. .. -- 6.3 -- 2.5 -- 40 -- .2
12 10/4 75 90 79 79 101 25 8 43 17 43 5 3.6 6.7 0 3.5 120 34 3.5 .2
13 10/5 75 90 78 78 120 24 7 37 0 37 0 3.6 6.5 0 3.6 130 22 2.0 .2
14 10/6 81 88 77 77 124 23 7 53 4 53 0 3.5 6.3 1.0 1.0 150 13 1-.3 .3
15 10/7 83 91 78 78 120 24 7 60 3 60 2 3.7 6.3 0 1.5 150 11 25 .5
16 10/8 78 94 81 81 110 26 8 50 10 50 0 3.5 5.7 0 0 160 12 1.3 .9
17 10/13 73 90 80 80 129 24 6 51 10 51 6 3.6 5.9 2.5 .8 160 14 2.0 .8
18 10/14 74 91 82 81 150 24 7 68 12 68 4 3.7 6.2 7.8 5.5 190 43 13 .6
19 10/15 76 90 83 81 125 23 7 51 0 51 0 3.7 6.7 1.1 4.0 200 44 4.8 1.0
20 10/18 77 88 80 78 120 21 5 43 8 43 0 3.8 8.9 2.2 7.9 210 41 24 2.0
21 10/19 75 89 81 80 135 23 6 68 0 68 0 3.8 8.0 3.4 8.6 390 66 32 -5
22 10/20 79 91 -- -- 123 23 6 25 2 25 0 3.9 8.4 1.2 5.8 85 37 2.0 .6
23 10/21 75 88 76 75 132 21 7 25 8 25 0 3.7 8.9 0 6.0 80 33 2.0 .4
24 10/22 72 90 81 80 134 22 7 58 0 58 0 3.7 7. 1 1.5 7.7 340 60 13 .4
25 10/25 79 94 84 83 137 24 7 38 0 38 0 3.7 7.3 0.3 4.3 110 42 3 1.0
26 10/26 76 94 82 79 137 24 9 -- 0 -- O 3.7 7.9 2.6 3.5 -- 37 11 .8
27 10/27 75 92 84 81 134 24 9 -- 0 -- 0 3.8 6.8 -- 3.0 -- 36 6.5 1.0
28 10/28 77 92 84 82 134 23 8 54 o 54 o 3.6 7.5 1.8 4.0 140 26 1.5 1.2
29 10/29 75 92 82 80 141 22 8 -- 0 -- 0 3.8 6.6 -- 2.8 -- 31 10 1.2
30 11/1 76 89 81 81 134 21 7 29 5 29 0 4.0 6.6 1.0 2.0 -- 29 1.0 1.3
31 11/2 77 92 83 81.5 134 21 7 27 0 27 0 3.8 6.8 0 3.8 100 36 2.2 .7
32 11/4 76 92 83 81.5 123 23 7 58 6 58 4 3.9 7.8 1.7 2.4 150 22 1:2 .7
33 11/5 81 94 84 81.5 135 22.5 8 80 0 80 0 3.8 6.5 2.4 2.8 300 32 .6 .5
34 11/8 76 93 86.5 83.5 150 24.5 -- 52 0 52 0 3.7 7.9 0.5 4.0 150 42 .6 .8
35 11/9 76 93 84.5 82 143 23 7 42 5 42 1 3.7 6.6 0 2.8 170 30 .3 .8
36 11/10 78 94 85.5 83 134 24.5 7 53 3 53 3 3.8 7.1 0.3 2.8 110 26 .3 .9
37 11/11 75 96 85 84 143 24.5 7 53 0 53 0 3.6 6.7 0 2.5 130 20 .3 .-9
38 11/12 75 94 85 83.5 136 24 7 38 1 38 1 3.9 6.4 0 4.0 120 43 .3 .8
39 11/15 82 98 88.5 85 141 25.5 7 57 13 57 11 3.6 6.8 0 5.5 115 52 .3 .8
40 11/16 82 92 84.5. 82.5 146 21 6 46 13 46 5 3.6 6.4 0 3.3 110 30 .5 1.3
41 11/17 82 90 83.5 81 150 20.5 6 50 13 50 7 3.7 6.4 0 2.5 100 28 .2 .9
42 11/18 80 96 87 84.5 139 24 7 57 13 57 0 3.7 7.2 0 2.5 100 32 .3 -7
43 11/19 79 91 84.5 82.5 142 23.5 7 55 5 55 3 3.7 6.5 0 3.9 110 32 . 3 1.o
44 11/22 78 92 84.5 83 138 22 7 50 17 50 2 5.3 6.4 0 3.0 26 30 .7 .9
45 11/24 78 96 87 84.5 137 23. 5 7 36 1 36 1 3.7 6. 5 0 3.3 100 30 .3 .9
46 11/29 79 92 83. 5 82 134 21. 5 6 47 9 47 1 4.0 6.3 1.4 3.7 100 31 .3 .6
47 11/30 78 90 84 82 150 21 6 39 5 39 1 3.9 6.2 1.0 2.8 82 32 .2 .4
48 12/2 80 92 83.5 80.5 134 20 7 38 6 38 2 4.0 6.6 1.0 2.7 -- 50 .2 .5
49 12/6 -- - -- -- -- -- -- 45 7 45 0 4.0 6.8 1.1 4.1 -- 49 1.4 .8
50 12/8 78 97 88.5 83.5 152 23.5 14 40 3 40 0 4.0 6.8 5.0 2.0 -- 62 .8 .8
51 12/9 80 93 85.5 83 160 23.5 9 40 10 40 0 -- 6.9 -- 6.0 -- 60 -- .5
52 12/10 81 92 89 83.5 148 24 15 24 1 24 0 4.0 7.0 0.2 2.1 75 54 .5 .6
53 12/13 79 95 88 83.5 141 22 7 55 28.5 55 22 4.b 8.5 o 3.2 72 48 .5 .9
54 12/14 79 98 -- -- 140 26 7 60 35 60 12 -- 7.2 -- 1.0 -- 55 -- .7
55 12/15 82 102 92.5 88 146 26 7 137 11 137 7 4.2 7.9 7.5 2.3 510 36 5.5 .6
56 12/16 80 94 87 83 153 21 7 60 24 60 7 4.1 7.8 0 2.0 84 40 1.8 1.0
57 12/17 79 96 88 80.5 155 21 10 63 19 63 4 4.0 6.6 1.0 o 78 50 .5 .6
58 12/20 78 94 87.5 80 160 19 7 72 25 72 22 4.2 7.1 -- -- 78 48 .7 1.0
59 12/21 78 94 1 -- -- 155 20 7 73 32 73 5 4.2 6.9 .7 3.0 78 42 .7 3.0
GENERAL AMERICAN RESEARCH OIVIBION
29
Page 38
90
BEOECATALYST
• 70 i
r I
i560
rn 0
o 2 I
m E 4o
o 3 0 \
220
10 __________
0 4 8 12 16 20 24 28 32 36 40 44 48 52 56 60
DAYS OF OPERATION
Figure 8 DAILY VARIATION OF TOTAL CARBON CONTENT
Page 39
2
0
030
220
AFTER CATALYST10
4 8 12 16 20 24 28 32 36 40 4 48 52 56 6
DAYS OF OPERATION
Figure 9 DAILY VARIATION OF TOTAL ORGANIC CARBON CONTENT
Page 40
m- N
--- - , !---~
m _ _ 0
Fu 1 D I i I i
OXf3Ki . 3W TO CATAL I 10 0 oL= I j
12 20 32 52
Figure 10 DAILY VARIATION OF pH
Page 41
200
150
SOXYGE FLOW TO CATALYST
S010
2
m
( Jr 12 50
I
m
0 4 8 12 16 20 24 28 32 36 40 44 48 52 56 60
DAYS OF OPERATION
Figure 11 DAILY VARIATION OF AMMONIA CONTENT
Page 42
treatment were generally higher than before treatment. This phenomenon is not
readily explainable; it is known that it would not be possible to generate am-
monia within the catalyst bed since it does not have any nitrogen or hydrogen
containing compounds. It is possible that vapors or entrained mist contained
compounds which were converted to ammonia by reaction or decomposition within
the catalyst bed. This mechanism would have the effect of raising the ammonia
concentration in the vapor passing through the catalyst.
Oxygen flow rate to the catalyst during system operation is also included
on these figures since it appeared to have a relation to the concentration of
ammonia in the condensate from catalytically treated vapor.
Figure 12 illustrates the daily variations in conductivity of the con-
densate. While there is no specified limit of conductivity for potability, it
is generally desirable to have a conductivity value of less than 100 Pmhos.
The condensate collected from catalytically treated vapor was consistently be-
low 100 and generally below 40 vmhos.
The daily variation in turbidity is shown in Figure 13. The relatively
high values for days 12 through 30 for the condensate collected from raw vapor
are probably attributed to the fact that these samples stood for an extended
period of time before the particular analysis was conducted.
A summary of the catalyst performance in terms of the best, worst, and
averaged value during the first batch is presented in Table VI. This table
excludes the extreme values which occurred when foam carried over from the
evaporator near the end of the first batch.
After the still was drained, a second batch of fresh urine was distilled
for a short period. The vapors were again passed through the catalyst bed
GENERAL AMIERICAN RESEARCH 01V I N
34
Page 43
200 390
340 300 510
180
160
BEFORE CATALYST
140
120 tr / \
ER CATALYS
6o
f4o
20
o 4 8 12 16 20 24 28 32 36 40 44 48 52 56 60
DAYS OF OPERATION
Figure 12 DAILY VARIATION OF CONDUCTIVITY
Page 44
3230 27
20.0
17.5
2
S15.0
BE ORE CATALYS
0I
AFTER CATLYT
2.5
0 4 8 12 16 20 24 28 32 36 40 44 48 52 56 60
DAYS OF OPERATION
Figure 13 DAILY VARIATION OF TURBIDITY
Page 45
TABLE VI
CATALYST PERFORMANCE SUMMARY:FIRST DISTILLATION BATCH
BEST DAILY WORST DAILY AVERAGE FORCONDENSATE ANALYSIS
PERFORMANCE PERFORMANCE 443 HOURS
Total Carbon (mg/l)
Before catalyst 24 80 50After catalyst 0 36 6
Total Organic Carbon (mg/1)
Before catalyst 24 80 50After catalyst 0 33 3
pH
Before catalyst 3.5 5.3 4.0After catalyst 5.7 8.9 7.2
Ammonia (mg/l)
Before catalyst 0 7.8 1.0After catalyst 0 11.8 3.0
Conductivity (p mhos)
Before catalyst 72 390 140After catalyst 7 66 44
Turbidity (JTU)
Before catalyst .5 32 2After catalyst .5 3 1
GE6NERAL AMERICAN cRESEARCH 0iV§SN
37
Page 46
during 110 cumulative hours of operation, and 10.3 liters of condensate were
collected from vapors passed through the catalyst. Evaluation of the results
indicated the catalyst was still effective in reducing the concentration of
trace contaminants in the product vapor. A summary of catalyst performance is
presented in Table VII. There was no regeneration of the catalyst before
starting the second batch. During the entire operation of the distillation
system a total of 96.3 liters of condensate were collected from catalytically
treated vapor.
TABLE VII
CATALYST PERFORMANCE SUMMARY:SECOND DISTILLATION BATCH
BEST DAILY WORST DAILY AVERAGE FORCONDENSATE ANALYSIS
PERFORMANCE PERFORMANCE 110 HOURS
Total Carbon (me/l)
Before catalyst 19.0 146 55.0After catalyst 10.0 68 24.3
Total Organic Carbon (mg/l)
Before catalyst 19.0 146 55.0After catalyst 0.0 23 6.4
pH
Before catalyst 6.7 4.2 6.1After catalyst 6.7 9.3 7.5
Conductivity ( mhos)
Before catalyst 76 1000 259After catalyst 42 300 130
Turbidity (JTU)
Before catalyst 1.0 12.0 2.3After catalyst 0.5 0.9 0.8
GENERAL AMIIRICAN RESEARCH VISON
38
Page 47
SECTION 4
EVAPORATOR DEVELOPMENT
4.1 Design
The vacuum distillation/vapor filtration unit shown in Figure 1-2 was
designed in accordance with the general requirements for a six-man capacity
zero "g" evaporator and the detail requirements listed in Section 2.2.
4.1.1 Evaporator Size Determination
To insure the adequacy of the evaporator design, calculations were
made to determine tradeoffs between vacuum evaporator size, impeller speed,
and sludge removal intervals. Calculations were made to determine the thermal
energy requirement for a six-man recovery rate and to size the vapor and
sludge removal lines. The calculations are included in the Appendix and are
summarized as follows:
For 40 days batching duration,
Evaporator Diameter: 51.8 cm (20.4 inches)
Evaporator Height: 37.3 cm (14.7 inches)
Impeller Speed: 100 rpm is adequate for one-g demonstra-
tion of principle of operation.
Solids Concentrationat End of Batch: 40% by weight
Area for Evaporation: 2740 cm2 (2.96 ft2) based on calculated
boiling coefficient of (45 cal)/(hr cm2oC)
((92 BTU)/(hr ft2 F))
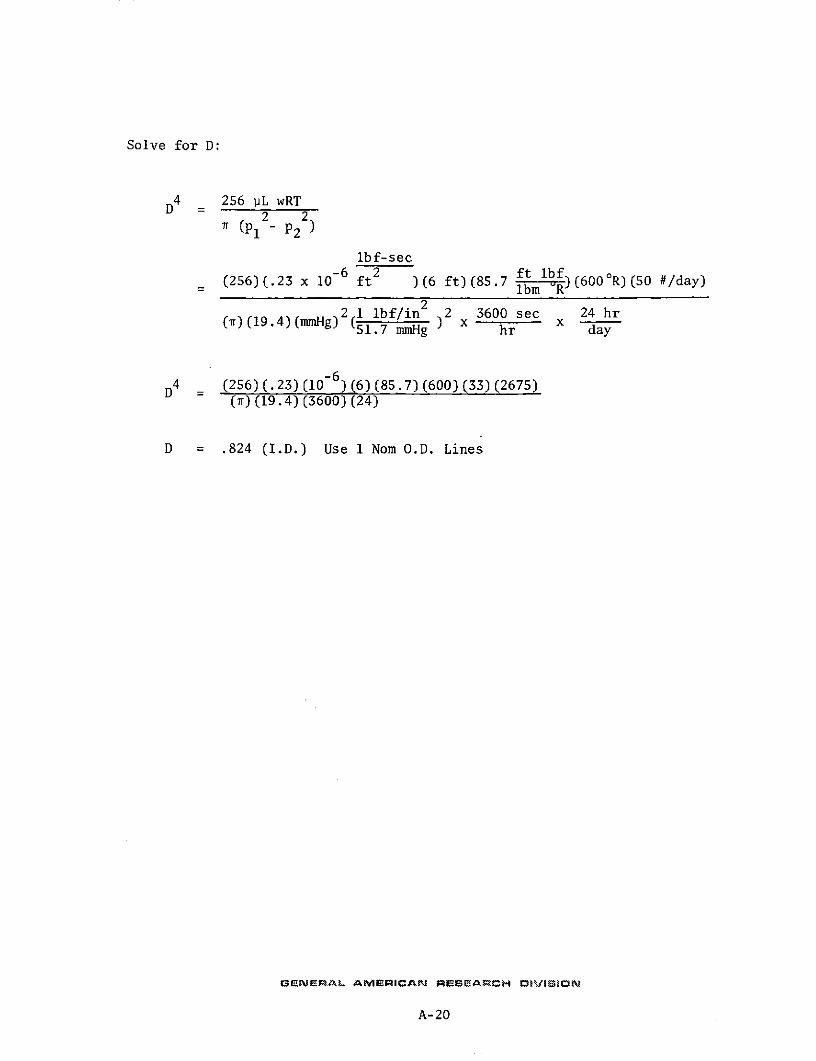
Vapor Duct Size: 20.9 mm (.824 inches) I.D.
Sludge Removal Line: 15.9 mm (.625 inches) I.D.
39
Page 48
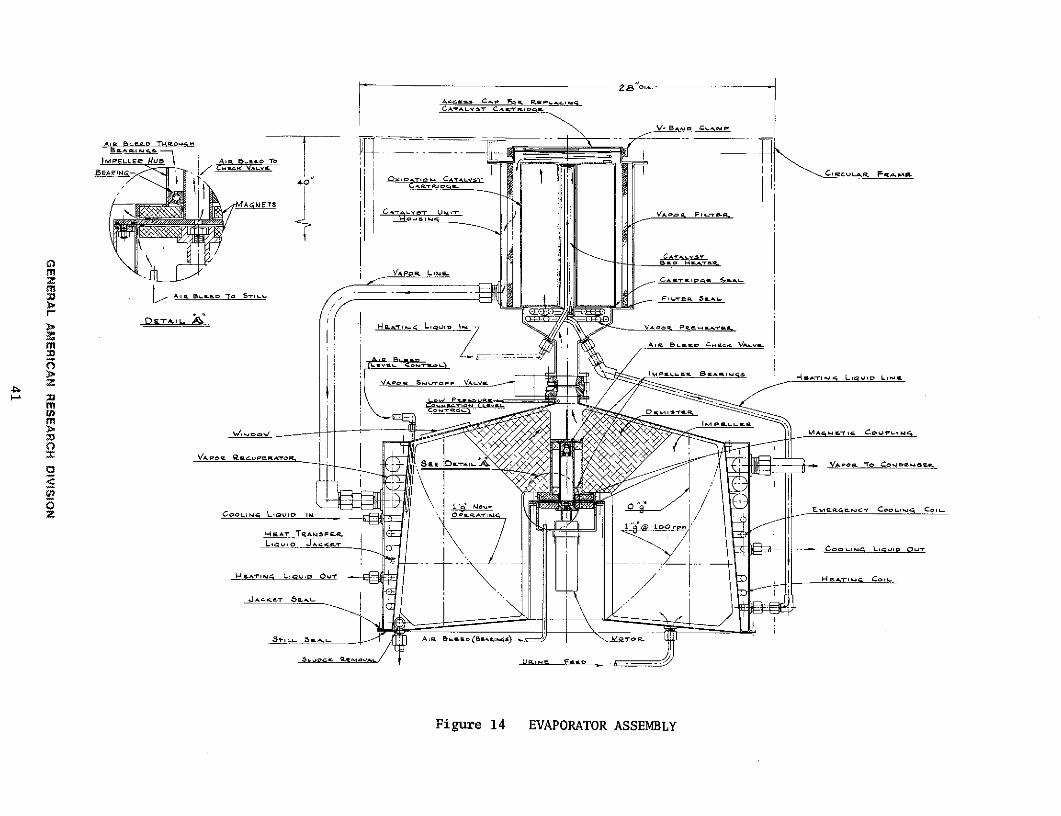
Utilizing information provided from the laboratory support test described
in Section 3, a layout assembly drawing was prepared for the evaporator in ac-
cordance with the design calculations. The layout assembly drawing is shown in
Figure 14. The layout design provides for heating and cooling coils located in
the heating jacket. The evaporator, as constructed and shown in Figure 2 ,
does not include the coils but allows the recirculating heating liquid to flow
directly into the jacket.
The configuration shown in Figure 14 includes three changes from the con-
figuration described in GARD Proposal 91466. These are (a) addition of a shut-
off valve at the vapor outlet of the evaporator, (b) the vapor filter located
downsteaam of the catalyst instead of upstream, and (c) the vacuum evaporator
and catalyst unit designed to utilize waste heat from a heat transport loop
instead of only cartridge heaters.
The shut-off valve at the vapor outlet of the evaporator is intended to
contain liquid within the evaporator in the event of power failure or stoppage
of the centrifugal impeller, and to isolate the evaporator from the vapor com-
ponents in the system during start-up with steam sterilization of the outlet
vapor passage.
The vapor filter was relocated at the outlet of the catalyst bed to iso-
late the sterilized vapor components during periodic changing of the catalyst
cartridge. The filter also serves as a bacteria removal mechanism in the
system, and as a back-up to the catalyst bed.
From the standpoint of integrating all major subsystems in a spacecraft,
it is anticipated that the water reclamation system could utilize waste heat
from the Power Generating System. Accordingly, the configuration shown in
Figure 14 was adjusted to utilize either waste heat or the originally proposed
GENERAL AMERICAN RESEARCH DIVIS4ON
40
Page 49
Access C-C Fo R-.c-qCArL.u. CAra
V-BAo Cl..*
AIO Bs-man THSOusa
BaA-
IM AEe UB\ A BC T-CYELL Vr\v 0 LYC ascL Fma
BEACC-r Um-'L4 ) V4agFu.ve.
N/APo. LwuszA - B . . oCT 5 - F sn 5 --
TA I.-
V7 A - B,.. VC V -.vj
B.A.-Is L.Q-o
V-0. D--F Vr-
> MAaEY C a M<CoSa
z L,2 i OE LIuro
I1 too em
Hr.AT TPANSFE
P LA u 0..,cr -
-. s L
T ~CL RCUP LrTaAs
Ct e - , Ata .anoc___
Figure 14 EVAPORATOR ASSEMBLY.
Figure 14 VAORTO ASEBL
Page 50
cartridge heaters. These heaters would be located in a heat loop operating
between the cartridges and the evaporator.
The internal dimensions of the six-man evaporator are 55.9 cm (22 inches)
in diameter at the bottom and 38.1 cm (15 inches) high. The resulting volume
of rotating liquid is sufficient to hold the urine sludge accumulated during
40 days of operation. Overall dimensions of the evaporator assembly are 71.1
cm (28 inches) in diameter and 101 cm (40 inches) high; these dimensions do not
include local protrusions for fluid lines and connections.
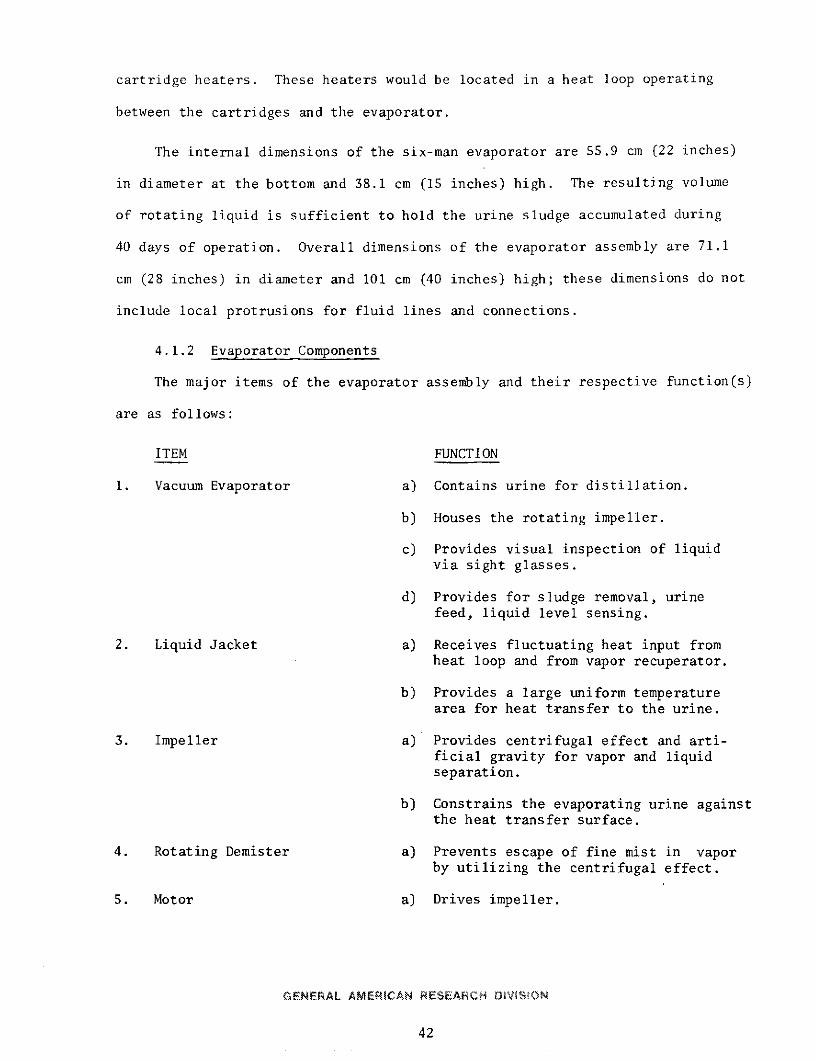
4.1.2 Evaporator Components
The major items of the evaporator assembly and their respective function(s)
are as follows:
ITEM FUNCTION
1. Vacuum Evaporator a) Contains urine for distillation.
b) Houses the rotating impeller.
c) Provides visual inspection of liquidvia sight glasses.
d) Provides for sludge removal, urine
feed, liquid level sensing.
2. Liquid Jacket a) Receives fluctuating heat input fromheat loop and from vapor recuperator.
b) Provides a large uniform temperaturearea for heat transfer to the urine.
3. Impeller a) Provides centrifugal effect and arti-ficial gravity for vapor and liquidseparation.
b) Constrains the evaporating urine againstthe heat transfer surface.
4. Rotating Demister a) Prevents escape of fine mist in vaporby utilizing the centrifugal effect.
5. Motor a) Drives impeller.
GENERAL AMERICAN RESEARCH IVISION
42
Page 51
ITEM FUNCTION
6. Magnetic Coupling a) Transmits torque from motor to impelleracross a static barrier
b) Allows impeller and motor to uncouplewhen torque is above the safe limitfor the gearbox
7, Impeller Bearings a) Support impeller in the internalvacuum, urine sludge, and vapor en-vironment
8. Air Bleed Line & Check Valve a) Provides oxygen for catalytic oxidationof gases in distilled vapors
b) Purges liquid leg of differentialpressure switch sensing liquid levelheight in evaporator
c) Continually purges a small quantity ofair over impeller support bearings toprevent vapor and sludge from contact-ing bearings
d) Provides for removing sludge and/orvapor from bearings in the event itcontacts bearings during prolongedshut-down in zero "g"
e) Check valve prevents back flow fromthe evaporator into motor housing
9. Heating Coil a) Transfers heat from heat transportfluid to the liquid jacket
10. Vapor Shut-off Valve a) Protects condenser, catalyst, filterand vapor passages by automaticallyclosing when vacuum or electricalpower is shut-off
b) Manually closed when vapor componentsare being steam sterilized on initialstart-up
11. Vapor Preheater a) Transfers heat from heat loop toraise temperature of vapor to approx-imately 930C (200 0F) before enteringcatalyst bed
GENUERAL AMC-RICAN RS RCH 43
43
Page 52
ITEM FUNCTION
12. Catalyst Bed Heater a) Initially heats catalyst bed to approx-(Utilizes heat loop) imately 149 0C (3000 F) at start-up
b) Heats vapor to approximately 121 0C(2500F)
13. Oxidation Catalyst Cartridge a) Contains oxidation catalyst in a read-ily replaceable cartridge
14. Oxidation Catalyst Bed a) Removes trace organic compounds fromthe process vapor
b) Subjects the vapor to sterilizationtemperature
15. Vapor Filter a) Filters bacteria and other particulatesfrom the process vapor
b) Maintains a sterile barrier to conden-ser during the interval of catalystreplacement
16. Vapor Recuperator a) Transfers heat from process vapor tothe heat transfer liquid jacket
The vacuum evaporator, catalytic oxidation unit housing, heating coils,
and liquid jacket are stainless steel components fabricated from machinings,
formed sheet, spinnings, tubing, and heliarc weldments. All mechanical joints
which seal against vacuum utilize static 0-ring face seals and bolts, except
the access cover for the catalyst cartridge. A V-band clamp and 0-ring seal
at the cover permits access at this point.
The impeller is supported by internal bearings which are continually
purged during operation with the air used in the catalytic oxidation process.
The inner race is stationary and secured to the bottom of the evaporator. The
outer race is attached to the impeller hub and is the rotating member. The
bearings are fabricated from a cobalt base, chrome, tungsten alloy and are
designed for wear resistance while operating without a lubricant. A small
GENERAL AMERICAN RESEARCH DVISIO
44
Page 53
quantity of air is admitted through the hollow inner post and through a check
valve at the end of the post. The bleed air continually passes over the bear-
ings and blocks water vapor, urine droplets, or particles from entering the
bearing chamber. The check valve prevents reverse flow of vapor from the
still into the motor housing during prolonged shut-down.
The impeller is driven by a 28-vdc motor located in a well in the bottom
plate of the still. The top end of the well is a statically sealed nonmagne-
tic plate which supports the mount tube for the inner bearing races. Motor
torque is transmitted across the nonmagnetic plate by a magnetic coupling.
The coupling consists of a matched pair of ceramic permanent magnets attached
to magnetic backplates. The backplates attach the magnets to the impeller and
motor output shaft.
The vapor shut-off valve is a stainless steel gate valve with a penumatic
actuator. A 3-way solenoid pilot valve connects the actuator cylinder to
either the system vacuum pump or to ambient pressure. When vacuum is applied,
the gate valve is open; when ambient pressure is admitted, the actuator's re-
turn spring closes the valve.
The oxidation catalyst cartridge is designed to fit over the catalyst
heater and to seal with an 0-ring at the lower outside wall. The cartridge
seal is spring-loaded by the upper access cap. When the access cap and V-band
clamp are positioned in place, the spring-loaded 0-ring seal prevents vapors
from bypassing the catalyst. Radial fins within the catalyst cartridge aid
the distribution of heat outward from the central heater.
The vapor filter is a cylindrical cartridge of Pall Corporation Ultipor
pleated filter media rated for removal of 0.08-micron size particles from
the gases and vapors. This is generally accepted as "absolute" removal of
GENERAL AMERICAN REISEARCH MVISON
45
Page 54
bacteria from vapors and gases. The filter cartridge is constructed of pleat-
ed filter media bonded to end caps. Each end cap has an.0-ring seal to pre-
vent by-passing of flow around the filter. The filter media and bonding mat-
erial are suitable for continuous exposure to 1350C (2750F).
4.1.3 Evaporator Operation
Description of Operation
Referring to Figure 14, the system operation is as follows:
Pretreated urine and humidity condensate solution are metered into the
evaporator via a three-way solenoid valve, metering pump, and timer. The
metering accumulator volume and timer interval realtionship are adjusted to
feed slightly more than the nominal feed rate. The three mechanical items,
in conjunction with a differential pressure switch sensing the liquid level in
the evaporator, comprise the urine feed control. The liquid-level sensor also
serves as the heat input control, by acting as part of the heating-liquid
feed-valve circuit.
A small amount of air continually bleeds in through one leg of the liquid-
level sensor; the air back-pressure is transmitted to a pressure switch. When
the volume of liquid in the still reaches a maximum set-point, the sensor
transmits a higher back-pressure due to the increased liquid height. Increased
pressure actuates a high-level switch and closes the urine feed solenoid valve
until the boiling process returns the liquid interface to the normal operating
level. Air entering through the level sensor probe also prevents fouling and
clogging, and eventually reacts in the catalytic oxidizer with volatiles gen-
erated during urine evaporation.
The main body of liquid is driven outward to the vacuum still wall by
the vaned impeller. The entire body of liquid moves at the impeller speed and
JERAL 6AMERICAN RSEACH O 46
46
Page 55
continually washes past the heat input surface. Heat input is provided through
a waste-heat liquid loop to the liquid jacket; the heating-liquid transfers
heat across the still wall to the urine. The liquid jacket also receives
from the vapor recuperator at up to 1490C (3000F); the liquid in the jacket
acts as a large uniform temperature bath operating at approximately 380C
(1000F) to boil urine.
The overall heating rate is controlled with a bypass valve in the heat-
ing liquid loop. When the bath temperature is below 430C (1100F) and the
urine level in the still is within normal operating limits, the bypass valve
allows the heating liquid to enter the liquid jacket. When either the bath
temperature is above 430 C (1100F) or the urine liquid level is below the low
operating limit, the bypass valve prevents flow to the liquid jacket and no
heat is received for evaporation.
The heating jacket also includes an emergency cooling coil. In the event
of a malfunction of the heat loop controls or an abnormally high waste-heat
liquid temperature, the emergency heat removal loop can be actuated to keep
the heating jacket temperature below 490C (120 0 F). The controls for the heat-
ing and cooling loops will be designed as part of the evaporator and condenser
assembly in Phase II of the program.
The impeller is driven by a 28-vdc motor located outside the evaporator.
The motor controls include a rheostat to reduce the applied voltage during
start-up. Normal operating torque required to drive the impeller is relative-
ly low--1.356 joules (1 ft-lb) as compared to the torque required for instan-
taneous start-up from rest to 100 rpm. To circumvent the requirement for a
large magnetic coupling for start-up only, the motor voltage is reduced at
start-up and gradually increased with increasing impeller speed. The impeller
GENERAL AMERICAN RESEARCH daN
47
Page 56
includes a de-misting sponge to coalesce mist or aerosols into larger droplets,
which will then be driven outward to the main body of liquid by the centrifu-
gal force of rotation.
The evaporator is operated with a liquor solution that increases in con-
centration until approximately 40% solids by weight are accumulated in solu-
tion after 40 days. In normal operation the sludge is removed by utilizing
the pumping action of the impeller to either transfer the sludge directly to a
storage container, which is at the same absolute pressure, or alternately, to
feed the sludge to a removal pump, which transfers the sludge to the desired
location and pressure level.
Distilled vapors pass through the vapor shut-off valve, which is open dur-
ing normal operation, and pass over a preheater tubing coil. The tubing coil
contains circulated waste-heat liquid at approximately 149 0C (300 0 F), which
heats the vapor from 320C (900F) to approximately 930C (200 0F). As the vapors
pass through the oxidation catalyst bed, entrained organic compounds are oxi-
dized and the entire flow stream is heated to a nominal temperature level of
1210 C (250 0F). The oxygen required for this process is provided by bleed flow
into the still through the liquid-level sensor and by the main bearings purge
flow.
The vapor leaving the catalyst bed is filtered through a microporous mem-
brane (Pall Ultipor .9 filter media at 93-1210 C (200-2500 F). The filter re-
tains particles 0.08 microns and larger. The viable bacteria which escape the
catalyst bed are retained by the filter and should be destroyed by prolonged
exposure to 93-1210 C (200-2500F).
The filtered vapor then passes through the coiled-tube recuperator and is
cooled by the heating jacket liquid. The sterile, potable vapor leaves the
GENERAL AMERICAN RESEARCH MlV§P4
48
Page 57
recuperator and evaporator assembly at approximately 490C (1200 F) and is ready
for subsequent condensing into potable water.
4.2 Fabrication and Assembly
The'evaporator shell structure was fabricated from stainless steel formed
sheet, spinnings, machined flanges, and port fittings. Heliarc welding was
employed throughout for joining the parts of each subassembly.
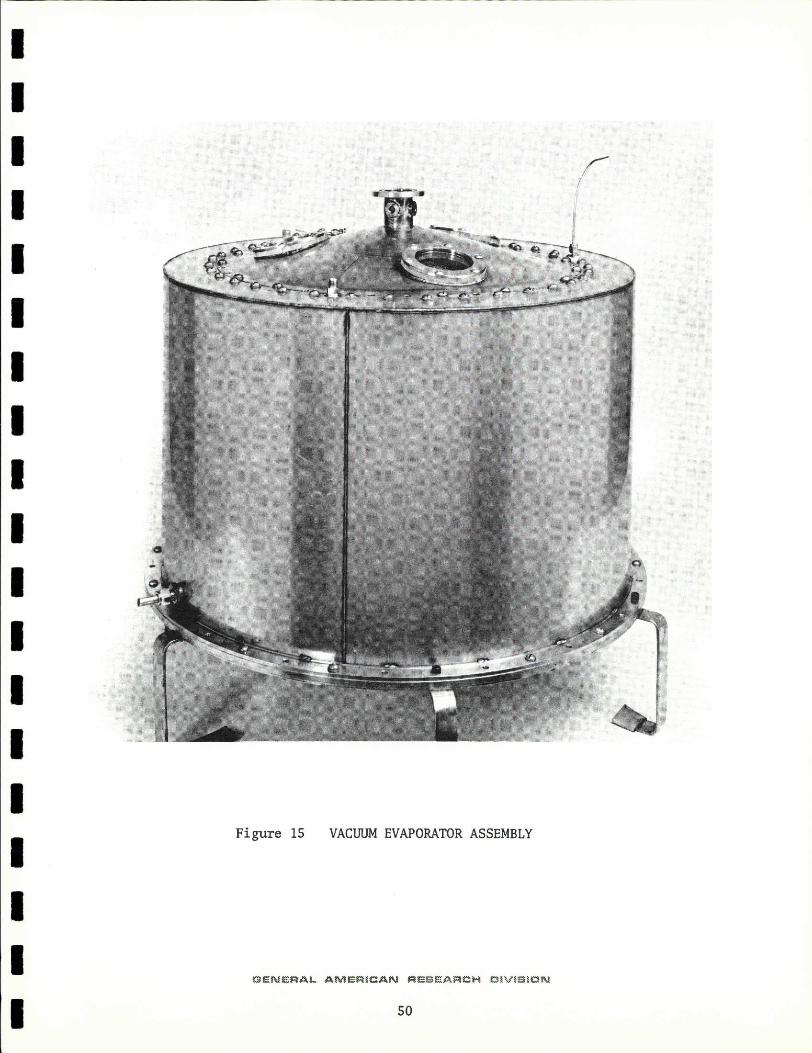
The vacuum evaporator and heating jacket assembly are shown in Figure
15. Upper and lower closures are spinnings which are bolted to machined
flanges with 0-ring seal grooves. The inner side wall was rolled from sheet
and butt seam welded into a conical shape.
Major parts of the rotating impeller and de-mister assembly are: 1) two
ball bearings and bearing support structure, 2) four radial vanes, 3) vapor
de-misting mesh, 4) driven magnet, and 5) a nonmagnetic plate between the
magnets. The plate mounts to the lower closure of the vacuum still shell and
forms a part of the barrier structure between ambient pressure and vacuum.
The impeller and de-mister assembly is shown in Figure 16..
Input torque to rotate the impeller is supplied by the power drive assem-
bly shown in Figure 17. A brushless 28-volt dc motor operates nominally at
5000 rpm to drive a 3-stage gearbox, which reduces the speed to 100 rpm. The
driving magnet, mounted on the gearbox output shaft, is identical in shape to
the driven magnet.
The catalytic oxidation unit was fabricated in a similar manner to that
for the vacuum still. This assembly has individual access caps for removal
of the catalyst cartridge and the vapor filter. Appropriately located instru-
mentation bosses are included as shown in Figure 18.
GENERAL AMERICAN RESEARCH DIVISION
49
Page 58
I
I 4
Figure 15 VACUUM EVAPORATOR ASSEMBLY
GO{NE{AL AMERIC AN RESEARCH CIVSION
so
Page 59
T R"'
I~
Figure 16 IMPELLER/DEMISTER ASSEMBLY
GENERAL AMERICAN RESEACH OVISON
51
Page 60
--- ~~~~~ --- ---- -- -®rfr,:3,P
Figure 17 POWER DRIVE ASSEMBLY
Page 61
r
Cll
FI
m3
r3in
Inll
I
z
a:
Figure 18 CATALYTIC OXIDATION UNIT
Page 62
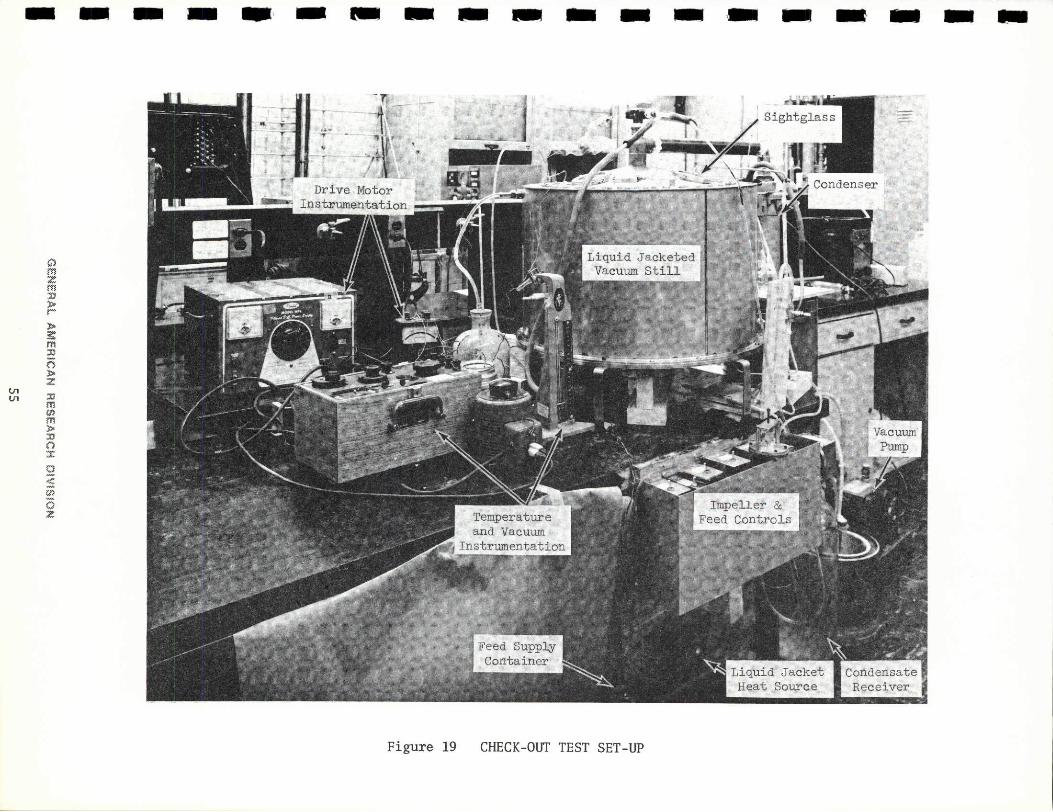
4.3 System Check-Out Tests
The full-scale evaporator was connected with a standard shell and tube
condenser, and a series of short duration check-out tests were conducted. The
raw urine feed controls, and the electrical controls for the impeller drive
motor were mounted on a temporary frame. Product condensate was collected in
a 55-liter glassware receiver located directly beneath the condenser. The
check-out test set-up is shown in Figure 19.
Temperature sensors were mounted on the system to record temperature lev-
els of the heating liquid, evaporating (boiling) liquid, and condenser coolant.
A pressure sensor located at the vacuum still outlet measured the absolute
pressure above the boiling liquid.
This series of check-out tests was conducted first with water and then
with urine, primarily to verify the adequacy of various operating and control
features, and to evaluate the following:
a) Distillation rate as a function of heating liquid inlet
and outlet temperatures, and flow rate.
b) Drive motor power required.
c) Profile of liquid/vapor interface during rotation.
d) Liquid-level sensor and switch performance to control
feed to the distillation unit.
The water check-out tests were conducted for six days, while urine check-
out tests were conducted for an additional five days. Performance data are
given in Tables VIII and IX.
GENERAL AMVIERCAN RESEARCH IsON
54
Page 63
In - -- ImIlM w m
Sightglass
; " . .. + CondenserDrive MotorInstrumentatin
Liquid Jacketedm Vacuun Stillz
Ln
Impeller &2 Temperature Feed Controls
and Vacuumnstrumentation
Feed SupplyContainer
Liquid Jacket CondensateHeat Source Receiver
Figure 19 CHECK-OUT TEST SET-UP
Page 64
Table VIII EVAPORATOR CHECK-OUT TEST WITH WATER
LIQUID HEATING JACKET EVAPORATOR CONDENSER
TEMPERATURE TEMPERATURE COOLANT RECOVERED WATER
ZRATE EQUIV. PRESS. SUPPLY AVG.
rOPERATION IN OUT AVG (liters/ POWER FEED LIQUID AT* (mm Hg TEMP. AMOUNT PTE
DATE (Hrs.) ~T T-7 min) (watts) (liters) (°F) (*F) abs) (°F) (liters) (lb/hr) R4MARKS
2/10 39 Initial Evaporator Fill
h2/10 7.9 89.6 85.5 87.5 1.90 302 13 85.5 2.0 27 40.5 5.7 1.59
2/11 9.0 72.7 63.5 68.1 1.84 654 5 63.0 5.1 11 o40. 9.8 2.14
2/12 8.6 85.5 65.5 75.5 1.84 1421 15 60.0 14.5 10 41.0 17.8 4.53
Replaced worn brass gear with steel
C 2/14 gear in impeller drive unit.
2/15, 0. 0 73.6 64.2 68.9 1.88 679 9.8 63. 5.9 11 41.0 10.2 2.24
* AT - Difference between evaporator liquid temperature and average heating jacket temperature
1. Impeller drive motor power: 70 watts
2. Impeller speed: 96 rpm
Page 65
Table IX EVAPORATOR CHECK-OUT TEST WITH URINE
LIQUID HEATING JACKET EVAPORATOR CONDENSER
TEMPERATURE FLOW TEMPERATURE COOLANT RECOVERED WATER
M RATE EQUIV. PRESS. SUPPLY AVG.
PERATION IN OUT AVG (liters/ POWER FEED LIQUID AT* (mm Hg TEMP. AMOUNT RATEDATE (Hrs.) ' -7 " min) (watts) (liters) (*F) (°F) abs) - (OF) (liters) (ib/hr) REMARKS
r 4/12 39 Initial Evaporator Fill
4/12 10. 0 90. 4 82. 0 86.2 1. 88 597 8 80.0 6.2 25 45 9.0 1. 92
4/13 8.0 94. 5 86.o 90. 2 1. 82 600 5 82.0 6.2 26 49 6.5 1.8
4/14 7.0 92.0 83.0 87.5 1.88 655 7.5 82.0 5.5 25 47 6.4 2.013L 2 4/17 &
4 4/18 15. 5 93.6 84.6 89.1 1.88 655 18.0 81.0 8.1 27 46 14.6 2. 07
* aT - Difference between evaporator liquid temperature and average heating jacket temperature
1. Impeller motor power: 55 watts
2. Impeller speed: 80 rpm
Page 66
a) Distillation Rate
The six-man unit recovered water at 0.97 to 1.02 kg/hr (2.14 to 2.24
lb/hr) which is slightly in excess of the required six-man rate of 0.85 kg/hr
(1.88 lb/hr). With the jacket heating liquid entering at 230 C (73.30F) and
flowing at 1.86 kg/min (4.1 lb/min), the jacket liquid outlet temperature
averaged 17.8 0C (640 F). With this approximate 5.50C (100 F) temperature drop
the heat input was equivalent to 668 watts of thermal power, while the heat
absorbed in boiling an average of 1.0 kg/hr (2.19 ib/hr) of water was 688
watts. These power levels are essentially equivalent within experimental
measurement error, and show that all of the heat input was utilized in dis-
tillation. When operating near the six-man recovery rate, the absolute pres-
sure within the still was maintained essentially constant at 11 mmHg abs
(b.pt. = 17.8 0C (640 F)) while the actual boiling temperature was 17.2 0 C (630F).
The still was operated at this lower temperature and pressure because
the temporary condenser was operated at 4.40C (400 F). The pressure drop from
the still to the condenser was lower than expected and the boiling pressure
in the still was resultingly lower. However, the temperature difference be-
tween the heating jacket liquid and boiling water was maintaned at the desired
2.8 to 3.30C (5 to 60F) level to show proper boiling rate capability. The
temperature difference between the everage heating jacket liquid and evapora-
tor liquid was 2.8 to 3.30C (5.1 to 5.90F). The heat transfer rate is approx-
imately 39 Cal/hr-cm2 oC (80 BTU/hr-ft2-OF) under these conditions.
During the water check-out tests the unit was also operated to recover
water at an average rate of 2.06 kg/hr (4.53 lb/hr) during an 8.6-hour run;
this is slightly above the twelve-man recovery rate of 1.72 kg/hr (3.76 lb/hr).
Operating conditions were about the same as for the six-man recovery rate
GENEPAL AMERICAN RESEARCH OVON8
58
Page 67
except the heating jacket inlet to outlet temperature difference was ll.1 0C
(200 F); accordingly, the temperature difference between the average heating
jacket liquid of 24.2 0C (75.50 F) and evaporator liquid at 160C (600 F) was 80C
(14.50F).
The full scale unit was check-out tested with urine feed and the perform-
ance data are presented in Table IX. With heating liquid supplied at 33 to
340C (92 to 93.6 0 F) and at a rate of 1.88 kg/min (4.1 ib/min), its temperature
dropped 50C (90F) through the jacket; this is equivalent to 655 watts of ther-
mal power. The measured recovery rate was .93 kg/hr (2.04 lb/hr) at 27 mmHg
absolute pressure corresponding to 280C (820F). The theoretical heat of vapor-
ization rate for .93 kg/hr at 27 mmHg is 635 watts,which is slightly lower
but essentially equivalent to the actual measured power. The fact that meas-
ured power was slightly greater than theoretical during the urine tests, but
slightly lower than theoretical power during the water tests, can probably be
attributed to the operating temperature level of the evaporator still. The
water check-out tests were conducted with the evaporator liquid at approximate-
ly 160C (600F) as compared to the urine tests with liquid at 270C (700F).
During the water check-out tests the evaporator received a small unmeasured
amount of heat from the ambient and during the urine tests a small unmeasured
amount was lost to ambient. In both circumstances the measured and theoretical
values are essentially equivalent,which demonstrates that the still was per-
forming as anticipated.
b) Drive Motor Power
The power drive assembly functioned properly with the exception of a brass
gear in the speed-reducing gearbox which was worn excessively after 24 hours.
During the water check-out tests the torque required to rotate the impeller
IERAL AMERICAN REACH V59
59
Page 68
and liquid within the still was higher than anticipated. The motor consumed
70 watts at an impeller speed of 96 rpm, whereas the anticipated requirement
as determined from calculations was 50 watts at 100 rpm. The higher load pre-
sumably contributed to the gear wear. The brass gear was replaced by a steel
gear and all gears were lubricated with Texaco Unitemp 500 grease. This lubri-
cant has a greater ability to remain on the gear teeth than the initially in-
stalled grease. After another 10 hours of operation during the water check-
out tests and 40 hours of operation during the urine tests, the gearbox was
functioning satisfactorily and with no apparent wear of the steel gears.
c) Liquid Profile
The rotating impeller functioned properly to constrain the liquid against
the heat transfer surface of the still. As observed through sightglasses on
the top cover of the evaporator, the liquid/vapor profile was the parabolic
shape anticipated for l-g operation. The scope of visibility into the evap-
orator was limited by the size of the sightglasses. The 7-cm (2-3/4-inch)
diameter sightglasses permitted observing the impeller rotation and the gen-
eral profile of the rotating liquid.
d) Liquid Level Control
The feed control and level sensor functioned properly throughout the
entire test. The level sensor functioned as required to prevent the feed con-
trol from adding more feed liquid when it was at the maximum desired level.
The feed control was originally designed to feed 100 cc maximum every 5
minutes. This was insufficient when the unit was operated in excess of a 12-
man recovery rate. For this particular test, the timer was modified to actu-
ate the solenoid valve every 2-1/2 minutes. The level sensor functioned to
prevent over-filling the evaporator by controlling the metering accumulator
GENERAL AMERICAN RESEARCH ,LVSON
60
Page 69
to feed only part or none of the 100 cc when the liquid level was at the
maximum desired level.
The overall performance of the level control was satisfactory and pre-
sented no difficulties. Proper operation is not gravity dependent, and the
control should perform satisfactorily in zero-gravity.
GENERAL AMERICAN RESEARCH DIVISO
61
Page 70
SECTION 5
CONCLUSIONS AND RECOMMENDATIONS
5.1 Conclusions
Based on the development and testing activities conducted in Phase I of
the program the following conclusions have been reached:
1) A liquid jacket around the evaporator is a very desirable method of
controlling the temperature level and rate of heat transferred to the
boiling urine.
2) The distillation rate varies in direct proportion to the temperature
difference between the heating liquid and the boiling urine for essen-
tially the complete distillation period.
3) The boiling surface remains clean and free of scum or solids build-up
when the liquid is rotated within the evaporator; the liquid velocity
at the impeller tip was 6.7 ft/sec during the tests conducted.
4) Although solids precipitate out of the sludge mixture, they do not
cling to the surfaces that are continually washed by the rotating
liquid.
5) Approximately 60% solids in the final sludge is a reasonable operating
limit for vacuum distillation batching.
6) Dow Corning H-10 antifoaming compound is required at a rate of 0.1
cc/hr to prevent excess foaming; at 40% solids concentration and above
antifoam was required at each vacuum pumpdown after the still was re-
pressurized.
GENERAL AMERICAN RLSEARCH iViMlON
62
Page 71
7) The overall heat transfer coefficient, U, from the liquid jacket to
the urine remains essentially steady at approximately 36.7 Cal/hr-cm 2- C
(75 BTU/hr-ft 2_F) during the entire batching process.
8) The particular dynamic shaft seal evaluated for the impeller drive
provided a nominal seal between the ambient and vacuum environments
but sporadically leaked seal coolant into the vacuum still.
9) A magnetic coupling drive functioned satisfactorily in both the lab
support test unit and the 6-man evaporator.
10) A differential pressure switch functioned satisfactorily as a liquid
level sensor when air was bled through the high-pressure line and
bubbled through the liquid.
11) A proprietary oxidation catalyst, evaluated under GARD sponsorship,
effectively reduced trace contaminants by 90% in the still effluent
vapor when oxygen flow was 150 cc/min (STP) for the six-man urine dis-
tillation rate.
5.2 Recommendations
Based on the observations and conclusions drawn from this phase of the
program, the following recommendations are made concerning the use, operation,
evaluation, and future testing of the VD/VF evaporator.
1) To provide an equivalent basis for comparison, it is recommended that
both ARDOX* catalyst, as used in prior VD/VF systems, and the proprie-
tary GARD catalyst evaluated concurrently with Phase I be employed al-
ternately in future tests.
Manufactured by ARDE, Inc. - Mahwah, New Jersey
GENERAL AMERICAN RESEARCH IVISION3
63
Page 72
2) A magnetic coupling should be used to drive the impeller within the
vacuum environment.
3) The vaned impeller should be accelerated gradually from its rest po-
sition to prevent uncoupling of the magnetic drive.
4) Oxygen flow for the GARD oxidation catalyst should be 150 cc/min (STP)
for a six-man urine distillation rate.
5) Means should be provided for storing antifoam compound separately from
the pretreatment acid.
6) The temperature difference between the heating jacket liquid and the
boiling urine should be utilized as the basic parameter for control-
ling distillation (and water recovery) rate.
7) Air should be bubbled through the liquid level sensing tube to pre-
vent fouling and clogging of the differential pressure switch used
for level control.
GENERAL AMERICAN RESEARCH aVItON
64
Page 73
PART II
DESIGN, MANUFACTURE, AND TESTING OF ZERO-GRAVITY CONDENSER:
INTEGRATION OF EVAPORATOR, CONDENSER, AND AUXILIARY COMPONENTS
Section 1
INTRODUCTION AND SUMMARY
Part II summarizes the activities of the General American Research
Division (GARD) to develop a zero-gravity condenser for vacuum distillation/
vapor filtration (VD/VF) water reclamation. The condenser development and
subsequent integration and testing of the evaporator, condenser and auxiliary
components were conducted as Phase II of a program to develop a
functional model VD/VF water recovery system. A zero-gravity evaporator had
been developed during Phase I of the program.
Program Objectives
The overall program objectives were to develop and evaluate a vacuum
distillation/vapor filtration (VD/VF) water recovery system. As a functional
model, the system converts urine and condensate waste water from six men to
potable water on a steady-state basis. The system is designed for 180-day
operating durations and for function on the ground, in zero-g aircraft, and
in orbit.
In Phase II of the program, described in this part of the report, the ob-
jectives were to develop a condenser and to integrate the condenser and auxi-
liary components with the evaporator developed in Phase I.
Program Summary
The VD/VF water recovery system is comprised of the components shown on
the block flow diagram, in Figure 1. Of the items shown by solid outline, the
GENERAL AMERICAN RESEARCH DIVIS ON
65
Page 74
evaporator (including a catalytic oxidation unit) was developed in Phase I and
the condenser was developed in Phase II. The remaining items shown by solid
outline, namely (a) sludge removal pump and shut-off valve and (b) vacuum pump,
were procured as purchased components and integrated with the feed control,
evaporator, condenser, water pump, and water storage tank to form an integrated
VD/VF water recovery system. The remaining items shown by dotted outline
were developed previously under Contract F 33615-69-C-1486, and comprise the
urine collection and storage subsystems.
The zero-gravity condenser is made up of smooth condensing surfaces with
coolant passages directly in contact with each condenser surface. A rotating
impeller with wiper blades continually wipes the condensate from the condensing
surfaces, and provides centrifugal force to separate the condensate from non-
condensible gases in zero gravity. The impeller is driven by an electric
motor, and the motor torque is transmitted to the impeller through a magnetic
coupling which eliminates shaft seals. The zero gravity condenser is shown
in Figure 20.
GENERAL AMERICAN RESEARCH DQVISON
66
Page 75
L9
NO
ISIA
IG
HO
$V3S
38
NV
OI1
fWV
1V
U3N
3D
"rf
N.
*
N
I
En
Art
wt
zr
Co*
Page 76
Section 2
CONDENSER DEVELOPMENT
A primary component of the vacuum distillation/vapor filtration water
recovery process is the system condenser. The function of the condenser is
to convert the vapor from the evaporator and catalyst unit into potable water,
and to effect separation of the condensed water from noncondensable gases mixed
with the incoming vapors. These operating factors required special design
considerations for the condenser to be functional in zero gravity.
2.1 Design Requirements
The design requirements for the zero-gravity condenser were as follows:
(a) Utilize a rotating vaned impeller to provide artificial gravity
for (1) separation of liquid from noncondensible gases and
(2) improved heat transfer from the condensing vapors to a
cooling jacket.
(b) Provide capacity to continuously remove the vapor generated in
an evaporator with a nominal 6-man feed rate of urine and
humidity condensate. The nominal inlet flow conditions to
be used in designing the condenser were as follows:
Flow 0.9 kg/hr (2 lb/hr) of water vapor plus
250-500 cc/min (STP) noncondensable gases
Temperature 490C to 660 C (120 0 F to 150 0F)
Pressure 10-15 mm Hg absolute
(c) Utilize the vapor/liquid interface to sense the quantity of liquid
in the condenser and provide automatic drain control.
(d) Utilize a coolant-filled jacket around the condenser to receive the
heat from the condensing vapors.
GENERAL AMERICAN RESEARCH DIVISION
68
Page 77
(e) Configure the condenser to allow for the use of a drive motor
common with the evaporator; alternately, the condenser may use a se-
parate drive motor.
(f) Incorporate appropriately located sight glasses to permit visual
observation of the liquid/vapor profile during laboratory testing.
2.2 Support Testing of Lab Condenser
The design requirements delineated the type of condenser needed and the
condensing capacity expected. To determine the size of the zero-gravity con-
denser precise data were needed to properly specify the necessary heat trans-
fer area. Useful data are published on heat transfer with condensation, in-
cluding data on special cases which consider a deviation from condensing only
pure vapors. The conditions for the VD/VF condenser, however, simultaneously
combined several influencing factors which were:
(1) Condensation at reduced pressure of 0.01-0.03 atmospheres.
(2) Condensation of superheated vapor
(3) Condensation in the presence of noncondensable gases
(4) Condensation with artificial removal of condensate from
condensing surface.
When considered as a summation of individual influencing factors, an
overall heat transfer coefficient was calculated to be in the area of 98
Cal/hr-cm2-oC (200 Btu/hr-ft2-_F).
To determine a realistic heat transfer coefficient for the basic design
of the zero gravity unit, a lab model condenser was constructed and operated
at various test points near the actual conditions anticipated for the zero-
gravity condenser.
GENERAL AMERICAN RESEARCH DIVISiON
69
Page 78
A laboratory test condenser unit was fabricated, assembled, and operated
to determine heat transfer coefficients for the same conditions at which the
full-scale zero-g condenser was to be operated. The lab model condenser was
not designed for a specific recovery rate but rather to obtain heat transfer
data for known operating conditions and for a heat transfer area of 0.23 m2
(2.5 ft2). Test results indicated the actual heat transfer coefficient was
approximately 49 Cal/hr-cm2-oC (100 Btu/hr-ft2- F).
Parts for the lab condenser included a vacuum shell, heat transfer jacket,
drive motor and magnetic coupling, and transparent plastic cover which pre-
viously comprised part of the lab distillation unit operated during Phase I.
A new impeller was fabricated to fit the internal dimensions of the vacuum
shell and was shaped to provide the desired flow path of the vapor along the
condensing surface. The impeller incorporated four flexible wipers in a ro-
tating wheel which continually moved past the heat transfer surface. Four
small radial vanes were attached to the bottom edge of the impeller; these
vanes kept the condensate rotating with the impeller and in this manner pro-
vided zero gravity separation of the product condensate from noncondensible
gases which were drawn off near the center-line of rotation. The lab con-
denser unit is shown in Figure 21 with the transparent plastic cover and
impeller removed.
The overall flow diagram for testing the lab condenser is shown in
Figure 22. Water was boiled in the vacuum evaporator, with the boiling
rate controlled by a variable voltage transformer supplying power to four
electrical heating elements. A measured quantity of bleed air was fed into
the vapor stream leaving the evaporator; this air simulated the air flow
which would be required for the oxidation catalyst in the actual system.
GENERAL AMERICAN RESEARCH DVIS SON
70
Page 79
TRANSPARENT COVER
COOLING JACKET
IMPELLER O-RING SEAL CONDENSINGSURFACE
IMPELLER HUB
I
~ iWIPER
IMPELER VALE MAGNETIC COUPLING(DRIVEN MAGNET)
Figure 21 LABORATORY TEST CONDENSER UNIT
Page 80
WRAP-AROUNDVAPOR TAPE HEATER
, BLEEDCOOLANT AIR
CONDENSER SUPPLYFROMCHILLER-_ -
IMPELLER - -SRI EWATER
.E V A P O R A T O R
ELECTRICAL CARTRIDGE HEATERS (4)(VARIAC CONTROLLED)
COOLANT RETURN A AP SWITCHTO CHILLER FOR LEVEL
jj , CONTROL
TO VACUUM PUMP
z
MEASUREMENTS -
) Temperature - CALIBRATEDCOLLECTION
(6 Pressure JUG
@P) Differential Pressure WATER
(3 Flow PUMP
Figure 22 FLOW DIAGRAM FOR LAB TEST CONDENSER
Page 81
The vapor and air were heated by a wrap-around tape heater to simulate the
superheat of the product vapor anticipated after passing through the catalyst
bed.
The superheated vapor and air entered the top of the condenser thrbugh
the transparent cover. The flow was directed outward and constrained to flow
past the liquid-jacket-cooled heated transfer surface where condensation
occurred. The product condensate collected in the bottom of the condenser
and increased in quantity until a differential pressure switch which sensed
the height of liquid level was actuated. The pressure switch acted as a level
control and energized the water pump to transfer the product condensate to
storage. Noncondensable gases were drawn from the condenser through a vacuum
purge line located near the center of rotation.
The significant measurements which were obtained during each test run
were as follows:
(1) Duration of test run
(2) Quantity of condensate collected
(3) Temperature
(a) Condenser inlet temperature
(b) Coolant inlet temperature
(c) Coolant discharge temperature
(4) Absolute pressure. in condenser
(5) Bleed air flow rate into vapor leaving evaporator.
The condenser performance was assessed by comparing the amount of con-
densate collected to the amount of water boiled for that particular test run.
The overall heat transfer coefficient was calculated from the temperature
measurements and recovery rate for that particular run.
GENERAL AMERICAN RESEARCH DIVISION
73
Page 82
The overall heat transfer coefficient from the condensing vapor to the
coolant liquid in the jacket was determined from the relationships:
Q = UAAT
and, Q = Whfg
so that, U = Wh /AAT
where, Q = Heat transfer rate, Btu/hr
U = Heat transfer coefficient, Btu/hr-ft 2-F
hfg = Latent heat of evaporation, Btu/lb
A = Heat transfer area, ft 2
AT = Temperature difference between condensing
vapor and average coolant temperature
in jacket
and, W = Liquid condensed, ib/hr
The overall coefficient, U, is a series addition of three heat transfer
coefficients, namely, the condensation coefficient from the condensing vapor
to the metal wall, the thermal conductivity through the wall, and the coefficient
from the wall to the coolant liquid, and is expressed by the equation:
1 1 1 1- + +
U h (k/t) hcond wall cool
where, U = Overall heat transfer coefficient from
condensing vapor to coolant liquid
h = Condensation coefficient of heat transfercond
including the desuperheating of the vapor
(k/t)wall = Thermal conductivity through the wall se-
parating vapor from coolant
and, hcool = Convection coefficient between the metal
wall and coolant liquid.
GENERAL AMERICAN RESEARCH OIVISION
74
Page 83
The effect on U of the metal wall, (k/t)wall, is negligible compared to
the condensation and convection coefficients. In essence, U is determined by
the heat transfer coefficients on each side of the wall.
The lab condenser was operated at the conditions anticipated for the zero
gravity condenser, which were:
Vapor Temperature 200C to 850C (750F to 185 0F)
Condenser Pressure 9 to 23 mm Hg absolute
Coolant Supply Temperature -3.00 C to 18.50 C (270F to 650 F)
Noncondensable Gas Flow 0 to 350 cc/min.
Initially, the condenser was operated with the coolant jacket configuration
as shown in Figure 21. Coolant was supplied from an external chiller to an
annular jacket 7.6 cm (3 inches) wide and 20.3 cm (8 inches) high. The jacket
was maintained full at all times; the return line was located directly oppo-
site the supply line. The average pumped velocity was <0.30 cm/sec (<0.01 fps).
With this arrangement, U values were 19.5 to 29.3 Cal/hr-cm2-_C) (40 to 60
Btu/hr-ft2_ F), which were much lower than anticipated. Test data and results
of two typical runs are given in Table X.
The results from the initial test runs indicated the rate of heat trans-
fer was influenced greatly by the coolant heat convection coefficient. To im-
prove the overall heat transfer rate, a modification was made to the coolant
jacket; the modified configuration is shown in Figure 23. The primary dif-
ferences were: (1) annular area was decreased, and (2) flow rate of coolant
was increased; the combined result was that coolant velocity past the heat
transfer surface was increased. Coolant flow rate was 5.3 ipm (1.4 gpm) through
the 2.5 by 3.2-cm (1-inch by 1-1/4-inch) rectangular area; the average coolant
velocity was 10.7 cm/sec (0.35 fps).
GENERAL AMERICAN RESEARCH DIVISION
75
Page 84
TABLE X
LAB CONDENSER TEST DATA AND RESULTS
LOW COOLANT VELOCITY, -. O1 FPS
1. TEST RUN 1 2
2. DURATION, minutes 450 450
3. TEMPERATURE, OC (-F)
a. Vapor leaving evaporator 24.0 (75.2) 23.5 (74.3)b. Vapor entering condenser 24.5 (76.1) 27.0 (80.6)c. Coolant entering jacket 9.0 (48.2) 7.0 (44.6)d. Coolant leaving jacket 9.0 (48.2) 7.0 (44.6)e. Ambient --- 30.0 (86.6)
4. PRESSURE
a. Vapor entering condenser, mm Hg abs 14.0 13.0b. Differential between vapor entering
condenser and vacuum purge line,mm Hg 5.0 4.5
5. BLEED AIR FLOW INTO VAPOR, cc/min STP 125 125
6. HEAT SUPPLIED TO EVAPORATOR, watts 417 338
7. QUANTITY OF CONDENSATE COLLECTED, cc
a. From condenser 4580 3850b. From freeze-out trap 170 110c. Total condensate 4750 3960
8. AVERAGE RECOVERY RATE, kg/hr (lbs/hr) 0.61 (1.35) 0.51 (1.13)
9. CONDENSER EFFICIENCY, % 96.4 97.2
10. OVERALL HEAT TRANSFER COEFFICIENT, 28.4 (58) 19.6 (40)
Cal Btu
hr-cm2 oC hr-ft2-oF)
76
Page 85
Vapor inCondensingsurface 7 1 inch
Coolant return--lan Spiral flow guide
L_-
1-1/4 inch
C-C oolant housingCoolant supply - -from chiller
Condensate out
(Cross-section through condenser diameter)
Figure 23 MODIFIED CONFIGURATION OF COOLANT JACKET: LAB TEST CONDENSER
Page 86
With the improved coolant jacket configuration, U values were 49 to 59
Cal/hr-cm2-oC (100 to 120 Btu/hr-ft2-_F); these values were approximately twice
those obtained when the coolant velocity within the jacket was essentially
stagnant. Test data and results of typical runs after the coolant jacket mo-
dification are given in Table XI. The lab condenser tests indicated that an
overall heat transfer coefficient of49 Cal/hr-cm2-_C (100 Btu/hr-ft2-_F) was
appropriate for designing the zero-gravity condenser.
2.3 Design of Zero-Gravity Condenser
The zero-gravity condenser shown in Figure 20 was designed in accordance
with the detail requirements listed in Section 2.1. In accordance with these
tests, a layout assembly drawing was prepared as shown in Figure 24. During
normal operation of the zero-gravity condenser, vapor flow from the evaporator
and catalytic oxidation unit enters near the center of the unit and is distri-
buted near the center of the impeller by an inlet manifold. Vapors are then
constrained to flow radially outward between the upper condensing surface and
the rotating impeller plate. The vapor flows radially out and along the heat
transfer surface with condensation occurring as the vapor contacts the cool
surface. Flexible wiper blades, attached to the rotating impeller, continually
wipe the condensing surface and collect the condensation droplets along the
wiper. The rotating impeller and wiper blades impart a centrifugal force to
the condensate to direct it radially outward to the outer housing of the con-
denser. Any vapor which is not condensed during the upper pass along the con-
densing surface flows down and then radially inward along the opposite cool
surface to effect complete condensation. Noncondensable gases are removed
at the center of the unit on the side opposite the vapor inlet.
GENERAL AMERICAN RESEARCH DIVIS ON
78
Page 87
TABLE XI
LAB CONDENSER TEST DATA AND RESULTS
IMPROVED COOLANT VELOCITY,"C35 FPS
1. TEST RUN 1 2 3
2. DURATION, minutes 420 420 350
3. TEMPERATURE, °C (-F)
a. Vapor leaving evaporator 26.0 (78.8) 28.0 (82.4) 29.0 (84.4)
b. Vapor entering condenser 53.0 (127.5) 82.0 (180.0) 85.0 (185.0)
c. Coolant entering jacket 12.0 (51.8) 8.5 (47.3) 8.0 (46.4)d. Coolant leaving jacket 12.0 (51.8) 8.5 (47.3) 8.0 (46.4)
4. PRESSURE
a. Vapor entering condenser, mm Hg abs 14.0 12.0 14.0b. Differential between vapor entering
condenser and vacuum purge line,mm Hg 3.1 2.8 2.8
c. Differential between vapor above andunderneath impeller, mm Hg 0.0 0.0 0.0
5. BLEED AIR FLOW INTO VAPOR, cc/min STP 142 149 210
6. HEAT SUPLLIED TO EVAPORATOR, watts 529 597 597
7. QUANTITY OF CONDENSATE COLLECTED, cc
a. From condenser 5800 6570 5450
b. From freeze-out trap 150 90 70
c. Total condensate 5950 6660 5520
8. AVERAGE RECOVERY RATE, kg/hr (lb/hr) 0.83 (1.82) 0.94 (2.06) 0.94 (2.06)
9. CONDENSER EFFICIENCY, % 97.5 98.8 98.7
10. OVERALL HEAT TRANSFER COEFFICIENT, 60.0 (122.0) 47.4 (97.0) 28.0 (57.4)
Cal Btu
hr-cm -C hr-ft - F
GENERAL AM CA RES 079
79
Page 88
00
m I
m N.'A-r . Fl PAN4
0 I ~ ~ 4A06&*A-VA JACMIRiu
TUP~ Put,.
Figure 24 ZERO-G CONDENSER ASSEMBLY
Page 89
The condensate within the condenser collects along the inside surface
of the housing; a timer periodically actuates a pump to transfer the conden-
sate from low pressure to storage at ambient pressure. The pump is started
by the timer but continues to operate until all the condensate is removed and
the pump discharge pressure drops; this drop is sensed by a pressure switch
located at the pump discharge; actuation of the switch shuts off the pump.
Identical coolant jackets located on each side of the unit have radial
flow guides to direct the coolant over the entire heat transfer surface. The
flow guides not only direct coolant flow but also give this surface the struc-
tural rigidity needed to remain flat when the internal pressure is reduced
to 10-20 mm Hg absolute operating level.
2.4 Fabrication and Assembly
The vacuum condenser was fabricated from stainless steel sheet and
machined parts and is shown in Figure 25. The flat, disc-shaped condenser
surfaces were bolted to the machined elements and sealed by static 0-ring
gaskets.
The rotating impeller subassembly is comprised of: (1) inner support
post, (2) ball bearing, (3) driven magnet, (4) impeller disc with four
radial wipers on each side of the impeller, and (5) fastener hardware. The
impeller subassembly is shown in Figure 26.
2.5 Condenser Check-Out Testing
The unit was initially check-out tested to verify that the essential
subcomponents performed satisfactorily. The rotating impeller, drive motor,
and the condensate pump were operated to determine (1) that proper assembly
clearances were maintained between the impeller and housing, (2) the varia-
tion in speed and motor power for operation at no-load and full-load with water
GENERAL AMERICAN RESEARCH DISION
81
Page 90
m m so -MA m m
Coolant Jacket Cover
Coolant Heat Exchange Surfacez (Condensing Surface - Opposite Side
-I
2
0-Ring Groove Coolant Flow Guide
Figure 25 CONDENSER WITH COOLANT JACKET REMOVED
Page 91
m Mao M M- M w *a -M w RM M _
SFlexible Wiper(4 ea. side)
Inner Support Post
Smooth Condensing Surface
m-
z
N -U
m
0\
z/
Impeller Disc
Figure 26 IMPELLER SUBASSEMBLY
Page 92
inside the condenser, (3) the pumpout rate of water from the vacuum condenser
to the storage tank, and (4) that the control for the water pump functioned
automatically and continuously.
Rotating Impeller Operation. The rotating impeller was operated at various
speeds up to 110 rpm, the maximum speed of the drive motor with the original
speed reduction gearbox. The flexible wipers on the impeller were adjusted
to lightly contact and wipe the condensing surface. By visual and audio ob-
servation, it was determined that the rotating impeller was operating properly.
Subsequent to the initial check-out tests, a higher speed motor was used and
the impeller was operated at speeds up to 200 rpm.
Drive Motor Performance. Initially, the power drive unit consisted of
a brushless dc motor coupled to a speed reduction gearbox which had three
stages of spur gears. When the motor was operated at its top speed of approx-
imately 6000 rpm, the output speed of the gearbox was 110 rpm. When driving
the impeller, without water in the condenser, the speed was 110 rpm and the
motor required 40 watts. When water was introduced into the condenser (simu-
lating the condensate which collects during actual operation), the impeller
speed was 110 rpm and the motor required 65 watts. Although the actual
torque was not measured, the motor manufacturer's performance chart indicated
that motor output torque was approximately 324 cm-gm (4.5 oz-in). The torque
is stepped up in the speed reduction gearbox by a 55:1 ratio, resulting in an
output torque of approximately 18,000 cm-gm (250 oz-in). The gearbox torque
rating was 250 oz-in, indicating marginal performance ability. Since the
nominal load was close to the rated capacity and since there was a gearbox
failure between the output gear and output shaft, the condenser power drive
unit was changed to a gear motor with a worm gear speed reduction box.
GENE AL AMERICAN RESEARCH DVISION
84
Page 93
The worm gear reduction unit torque rating is 430 oz-in and functioned
satisfactorily at output speeds between 160 and 200 rpm.
Water Pump Performance. A magnetically coupled gear pump is used to pump
the condensate from the vacuum condenser to a storage container at atmospheric
pressure. An initial bench check-out test of the pump indicated its pumping
rate was 0.61 liters per minute (0.16 gallons per minute) when pumping from
atmospheric pressure to 1.41 kg/cm2 (20 psig). However, when the pump was
assembled into the system and operated as part of the condenser check-out tests,
the pump was not capable of removing the condensate when the condenser vacuum
was 10 mm Hg absolute.
The pump was removed from the condenser and bench-tested under actual
vacuum conditions. The pump was connected via a flexible vacuum tube to a
small bell jar. The bell jar was partially filled with water and the vapor
space above the water was evacuated to and maintained at 10 mm Hg absolute.
The pump was placed at various vertical distances below the water level and
its pumping rate was measured for each height of static inlet head. The
measured rate was 0.12 ipm (0.032 gpm) when the inlet static head was 50 mm
Hg (27 inches of water) above the 10 mm Hg vapor pressure.
To obtain 50 mm Hg (27 inches of water) or more static head above the
10 mm Hg vapor pressure in the condenser, a Pitot tube (right angle scoop)
was added to the pump inlet port. The Pitot tube served to convert the kine-
tic energy of the rotating pool of condensate into potential energy or static
head in the pump intake tube.
With the new worm gear-reduction gearmotor, the rotating impeller oper-
ated at approximately 200 rpm without water in the condenser; with condensate
in the condenser, the speed was 160 rpm. If there were no slippage between
GENERAL AMERICAN RESEARCH DIVISON
85
Page 94
the rotating water and the rotating impeller, the 160-rpm speed would produce
97 mm Hg (52 inches of water) or static head. Actually, there was some slip
between the water and impeller so the static head appeared to be approximately
75 mm Hg (40 inches of water).
The water discharge pump and inlet Pitot tube were reassembled with the
condenser. The pump initially functioned satisfactorily to transfer the con-
densate from the vacuum condenser to atmospheric pressure storage tank. How-
ever, after approximately 8 hours of system operation, the pumping capacity
dropped off until the pump was unable to pump out the condensate. The apparent
reason for loss of capacity was wearing of the plastic pump gears within the
pump.
To circumvent a shutdown of zero-g condenser testing due to the decrease
in gear pump performance, a secondary pump was added to the outlet of the gear
pump. The secondary pump -- a peristaltic pump -- lowered the pressure differ-
ential required across the gear pump. The two pumps in series performed satis-
factorily to pump out condensate to atmoshperic pressure.
Automatic Control of Water Pump. The electrical controls which function
automatically to start and stop the condensate pump consisted of a repeat
cycle timer, which started the pump every 2-1/2 minutes, and a pump discharge
pressure switch and motor relay, which kept the pump running as long as water
was available at the pump inlet. When essentially all the condensate was
pumped from the condenser, the pressure differential decreased sharply, and the
differential pressure switch shut off the pump. The pressure switch employs
an adjustable set point which was readily adjusted to obtain satisfactory auto-
matic performance. The automatic controls functioned satisfactorily and with-
out incident.
GENERAL AMERICAN RESEARCH OVIISON
86
Page 95
Section 3
SYSTEM TESTING
The VD/VF water recovery system was tested to evaluate processing per-
formance and quality of recovered water during six continuous days of operation.
The objectives of these tests were to evaluate system performance by assess-
ing the following:
(1) Water recovery rate versus time
(2) Water yield versus time
(3) Heating efficiency
(4) Water quality versus time
(5) Power consumption
(6) Effects of random temperature and pressure variations.
3.1 Test Set-Up and Instrumentation
Tests were conducted at GARD's Chemical & Environmental Systems
Laboratory.
The water recovery system was set up as shown in the schematic flow
diagram, Figure 27. The test instruments used to determine the process
conditions are listed in Table XII.
3.2 Operation and Monitoring
During the nominal six-day performance test the system was operated for
145 cumulative hours and recovered 151 kg (333 lbs) of water from 160 kg
(351 lbs) of urine feed.
Urine was collected from male in-plant personnel and added to the urine
storage tank on a daily basis. Prior to setting out the urine collection
receiver, an acid pretreatment solution was placed in the receiver; in this
GENERAL AMERICAN RESEARCH DV~WSION
87
Page 96
Noncondensables toVacuum Pump
CatalyticOxidation
Unit Coolant Return oolant Supply
Catalyst Unit Heating Loop --
Reservoir Condenser
I PumpHPtp Heaterp ' Vapor
P
M T pWater Tank at
Heating Water 4 Atmospheric Pressure
0 a Evaporator -Evaporator Heating--\
M Jacket \
SReturn i I
Feed Air Bleed MeasurementsSControl for Catalyst
W T TemperatureP Absolute PressureS Sample for Daily Water Quality Analyses
Antifoam AP Differential PressurePrteated Compound W Flow Rate
Urine Supply V Volume per Day
Figure 27 FLOW DIAGRAM FOR SYSTEM PERFORMANCE TESTS
Page 97
TABLE XII
PROCESS TEST PARAMETERS AND INSTRUMENTATION
Test Measurement Instrument
(a) Process Temperatures Iron-Constantan Thermocouple andHoneywell Multipoint Recorder
(b) Evaporator Pressure Absolute Mercury ManometerCondenser Pressure Absolute Mercury Manometer
(c) Catalyst Unit Differential Magnehelic T-p GaugePressure
(d) Oxygen Feed to Catalyst Unit Rotameter (0-2000 cc/min)Air Bleed to Evaporator Rotameter (0-80 cc/min)Level Sensor
(e) Urine InputAntifoam Compound Added Graduated Beaker and/or BalanceWater Produced ScaleVacuum Line Freeze Trap Water
(f) Heat Transport Liquid Flow Rate- Evaporator Heating Water Graduated Beaker- Catalyst Heating Oil Stop Watch- Condenser Glycol/Water
Coolant
(g) Test Duration Clock
(h) Input Power VoltmeterAmmeter
(i) Water Samples Pre-Sterilized Sample Jar
GENERAL AMERICAN RESEARCH OIVIStON
89
Page 98
manner the pretreatment was mixed witn the raw urine immediately upon being
voided from the donor.
The acid pretreatment was a mixture of 44% by weight sulfuric acid, 11%
chromium trioxide, and 45% distilled water. This mixture has been found to
satisfactorily inhibit biological decomposition of the raw urine.
As the freshly collected urine was transferred to the urine storage tank,
a small quantity of Dow Coming H-10 antifoam compound was mixed into the
pretreated urine. For the six-day test the antifoam addition rate was 4 drops
antifoam per liter of urine.
Samples were collected daily of the raw vapor leaving the evaporator, and
of the condensate pumped from the condenser. The product condensate was
tested for viable bacteria density and for a few prominent indicators of water
quality. The sample condensate from raw vapor was also analyzed to obtain
an indication of the performance of the oxidation catalyst bed in reducing
total carbon and total organic carbon concentrations.
Process temperatures were recorded on a continuous basis by a multipoint
recorder. Other process parameters were monitored and recorded at 2-4 hour
intervals during the 8:00 am to 5:00 pm period of each test day.
3.3 Water Quality Analysis Procedures
The water quality monitoring program consisted of the following analyses
and measurements:
(1) Total carbon
(2) Total organic carbon
(3) pH
(4) Ammonia
(5) Conductivity
GENERAL AMERICAN RESEARCH DIS"ION
90
Page 99
(6) Turbidity
(7) Viable bacteria density.
Total carbon (TC) and total organic carbon (TOC) analyses were performed
with a Beckman Model 915 Total Organic Carbon Analyzer. The TOC determination
is made by subtracting the measurement of inorganic carbon from total carbon.
Product water, pH, conductivity, and turbidity were measured with stan-
dard laboratory instruments. A Beckman Expandomatic Model 76A pH meter was
used to give a direct read-out of the sample pH. An Industrial Instruments
Model RC 16 B 2 Conductivity Bridge with calibrated conductivity probes and
a Hach Model 1860 Turbidimeter were used for measuring conductivity and tur-
bidity, respectively.
Analyses for ammonia were performed by colorimetry. The procedure re-
quired that the sample be treated with a reagent composed of phenol, nitro-
prusside, and hypochlorite. The reagent, in the presence of ammonia, produces
a blue color which was measured at 630 mv by a Bausch & Lomb Spectronic 20
Colorimeter.
Bacteria analyses were determined by using a modified most probable num-
ber (MPN) technique. For each sample, fifteen tubes of thioglycolate broth
along with control tubes were incubated at 350C for 72 hours. Prior to in-
cubation, 5 of the 15 tubes were innoculated with 1 ml of sample, 5 tubes
were innoculated with 1 ml of sample diluted 10:1, and 5 tubes were innoculated
with 1 ml of sample diluted 100:1. The tubes were checked for growth after
48 hours and after 72 hours. Viable bacteria density was determined from MPN
tables on the basis of the number of positive tubes in each dilution level.
Gas formation within the broth was considered a positive indication of coli-
form organisms.
GENERAL AMERICAN RESEARCH DISiON
91
Page 100
3.4 Processing Test Results
Performance test data for inputs, outputs, and process flow conditions
are given in Table XIII. During the 145 cumulative hours of operation, the
urine distillation temperature varied between 230C (740 F) and 260C (780F),
the vapor oxidation temperature varied between 142 0C (2870 F) and 148'C (299 0F),
and the potable water was condensed at 5.50 C (420F) to 100C (500 F). The
average recovery rate remained constant at 1.04 kg/hr (2.3 ibs/hr).
3.4.1 Evaporator Heat Utilization
Warm water was circulated to the evaporator heating jacket at a constant
rate of 2.1 kg/min (4.6 lb/min). The water temperature entering the jacket
varied between 310C (870 F) and 330C (910F); the temperature difference between
inlet and outlet averaged 4.70 C (8.50 F). The heat transport rate to the eva-
porator jacket from 2.1 kg/min (4.6 lbs/min) of water flowing through 4.70C
(8.50)AT was 592 kcal/hr (2350 Btu/hr).
Heat required to evaporate 1.04 kg/hr (2.3 lbs/hr) of vapor at 20 mm Hg
was 605 kcal/hr (2400 Btu/hr). This was in close agreement with the measured
heat input rate and indicated that essentially all of the heat supplied to
the heating jacket was utilized to evaporate urine inside the vacuum evaporator.
3.4.2 Urine Distillation
Urine distillation occurred in the 230C (740F) to 260C (780F) range. The
actual vapor pressure immediately above the liquid surface was not measured;
the vapor pressure in the outlet duct was measured, but this location was
down stream of the demister. It appears that there was approximately 3 mm Hg
Ap across the demister mesh. This approximation is based on the observation
that the vapor pressure in the evaporator outlet duct was about 3 mm Hg below
that anticipated for the measured urine liquid temperature. For example, near
GENERAL AMERICAN RESEARCH DIViSON
92
Page 101
TABLE XIII
PERFORMANCE TEST DATA AND RESULTS
Cumulative Data Temperature -C (*F) Pressure - mm Hg
Time Test Urine Water Freeze Evaporator Catalyst Unit Condenser Evau. Cond. Cata.
Date of Time Feed Produced Trap Heating Liquid Urine Exit Heating Liquid Vapor Metal Exit Coolant Vapor Conden- Abso. Abso- Differ- REMARKSRecordins l Quu I
hrs. kg (lb) kg ( 1b) kg (b) In Out Liquid Vapor In Out Into Bed Housing Vapor In Out In sate lute lute ential
1-8-73 1015 -0- 19.7 Start of test; Evaror liiu,
(43.3) l12: solids.
1610 37.3 31 26 24 28 166 139 145 111 111 4 7 18 1 I 19.5 15 2.6(82.0) (88) (79) (74.5) (82.5) (330) (282) (293) (232) (242) (39) (44) (64) (52)
1-9-73 815 22.0 31 26 24 26 166 139 145 111 121 1 4 18 6 20.5 16 2.3(88) (79) (75) (79) (330) (282) (294) (232) (249) (33) (38.5) (65) (42)
1215 26.0 55.4 27.9 .36 31 26 23 27 166 139 145 111 121 2 4 17 7 18.5 14.5 2.4(122.2) (61.4) (.79) (87) (78) (74) (80) (330) (282) (293) (232) (249) (35) (39.5) (62.5) (44.5) Distillation stopped at 1900 due to
1900 32.75 loss of vacuum; apparently freeze trapblockage. Operation resumed at 845.
1-10-73 845 32.75
1047 35.78 75.2 38.2 .62 32 28 24 32 163 133 142 116 126 6 9 18 15 20.5 15 2.6(165.7) (84.0) (1.36) (89) (82.5) (76) (89) (325) (272) (287) (241) (259) (42) (47.5) (64) (60)
1816 31 27 24 28 166 139 146 112 120 3 6 18 8 19.5 15 2.3(88) (80) (75) (83) (330) (283) (295) (234) (248) (37) (42) (64) (47)
1-11-73 820 94.8 .95 31 26 23 27 166 137 144 110 118 1 4 18 6 19.5 15.5 2.3(209.0) (2.09) (87) (79) (74) (81) (330) (279) (291) (230) (244) (33) (38) (64) (42)
1530 64.5 114.2 67.4 31 26 23 28 166 139 145 113 121 2 5 17 8 18.5 14 2.4(251.50) (148.3) (87) (79) (74) (83) (330) (283) (294) (235) (250) (35) (40) (63) (46)
1-12-73 830 32 27 25 28 166 139 146 112 120 1 4 19 6 19.5 15 2.3(90) (81) (77) (83) (330) (283) (295) (233) (248) (34) (39) (66) (42.5)
1530 88.5 149.2 98.4 1.30 31 26 24 28 166 137 145 114 123 3 6 17 10 18 14 2.4 ,(329.0) (216.5) (2.86) (88) (79) (75) (83) (330) (280) (293) (238) (253) (38) (43) (62.5) (50)
Distillation stopped at 400 due to1-13-73 400 101.0 103.3 1.69 blown use on condenser wate, pump.
(227.5) (3.73) Operation resumed at 1200.
1-15-73 1200 101.0
1648 33 28 26 32 168 143 148 113 122 3 5 19 8 19 15 2.3(91) (82) (78) (89) (335) (289) (299) (236) (252) (37) (41) (66) (47)
1-165-73 830 33 28 26 32 168 143 147 114 123 3 6 18 9 19.5 15.5 2.3(92) (83) (78) (90) (335) (289) (297) (238) (253) (38) (43) (64) (49)
1430 127.5 159.3 133.6 2.01 33 28 26 32 171 143 148 113 122 3 5 19 8 19 15 2.3(351.0) (249.0) (4.42) (91) (82) (78) (89) (340) (289) (298) (236) (252) (37) (41) (66) (46)
1-17-73 800 145.0 159.3 151.4 2.31 33 28 26 32 166 138 145 111 117 4 7 18 10 19.5 15.5 2.4(351.0) (333.0) (5.08) (92) (83) (78) (90) (330) (281) (293) (232) (243) (39) (44) (65) (50)
1 Urine feed data includes amounts in feed supply container.Urine feed included 4 cc acid pretreatment per liter of urineplus 0.2 cc antifoam (Dow Corning H-10) per liter of urine.
2 Oxygen feed to catalyst unit: 500 cc/min (STP)Air bleed to evaporator sensor: 7 cc/min (STP)
3 Evaporator heating liquid flow: 2.1 kg/min (4.6 lb/min) of waterCatalyst heating liquid flow: 9.1 lph (2.4 gph) of silicone oilCondenser coolant flow: 6.4 1pm (17 gpm) of ethylene glycol
and 50% water
4 Evaporator Inpeller: 80 rpm., 55 wattsCondenser Impeller: 160 rpm, 45 watts
Page 102
the end of the test, the urine temperature was 260 C (78°F) and the pressure
in the outlet duct was 19 mm absolute. The solids concentration in the
urine was 26%; at this concentration and 260C temperature the equilibrium
vapor pressure is 22 mm Hg absolute. This was 3 mm Hg above the 19 mm Hg mea-
sured pressure in the outlet duct. Based on the measurements taken, there
appeared to be 3 mm Hg Ap across the demister mesh.
The solids concentration in the evaporator was estimated from the urine
feed rate, and assumed the fresh pretreated urine was 4% solids by weight.
The solids concentration progressed from 12% to 26% during the 145 hours of
operation.
3.4.3 Evaporator Heat Transfer Coefficient
The overall heat transfer coefficient between the liquid heating jacket
and boiling urine remained constant during the change in solids concentration
from 12-26%. Although the temperature level rose slightly during the test,
both the temperature difference between heating liquid and urine and the dis-
tillation rate remained constant, indicating that the heat transfer coeffi-
cient remained constant. For the recovery rate of 1.04 kg/hr (2.3 ibs/hr),
and an average temperature difference of 50C (90F), the overall heat transfer
coefficient, U, was 23.7 Cal/hr-cm2-oC (48.5 Btu/hr-ft2-oF).
3.4.4 Water Yield
Water yield is defined as the amount of water recovered from the amount
of water available in the feed. The water which is not recovered represents
that amount lost in the residual sludge.
Because the unrecovered water is part of the residual sludge, the ulti-
mate water yield is largely determined by the final concentration of residue
at the end of the evaporator batching cycle. When recovering water from urine
GENERAL AMERICAN RESEARCH DIVISION
94
Page 103
and humidity condensate (respiration and perspiration condensate) from six
men, and concentrating the residues to 45%-50%, the water yield should be
98% or greater. The system was designed for concentrating the residues to 45%-
50% after 45 to 50 cumulative days of operation.
Based on the results of urine distillation tests conducted during Phase I,
approximately 60% solids in the final sludge is a reasonable operating limit
for vacuum distillation batching. At 60% solids concentration at the end of
a distillation batch and with essentially no water lost through the condenser
vent to the vacuum pump (as will be the case in a closed spacecraft environ-
ment), the ultimate recovery capability is 99% by weight, based on the amount
of water available in the urine and humidity condensate feed.
Testing conditions deviated slightly from the nominal design conditions
in that (1) only urine was fed to the evaporator instead of a urine-humidity
condensate mixture, and (2) the final concentration of residue was not reached
during the six cumulative days of testing. Also, because the system was oper-
ated as a bench test with an oil-type vacuum pump and water trap, rather than
in a closed environment with a dry vacuum pump and adsorbent bed, the water
vapor vented from the condenser along with noncondensable gases appeared as
unrecovered water. Prior to the six-day test, the system was operated to
recover 74.4 kg (163.8 lbs) of water from 108.2 kg (238 ibs) of urine; this
was a yield of 71.7%. During the six-day test, the system recovered 151.5 kg
(333 lbs) of water from 159.5 kg (351 lbs) of urine feed. For the total sys-
tem operation in which 225.9 kg of water was recovered from 267.7 kg of urine
feed, the water yield was 87.9%. Water yield as a function of sludge concen-
tration is shown in Figure 28.
GENERAL AMERICAN RESEARCH DIViON
95
Page 104
- 95 '-- i i
II~ I i o'
100
F i,-
90 ---- 90 ... - i i -~t : i
"End of 6-day test85
80 _- _H
IF -
70 Start of 6-day test
65 1 Calculated yield for combined urinJand humidity condensate feed
(1.65% solids).
2 Calculated yield for urine only feed(4.0% solids).
6 Measured yield for urine only feed.
55
0 10t o ttt 20 , 30 It 40 t 50 + 60 ~m 7
Solids Concentration in Evaporator, %
t:++ 4 +Tt # M-1#
Figure 28 WATER YIELD VS. SLUDGE SOLIDS CONCENTRATION
GENERAL AMERICAN RESEARCH DVISION
96
Page 105
3.4.5 Catalyst Heat Utilization
The catalyst unit and process vapor were heated to 1200 C (250 0 F) by a
closed recirculation heating loop. Heating liquid flow was maintained at
9.1 iph (2.4 gph); heating fluid was Dow Coming 550 Silicone Oil which has
a heat capacity of 0.38 cal/gm-oC (0.38 Btu/Ib-oF). The temperature dif-
ference between the 166 0 C (3300 F) inlet to the catalyst unit and the 1380C
(2800 F) outlet is 280 C (500F); this represents 96 kcal/hr (380 Btu/hr) heat
input to the catalyst unit. After the catalyst unit was heated, the heat
input from the recirculating liquid loop was needed to heat the vapor and the
small amount of oxidation gas. To heat 1.04 kg/hr (2.3 lbs/hr) of vapor plus
500 cc/min (STP) of oxygen from 270 C (800F) to 140 0 C (290 0F) required 56 kcal/
hr (220 Btu/hr). The remainder of the heat input, or 40 kcal/hr (160 Btu/hr),
was lost to the ambient as insulation losses. Expressed as a percentage, 56
of 96 kcal/hr is 58% heat utilization.
3.4.6 Condenser Heat Rejection
The system process heat was removed in the condenser by an ethylene
glycol-50% water coolant loop operating between the condenser and a freon-
cycle chiller unit. Coolant flow was constant at 6.4 1pm (1.7 gpm) and the
temperature pick-up in the condenser was 2.20C (40 F). This represents a
measured heat rejection rate of 696 kcal/hr (2720 Btu/hr). Heat removal re-
quired to cool the 120 0C (250 0F) incoming vapor to the 100C (500 F) condensing
temperature and to condense the 1.04 kg/hr (2.3 lbs/hr) of vapor was 666 kcal/
hr (2640 Btu/hr). Since the condenser temperature level was slightly below
ambient temperature, this small difference could readily have been the amount
of heat picked up from ambient air.
GENERAL AMERICAN RESEARCH DVISiON
97
Page 106
3.4.7 Condenser Heat Transfer Coefficient
The condenser heat load of 696 kcal/hr (2720 Btu/hr) was transferred to
the coolant through 0.55 m2 (6 ft2 ) of heat exchange area. Referring to
Table XIII, the condensate temperature within the condenser was generally 30
to 40C (50 to 70 F) above the coolant exit temperature. On the basis of the
average coolant temperature, the temperature difference between condensing
vapor and coolant was 4.40C (8'F). These conditions indicate the overall
heat transfer coefficient was 28 Cal/hr-cm2_oC (57 Btu/hr-ft2 -OF). This is
approximately one-half the value obtained in the lab test condenser; however,
the average coolant velocity in the zero-g condenser was 4.3 cm/sec (0.14 fps)
as contrasted to the coolant velocity of 10.7 cm/sec (0.35 fps) in the modi-
fied lab test condenser.
3.4.8 Condenser Venting and Condensing Efficiency
Removal of noncondensable gases from the condenser included some water
removal along with the gases and resulted in a condenser inefficiency.
The oxygen feed to the catalyst unit vented from the system through the
condenser and vacuum pump; since it was mixed in the steam flow, the air was
saturated at the condensing temperature. From the psychrometric relationship
for air-water vapor mixtures, the minimum amount of water loss could be pre-
dicted. For the average test conditions of 15 mm Hg pressure, 70C (450F).
condensing temperature and 500 cc/min (STP) noncondensable gas flow rate,
the water loss rate was 0.028 kg/hr (0.05 lbs/hr). This represented 2% of
the product vapor being removed through the vacuum vent line.
The vapor and gases leaving through the vent line and vacuum pump mix
with the surrounding atmosphere. In a closed environment, as a spacecraft
cabin, this vapor is condensed and fed to the evaporator along with
GENERAL AMERICAN RESEARCH t~VISiON
98
Page 107
respiration and perspiration condensate from the atmosphere humidity control
system. Although the vented vapor is not lost, it does result in a system
inefficiency because of the additional burden it places on the humidity control
system and the water recovery evaporator.
3.5 Product Water Quality
The quality of water is shown by analyses in Table XIV. These analyses
provided indicators of water quality but were not sufficient in duration to
give assurance that the water would conform to standards for potability over
long range use. These general indicators demonstrated that the recovered water
from these specific tests was of high quality.
During the six days of operation, the total organic carbon (TOC) concen-
tration, as measured daily, varied between 0.8 and 12.0 mg/l. This indicated
that the organic contaminant level was kept very low in concentration. In com-
paring the TOC of product water to the TOC concentration of raw condensate, the
TOC levels were reduced by 68% to 92%.
The TOC analysis was used in place of another analysis, chemical oxygen
demand (COD), to determine the organic contaminant level of the recovered
water. The standards for potability require that COD be below 100 mg/l while
TOC limits are not defined. Both the TOC and the COD analysis provides a mea-
sure of organic contaminant level but the modus operandi of each method is
completely different and therefore no direct correlation between the analyses
for all samples exists. However, for water recovered by distillation of urine,
it has been found that COD values are of the order of 2-1/2 to 3-1/2 times0
the TOC values for the same sample. Using a 2-1/2 to 3-1/2 correlation factor
when considering the COD potability limit of 100 mg/l, the corresponding
limit for TOC would be 28 to 40 mg/l. On the basis that TOC values were
GENERAL AMERICAN RESEARCH DIVISION
99
Page 108
TABLE XIV
WATER QUALITY ANALYSES
mz
SAMPLE #1 #2 #3 #4 1 #5 #6
COMPOUND Raw Prod. Raw Prod. Raw Prod. Raw Prod. Raw Prod. Raw Prod.
m 1) Total Carbon, mg/i 27.0 10.5 19.0 4.8 21.0 5.1 25.0 9.2 22.5 8.5 --- 16.5
2) Total Organic Carbon, mg/1 27.0 5.5 18.0 1.3 19.0 0.8 24.5 5.2 20.5 6.5 12.0Z
C) M 3) pH 4.0 6.7 4.1 6.0 4.9 6.4 3.5 6.4 3.7 6.9 --- 6.3
m 4) Aimonia, mg/1 <0.1 0.8 1.2 0.8 <0.1 0.5 <0.1 0.9 <0.1 0.2 <0.1
5) Conductivity, mhos 110 56 96 38 --- 32 145 35 36 22 --- 15
6) Turbidity, JTU 0.3 0.4 0.5 0.9 --- 0.08 0.08 0.08 0.04 0.08 --- 0.4
U 7) Viable bacteria density, --- * --- <0.2 --- <0.2 --- <0.2 --- 4.9 --- 0.7O MPN/mlz
*Undeterminable
Page 109
significantly below the 28-40 mg/l range, it can be assumed that the organic
contaminant levels were within acceptable limits.
Ammonia concentrations were consistently below 1 mg/l. Conductivity
varied between 15 and 56 pmhos. While there are no limits on these parameters
for potability, it is generally desirable to maintain ammonia content below
10 mg/l and for conductivity to be below 100 pmhos.
The product water pH varied between 6.0 and 6.7, thus falling within a
generally acceptable range of 6.0 to 8.0. Turbidity levels were consistently
below 1 JTU and within the maximum potability standards of 10 JTU.
With the exception of the first sample, viable bacteria density, as
determined by the most probable number technique, was below 10 organisms per
milliliter. The first sample had all positive tubes in all three dilution
levels, indicating an indeterminate result, and was possibly due to contamina-
tion in the testing equipment. The first sample as well as the remaining
five samples did not exhibit growth nor generate any odor upon standing for
several weeks.
3.6 Mechanical Performance
During the six-day performance test, the water recovery system was opera-
ted on a continuous basis. The urine feed control and evaporator liquid level
sensing subassembly which was developed and checkout tested in Phase I func-
tioned satisfactorily to automatically maintain the desired liquid level in
the evaporator. The evaporator impeller was operated at 80 rpm and required
55 watts of electrical power.
The condenser impeller was operated at 160 rpm and required 45 watts of
electrical power. The 160-rpm speed was determined during checkout testing
of the condenser as the speed necessary to assure repetitive performance of
GENERAL AMERICAN RESEARCH DIVISION
101
Page 110
the water pump (condensate pumpout from vacuum condenser to storage at one
atmosphere). The condensate pumpout was accomplished by two pumps connected
in series -- a gear pump and a secondary peristaltic pump. The water pump
controls which were initially evaluated during checkout testing of the zero-g
condenser continued to perform satisfactorily.
GENERAL AMERICAN RESEARCH DIVISiON
102
Page 111
Section 4
CONCLUSIONS AND RECOMMENDATIONS
4.1 Conclusions
Based on the development and testing activities conducted in Phase II
of the program the following conclusions have been reached:
(1) A condenser with an internal rotating impeller and coolant
surfaces directly opposite the condensing surfaces is an effective
condenser insofar as could be evaluated in normal gravity.
(2) The overall heat transfer coefficient from the condensing vapor
to the liquid coolant is approximately 49 Cal/hr-cm2- C
(100 Btu/hr-ft2 - F).
-) The VD/VF evaporator, catalyst unit and condenser functioned
satisfactorily based on thermal, mechanical and recovery performance
during a 145-hour evaluation test.
(4) The quality of recovered water, as measured by analyses for total
, organic carbon, pH, conductivity, turbidity, and viable bacteria
density (with one exception) was within established limits for
potability.
(5) The measured evaporator heat utilization and condenser heat rejec-
tion were equivalent to anticipated theoretical values for given
distillation rates.
(6) The catalytic oxidation unit utilized 56% of the heat supplied to
it by a closed recirculating hot liquid loop. The remaining 44%
was lost to the surrounding environment.
GENERAL AMERICAN RESEARCH DIVISION
103
Page 112
(7) The evaporator impeller rotating at 80 rpm required 55 watts of
electrical power; the condenser impeller operated at 160 rpm and
required 45 watts.
(8) A timer-actuated and pressure switch cut-out method of automatic
control of water pumpout was satisfactory.
4.2 Recommendations
Based on the observations and conclusions drawn from this phase of the
program, the following recommendations are made concerning the use, operation,
evaluation, and future testing of the VD/VF water recovery system.
(1) Further testing of the VD/VF water recovery process should be
carried out to evaluate:
(a) Distillation performance during one or more evaporator batching
cycles in which the sludge is concentrated to the range of
50%-60% solids.
(b) Water quality variations during batching cycles.
(c) Mechanical performance and durability of the complete system
during batching cycles over a sustained period, nominally
90 to 180 days.
(2) The VD/VF water recovery process should be evaluated with respect
to integrating this process into a total water management subsystem
for long duration missions.
GENERAL AMERICAN RESEARCH DVISON
104
Page 113
APPENDIX
DESIGN CALCULATIONS
I. Vacuum Still Sizing Calculations
The variables to consider in determining still size are:
1. Required heat transfer area
2. Diameter of still
3. Liquid-vapor profile in 1 "g" which is a function of
diameter and rotor speed, and
4. Volume of liquid in still
The equations for each of these variables must be determined before opti-
mum still size and shape can be determined.
Heat Transfer Area - The required area for heat transfer to boil the
urine is determined by the distillation rate and the boiling coefficient of
heat transfer.
The specified feed rate for a 6-man system is:
21#/day urine comprised of 20#/day of water
l#/day of solids
and 30#/day humidity condensate.
Maximum possible distillation rate is 20 plus 30 = 50#/day of water
Latent heat of vaporization = 1045 BTU/# @ 850F
Thermal input rate required = (1045 BTU/#) (50 #/day)
24 hr/day
= 2180 BTU/hrBTU
The anticipated boiling coefficient may be between 100 and 1000 2hr-ft - F
GENERAL AMERICAN RESEARCH DIVISION
A-1
Page 114
depending mainly on the liquid velocity at the heat transfer surface and the
effects of fouling.
References: Jakob & Hawkins, Elements of Heat Transfer,(3rd Ed.) Pp. 206-210.
J. H. Perry, Editor, Chemical Engineers Handbook,(4th Ed.) Section 10, Table 10-2.
For a temperature difference of 80F from metal surface to liquid,
h = 1250 BTU/hr-ft2- F for water at 1 atmosphere.
To consider fouling effects, h = 500 BTU/hr-ft2- F for the equivalent
coefficient of the deposit. This is a recommended value for heating and
vaporizing organic and inorganic liquids.
The overall coefficient including deposits is:
1 BTUh = 357 @ 1 atmosphere
1 _1 hr-ft2-_oF1250 500
To correct for boiling at reduced pressure:
r0.4h =(357) 0.5 psia = (357) (.259) = 92 BTU
14.7 psia hrft2_
Thermal input, Q= h A- AT
A = 2180 BTU/hr (80F) = 2.96 ft2
92 BTU/hr-ft2-OF
A = (2nR) (L)
GENERAL AMERICAN RESEARCH DVistO
A-2
Page 115
S-O0 R
_ ST/LL
I/A A/o UEATmI/ JACKT
"R", the radius of the still, is also a variable in determining motor
speed and liquid volume, The length of heating jacket, L, may be determined
after these other factors are considered in determining their dependence on
"R".
The configuration of the still and rotor assembly are shown in Figure A-1.
Liquid-Vapor Profile - The equation for a spinning body of liquid in one
"g" is a parabola expressed by: y = r 2 W2
2g
.2 Z)
GENERAL AMERICAN RSSEARCH DIVIlNB
A-3
Page 116
R)7 =RoV PR EXI
.... I"
L = Length of heat transfer jacketR = Radius of still and, approximately, radius of rotorSL= Velocity of rotor tip, ft/seca = Clearance between rotor and face of stillb = Clearance between rotor and radial wall of still
Figure A-i EVAPORATOR STILL AND ROTOR CONFIGURATION
GENERAL AMERICAN RESEARCH DIVISION
A-4
Page 117
In terms of "N" and "R", = (14.25in) I N RxIn terms YMAX RPM x 10in
This must be known to be sure the heating jacket is covered with liquid.
Liquid Volume - The equation relating liquid volume to rotor speed and
liquid profile is2
Volume = gh where h < MW2 -- MAX
This expression includes only the volume between the bottom of the para-
bola and the constraining wall and assumes that "h" will be less than YMAX
which is the maximum height the rotor is capable of producing in 1 "g". In
terms of "N" and "h", Volume = (11.05in 3 ) (h/in)2
100NRPM
Batching Duration - The length of duration of the batching process is
limited by the rate of solids addition, the final concentration of sludge
and the volume of sludge to be removed. The weight of solids at end of batch
is:
Ws = (solids feed rate) x (No. of days of batching)
also,
Ws = (Vol. if Sludge) x (sp. Gravity) x (Solids Weight Friction)
The latter equation neglects the precipitated solids which can be ex-
pected to be approximately 2% when the solids weight friction is 40%.
Equating these expressions and solving for "No. of days of batching":
(Vol. of Sludge) x (sp. Gravity) x (Solids
No. of days of batching = Weight Friction)
Solids feed rate
For a six-man rate of urine feed the solids feed rate is:
# urine # solids # solids3.5man-day x (6 men) x .05 urine = 1 day
man-day # urine day
GENERAL AMERICAN REGEARCH OtVCON
A-5
Page 118
Rotor Speed - The tip velocity of the rotor is expressed by
S= (w) x (R)
N Ror V = (8.73 ft/sec) 100 RPM x 10in
It is desirable to have a liquid velocity of 3 ft/sec or greater past the
heater transfer surface to minimize the effects of fouling.
Fluid Torque - The fluid torque required to shear the liquid along the
constraining walls is:
03-in 1 N RTorque = (1 .5 3 centipoise 00 RPM 10in
x (R/10)2 (R/lOin) (h/10in)
4 a/in b/in
Ref: Streeter, Fluid Mechanics, Chapter 4.
GENERAL AMERICAN RESEARCH DIVISION
A-6
Page 119
NOTE: This equation accounts for fluid torque only; the actual motor torque
required will also have to consider bearing friction, inertial effects at
start-up and from external accelerations during operation, etc.
Application of equations - To apply the foregoing equations in sizing the
evaporator still, further constraints must be made to reduce the number of
variables. First, it is desirable to limit the weight fraction of solids of
the end of the batching cycle to approximately 40%. The major factors which
contribute to this limitation are sludge viscosity, precipitated solids, and
weight fraction of extracted water. Typical values of these properties are
listed below for 30, 40, 50, and 60% concentrations. (Ref: Putnam, Composi-
tion and Concentrative Properties of Human Urine).
X Precipitated Solids Viscosity Extracted Water
# Solids (Solute) # Precipitate # water extracted
# Urine # Solutes Centipoise # water content
30% 1.5% 1.71 91.0%
40% 2.1% 2.45 94.1%
50% 2.9% 4.03 96.2%
60% 6.5% 5.98 97.4%
Both viscosity and weight fraction of precipitated solids start rising
at an increasing rate at 40-50% solids concentration. Increased viscosity
makes the sludge more difficult to spin inside the still. As solids preci-
pitate out of solution, they will tend to foul the heat input surface; also,
the precipitated solids are more abrasive on the components which must trans-
port the sludge from the still to a storage container. The 40-50% limitation
on solids concentration yields a weight fraction of extracted water of 94 to
GMEPAL AMERICAN RESEARCH DIVISION
A-7
Page 120
96% which is within the desired range of performance. Using 40% as the con-
centration at end of batch,
# urineNo. of days of batching = (Vol. of sludge) x (1.184 x 0.0361 # urine
.3in
# solids# urine
# solidsdays
No. of days of batching = (.0171 days) (Volume of Sludge
in
20 infor 20 days of batching, Volume = .01 = 1170in (Trial 1)
40 infor 40 days of batching, Volume .017 = 2340 (Trial 2)
From the equation of liquid volume as a function of the liquid-vapor
profile,
in 2Volume = (11.05 ) (h/in)
(N/100 RPM)2
h = Volume x (N/100 RPM) inches.3
1 1 .05in
. 3for volume = 1170 in and N = 100 RPM:
h = 10 .3in (Trial 1)
.3for volume = 2340 in and N = 100 RPM:
h = 14 .7in (Trial 2)
GENERAL AMERICAN RESEARCH DiVisO
A-8
Page 121
Letting h = MAX = (14.25 )in (N/100 RPM) x (R/10in )2
and solving for R,
in in
10in 1 0 .3 inR = for h = 10.3(N/100 RPM) 14.25
R = 8 .5in (Trial 1)
0in inR = 14. for h = 14.7
(N/100 RPM) 14.25
R = 1 0 .2in (Trial 2)
For each of these cases, the liquid velocity past the heat transfer surface is:
N RV = (8.73 ft/sec) (100RPM) x (
100 RPM in10
100 8.5= (8.73) 10 (-8) = 7.4 ft/sec (Trial 1)
100 102
= (8.73) ( 7,- = 8.9 ft/sec (Trial 2)
This is in the desired range to aid in preventing fouling.
ft 2Heat transfer area required in 2.96
A = (2TrR)L
L =(2.96)(144) = 8.0 (Trial 1)S (2r) (8.5)
(2.96) (144) inL (2.96)(144) = 6 .65 (Trial 2)(27r) (10.2)
GENERAL AMERICAN RESEARCH IL4VIION
A-9
Page 122
For both cases, the height of liquid, h, is greater than the height of
the heat transfer jacket, L, thus assuring that the heating area is covered
with liquid.
From the foregoing calculations, the still dimensions should be 8.5
inches radius by 10.3 inches high for 20 days batching duration or 10.2
inches radius by 14.7 inches high for 40 days duration.
II. Evaporator Assembly Heating Analysis
The heating loop temperatures and process fluid temperatures are summar-
ized on the evaporator heating diagram Figure A-2. This diagram and the ac-
companying analyses assume waste heating liquid flow through interconnected
loops for the catalytic oxidation unit and the vacuum still assembly.
GENERAL AMERICAN RESEARC H DIVIO{N
A-10
Page 123
4T 105 n140
0 00 oo ooco-
A / 5 "o /4UoF
A0 /3,27 70
FigeA- V P C SOG.
L/&LP/ JAccr/OO"F A/oe, Tt//R
jI/ C 70 .
Figure A-2 EVAPORATOR HEATING DIAGRAM
GENERAL AMERICAN RESEARCH DAVIB~ON
A-.11
Page 124
Total heat requirements are:
BTUSensible heating of liquid = (2#/hr) (1BT )(900 - 700F) = 40
Boiling of urine = (2#/hr)(1045 BTU/#) = 2090
Sensible heating of vapor = (2#/hr)(.45)(120 - 90) = 27
2157Heat losses through insulation = 136
(See p. A-18)2293
Flow = QCp. AT
For heating liquid in @ 300oF, Cp =.6 BTU
out @' 150 0F
Flow 2260 BTU/hr , 25#/hr
(.6 -- f (1500F)
Volume flow = (25#/hr) x 1 gal = 3 gal/hr8.34#
Heat Required in Catalyst Bed:
(2#/hr)(.45)(2500 F - 900 F) = 144
plus 40 watts losses = 136
280 BTU/hr (82 watts)
Heating Liquid AT in Catalyst Bed = 280 BTU/hrBTU
(.6 -b-)( 2 5 #/hr)
= 190F
GENERAL AMERICAN RESEARCH DVIIOAN
A-12
Page 125
VAPOR RECUPERATOR AREA REQUIRED
V/APoe OUrIZo (Zo DES/ P 1AX, 76/4P.)
/00 J, 7
LIQu, JACirT
(250-100) - (120-100)
Q = h, (AT)in: (AT) n in 250-1120-100
130 130 - 65oF150 220
h vapor z 1 BTU/hr-ft2-_F
h vapor << h water bath
(2#/hr) (.45 T ) (130 0 F) 1DiameterA = T= 1.8 ft
(1 ) (650F)hr-ft - F
A 1.8 ft2L = --- = (1") x 12 in/ft = 6.9 ft
L = w (Diameter of coil) (No. of coils); Coil Diameter z 22 in
6.9 ftNo. of Coils = ) 22 in x 12 in/ft = 1.2 Coils
GENERAL AMERICAN RESEARCH ONVISION
A-13
Page 126
HEATING COIL AREA REQUIRED FOR HEAT TRANSFER TO LIQUID JACKET:
/50 our
u q. JrR.h/ Q
Q = (2#/hr) (1 BT)( 9 0-70)(OF) + 1045 BTU/# = 2130 BTU/hr
Q = UA (AT) in
(AT)ln (281-100) - (150-100) 134 134 -10SOFin 281-100 181 1.27
150-100 50
U 1 hjacket" hheating liquid
(jacket) h (heating liquid)
S t- 100 BTU/hr-ft2- F
U = 50
2130 BTU/hr 2A (50 BTU )(105OF) = .41 ft
(502 )(105 F)hr-ft 2_o F
A = r D * L 3/8" O.D. x .035 wall
.41 ftL = .41 ft 2 x 12 in/ft = 5.1 ft Z.305" I.D.(.)(.305in)
L = r (Coil Diameter)(No. Coils)
No. Coils - L 5.1 ft = .8 CoilsSD =r (2 ft)
GENERAL AMERICAN RESEARCH DIVI1ION
A-14
Page 127
Heat Dissipation in Catalyst Bed:
6- .P1. CA L4YS r6eD
/A/ L -2= F-. .
Catalyst Bed Flow Area = (w/4)(6)2 = 28.2 ln2
If Hx Area is 1/2 of Flow Area,
inH Area = (1/2)(28.2) = 14.1
x
Q = h " A (AT)n = (2#/hr)(.45 BTU )(Texitn Te + 90Fexit
(AT)In is approximately: 280 - ( exit + 90 (T)2 = (T)Avg
h - 1 BTU/hr-ft 2_ O F
Solving for Texit:
( BTU/hrft2F)(14. n ) T + 90(1 BTUhr-ft- F)(14.1 ) 280 - 2 ) = (2)(.45)(T-90) BTU/hr2 2
in 2144 /ft
(.098)(560 - T + 90) = (1.8)(T - 90)
650 - T = 18.4T - 1650
19.4 T = 1650 + 650
19.4 T = 2300
T = 119 0F (too low)
GENERAL AMERICAN RESEARCH OVI SION
A-15
Page 128
F.u CA4L YYT
t<4P_ F~ Co/L Ei TUBE /EAT 7
ST/LL AEA 37Wc&E, 7Z/US• q'/r/. 70 2-/7c'/ P/
7-2 22 (/2)(D) 4in.
x D
2 Rows = 78.8 i n
2For 78.81n of area (preheater):
(1 BTU/hr-ft2 F)78 T + 902 F)78.8 (280 2 = (2) (.45)(T - 90)
in 2144 /ft
(.547) (560 - T + 90) = (1.8)(T - 90)
650 - T = 3.29 T - 164
814 = 4.29 T
T = 190
GENERAL AMERICAN RESEARCH DIVISION
A-16
Page 129
BTUQPreheater = (2#/hr)(.45 # )(190 - 90)OF = 90 BTU/hr
QCatalyst = 278 - 90 = 188 BTU/hr
Bed Conduction
Catalyst packed between fins
6 Diameter
Q = 188 Btu/hr thru fins
t = Fin thickness
kA BTU/ftQ = (AT) k = 10 BTU/ftx hr-ft 2 -oF
At = 100 0F
x = (6" - 1")/2 = 2.5 i n
A = (8 fins)(10i n high)t
(10 BTU-ft )(8)(10 ) (t) (100 F) 1 ft(188 BTU/hr) -ft2- OF x 1 ft
hr-ft2- F2.5in 12
t = .0705
GENERAL AMERICAN RESEARCH DIVISION
A-17
Page 130
Catalytic Reactor -
Heat Losses- VAPOE ILTR (REA)
SULA 770oAJ w T)/EC MA
N-
inr =4.5
2TrL Tr(r1) r2 = r + x
Heat Loss, Q = in .2/rl 1 + r2 rl '1 (t.- t )k +- i ambk + r2h k
tl = 300OF max
tamb = 700 F
BTU-ink=.25
hr-ft2 -OF
BTUh= 1hr-ft2-?F
For x = i n , V2 = 4.5 + 1 = 5.5 in
in 22 11n) (7) (4.5i ) 2(2r)(11in) iin BTU 1 ft2
Q= In(5.5/4.5) + 1 + 1 1 (300 - 70)(F 2 4 )x in.25 (5.5)(1) .25 1 hr-ft 144
69.1 63.7 230
.796 + .182 4 + 1 144
69.1 63.7
230.972 5 144
230= (71.1 + 12.74)
(83.84) 230 = 136 BTU/hr144
Heat losses thru insulation Z 40 wattsGENERAL. AMERICAN RESEARECH IVIION
A-18
Page 131
III. Vapor Line Sizing Calculations
Pressure Drop in Evaporator to Condenser Vapor Line:
Poiseuille's Equation for compressible flow
2 2 256 pL wRTS- P2 D4
o o FL O/
EVA Po aR COq-DESER
ALLo/ABLE : T- ?VAPoe 7-rMP6RArTe/F LA ,4/dq
eAcUpeA rxt = 125 7o.14o *F
140 OF = 60 OC
@ 60 0C, i = 110 micropoises
.lbf-sec1 2 = 478 poises
ft
I lbf-sec 1-6 ft 2 -6 lbf-sec
(110 x 10- 6 poises) x78 poises = .23 x 10 ft 2
2 2pl - P2 (P1 + P 2 )(p 1 - P2 = (10.2 + 9.2) (1) = 19.4 mmHg
GENERAL AMERICAN RESEARCH DIVISION
A-19
Page 132
Solve for D:
4 256 pL wRTD(p,2_ p22)
lbf-sec-6 2 ft lbf
(256)(.23 x 10 - 6 ft 2 )(6 ft) (85.7 uRlb) (6000R)(50 #/day)
2 1 lbf/in 2 3600 sec 24 hr51.7 mmHg hr day
-64 (256) (.23) (10 - ) (6) (85.7) (600) (33) (2675)(r) (19.4) (3600) (24)
D = .824 (I.D.) Use 1 Nom O.D. Lines
GENERAL AMERICAN RESEASRCH VBISION
A-20
Page 133
IV. Sludge Pumping Calculations
E!D
P/Ta7 TUoEC
AIIUAL S1./AF VAL V
LL
Pressure Head Developed @ Pitot Tube
q = (.518 psi) (Sp. Gravity) ( N 12
q = (.518 psi)(1.184) 1001) = .88 psi for fluid velocityL 2 equal to impeller velocity
R = 12i n
N = O100 RPM
Sp.Gr. = 1.184 @ 40%
qactual = (1/2)(.88 psi) = .44 psi allowing for fluid slippage.
GENERAL AMERICAN RESEARCH OIVISION
A-21
Page 134
For laminar flow through pipes:
32 VLY3- = D2 (Equation of Poiseuille)
V = Q/A; A = (n/4)D2
128Ap = - LQ Q = volume flow rate
D D = I.D. of pump-out tube
L = Length of line
p = viscosity of sludge
For 40 days of batching; 40% concentration at end of batch:
V = 2.45 centipoise
Volume of sludge = 2340 in3
Try D = .625 in (3/4 0.D. x 1/16 wall)
L = 10 ft
S( p)(D4)128 PL
Allowing 1/10 of available Ap for friction drop and 9/10 for losses in
valves, elbows; pline = .044
(.044 psi)(.625 in)4 47,800 12 inQ (128)(2.45)(10 ft) x 2 ft
lb sec/ft
= 3.86 in3/sec
volumeVolume flow rate, Q = time
volumeor time =
time = 2340 in3 = 600 sec; 3/4 diameter line is ok.
3.86 in /sec
GENERAL AMERICAN RESEARCH OIVISION
A-22