Date post: | 10-Apr-2018 |
Category: |
Documents |
Upload: | poonam-kolge |
View: | 218 times |
Download: | 0 times |
8/8/2019 GAURAV Ratio Analysis
http://slidepdf.com/reader/full/gaurav-ratio-analysis 24/60
C) Utility to Creditors:-
The creditors or suppliers extend short term credit to the concern. If the current assets
are quite sufficient to meet current liabilities then the creditors will not hesitate inextending credit facilities. Current & acid-test ratios will give an idea about the
financial position of the concern.
D) Utility to Employees:-
The employees are also interested in the financial position of the concern
especially profitability. Their wage increases & fringe benefits are elated to the
volume of profits earned by the concern. Various profitability ratios relating to gross
profits, operating profit, net profit, etc. enable employee to put forward their view
points for the increase of wages & other benefits.
E) Utility to Government:-
Government is interested to know the overall strength of the industry.
Government may base its future policies on the basis of industrial information
available from various units. The ratios may be used as indicators of overall financialstrength of public as well as private sector.
F) Tax Audit Requirements:-
Section 44 AB was inserted in the Income Tax Act by the Finance Act, 1984.under this
section every assessed engaged in any business & having turnover or gross receipts
exceeding Rs. 40 lak is required to get the accounts audited by a chartered accountant &
submit the tax audit report before the due date for filing the return under Section 139(1).
8/8/2019 GAURAV Ratio Analysis
http://slidepdf.com/reader/full/gaurav-ratio-analysis 25/60
Types of Ratios
Income
Profitability
Liquidity
Bankruptcy
Coverage
Leverage
• Income Ratios
Turnover of Total Operating Assets
Net Sales= Turnover of Total Operating Assets Ratio
Total Operating Assets*
Obviously, an increase in sales will necessitate more operating assets at some point (sales
may rise without additional investment within a given range, however); conversely, an
inadequate sales volume may call for reduced investment.
*Total operating assets = total assets - (long-term investments + intangible assets)
8/8/2019 GAURAV Ratio Analysis
http://slidepdf.com/reader/full/gaurav-ratio-analysis 26/60
Net Sales to Tangible Net Worth
Net Sales= Net Sales to Tangible Net Worth Ratio
Net Worth
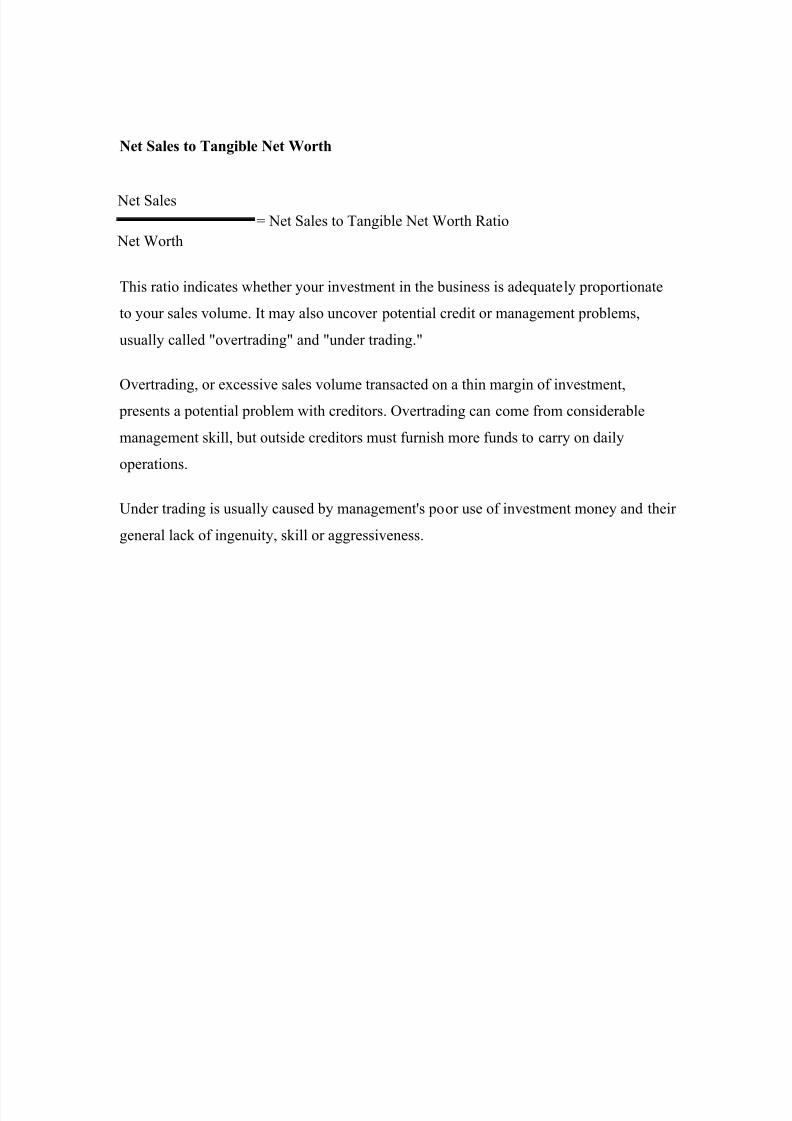
This ratio indicates whether your investment in the business is adequately proportionate
to your sales volume. It may also uncover potential credit or management problems,
usually called "overtrading" and "under trading."
Overtrading, or excessive sales volume transacted on a thin margin of investment, presents a potential problem with creditors. Overtrading can come from considerable
management skill, but outside creditors must furnish more funds to carry on daily
operations.
Under trading is usually caused by management's poor use of investment money and their
general lack of ingenuity, skill or aggressiveness.
8/8/2019 GAURAV Ratio Analysis
http://slidepdf.com/reader/full/gaurav-ratio-analysis 27/60
• Profitability Ratios
Closely linked with income ratios are profitability ratios, which shed light upon the
overall effectiveness of management regarding the returns generated on sales and
investment.
Gross Profit on Net Sales
Net Sales - Cost of Goods Sold
= Gross Profit on Net Sales Ratio
Net Sales
Does your average markup on goods normally cover your expenses, and therefore result
in a profit? This ratio will tell us. If your gross profit rate is continually lower than your
average margin, something is wrong! Be on the lookout for downward trends in your
gross profit rate. This is a sign of future problems for your bottom line.
This percentage rate can — and will — vary greatly from business to business, even
those within the same industry. Sales, location, size of operations, and intensity of
competition are all factors that can affect the gross profit rate.
• Net Operating Profit Ratios
Net Profit on Net Sales
EAT*= Net Profit on Net Sales Ratio
Net Sales
8/8/2019 GAURAV Ratio Analysis
http://slidepdf.com/reader/full/gaurav-ratio-analysis 28/60
This ratio provides a primary appraisal of net profits related to investment. Once your
basic expenses are covered, profits will rise disproportionately greater than sales above
the break-even point of operations.
Net Profit to Tangible Net Worth
EAT= Net Profit to Tangible Net Worth Ratio
Tangible Net Worth
This ratio acts as a complementary appraisal of net profits related to investment. This
ratio sizes up the ability of management to earn a return.
Net Operating Profit Rate of Return
EBIT
= Net Operating Profit Rate of Return Ratio
Tangible Net Worth
Your Net Operating Profit Rate of Return ratio is influenced by the methods of financing
you utilize. Notice that this ratio employs earnings before interest and taxes, not earnings
after taxes. Profits are taken after interest is paid to creditors. A fallacy of omission
occurs when creditors support total assets.
Management Rate of Return
Operating Income= Management Rate of Return Ratio
Fixed Assets + Net Working Capital
8/8/2019 GAURAV Ratio Analysis
http://slidepdf.com/reader/full/gaurav-ratio-analysis 29/60
This profitability ratio compares operating income to operating assets, which are defined
as the sum of tangible fixed assets and net working capital. This rate, which you may
calculate for your entire company or for each of its divisions or operations, determines
whether you have made efficient use of your assets. The percentage should be compared
with a target rate of return that you have set for the business.
• Liquidity Ratios
While liquidity ratios are most helpful for short-term creditors/suppliers and bankers,
they are also important to financial managers who must meet obligations to suppliers of
credit and various government agencies. A complete liquidity ratio analysis can help
uncover weaknesses in the financial position of your business.
Quick Ratio
Cash + Marketable Securities + Accounts Receivable (net)= Quick Ratio
Current Liabilities
Also known as the "acid test," this ratio specifies whether your current assets that could
be quickly converted into cash are sufficient to cover current liabilities. Until recently, a
Current Ratio of 2:1 was considered standard. A firm that had additional sufficient quick
assets available to creditors was believed to be in sound financial condition.
Receivables Turnover
Total Credit Sales= Receivables Turnover Ratio
Average Receivables Owing
Another indicator of liquidity, Receivables Turnover Ratio can also indicate
management's efficiency in employing those funds invested in receivables. Net credit
8/8/2019 GAURAV Ratio Analysis
http://slidepdf.com/reader/full/gaurav-ratio-analysis 30/60
sales, while preferable, may be replaced in the formula with net total sales for an
industry-wide comparison.
Current Debt to Net Worth
Current Liabilities= Current Debt to Net Worth Ratio
Tangible Net Worth
Your business should not have debt that exceeds your invested capital. This ratio
measures the proportion of funds that current creditors contribute to your operations. For
small businesses a ratio of 60 percent or above usually spells trouble. Larger firms should
start to worry at about 75 percent.
Funded Debt to Net Working Capital
Long-Term Debt= Funded Debt to Net Working Capital Ratio
Net Working Capital
Funded debt (long-term liabilities) = all obligations due more than one year from the
balance sheet date (Note): Long-term liabilities should not exceed net working capital.
8/8/2019 GAURAV Ratio Analysis
http://slidepdf.com/reader/full/gaurav-ratio-analysis 31/60
• Bankruptcy Ratios
Many business owners who have filed for bankruptcy say they wish they had seen some
warning signs earlier on in their company's downward spiral. Ratios can help predict
bankruptcy before it's too late for a business to take corrective action and for creditors to
reduce potential losses. With careful planning, predicted futures can be avoided before
they become reality. The first five bankruptcy ratios in this section can detect potential
financial problems up to three years prior to bankruptcy.
Working Capital to Total Assets
Net Working Capital= Working Capital to Total Assets Ratio
Total Assets
This liquidity ratio, which records net liquid assets relative to total capitalization, is the
most valuable indicator of a looming business disaster. Consistent operating losses will
cause current assets to shrink relative to total assets.
A negative ratio, resulting from negative net working capital, presages serious problems.
EBIT to Total Assets
EBIT
= EBIT to Total Assets RatioTotal Assets
How productive are your business's assets? Asset values come from earning power.
Therefore, whether or not liabilities exceed the true value of assets (insolvency) depends
upon earnings generated
8/8/2019 GAURAV Ratio Analysis
http://slidepdf.com/reader/full/gaurav-ratio-analysis 32/60
Sales to Total Assets
Total Sales= Sales to Total Assets Ratio
Total Assets
This ratio, which uncovers management's ability to function in competitive situations
while not excluding intangible assets, is inconclusive if studied by itself. But when
viewed alongside, Working Capital to Total Assets, Retained Earnings to Total Assets,and EBIT to Total Assets, it can confirm whether your business is in imminent danger.
Equity to Debt
Market Value of Common + Preferred Stock
= Equity to Debt RatioTotal Current + Long-Term Debt
This ratio shows you by how much your business's assets can decline in value before it
becomes insolvent.
8/8/2019 GAURAV Ratio Analysis
http://slidepdf.com/reader/full/gaurav-ratio-analysis 33/60
• Coverage Ratios
Times Interest Earned
EBIT= Times Interest Earned Ratio
I
EBIT = earnings before interest and taxes
I = dollar amount of interest payable on debt
The Times Interest Earned Ratio shows how many times earnings will cover fixed-
interest payments on long-term debt.
• Leverage Ratios
This group of ratios calculates the proportionate contributions of owners and creditors toa business, sometimes a point of contention between the two parties. Creditors like
owners to participate to secure their margin of safety, while management enjoys the
greater opportunities for risk shifting and multiplying return on equity that debt offers.
Note: Although leverage can magnify earnings, it exaggerates losses.
Equity Ratio
Common Shareholders' Equity= Equity Ratio
Total Capital Employed
The ratio of common stockholders' equity (including earned surplus) to total capital of the
business shows how much of the total capitalization actually comes from the owners.
8/8/2019 GAURAV Ratio Analysis
http://slidepdf.com/reader/full/gaurav-ratio-analysis 34/60
Debt to Equity Ratio
Debt + Preferred Long-Term= Debt to Equity Ratio
Common Stockholders' Equity
A high ratio here means less protection for creditors. A low ratio, on the other hand,
indicates a wider safety cushion (i.e., creditors feel the owner's funds can help absorb
possible losses of income and capital).
8/8/2019 GAURAV Ratio Analysis
http://slidepdf.com/reader/full/gaurav-ratio-analysis 35/60
RESEARCHMETHODOLOG
Y
8/8/2019 GAURAV Ratio Analysis
http://slidepdf.com/reader/full/gaurav-ratio-analysis 36/60
RESEARCH METHODOLOGY
The study is made on the basis of secondary data. The annual by the firms were of greathelp collection the necessary information. In addition to this, the personal of “GENERALMILLS INDIA PVT LTD” were very co-operative in forwarding the necessaryinformation as and when required.
Tools for data collection
Data require for this project is mainly tow type’s i.e. primary data & secondary data and Ialso use the Graphs in analysis of ratio which help to understand to every one.
Primary Data: -
Those are collected fresh and the time and this happens to be original in character.The primary data were collected through personal ineraction with the manager andofficial of the frim.
Secondary Data: -
Secondary data means data is already available i.e. they refer the data which havealready been collected and analyzed by someone else, then he has to look into varioussources form whose he can obtain them, usually the publications technical trade
journal books, Magazines and Net and Reports of company etc.
• SOURCES OF COLLECTION OF DATA:-
1. Staff of the GENERAL MILLS INDIA PVT LTD
2. Magazines and Net
3. Journal Books of GENERAL MILLS INDIA PVT LTD
4. Annual General Report of 2002-03, 2003-04, 2005-06 and 2006-07
8/8/2019 GAURAV Ratio Analysis
http://slidepdf.com/reader/full/gaurav-ratio-analysis 37/60
DATA ANALYSIS
8/8/2019 GAURAV Ratio Analysis
http://slidepdf.com/reader/full/gaurav-ratio-analysis 38/60
BALANCE SHEET FOR THE LAST FOUR YEARS (CURRENCY :IN RUPEES)
Schedule 2003 2004 2006 2007
SOURCES OF FUNDS Shareholders' funds
Share capital 3 1,253,940,000 1,803,940,000 640,197,000 1,300,197,000
Reserves and surplus- share premium 288,562,500 288,562,500 47,305,294 47,305,294
Loan funds
Secured 4 55,274,469
Unsecured 5 357,500,001 187,500,000 425,574,576
1,955,276,970 2,280,002,500 687,502,294 1,773,076,870
APPLICATION OF FUNDS
Fixed Assets Gross block 6 506,087,872 226,869,898 298,374,511 322,247,600
Less: Accumulated deprecation 69,937,609 79,190,444 121,491,977 147,737,700
Net block 439,150,263 147,679,454 176,882,534 174,509,900
Capital work in progress 2,221,109 5,051,866 10,197,228 8,343,741
441,371,372 152,731,320 187,079,762 182,853,641
Current Assets, Loans & Advances
Inventories 7 115,927,433 159,588,841 160,182,311 288,456,802
Sundry Debtors 8 22,404,499 67,532,889 81,975,383 195,300,489Cash and Bank balances 9 40,130,969 73,982,222 40,355,066 684,208,080
Loans and advances 10 72,500,662 88,578,699 114,531,881 156,105,241
250,963,563 389,682,651 397,044,641 1,324,070,612Less: Current liabilities andprovisions
Current liabilities 11 147,247,819 206,291,962 244,576,327 302,604,084
Provisions 12 4,206,130 11,119,715 15,926,562 26,419,047
Net current assets 99,509,614 172,270,974 136,541,752 995,047,481
Profit and Loss Account 1,414,395,984 1,955,000,206 363,880,780 595,175,748
1,955,276,970 2,280,002,500 687,502,294 1,773,076,870
8/8/2019 GAURAV Ratio Analysis
http://slidepdf.com/reader/full/gaurav-ratio-analysis 39/60
PROFIT AND LOSS ACCOUNT FOR THE LAST FOUR YEARSfor the year ended 31 March
Schedule 2003 2004 2006 2007
Income
Gross Sales- manufactured goods 714,620,331 927,630,136 1,142,382,086 1,578,493,729Less: Excise Duty 3,352,445 3,567,171 13,049,932 24,338,814
Net Sales- manufactured goods 711,267,886 924,062,965 1,129,332,154 1,554,154,915
Sales- Traded goods 38,375,290 17,385,794 29,460,874 46,686,596
Total Net Sales 749,643,176 941,448,759 1,158,793,028 1,600,841,511
Other Income 13 1,574,052 170,350 19,235,293 68,278,198
751,217,228 941,619,109 1,178,028,321 1,669,119,709
Expenses
Cost of goods sold 14 466,637,879 569,265,804 756,065,488 1,076,253,832
Purchase of traded goods 11,610,913 9,000,437 27,935,741 29,363,639
Personnel costs 15 69,845,479 81,213,374 105,675,553 143,944,363
Selling, general and adminirtisation 16 465,529,996 456,543,879 451,363,513 574,896,657
Depreciation and amortization 6 21,031,072 23,022,645 22,519,284 27,618,264
Interest (including interest on term loans) 48,227,920 38,599,784 10,197,887 42,450,612
1,082,883,259 1,177,645,923 1,373,757,466 1,894,527,367
Loss for the year before one off items 331,666,031 236,026,814
Goodwill written off 6a 151,512,500
Settlement of dispute 18 16,014,908
Net loss for the year 331,666,031 403,554,222 195,729,145 225,407,658
Balance in profit & loss A/c brought forward 1,082,729,953 1,414,395,984 165,690,233 363,880,780
Add: Non compete fees written off 6b 137,050,000
Less: Provision for fringe benefit tax 2,461,402 5,887,310
Net loss for the year after taxation 198,190,547 231,294,968Balance in profit & loss A/c carriedforward 1,414,395,984 1,955,000,206 363,880,780 595,175,748
Earnings per share 25 3 3 4 3.56
8/8/2019 GAURAV Ratio Analysis
http://slidepdf.com/reader/full/gaurav-ratio-analysis 40/60
• Current Ratio = Current Assets, Loans & Advances / CurrentLiabilities & Provision
Particulars 2007 2006 2004 2003
Current Assets 1,324,070,612 397,044,641 389,682,651 250,963,563
Current Liabilities 754,597,707 260,502,889 404,911,677 564,228,419
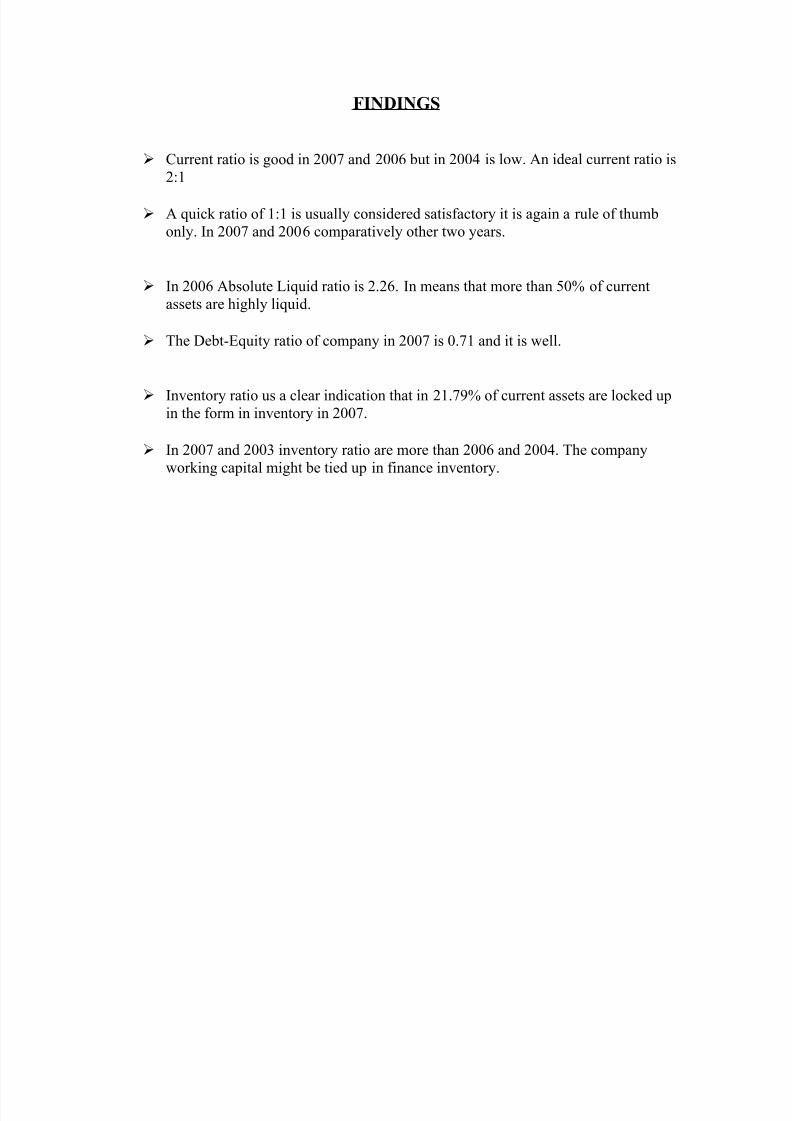
Current Ratio 1.75 1.52 0.96 0.44
00.20.40.60.8
11.21.41.61.8
RATIO
2007 2006 2004 2003
YEAR
Cureent Ratio
Cureent Ratio
• Interpretation:
As a conventional rule, a current ratio of 2:1 or even 1.5:1 is considered satisfactory. Thesolvency ratio indicates ability of a concern to meet its total liabilities out of its totalassets. In the 2007 the position is good i.e. 1.75, in the year 2006, 2004 and 2003 the ratioare 1.52, 0.96 and 0.44 respectively.
8/8/2019 GAURAV Ratio Analysis
http://slidepdf.com/reader/full/gaurav-ratio-analysis 41/60
• Liquid Ratio = Current Assets - Inventories / Current Liabilities -Bank Over Draft
Particulars 2007 2006 2004 2003
Current Assets 1,324,070,612 397,044,641 389,682,651 250,963,563
Inventory 288,456,802 160,182,311 159,588,841 115,927,433
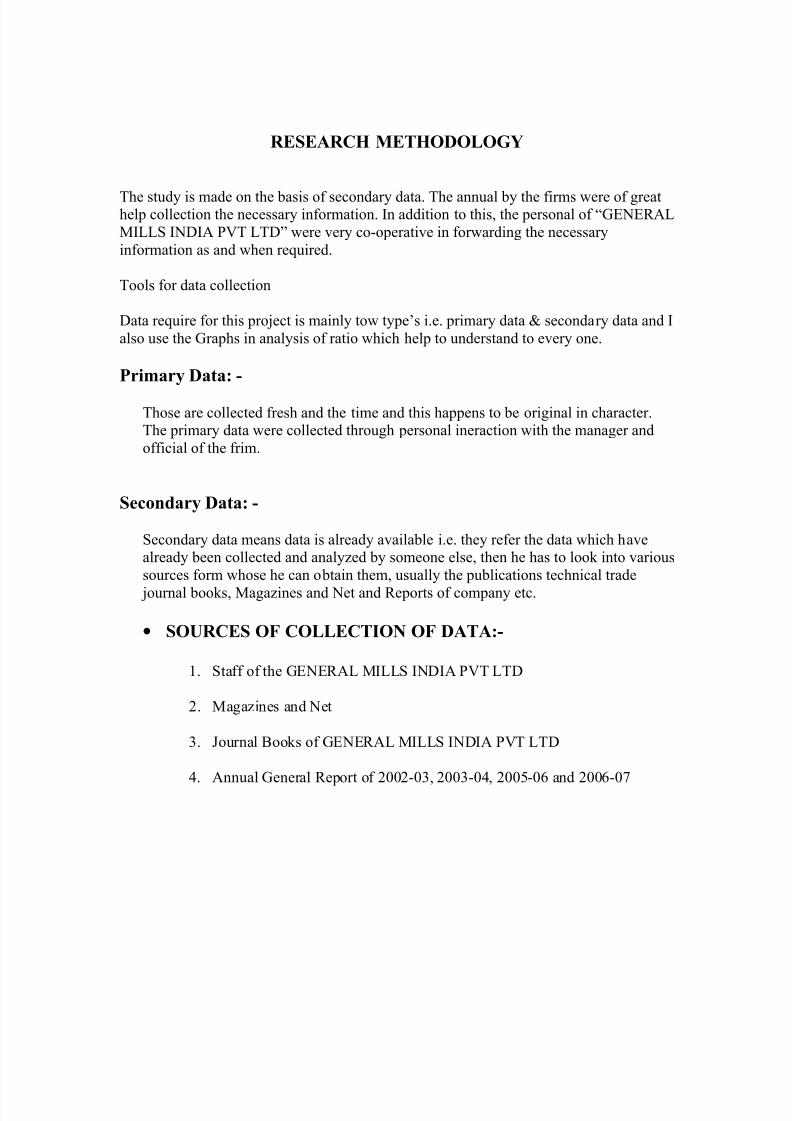
Current Assets - Inventories 1,035,613,810 236.862,330 230,093,810 135,036,130
Current Liabilities 754,597,707 260,502,889 404,911,677 564,228,419
Bank Over Draft Nil Nil Nil Nil
Current Liabilities - Bank Over Draft 754,597,707 260,502,889 404,911,677 564,228,419
Liquid Ratio 1.37 0.9 0.57 0.24
0
0.2
0.4
0.6
0.8
1
1.2
1.4
RATIO
2007 2006 2004 2003
YEAR
Liquid Ratio
Liquid Ratio
• Interpretation:
The Liquid ratio in 2007, 2006, 2004 and 2003 is 1.37, 0.9, 0.57 and 0.24 respectively.An ideal liquid ratio is 1:1. It is represent the highly solvent position of the company.
8/8/2019 GAURAV Ratio Analysis
http://slidepdf.com/reader/full/gaurav-ratio-analysis 42/60
• Absolute Liquid Assets = Absolute Liquid Assets / CurrentLiabilities
Particulars 2007 2006 2004 2003
Absolute Liquid Assets 684,208,080 40,355,066 73,982,222 40,130,969Current Assets 302,604,084 244,576,327 404,911,677 564,228,419
Absolute Liquid Ratio 2.26 0.16 0.18 0.07
0.00
0.50
1.00
1.50
2.00
2.50
RATIO
2007 2006 2004 2003
YEAR
Absoluted Liquid Ratio
• Interpretation:
The company Absolute Liquid ratio is 2.26:1 and an ideal ratio is 0.5:1. It means thatmore than 50% of current assets are highly liquied.
8/8/2019 GAURAV Ratio Analysis
http://slidepdf.com/reader/full/gaurav-ratio-analysis 43/60
• DEBT / EQUITY RATIO = DEBET / EQUITY
Particulars 2007 2006 2004 2003
Debt 287,213,617 228,200,205 389,682,651 250,963,563
Equity 752,326,546 323,621,514 137,502,294 128,258,115Debt / Equity Ratio 0.36 0.71 1.35 1.00
0.00
0.20
0.40
0.60
0.80
1.00
1.20
1.40
RATIO
2007 2006 2004 2003
YEAR
Debt / Equity Ratio
Debt / Equity Ratio
• Interpretation:
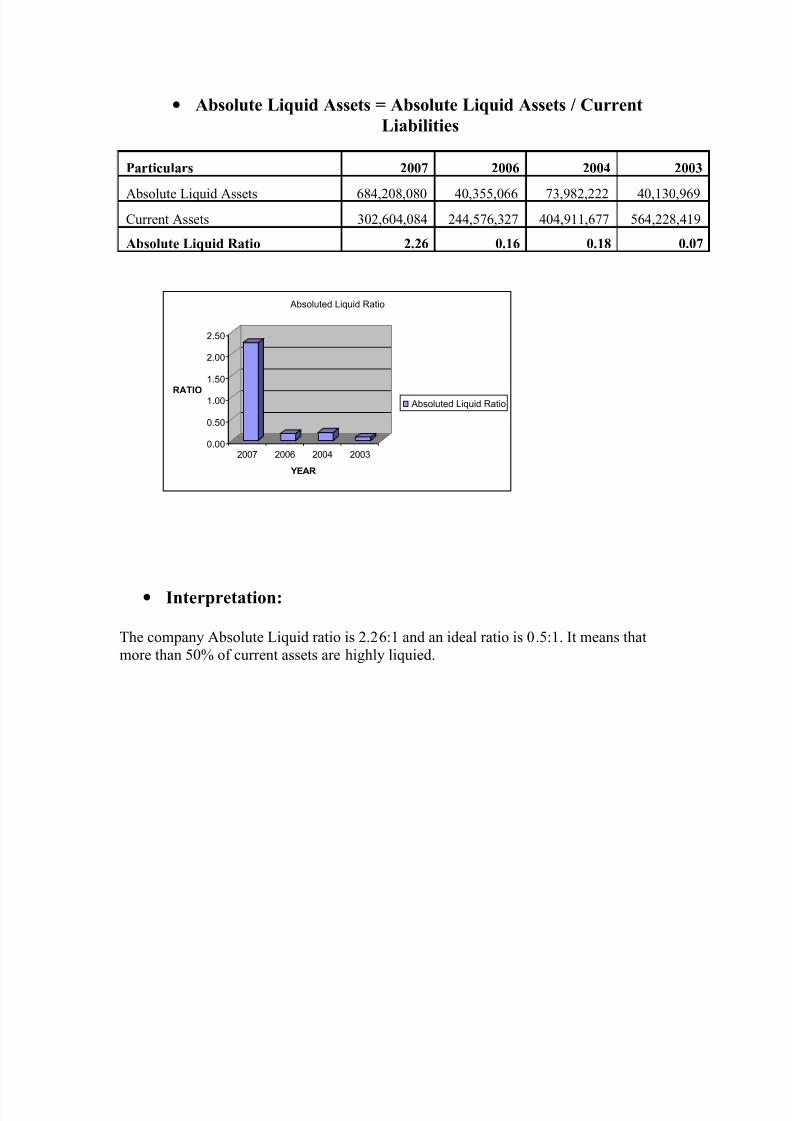
The Debt-Equity ratio of company in 2006 is 0.71 and it is well with in the accepted of 2:1. The company long-term solvency is more satisfactory. Since the proportion of debtto equity is low, the company is said to be low greater and could not reap the benefit of trading on equity.
8/8/2019 GAURAV Ratio Analysis
http://slidepdf.com/reader/full/gaurav-ratio-analysis 44/60
• Proprietary Ratio = Share Capital + Reserve & Surplus / TotalAssets * 100
Particulars 2007 2006 2004 2003Share Capital + Reserve & Surplus 752,326,546 323,621,514 137,502,294 1,542,502,500Total Assets 1,506,924,253 584,124,403 542,413,971 692,334,935Propriety Ratio 0.5 0.55 0.25 2.22
0
0.5
1
1.5
2
2.5
RATIO
2007 2006 2004 2003
YEAR
Properiety Ratio
Properiety Ratio
• Interpretation:
The high propriety ratio indicates the strong financial position of the business. The higher the ratio, the better it is.
8/8/2019 GAURAV Ratio Analysis
http://slidepdf.com/reader/full/gaurav-ratio-analysis 45/60
• Inventory Turnover Ratio = Cost of Goods Sold / AverageInventory
Particulars 2007 2006 2004 2003Cost of Goods Sold 1,076,253,832 756,065,488 569,265,804 466,637,879Average Inventory 175,501,199 142,956,404 116,531,601 71,411,326Inventory Turnover Ratio 6.13 5.29 4.89 6.53
0
1
2
3
4
5
6
7
RATIO
2007 2006 2004 2003
YEAR
Inventory Turnover Rat io
• Interpretation:
The company is having low inventory turnover ratio, and the company’s working capitalmight be tied up in financing inventory. The Inventory Turnover ratio in 2007 and 2006is 6.13 and 5.29 respectively.
8/8/2019 GAURAV Ratio Analysis
http://slidepdf.com/reader/full/gaurav-ratio-analysis 46/60
• Inventory Ratio = Inventory / Current Assets * 100
Particulars 2007 2006 2004 2003Inventory 288,456,.802 160,182,311 159,588,841 115,927,433Current Assets 1,324,070,612 397,044,641 404,911,677 250,963,563Inventory Ratio 21.79 40.34 39.41 46.19
0
10
20
30
40
50
RATIO
2007 2006 2004 2003
YEAR
Inventory Ratio
Inventory Ratio
• Interpretation:
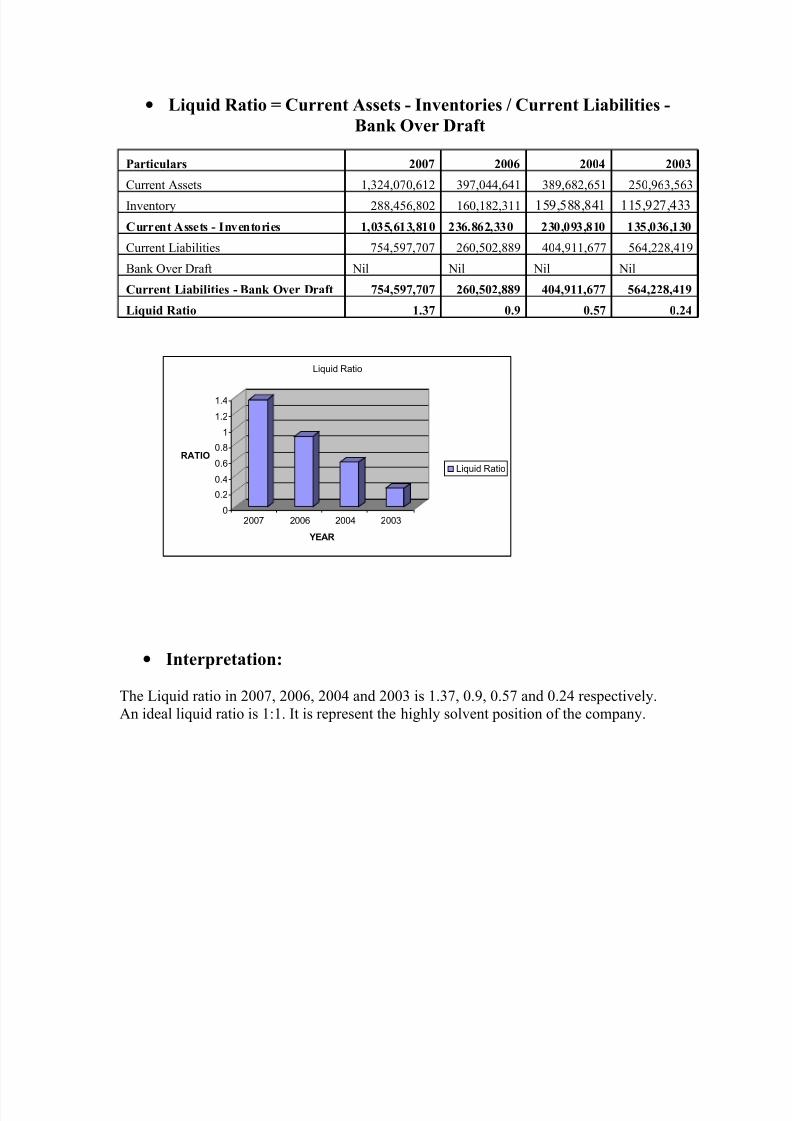
Inventory ratio in the 2007, 2006, 2004 and 2003 is 21.79%, 40.34%, 39.41% and46.19%. There is clear indication that 40% of current assets are locked up in the forminventory.
8/8/2019 GAURAV Ratio Analysis
http://slidepdf.com/reader/full/gaurav-ratio-analysis 47/60
• Gross Profit Ratio = Sales - Cost of Goods Sold / Sales
Particulars 2007 2006 2004 2003
Sales 524,587,679 402,727,540 372,182,955 283,005,297
Cost of Goods Sold 1,600,841,511 1,158,793,028 941,448,759 749,643,176Gross Profit Ratio 32.78 34.75 39.53 37.75
05
1015
2025303540
RATIO
2007 2006 2004 2003
YEAR
Gross Profit Ratio
Gross Profit Ratio
• Interpretation:
The ratio measures the gross profit margin on the total net sales made by the company. In2007, 2006, 2004 and 2003 the gross profit ratio is 32.78%, 34.75%, 39.53% and 37.75respectively.
8/8/2019 GAURAV Ratio Analysis
http://slidepdf.com/reader/full/gaurav-ratio-analysis 48/60
• Materials Cost Ratio = Material Consumed / Sales * 100
Particulars 2007 2006 2004 2003Material Consumed 1,073,274,427 779,831,517 563,945,616 473,685,807Sales 1,600,841,511 1,158,793,028 941,448,759 749,643,176Materials Cost Ratio 67.04 67.3 59.90 63.19
56
58
60
62
64
66
68
RATIO
2007 2006 2004 2003
YEAR
Materials Cost Ratio
• Interpretation:
The Material Cost ratio in 2007, 2006, 2004 and 2003 is 67.04, 67.3, 59.90 and 63.19respectively. The Material Cost ratio is very high.
8/8/2019 GAURAV Ratio Analysis
http://slidepdf.com/reader/full/gaurav-ratio-analysis 49/60
• Operating Ratio = Cost of Goods Sold + Operating Expenses /Sales * 100
Particulars 2007 2006 2004 2003Cost of Goods Sold 1,076,253,832 756,065,488 569,265,804 466,637,879Operating Expenses 574,896,657 451,363,513 456,543,879 465,529,996Sales 1,600,841,511 1,158,793,028 941,448,759 749,643,176Operating Ratio 103.14 104.2 108.96 124.34
0
20
40
60
80
100120
140
RATIO
2007 2006 2004 2003
YEAR
Operating Ratio
Operating Ratio
• Interpretation:
The Operating ratio is very high. This is not good for company. The operating ratio in2007, 2006, 2004 and 2003 is 103.14, 104.2, 108.96 and 124.34 repectively.
8/8/2019 GAURAV Ratio Analysis
http://slidepdf.com/reader/full/gaurav-ratio-analysis 50/60
• Net Profit Ratio = 100% - Operating Ratio
Particulars 2007 2006 2004 2003Operating Ratio 103.14 104.2 108.96 124.34Net Profit Ratio -3.14 -4.2 -8.96 -24.34
-25
-20
-15
-10
-5
0
RATIO
2007 2006 2004 2003
YEAR
Net Profit Ratio
Net Profit Ratio
• Interpretation
The Net Profit ratio shows a loss for the years 2007, 2006, 2004 and 2003. The net profit ratio is -3.14, -4.2, -8.96 and -24.34 respectively.
8/8/2019 GAURAV Ratio Analysis
http://slidepdf.com/reader/full/gaurav-ratio-analysis 52/60
FINDINGS
Current ratio is good in 2007 and 2006 but in 2004 is low. An ideal current ratio is2:1
A quick ratio of 1:1 is usually considered satisfactory it is again a rule of thumbonly. In 2007 and 2006 comparatively other two years.
In 2006 Absolute Liquid ratio is 2.26. In means that more than 50% of currentassets are highly liquid.
The Debt-Equity ratio of company in 2007 is 0.71 and it is well.
Inventory ratio us a clear indication that in 21.79% of current assets are locked upin the form in inventory in 2007.
In 2007 and 2003 inventory ratio are more than 2006 and 2004. The companyworking capital might be tied up in finance inventory.
8/8/2019 GAURAV Ratio Analysis
http://slidepdf.com/reader/full/gaurav-ratio-analysis 53/60
CONCLUSION
8/8/2019 GAURAV Ratio Analysis
http://slidepdf.com/reader/full/gaurav-ratio-analysis 54/60
CONCLUSION
Number of factors should be taken into consideration before reaching a conclusion aboutshort-term and long-term financial position and performance of the concern.
Some of the factors are
Type of business carried on.Type of product manufacture.Reputation of the concern.Type of assets available to invest.Type of funds brought in for working.
The company is integrated specialized manufacturing food production. For systematiclong rang planning will serve vital and dynamic document, which will guide GeneralMills India Pvt Ltd. In the years to make a profit, and further to improve the service to thespecialized food products as well as customers, the food production will be exported tosome of the most discerning markets of the world.
General Mills India Pvt Ltd faces its future nit with apprehension but with full confidenceand in process serve, its owner, the government, its customer, its employees and itssuppliers by effectively fulfilling the role that has been assigned to it.
8/8/2019 GAURAV Ratio Analysis
http://slidepdf.com/reader/full/gaurav-ratio-analysis 55/60
LIMITATION
8/8/2019 GAURAV Ratio Analysis
http://slidepdf.com/reader/full/gaurav-ratio-analysis 56/60
LIMITATION
Following are the limitions which were faced on the project.
Limitation of primary data
Managers executive of a company are not ready to share confidential information aboutcertain financial issue. Official are bound by some rules and regulation of company sothey are not able.
Confidential financial information cannot be disclosedOfficial of a company cannot be disclosed confidential financial information.
Other
The study is limited to “GENERAL MILLS PVT LTD” and the findings need notapply in a similar sense to other similar firms.
The data available are based on annul reports.
The time was very limited and hence one could not probe as deep into the problem as one would have linked to.
The objective was to collect as much as possible having no access to other recordsof the company except the published statements, the interpretation of the resultsmight not be perfect and accurate.
8/8/2019 GAURAV Ratio Analysis
http://slidepdf.com/reader/full/gaurav-ratio-analysis 57/60
RECOMMONDATIONS
8/8/2019 GAURAV Ratio Analysis
http://slidepdf.com/reader/full/gaurav-ratio-analysis 58/60
RECOMMONDATIONS
The company should maintain the current ratio for the years by proper maintaining current assets and current liabilities.
The company should properly utilize its liquid assets by employing it in better technologies. Which may increase the efficiency and quality of the products?
The company should reduce cost of production and also operating cost, whichmay ultimately increase the profits of the company.
The company should improve our competitiveness through improved materialutilization and reduced process cost.
The company should increase there efficiencies of net working capital and tomaintain adequate level of working capital.
8/8/2019 GAURAV Ratio Analysis
http://slidepdf.com/reader/full/gaurav-ratio-analysis 59/60
BIBLIOGRAPHY
8/8/2019 GAURAV Ratio Analysis
http://slidepdf.com/reader/full/gaurav-ratio-analysis 60/60
BIBLIOGRAPHY
Books:-
Financial Management: - Prasanna Chandra
Financial Management: - Ravi M. Vechalakar
Cost & Management Account: - Ravi Kishor
Magazines:-
Annual General Report
Company Document
Internet Cities:-
www.genmills.com
www.google.com .