GAZETTEER OF HYDROLOGIC CHARACTERISTICS OF STREAMS IN MASSACHUSETTS COASTAL RIVER BASINS OF THE SOUTH SHORE AND BUZZARDS BAY By 8. William Wandle, Jr., and Mary A. Morgan U.S. GEOLOGICAL SURVEY Water -Resources Investigations Report 84-4288 Prepared in cooperation with the COMMONWEALTH OF MASSACHUSETTS DEPARTMENT OF ENVIRONMENTAL QUALITY ENGINEERING DIVISION OF WATER POLLUTION CONTROL Boston, Massachusetts 1984
Transcript
GAZETTEER OF HYDROLOGIC CHARACTERISTICS OF STREAMS IN MASSACHUSETTS COASTAL RIVER BASINS
OF THE SOUTH SHORE AND BUZZARDS BAY
By 8. William Wandle, Jr., and Mary A. Morgan
U.S. GEOLOGICAL SURVEY
Water -Resources Investigations Report 84-4288
Prepared in cooperation with the
COMMONWEALTH OF MASSACHUSETTS
DEPARTMENT OF ENVIRONMENTAL QUALITY ENGINEERING
DIVISION OF WATER POLLUTION CONTROL
Boston, Massachusetts
1984
UNITED STATES DEPARTMENT OF THE INTERIOR
WILLIAM P. CLARK, Secretary
GEOLOGICAL SURVEY
Dallas L. Peck, Director
For additional information write to:
U.S. Geological Survey150 Causeway Street, Suite 1309Boston, MA 02114
Copies of this report can be purchased from:
Open-File Services Section Western Distribution Branch U.S. Geological Survey Box 25425, Federal Center Denver, CO 80225 Telephone: (303) 236-7476
CONTENTS
Abstract _---___---_-___ Introduction __________Hydrologic data ---------------
Figure 1. Map showing location of the coastal river basins of the South Shoreand Buzzards Bay------ -------------------------------------
2-3. Map showing location of the gaging stations and low-flow partial-record stations and miscellaneous sites in the coastal river basins of:
2. the South Shore ------ ___ _____ _3. Buzzards Bay ---------------------------------------------
4-6. Graphs showing:4. monthly discharges and extremes for the Indian Head River
at Hanover, Mass, (site 6), during 1967-82---------------- --5. flow-duration curve for the Indian Head River at
Hanover, Mass, (site 6), during 1967-82 -------- -- -----6. low-flow frequency curve for the Indian Head River at
Hanover, Mass, (site 6), during 1968-82 -----------------------
Page
3
9
10
11
TABLES
Table 1. Stream-order listing, selected drainage areas, and locations of subbasins in the coastal river basins of the South Shore and Buzzards Bay~~-----"~-~----~~---------- ---~--------~~~~'
2. Summary of daily flow records available in the coastal river basins ofthe South Shore and Buzzards Bay --------------------- ----
3. Basin characteristics for selected stream-gaging stations in thecoastal river basins of the South Shore and Buzzards Bay~~~~~~~~~~~ -
4. Streamflow characteristics at selected stream-gaging stations ------ 5. Summary of 7-day low-flow characteristics, drainage area, and period of
record for low-flow partial-record stations and miscellaneous sites"-
Page
13
18
1921
24
111
CONVERSION FACTORS
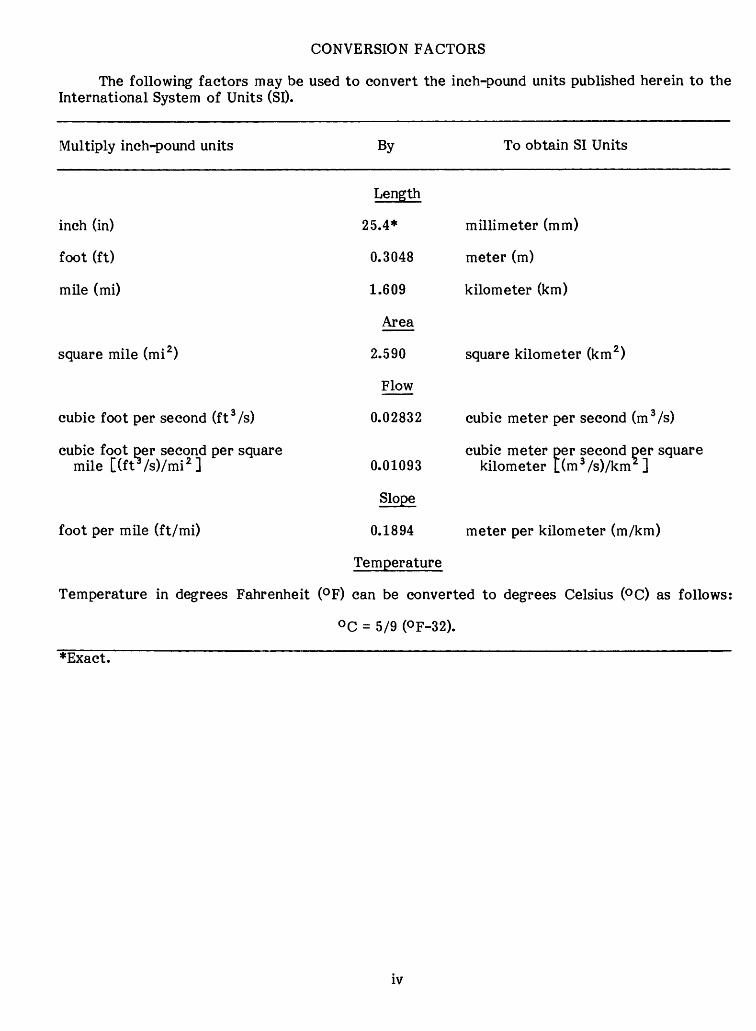
The following factors may be used to convert the inch-pound units published herein to the International System of Units (SI).
Multiply inch-pound units
inch (in)
foot (ft)
mile (mi)
square mile (mi 2 )
cubic foot per second (ft 3 /s)
cubic foot per second per square mile [(fWs)/mi 2 ]
foot per mile (ft/mi)
Temperature in degrees Fahrenheit
By
Length
25.4*
0.3048
1.609
Area
2.590
Flow
0.02832
0.01093
Slope
0.1894
Temperature
To obtain SI Units
millimeter (mm)
meter (m)
kilometer (km)
square kilometer (km 2 )
cubic meter per second (m 3 /s)
cubic meter per second per square kilometer [(m 3 /s)/km*]
meter per kilometer (m/km)
(°F) can be converted to degrees Celsius (°C) as follows:
°C = 5/9 (°F-32).
*Exact.
IV
GAZETTEER OF HYDROLOGIC CHARACTERISTICS OF STREAMS
IN MASSACHUSETTS COASTAL RIVER BASINS OF
THE SOUTH SHORE AND BUZZARDS BAY
By S. William Wandle, Jr., and Mary A. Morgan
ABSTRACT
The coastal river basins include the minor river basins draining into Massachusetts Bay along the South Shore or into Buzzards Bay. The larger of these basins are the North, South, Jones, Wareham, Weweantic, Mattapoisett, Acushnet, and Slocums River basins. Drainage areas, using the latest available 1:24,000 scale topographic maps, were computed for the first time for ungaged streams draining more than 3 square miles and were re-computed for data- collection sites.
Statistics on streamflow characteristics computed with a new data base are presented for six gaged streams. Daily flow records through 1982 were used to compute annual and monthly flow statistics, duration of daily flow values, and the annual 7-day mean low flow at the 2-year and 10-year recurrence intervals. Seven-day low-flow statistics are presented for 49 partial- record sites, and the procedures used to determine the hydrologic characteristics of the basin are summarized. This gazetteer mil aid in the planning and siting of water-resources related activities and will provide a common data base for governmental agencies and the engineering and planning communities.
INTRODUCTION
Information on hydrologic characteristics, including drainage areas, frequency of low flows, and duration of daily flows, is necessary to plan and manage water-resources related activities. Governmental agencies and the engineering and planning community need stream- flow characteristics to satisfy requirements relative to fisheries management, hydropower, land-use planning, stream-systems analysis, waste assimilation, and water-resources develop ment and management. No current hydrologic data base containing a comprehensive list of drainage areas, monthly flows, low-flow frequencies, and duration of daily flows is available for most of the Massachusetts stream systems. Drainage areas are available for selected sites where streamflow data are collected. Streamflow characteristics are presented in various reports, but these data, to be current, need to be re-analyzed using the latest available daily flow records.
In response to this need, a study was begun in 1980, in cooperation with the Massachusetts Division of Water Pollution Control, to analyze available streamflow and river-basin character istics, and to compute subbasin drainage areas. This report is part of a series of gazetteers on the hydrologic characteristics of the major river basins in the State. Gazetteers are also available for the coastal river basins of the North Shore and Massachusetts Bay (Wandle, 1984a), Connecticut River basin (Wandle, 1984b), Hudson River basin (Wandle, 1984c), Merrimack River basin (Wandle and Fontaine, 1984), Taunton and Ten Mile River basins (Wandle and Keezer, 1984), Thames River basin (Wandle and LeBlanc, 1984), Housatonic River basin (Wandle and Lippert, 1984), Blackstone River basin (Wandle and Phipps, 1984). This report provides the first detailed listing of drainage areas and streamflow characteristics derived from daily flow records in the coastal drainage basins of the South Shore and Buzzards Bay. These streamflow characteristics are an expansion and an update of those given in Williams and Tasker (1974a, 1974b). Low-flow estimates are compiled for the low-flow sites in Williams and Tasker (1974a, 1974b, 1978) except for the Mattapoisett River sites where the values are from Olimpio and de Lima (1984).
The coastal river basins in southeastern Massachusetts (fig. 1) include the several minor river basins draining into Massachusetts Bay or Buzzards Bay. The North, South, Jones, Ware- ham, Weweantic, Mattapoisett, Acushnet, and Slocums River basins are the larger of these basins. All or part of the following communities are included in the study area: Abington, Acushnet, Bourne, Carver, Cohasset, Dartmouth, Duxbury, Fairhaven, Freetown, Halifax, Han over, Hanson, Hingham, Kingston, Lakeville, Marion, Marshfield, Mattapoisett, Middleborough, New Bedford, Norwell, Pembroke, Plymouth, Plympton, Rochester, Rockland, Sandwich, Scituate, Wareham, Westport, Weymouth, and Whitman.
Streamflow characteristics presented for the six continuously gaged streams are based upon a new sample of daily flow records in comparison to flow records used in Higgins (1967), Knox and Soule (1949), Male and Ogawa (1982), and Williams and Tasker (1974a, 1974b). Streamflow records through the 1982 water year were available for this analysis. For each site, records were selected to represent a flow regime influenced by fairly constant river basin conditions (Wandle, 1983).
Drainage areas were re-computed for data-collection sites and computed for the first time for ungaged streams draining greater than 3 mi 2 . Drainage divides, as delineated on the latest available 1:24,000 scale topographic quadrangle maps (Brackley and Wandle, 1983); (Wandle and Frimpter, 1982), were used to calculate drainage areas. Drainage areas, for the gaging stations, in earlier reports were computed using the drainage divides as outlined on 1:31,680 or 1:24,000 scale topographic quadrangle maps.
Streamflow data used in this study are a part of the historic streamflow data collected under agreements with State and Federal agencies and the U.S. Geological Survey. Most of the low-flow discharge measurements used in determining low-flow estimates at partial-record sites were collected during the water-resources investigations of the coastal drainage basins of southeastern Massachusetts (Williams and Tasker, 1974a, 1974b, 1978). The array of basin char acteristics was created during an evaluation of available streamflow data in central New England (Johnson, 1970). This file is an expansion of the characteristics abstracted by Langbein and others (1947), and by Benson (1962). Basin characteristics were updated and additional characteristics were entered as part of a study to define floodflow characteristics of small streams (Johnson and Tasker, 1974, and Wandle, 1982). The hierarchical stream list was compiled by the Massachusetts Divisions of Water Pollution Control and Fisheries and Wildlife (Halliwell and others, 1982).
Data tabulated include drainage areas, basin and streamflow characteristics for gaging stations, including annual and monthly flow statistics, duration of daily flow values, and the annual 7-day mean low flow at the 2-year and 10-year recurrence intervals. Seven-day low- flow statistics for partial-record sites are also presented. An explanation of the procedures to determine the streamflow and basin characteristics is provided.
The authors thank the many persons who have kindly given time, information, and guidance during this study. Particular thanks are given to persons in the Geological Survey who assisted in the data collection, in the computation of the drainage areas, and in the preparation of this report.
-2 -
CO I
So
uth
Sho
re
coas
tal
riv
er b
asin
s
Stu
dy
are
a
IND
EX
MA
P O
F M
ASS
AC
HU
SET
TS
20
0 20
40
60
80 K
ILO
ME
TE
RS
Buzz
ards
Bay
co
asta
l ri
ver
bas
ins
Fig
ure
1.
Locati
on o
f th
e co
asta
l ri
ver
bas
ins
of t
he
Sou
th S
hore
and
Buz
zard
s B
ay
HYDROLOGIC DATA
Hydrologic characteristics are represented by various physical, climatic, and streamflow indices of a river basin. These characteristics can be determined either from available maps by following standardized procedures or from historic streamflow records.
Basin characteristics are indices of the physiography of the basin or of the climate pre vailing over the basin and are measured on topographic quadrangle or climatic maps. Stream- flow characteristics are computed from continuous records of daily flow or from a set of measurements during the occurrence of a specific event. Streamflow and basin characteristics are used in modeling stream quality, assessing water-resources conditions, analyzing impact of man's activities, and defining relationships to estimate flows or stream-quality parameters at ungaged sites.
Basin Characteristics
Drainage area is one of the most important variables in any hydrologic investigation or in the design of riverine structures because it is the most significant variable in the northeast that influences all streamflow, except perhaps low flow in some regions. The physical boundary for many water-related studies corresponds to the limits for the drainage area upstream from the site.
For this study, drainage areas listed in table I (at the end of the report) were determined for the following sites:
1. Survey data-collection sites shown in figures 2 and 3. These sites include continuous-record gaging stations given in table 2 (at the end of the report), low-flow partial-record stations, miscellaneous sites, and water-quality stations.
2. Locations where the drainage area is greater than 3 mi 2 .
3. Successive sites along a stream where the area between sites is at least 6 mi 2 on tribu tary streams and 10 mi 2 on the main river.
The drainage basin divides for these sites were delineated on the latest available 1:24,000 scale topographic quadrangle maps. Subbasin drainage divides are shown in the series of state wide reports, "Drainage Divides, Massachusetts." The coastal river basins of the South Shore and Buzzards Bay are covered by two reports in this series Ipswich and lower Merrimack River basins and northeast coastal basins (Brackley and Wandle, 1983) and Taunton River basin and southeast coastal basins (Wandle and Frimpter, 1982).
The subbasin drainage areas given in table 1 are indexed to the Massachusetts stream inventory prepared by the Massachusetts Division of Water Pollution Control and the Massachu setts Division of Fisheries and Wildlife (Halliwell and others, 1982) with some modification. Drainage areas were computed for sites meeting one of the three criteria mentioned above. The entire stream listing is included as a reference for stream order. This hierarchical listing begins at the mouth of a major stream and proceeds upstream with tributary streams indented under the main-stem stream. This order is followed to list all the named streams. Unnamed tributaries are included to maintain the hierarchy. The reader is referred to the inventory of rivers and streams report by Halliwell and others (1982) for a more detailed explanation.
The basin characteristics listed below are included because they represent indices that would remain reasonably stable over a planning period. They are useful in predictive surface- water models to assess impacts of proposed developments. The usefulness of these characteris tics to explain the variability of various streamflow events has been demonstrated in hydrologic analyses (Thomas and Benson, 1970) and they can be measured readily from available maps. The selected basin indices given in table 3 (at the end of the report) were computed according to the procedures described below. The indices for elevation, storage, lake area, and forest can be computed by the grid method which is explained after all the procedures are described.
-4-
sAbington
EXPLANATION
A6 Continuous-record gaging station. Number refers to table 2.
A1 Low-flow partial-recordstation or miscellaneous site. Number refers to table 5.
14.6Ap Peak-flow site. Number
refers to table 5.
Drainage-basin divide
Weymouth
^^ ^\VJPlympton ^ |
5 MILES
6 KILOMETERS
Base from Halliwell and others,1982/ Sandwich
/ /,70°30'
Figure 2. Location of the gaging stations and low-flow partial-record stations and miscellaneous sites in the coastal river basins of the South Shore
-5 -
Kingston/70°46', //
Plympton , / \ * \ \^.^\.\
\
6 MILES
) 6 KILOMETERS
Base from Halliwell and others,1982
u \ VMiddleborough
. -4l°46'
Fall River
WestportK 1v i ^ **
71°00
\ Marion
Mattapoisett
EXPLANATION
A29 Continuous-record gaging station. Number refers to table 2.
26A Low-flow partial-record station or miscellaneous site. Number refers to table 5.
Drainage-basin divide
Figure 3. Location of the gaging stations and low-flow partial-record stations and miscellaneous sites in the coastal river basins of Buzzards Bay
-6-
1. Drainage area Area, in square miles, as measured on the most recent 1:24,000 scale topographic quadrangle maps. Drainage area, as defined in the "National Handbook of Recommended Methods for Water-Data Acquisition" (U.S. Geological Survey, 1977), is "...the area of a river basin, measured in a horizontal plane, that is enclosed by a topographic divide such that direct surface runoff from precipitation normally would drain by gravity into the river basin.". Drainage area boundary lines are traced on topographic maps along divides indicated by contour elevations, starting at the point on the stream for which the drainage area is desired. These lines are drawn to cross a contour at right angles. Interpolation between contours may be indicated by reference to trails, old roads, or firebreaks in forested areas, all of which frequently follow drainage divides. Detailed information may also be obtained from highway or street profiles, from examination of aerial photographs, and from ground reconnaissance. Subareas within each quadrangle map were computed with an electronic digitizer using the procedures of the U.S. Federal Inter-Agency River Basin Committee (1951) as a guide. The coefficients to compute square miles from digitizer units were calculated using the known area of each 7.5-minute quadrangle or of the appropriate 2.5-minute quadrilaterals. Drainage areas for the subbasins were computed by summing the contributing areas.
2. Sloge Main-channel slope, in feet per mile, determined from elevations at points 10 percent and 85 percent of the distance along the main channel from the gaging station to the basin divide.
3. Length Main-channel length, in miles, from the gaging station to the basin divide, as measured with dividers set to 0.1 mile or with a map measurer.
4. Elevation Mean basin elevation, in feet above sea level, measured on topographic maps by laying a grid over the map.
5. Storage Area of lakes, ponds, and marshes, in percent of total drainage area, measured by planimetering or by using a transparent grid. The marsh area includes the area of wooded marshes and marshes as defined by the appropriate topographic quadrangle map symbol. Storage area is the total area of all the lakes, ponds, and marshes expressed as a percent age of the total drainage area.
6. Lake area Area of lakes and ponds, in percent of the drainage area, determined by the grid method.
7. Forest Area of forest, in percentage of the drainage area, determined from the forest cover as shown on the topographic map with the green woodland overprint using the grid method.
8. Soil Soil index, in inches, represents the value of potential maximum infiltration, during an annual flood, under average soil-moisture conditions. This characteristic, provided by the U.S. Soil Conservation Service (Dr. Benjamin Isgur, written commun., 1970), is a function of the soil and cover conditions in the basin. The index was computed from the runoff curve number following procedures in U.S. Department of Agriculture (1972).
9. Latitude Latitude of stream-gaging station, in decimal degrees, determined by manual measurement.
10. Longitude Longitude of stream-gaging station, in decimal degrees, determined by manual measurement.
11. Precipitation Mean-annual precipitation, in inches, determined from the isohyetal map in Knox and Nordenson (1955). The variation in mean-annual precipitation is shown in more detail in this map than in more recent sources.
12. Precipitation intensity Maximum 24-hour rainfall, in inches, having a recurrence interval of 2 years. This characteristic was determined from U.S. Weather Bureau (1959b).
13. Snowfall Average total seasonal snowfall, in inches, from an isohyetal map in Lautzenheiser (1969).
14. January temperature Minimum January temperature, in degrees Fahrenheit, determined from U.S. Weather Bureau, (1959a).
-7-
Several basin characteristics were measured following the grid method by using trans parent grids to compute area or an average contour value. Storage area is determined by randomly placing the grid over the water and marsh area and counting squares. If the water and marsh area is large enough (about 30 squares), the number of grid intersections within the storage area are counted. The storage area then is computed as the product of the square size and the number of grid intersections. To measure a contour value such as elevation, the grid spacing is selected to give at least 25 intersections within the basin boundary. The elevation at each grid intersection is determined and an average is computed. The percentage of a variable that is extensive in a drainage basin, such as forest cover, can be easily measured by counting the number of grid intersections occurring over the forested area, multiplying by 100, and dividing by the number of grid intersections within the basin.
Streamflow Characteristics
The available historic daily flow records were used to compute daily, monthly, and annual flow characteristics. A summary of these Streamflow records is given in table 2 and the location of Streamflow sites is shown in figures 2 and 3. These flow data were collected as part of the Survey's nationwide data-collection network through agreements with State and Federal agencies. Records of daily flow are available from the Survey's National Water Data Storage and Retrieval System (WATSTORE). This water-data computer processing system consists of several files containing data grouped by common characteristic and data-collection frequency.
The WATSTORE system includes site identification, daily values files, and computer pro grams that produce Streamflow statistics. Hydrologic-data files are maintained for (1) param eters measured on a daily or continuous basis, such as Streamflow values, river stages, water temperatures, specific conductance values, and ground-water levels; (2) annual peak values for Streamflow and stage; (3) chemical analyses for surface- and ground-water sites; and (4) ground- water site inventory, including location, identification and geohydrologic characteristics. The data-processing, storage, retrieval, and analysis capabilities of WATSTORE are described in the system user's guide compiled by Hutchison (1975). Information on the availability of data analyses may be obtained from: U.S. Geological Survey, 150 Causeway Street, Suite 1309, Boston, MA 02114.
A brief description of the Streamflow statistics computed using the WATSTORE system is included below. Streamflow characteristics representing annual, monthly, and daily flow statis tics were selected for this analysis because they are useful in planning and design studies in this region. The Streamflow statistics computed following the procedures given below are listed in table 4 (at the end of the report).
Annual and monthly flow characteristics (means and standard deviations) were computed for six gaging stations with the "Daily Values Monthly and Annual Statistics" computer program W4422 (Price and Meeks, 1977) using observed daily flow records. The maximum and minimum, monthly means (fig. 4 and table 4) were obtained from output provided by this program. The monthly hydrograph for the Indian Head River at Hanover is shown in figure 4.
Characteristics of the flow-duration curve (the daily flow exceeded 99, 95, 90, 75, 70, 50, 25, and 10 percent of the time) for six gaging stations were computed by means of computer program A969, "Daily Values Statistics" (Meeks, 1977). The flow-duration curve for the Indian Head River at Hanover is given in figure 5. Low-flow characteristics (annual 7-day mean low flows at the 2-year and 10-year recurrence intervals (7Q2 and 7Q10, respectively) at four gaging stations were also calculated by program A969. In this program, a log-Pearson Type III distribution is fitted to a set of observed annual 7-day mean low flows to obtain coordinates of the computed low-flow frequency curve. If the log-Pearson Type III developed curve did not adequately fit a plot of the observed data, especially in the low end, then a graphical curve was drawn. The graphical frequency curve was used to interpret the observed data when necessary because a graphical curve is the basic curve to use in analyzing the frequency of annual low flows according to Riggs (1971, 1972). The frequency curve for the Indian Head River at Hanover is shown in figure 6.
Additional flow data, including flood-frequency analyses, are available from WATSTORE. Peak discharges for selected recurrence intervals for 82 sites in Massachusetts are given in Wandle (1982).
-8 -
300O O LJ
QC LJ Q_
O 200 CDID O
O OS< X
100
zO2
dl Maximum IZ3 Mean i Minimum
OCT NOV DEC JAN FEB MAR APR MAY JUNE JULY AUG SEPT
Figure 4. Monthly discharges and extremes for the Indian Head River at Hanover, Mass, (site 6), during 1967-82
-9 -
DAILY MEAN DISCHARGE, IN CUBIC FEET PER SECOND
o. 5
Ol O O C _i ui O O O O c
_! OlO OO OO OC
\s\
\\\
sv\\\
\\-N
\\
N
\
V\
\ \\
\
^-\\
\
\\
V
\ ,\
0.1.2 .512 10 50 90 95 98 99 99.5
PERCENTAGE OF TIME INDICATED DISCHARGE WAS EQUALED OR EXCEEDED
Figure 5. Flow-duration curve for the Indian Head River at Hanover, Mass, (site 6), during 1967-82
-10 -
o«<K
«g<lS «
I-J r ^^^ *Z4 ^^
5.0
r-1 W H I/) W QQ ^^ l.U
Jig°Q OQW
^^ l> p
>^ Ofi ^^ /\ EToSj, 0-5
0.3
10 20
RECURRENCE INTERVAL, IN YEARS
Figure 6.~Low-flow frequency curve for the Indian Head River at Hanover, Mass, (site 6), during 1968-82
Characteristics of low flow were also determined at low-flow partial-record stations where measurements of discharge, rather than a continuous daily flow record, were available. This estimating technique is briefly described in the section on Streamflow Analysis. The 7-day low-flow statistics were developed from discharge measurements made during periods of base runoff. Base runoff is defined (Langbein and Iseri, 1960) as "the sustained or fair weather run off. In most streams, base runoff is composed largely of ground-water effluent." Base runoff usually occurs in most Massachusetts streams during the summer or early fall after 5 to 7 con secutive days without rainfall.
STREAMFLOW ANALYSIS
Streamflow Data Base
Systematic records of daily streamflow have been collected since 1967 for Indian Head and Jones Rivers. Short-term daily flow records are available for other streams in the coastal river basins. The location and period of record for these gaging stations are given in table 2.
Discharge measurements were made at 32 low-flow partial-record sites during the water- resources investigations of southeastern Massachusetts (Williams and Tasker, 1974a, 1974b, 1978). Measurements were also collected as part of the Massachusetts low-flow network at one site from 1978 to 1979 and at nine sites during 1965. Discharge measurements were made at four sites during an investigation of the geology and ground-water resources of the Brockton- Pembroke area (Petersen and Shaw, 1961). Additional discharge measurements were collected on the Mattapoisett River and its tributaries during 1982 to aid in the development of a digital ground-water-flow model of the Mattapoisett River Valley aquifer (Olimpio and de Lima, 1984).
Flow characteristics are useful in resource management and design studies if these vari ables represent a particular regulated flow sequence or the natural flow regime that is expected to occur in the future. A valid streamflow analysis is based upon flow records during a period of relatively constant river-basin conditions.
-11 -
Daily Flow Statistics
Systematic daily flow records for the seven sites given in table 2 were reviewed to select a data base for statistical analysis. Impact of reservoirs, diversions, regulation, and withdrawals for public supplies on streamflows were assessed using information on stream regulation found in the series of water-resources data reports issued annually (see U.S. Geological Survey, 1980, for an example) and in Knox and Soule (1949). Streamflow records for six gaging stations were selected that represent a flow regime influenced by fairly constant river-basin conditions (Wandle, 1983). The record length used in this analysis is given in table 4. Low flow, monthly flow, and flow-duration characteristics given in table 4 were derived from the observed stream- flow records at each station and were not adjusted for regulation or diversion. These daily streamflow characteristics were computed following procedures summarized in the section on streamflow characteristics.
Low-Flow Statistics
Continuous streamflow records are not necessary to estimate low-flow characteristics at sites. According to Riggs (1972) selected base-flow measurements rather than a continuous daily flow record can define the low-flow characteristics at a site.
Low-flow partial-record stations are operated to collect discharge measurements when streamflow is composed largely of ground-water runoff. These low-flow sites are selected on streams where flow is expected to occur during a significant dry spell and where the flow is not affected by artificial regulation. Base-flow measurements to define a relation with concurrent gaged flows are obtained over several low-flow periods.
A relation is developed with the base-flow measurements and the concurrent daily mean flows at a nearby long-record gaging station (index station). The 7-day low-flow statistics (7Q2 and 7Q10) for the site are determined from this relation using the appropriate low-flow statis tics for the gaged stream. This estimating technique is explained in more detail by Riggs (1972).
An analysis of the 7-day low flows for the index stations indicated that the values were essentially the same for Williams and Tasker (1974a, 1974b, 1978) and for the current period. Low-flow relationships at the partial-record stations were not redefined except for Mattapoisett River because additional low-flow measurements were not available and because statistics for the index stations did not significantly change. Low-flow estimates for the three Mattapoisett sites were revised using the 1982 data. Information collected as part of the study by Olimpio and de Lima (1984) indicated that the streamflow loss in Williams and Tasker (1978) from site 43 to 46 is based upon unusually large losses in that reach.
Low-flow statistics for 49 sites in the coastal river basins of the South Shore and Buzzards Bay are summarized in table 5 (at the end of the report). The low-flow statistics are representa tive of the hydrologic regime during the data-collection period. Seven-day, 2-year, and 10-year low flows ranged from 0 to 1.47 and from 0 to 1.17 (ft 3 /s)/mi 2 , respectively, at the 49 partial- record stations. Nearby, long-term gaging stations were used as the index stations. These values were computed by Williams and Tasker (1974a, 1974b, 1978) following the procedures mentioned above.
SUMMARY
Drainage areas were re-computed for data-collection sites and were computed for the first time for ungaged streams draining greater than 3 mi 2 . Basin characteristics for drainage area, slope, length, elevation, storage, lake area, forest, soil, latitude, longitude, precipitation, pre cipitation intensity, snowfall, and January minimum temperature are provided. Computer pro grams A969 and W4422 were used to determine daily flow statistics including annual and monthly flows, duration of daily flows, and 7-day low-flow values. Seven-day, 2-year, and 10-year low flows ranged from 0 to 1.47 and from 0 to 1.17 (ft 3 /s)/mi 2 , respectively, at the 49 partial-record stations.
Techniques used to compute basin and streamflow characteristics of a river basin are summarized. This gazetteer contains a comprehensive listing of hydrologic characteristics that should prove useful to those concerned with water-resources activities.
-12-
Table l.~Stream-order listing, selected drainage areas, and locations of subbasins within the coastal river basins of the South Shore and Buzzards Bay
[Sites with streamflow information listed in tables 2, 4, or 5 are marked with an asterisk. The hierarchical listing is modified from Halliwell and others, 1982. Drainage areas are shown for sites as explained in the section on basin characteristics.
These areas are not adjusted for manmade changes in the flow system.]
DrainageStream name Location area,
in square miles
COASTAL BASINS OF THE SOUTH SHORE Richardsons Brook James Brook Bailey Creek The Gulf
Satuit BrookNorth and South Rivers Combined mouths 105 North River
Macombers Creek Hannah Eames Brook Bares Brook
Herring RiverFirst Herring Brook Maple Street 1.83 First Herring Brook Grove Street *1.74
Cove Brook Stony Brook
North River Bridge Street 70.1 Second Herring Brook State Street 123 *3.15 Robinson Creek Third Herring Brook
Cope land Tannery BrookThird Herring Brook River Street *9.78 Third Herring Brook Jacobs Pond outlet 1.71
Wildcat CreekWildcat Brook
Silver BrookMollys Brook
Herring Brook Swamp Brook Pudding Brook State Route 53 *4.52
McFarland Brook Pudding Brook Spring Street al.38
Huldah Brook Little Pudding Brook
Herring Brook Mountain Avenue *5.58
-13-
Table 1. Stream-order listing, selected drainage areas, and locations of subbasins within the coastal river basins of the South Shore and Buzzards Bay (Continued)
DrainageStream name Location area,
in square miles
COASTAL BASINS OF THE SOUTH SHORE (Continued)
North River (Continued) Indian Head River
Iron Mine BrookIndian Head River Elm Street *30.2
Rocky RunIndian Head Brook Washington Street *4.30 Indian Head Brook Wampatuck Pond outlet *2.53 Drinkwater River
Torrey BrookDrinkwater River Forge Pond inlet 10.7
French Stream Summer Street *4.98 Gushing Brook State Route 139 *4.15
Ben Mann Brook Longwater Brook
Shingle mill BrookSouth River Trouant Island 21.7
Branch Creek Broad Creek Littles Creek Unnamed tributary
Furnace Brook School Street *.94 Furnace Brook Furnace Street *1.56 South River Old Ocean Street *7.59
Unnamed tributaryKeene Brook
Harlow Brook Philips Brook
Green Harbor River State Route 139 7.31 Wharf Creek Bass Creek Green Harbor Brook
Back RiverGreat Wood Island River
Pine Point RiverCut River
Little Wood Island River Duck Hill River
Bourne Wharf RiverDug Way
West Brook Blue fish River Island CreekJones River Mouth 29.6
Unnamed tributary Smelt Brook
-14-
Table 1. Stream-order listing, selected drainage areas, and locations of subbasins within the coastal river basins of the South Shore and Buzzards Bay (Continued)
Stream name LocationDrainage
area,in square
miles
COASTAL BASINS OF THE SOUTH SHORE (Continued)
Jones River (Continued) Halls Brook
Tussock Brook Mile Brook Bassett Brook
Unnamed tributarySecond Brook
Jones River Furnace Brook Fountainhead Brook
Jones River Pine Brook Pine Brook Jones River Brook
Barrows Brook Jones River
Tubbs Meadow Brook Town Brook Eel River Unnamed tributary
Beaver Dam Brook Indian Brook Herring River
Red Brook East River
Gibbs Brook Bass Creek Wareham River
Cedar Island Creek Crooked River Broad Marsh River
Stony Run Agawam River
Maple Springs BrookEast Branch
Agawam River Wankinco River
Rose Brook Harlow Brook Frogfoot Brook
600 feet above State Route 3A
Elm Street
Private roadGrove Street75 feet below State Route 27State Route 106
Table 1. Stream-order listing, selected drainage areas, and locations of subbasins within the coastal river basins of the South Shore and Buzzards Bay (Continued)
Sherman Brook East Branch Sippican River West Branch Sippican River
Weweantic River Crane Brook
Indian Brook Sampson Brook
Tilson Brook Double Brook
East Rocky Gutter Brook West Rocky Gutter Brook
Rocky Meadow Brook South Meadow Brook
Beaver Dam Brook Aucoot Creek Mattapoisett River Mattapoisett River Mattapoisett River
Branch Brook Mattapoisett River Mattapoisett River. Mattapoisett River Mattapoisett River Swift Brook Swift Brook Nasketucket River Acushnet River Acushnet River
Deep Brook Acushnet River Acushnet River
Keene River Squam Brook
Ashley Brook Buttonwood Brook Little River
County Road
State Route 105
Squire Island Road
U.S. Route 60.4 mile above U.S. Route 6 Acushnet Road Tinkham Lane
Wolf Island RoadNew Bedford RoadRounseville RoadSnipatuit Road0.1 mile above Mattapoisett Neck RoadU.S. Route 6
Main Street Hamlin Road
Road 1 mile below Leonard Street Leonard Street
Russells Mills Road
*28.1
3.14
*56.1
*2.71*24.0*23.5*18.2
14.1*13.1*11.2
6.45*1.18
*.78
18.7*16.4
10.1*7.52
*2.93
-16 -
Table 1. Stream-order listing, selected drainage areas, and locations of subbasins within the coastal river basins of the South Shore and Buzzards Bay (Continued)
Stream name LocationDrainage
area,in square
miles
Slocums River Giles Creek Peter Creek Destruction Brook Paskamanset River Paskamanset River Paskamanset River Paskamanset River Paskamanset River
a From U.S. Geological Survey, 1964. b From Petersen, 1962.
-17 -
Table 2. Summary of daily flow records available in the coastal river basins of the South Shore and Buzzards Bay
Number in
figures 2 and 3
Station Station name number
Period Location of
recordRemarks
5
6
8
14.5
19
01105660 Bound Brook near Doane Road Cohasset, Mass.
01105700 Indian Head Brook Washington near Hanson, Mass. Street
01105730 Indian Head River Elm Street at Hanover, Mass.
01105800 Pudding Brook at Spring Street East Pembroke, Mass.
1971 Discontinued.
1959-60 Some regulation by ponds. Discontinued.
1967-82 Some regulation by mills and ponds. Water-quality records 1970-71.
1959-62 Regulated by Randall Pond. Discontinued.
01105850 Furnace Brook near Marshfield, Mass.
01105870 Jones River at Kingston, Mass.
Furnace Street 1964-82 Peak-flow site.
Elm Street 1967-82 Regulated by pond up stream. Flow from Silver Lake diverted for municipal supplies of Brockton, Whitman, and Hanson. Flow affected at times during spring by wast age from Silver Lake. Surface flow may be affected by ground water that enters from or moves into adjacent basins. Water-quality records 1970-71.
22 01105876 Eel River near Plymouth, Mass.
State Route 3A 1970-71
29 01105895 Weweantic River at South Wareham, Mass.
Squire Island Road
Surface flow may be affected by ground water that enters from or moves into adjacent basins. Water-quality records. Discontinued.
1970-71 Some regulation byponds. Water-quality records. Discontinued.
-18-
Table 3. Basin characteristics for selected stream-gaging stations in the coastal river basins of the South Shore and Buzzards Bay
Basin characteristics Station name and site number
Indian Head Brook Indian Head River Pudding Brook at Furnace Brook near Hanson, at Hanover, East Pembroke, near Marsh-
Mass. Mass. Mass. field, Mass.
(5) (6) (8) (14.5)
Area, in square miles 4.30 30.2 al.38 1.56
Slope, in feet per mile 2.5
Length, in miles 2.7
Elevation, in feet 160
Storage, in percent 0
Lake area, in percent 0
Forest, in percent 95
Soils index, in inches 5.6
Latitude of gage, in decimal degrees 42.0869 42.0337 42.0305 42.1083
Longitude of gage, in decimal degrees 70.8572 70.8231 70.7578 70.7314
Precipitation, in inches 44.0
Precipitation intensity for 2-year recurrence interval, in inches 3.3
Snowfall, in inches 40.0
January minimum temperature, in degrees Fahrenheit 21.0
a From U.S. Geological Survey, 1964. """
-19 -
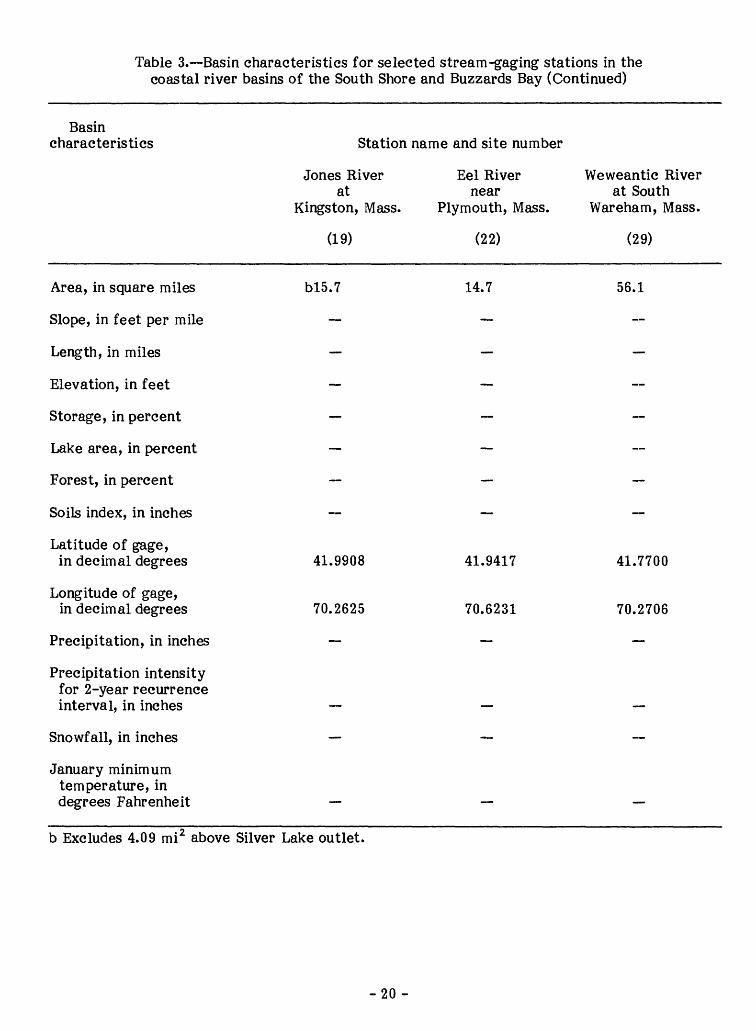
Table 3. Basin characteristics for selected stream-gaging stations in the coastal river basins of the South Shore and Buzzards Bay (Continued)
Basin characteristics Station name and site number
Jones Riverat
Kingston, Mass.
(19)
Eel Rivernear
Plymouth, Mass.
(22)
Weweantic Riverat South
Wareham, Mass.
(29)
Area, in square miles
Slope, in feet per mile
Length, in miles
Elevation, in feet
Storage, in percent
Lake area, in percent
Forest, in percent
Soils index, in inches
Latitude of gage, in decimal degrees
Longitude of gage, in decimal degrees
Precipitation, in inches
Precipitation intensity for 2-year recurrence interval, in inches
Snowfall, in inches
January minimum temperature, in degrees Fahrenheit
b!5.7
41.9908
70.2625
14.7
41.9417
70.6231
56.1
41.7700
70.2706
2b Excludes 4.09 mi above Silver Lake outlet.
-20 -
Table 4. Streamflow characteristics, in cubic feet per second, at selected stream-gaging stations
Annual and monthly flow characteristics:
QA is the mean annual discharge
SDQA is the standard deviation of mean annual discharge
QM is the mean discharge for M calendar month, M = 1 for January where the top line is the maximum mean; the middle line is the mean; the bottom line is the minimum mean
SDQM is the standard deviation of mean discharge for M calendar month
Low-flow characteristics:
7Q2 is the annual minimum 7-day mean discharge for 2-year recurrence interval
7Q10 is the annual minimum 7-day mean discharge for 10-year recurrence interval
Flow-duration characteristics:
DPT is the daily discharge, exceeded PT percent of the time, from the flow-duration curve
Years of record:
YRSDAY is the number of years of daily flow record for this analysis
YRSLOW is the number of years of low-flow record for this analysis
Flow
ANNUAL
QA
SDQA
MONTHLY
Q10
SDQ10
Qll
SDQ11
Q12
Indian Head Brook near
Hanson,Mass.
(5)
6.56
3.44
7.66
5.59
8.50
5.40
Station name and site number Weweantic
Indian Head Pudding Brook Eel River River at River at at East Jones River near South Hanover, Pembroke, at Kingston, Plymouth, Wareham, Mass. Mass. Mass. Mass. Mass.
(6)
61.2
13.5
77.5 32.1
7.36
23.6
143 60.4 25.1
34.5
180 87.3 16.4
(8)
2.74
1.85
2.61
1.92
2.54
2.15
(19) (22) (29)
30.4
54.0
43.2 17.4
7.95
10.2
66.0 27.2
5.71
15.0 -
76.8 35.5 10.8
SDQ12 50.7 21.6
-21 -
Table 4. Streamflow characteristics, in cubic feet per second, at selected stream-gaging stations (Continued)
Flow
MONTHLY
Ql
SDQ1
Q2
SDQ2
Q3
SDQ3
Q4
SDQ4
Q5
SDQ5
Q6
SDQ6
Q7
Indian Head Brook near
Hanson,Mass.
(5)
(Continued)
9.28
4.26
13.7
6.78
14.0
13.5
14.1
12.2
6.43
5.87
6.53
2.63
7.56
1.80
Indian Head River at Hanover,Mass.
(6)
21889.811.4
58.2
14888.119.4
31.0
209118
65.3
47.6
13889.249.8
25.7
15566.526.1
35.5
20345.411.4
46.4
43.719.4
5.68
Station name and site number
Pudding Brook Eel River at East Jones River near
Pembroke, at Kingston, Plymouth,Mass.
(8)
3.33
1.75
3.19
2.08
3.48
3.08
3.71
3.07
3.42
2.47
2.76
1.81
2.31
1.50
Mass.(19)
78.237.6
9.00
19.4
66.143.120.1
12.3
95.053.031.9
17.9
61.941.721.4
11.0
67.736.514.9
15.6
69.325.3
9.56
14.3
37.515.3
6.34
Mass.(22)
28.5
24.2
31.4
30.7
31.0
30.2
35.0
25.8
33.1
27.6
31.6
25.7
27.7
23.5
Weweantic River at South
Wareham,Mass.
(29)
139
64.0
215
133
190
142
179
97.7
119
72.5
78.6
55.9
46.0
25.0
SDQ7 17.5 7.60
-22-
Table 4. Streamflow characteristics, in cubic feet per second, at selected stream-gaging stations (Continued)
Flow
MONTHLY
Q8
SDQ8
Q9
SDQ9
LOW FLOW
7Q2
7Q10
Station name and site number
Indian Head Brook near
Hanson,Mass.
(5)
(Continued)
4.35
.76
5.02
1.38
_
Indian Head River atHanover,Mass.
(6)
40.9 18.14.47
13.3
65.0 19.9
1.13
18.4
4.6
1.3
Pudding Brook at East
Pembroke, Mass.
(8)
1.87
1.64
2.48
1.79
_
Jones Riverat Kingston,
Mass.
(19)
42.9 16.04.79
8.88
45.5 16.1
5.49
10.6
6.8
2.2
Eel River near
Plymouth, Mass.
(22)
23.8
21.6
23.3
18.8
(0(1)
WeweanticRiver at South
Wareham, Mass.
(29)
36.5
16.7
23.0
12.5
(i)
(i)
FLOW DURATION
D99
D95
D90
D75
D70
D50
D25
D10
YEARS
YRSDAY
YRSLOW
.40
.79
.93
2.7
3.3
6.0
10.0
14.3
2
2.2
4.6
7.1
16.7
21.2
41.4
77.4
142
16
15
1.2
1.4
1.5
1.8
1.9
2.3
2.9
3.6
4
4.5
6.7
8.4
13.6
15.4
23.6
39.1
59.9
16
16
18.2
19.1
20.5
23.4
24.0
25.7
28.2
33.6
2
11.3
13.0
15.6
24.9
31.4
56.4
117
167
2
Estimates are given in table 5.
-23 -
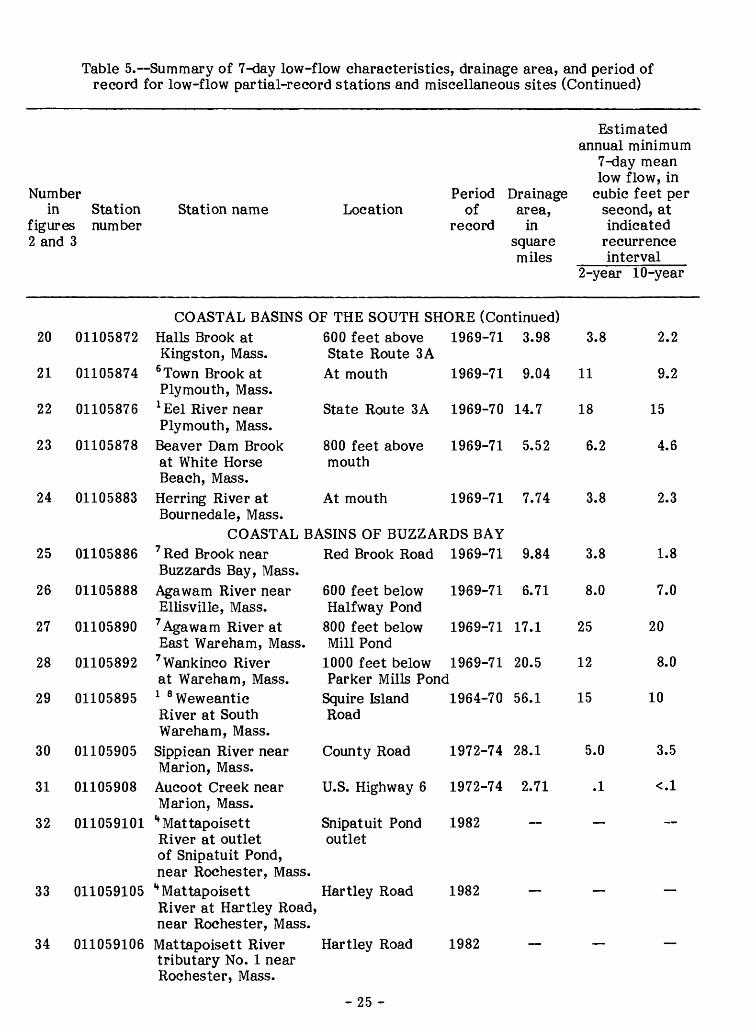
Table 5. Summary of 7-day low-flow characteristics, drainage area, and period of record for low-flow partial-record stations and miscellaneous sites
Estimated annual minimum
7-day mean low flow, in
Numberin
figures2 and 3
Stationnumber
Station name LocationPeriod Drainage
ofrecord
area,in
squaremiles
cubic feet persecond, atindicated
recurrenceinterval
2-year 10-year
COASTAL BASINS OF THE SOUTH SHORE1
2
3
4
5
7
9
10
11
12
13
14
15
16
17
18
01105660
01105680
01105690
01105698
01105700
01105770
01105805
01105810
01105820
01105830
01105845
01105848
01105856
01105858
01105860
01105862
1 Bound Brook nearCohasset, Mass.
2 Gushing Brook atWest Hanover, Mass.
2 French Streamnear Rockland, Mass.Indian Head Brookat Hanson, Mass.
1 Indian Head Brooknear Hanson, Mass.
3 Herring Brook atPembroke, Mass.
** Pudding Brook atNorth Pembroke, Mass.
Third Herring Brookat Hanover, Mass.
Second Herring Brookat Nor we 11, Mass.First Herring Brooknear ScituateCenter, Mass.
South River atMarshfield, Mass.
Furnace Brook nearMarshfield, Mass.
2 Jones River atoutlet of SilverLake nearKingston, Mass.
Table 5. Summary of 7-day low-flow characteristics, drainage area, and period of record for low-flow partial-record stations and miscellaneous sites (Continued)
Estimated annual minimum
7-day mean low flow, in
Numberin
figuresStationnumber
Station namePeriod
Location ofrecord
2 and 3
Drainagearea,
insquaremiles
cubic feet persecond, atindicated
recurrenceinterval
2-year 10-year
20
21
22
23
24
25
26
27
28
29
01105872
01105874
01105876
01105878
01105883
01105886
01105888
01105890
01105892
01105895
COASTAL BASINSHalls Brook atKingston, Mass.
6 Town Brook atPlymouth, Mass.
1 Eel River nearPlymouth, Mass.
Beaver Dam Brookat White HorseBeach, Mass.
Herring River atBournedale, Mass.
COASTAL7 Red Brook nearBuzzards Bay, Mass.
Agawam River nearEllisville, Mass.
7 Agawam River atEast Wareham, Mass,
7 Wankinco Riverat Wareham, Mass.
1 8 Weweantic
OF THE SOUTH SHORE (Continued)600 feet above 1969-71State Route 3 A
At mouth 1969-71
State Route 3A 1969-70
800 feet above 1969-71mouth
At mouth 1969-71
BASINS OF BUZZARDS BAYRed Brook Road 1969-71
600 feet below 1969-71Halfway Pond
800 feet below 1969-71, Mill Pond
1000 feet below 1969-71Parker Mills Pond
Squire Island 1964-70
3.98
9.04
14.7
5.52
7.74
9.84
6.71
17.1
20.5
56.1
3
11
18
6
3
3
8
25
12
15
.8 2.2
9.2
15
.2 4.6
.8 2.3
.8 1.8
.0 7.0
20
8.0
10Road
30 01105905
31 01105908
32 011059101
33 011059105
County Road
U.S. Highway 6
Snipatuit Pond outlet
River at South Wareham, Mass.
Sippican River near Marion, Mass.
Aucoot Creek near Marion, Mass.^Mattapoisett River at outlet of Snipatuit Pond, near Rochester, Mass.^Mattapoisett River at Hartley Road, near Rochester, Mass.
34 011059106 Mattapoisett River Hartley Road tributary No. 1 near Rochester, Mass.
1972-74 28.1
1972-74 2.71
1982
5.0
Hartley Road 1982
1982
3.5
-25 -
Table 5. Summary of 7-day low-flow characteristics, drainage area, and period of record for low-flow partial-record stations and miscellaneous sites (Continued)
** Mattapoisett Rivernear Wolf Island Road,near Rochester, Mass.
Branch Brook nearMattapoisett, Mass.
Crystal Spring nearMattapoisett, Mass.
** 9 MattapoisettRiver near Matta-
Location
Estimated annual minimum
7-day mean low flow, in
Period Drainage cubic feet perof area,
record insquaremiles
second, atindicated
recurrenceinterval
2-year 10-year
OF BUZZARDS BAY (Continued)Cushman Road
RounsevilleRoad
New BedfordRoad
Remains of olddam
MattapoisettRoad
0.2 mile belowWolf Island Rd.
Wolf IslandRoad
30 feet belowbridge on dirtroad (formerlyTinkham Lane)
Tinkham Lane
1982
1972-74, 11.21982
1982 13.1
1965, 1982
1982
1982
1982
1982
1972-74, 18.21982
1.5 0.8
__
__
3.2 2.0
44 01105915
45 01105916
46 01105917
poisett, Mass.Mattapoisett River tributary No.4, near Mattapoisett, Mass.
** Mattapoisett River near Acushnet Road, near Mattapoisett, Mass.
" 9 10 Mattapoisett River near Mattapoisett, Mass.
Tinkham Pond 1982 outlet
Footbridge 1982 above Acushnet Road
23.5
0.4 mile above U.S. Route 6
1965, 24.01972-74,1982
4.1 2.5
-26-
Table 5. Summary of 7-day low-flow characteristics, drainage area, and period of record for low-flow partial-record stations and miscellaneous sites (Continued)
Numberin Station Station name
figures number2 and 3
PeriodLocation of
record
Drainagearea,
insquaremiles
Estimated annual minimum
7-day meanlow flow, in
cubic feet persecond, atindicated
recurrenceinterval
2-year 10-year
47 01105920
48 01105921
49 01105924
50 01105926
51 01105928
52 01105933
53 01105935
COASTAL BASINSSwift Brook at East Fairhaven, Mass.
Swift Brook near Mattapoisett, Mass.
11 Acushnet River at Leonard Street, near Acushnet, Mass.11 Acushnet River at Acushnet, Mass.Buttonwood Brook near South Dartmouth, Mass.
1 ° Paskamanset River near South Dartmouth, Mass.
Destruction Brook near South Dartmouth, Mass.
OF BUZZARDS BAY (Continued) U.S. Route 6 1965 0.78 --
1 Recording gage, refer to table 2.2 Flow affected by diversion.3 Some regulation by ponds. Flow affected by diversion. ''Some regulation by pond or ponds.5 From Petersen, 1962.6 Diversion from Little South Pond for Plymouth water supply.7 Some regulation by operation of cranberry bogs.8 Flow regulated by ponds.9 Some unpublished daily records during 1959-60 and 1981-82 are on file in the Massachusetts
Office.10 Streamflow affected by withdrawal of ground water. 1 1 Diversion from New Bedford Reservoir.
-27-
SELECTED REFERENCES
Benson, M. A., 1962, Factors influencing the occurrence of floods in a humid region of diverse terrain: U.S. Geological Survey Water-Supply Paper 1580-B, 64 p.
Brackley, R. A., and Wandle, S. W., Jr., 1983, Drainage divides, Massachusetts Ipswich and lower Merrimack River basins and northeast coastal basins: U.S. Geological Survey Open-File Report 83-209, 28 maps.
Halliwell, D. B., Kimball, W. A., Screpetis, A. J., 1982, Massachusetts stream classification program, part I, Inventory of rivers and streams: Massachusetts Department of Environ mental Quality Engineering and Department of Fisheries, Wildlife, and Recreational Vehicles, 126 p., appendix consisting of 3 pages.
Higgins, G. R., 1967, Yield of streams in Massachusetts: Amherst, Massachusetts, University of Massachusetts, Water Resources Research Center Publication 5, 175 p.
Hutchison, N. E., compiler, 1975, WATSTORE National water data storage and retrieval system of U.S. Geological Survey User's guide: U.S. Geological Survey Open-File Report 75-426, 791 p. (revised).
Johnson, C. G., 1970, A proposed streamflow data program for central New England: U.S. Geo logical Survey open-file report, 38 p., 1 appendix consisting of 11 pages.
Johnson, C. G., and Tasker, G. D., 1974, Progress report on flood magnitude and frequency of Massachusetts streams: U.S. Geological Survey Open-File Report 74-131, 41 p.
Knox, C. E., and Nordenson, T. J., 1955, Average annual runoff and precipitation in the New England-New York area: U.S. Geological Survey Hydrologic Investigations Atlas 7, 6 p.
Knox, C. E., and Soule, R. M., 1949, Hydrology of Massachusetts, part 1, Summary of streamflow and precipitation records: U.S. Geological Survey Water-Supply Paper 1105, 240 p.
Langbein, W. B. and Iseri, K. T., 1960, General introduction and hydrologic definitions, jn Manual of hydrology, part 1, General surface-water techniques: U.S. Geological Survey Water- Supply Paper 1541-A, p. 1-29.
Langbein, W. B., and others, 1947, Topographic characteristics of drainage basins: U.S. Geologi cal Survey Water-Supply Paper 968-C, p. 125-157.
Lautzenheiser, R. E., 1969, Snowfall, snowfall frequencies, and snow cover data for New Eng land: Environmental Sciences Services Administration Technical Memorandum EDSTM 12, 15 p.
Male, J. W., and Ogawa, H., 1982, Low flows of Massachusetts streams: Amherst, Massachu setts, University of Massachusetts, Water Resources Research Center Publication 125, 152 p.
Meeks, W. C., 1977, Daily values statistics (program A969), in Hutchison, N. E., compiler, 1975, WATSTORE National water data storage and retrieval system of the U.S. Geological Survey user's guide: U.S. Geological Survey Open-File Report 75-426 (revised), chap. IV, section G.
Olimpio, J. C., and de Lima, Virginia, 1984, Ground-water resources of the Mattapoisett River Valley, Plymouth County, Massachusetts, aquifer: U.S. Geological Survey Water- Resources Investigations Report 84-4043.
-28-
Petersen, R. G., 1962, Records of selected wells, test holes, ponds, and streams in the Brockton- Pembroke area, Massachusetts: U.S. Geological Survey open-file report, Massachusetts Basic-Data Report 5, ground-water series, 46 p.
Petersen, R. G., and Shaw, C. E., Jr., 1961, Ground-water favorability map of the Brockton-Pembroke area, Massachusetts: Massachusetts Water Resources Commission Hydrologic Investigations Chart HI-1.
Price, W. E., Jr., and Meeks, W. C., 1977, Daily values monthly and annual statistics (program W4422), in Hutchison, N. E., compiler, 1975, WATSTORE National water data storage and retrieval system of the U.S. Geological Survey user's guide: U.S. Geological Survey Open-File Report 75-426 (revised), chap. IV, section F.
Riggs, H. C., 1971, Discussion of probability distribution of annual droughts by Eratakulan S. Joseph: American Society of Civil Engineers Proceedings, v. 97, no. IR3, p. 540-541.
___1972, Low-flow investigations: U.S. Geological Survey Techniques of Water-ResourcesInvestigations, book 4, chap. Bl, 18 p.
Thomas, D. M., and Benson, M. A., 1970, Generalization of streamflow characteristics from drainage-basin characteristics: U.S. Geological Survey Water-Supply Paper 1975, 55 p.
U.S. Department of Agriculture, 1972, Soil Conservation Service National Engineering Hand book, section 4, Hydrology: U.S. Department of Agriculture, Soil Conservation Service.
U.S. Federal Inter-Agency River Basin Committee, Subcommittee on Hydrology, 1951, Inter- agency coordination of drainage area data, notes on hydrologic activities: Water Resources Council, Subcommittee on Hydrology Bulletin no. 4, 48 p.
U.S. Geological Survey, 1964, Compilation of records of surface waters in the United States, October 1950 to September 1960, part 1-A, North Atlantic Slope Basins, Maine to Connecticut: U.S. Geological Survey Water-Supply Paper 1721, 317 p.
___1977, National handbook of recommended methods for water-data acquisition: U.S. Geological Survey, chap. 7, 38 p.
___1980, Water resources data for Massachusetts and Rhode Island, water year 1979: U.S.Geological Survey Water-Data Report MA-RI-79-1, 349 p.
U.S. Weather Bureau, 1959a, Climates of the states, Massachusetts: U.S. Weather Bureau, Cli- matography of the United States, Paper No. 60-19, 20 p.
___1959b, Rainfall intensity-frequency regime, northeastern United States: U.S. Weather Bureau Technical Paper no. 29, 35 p.
Wandle, S. W., Jr., 1982, Estimating peak discharges of small, rural streams in Massachusetts: U.S. Geological Survey Open-File Report 80-676, 33 p.
___1983, Low-flow frequency and flow-duration analysis of natural-flow streams in Massachu setts: Boston Society of Civil Engineers Section, American Society of Civil Engineers Journal, v. 69, no. 1, p. 87-110.
___1984a, Gazetteer of hydrologic characteristics of streams in Massachusetts coastal river basins of the North Shore and Massachusetts Bay: U.S. Geological Survey Water-Resources Investigations Report 84-4281.
-29-
Wandle, S. W., Jr., 1984b, Gazetteer of hydrologic characteristics of streams in Massachusetts- Connecticut River basin: U.S. Geological Survey Water-Resources Investigations Report 84-4282.
___1984c, Gazetteer of hydrologic characteristics of streams in Massachusetts Hudson River basin: U.S. Geological Survey Water-Resources Investigations Report 83-4250.
Wandle, S. W., Jr., and Fontaine, R. A., 1984, Gazetteer of hydrologic characteristics of streams in Massachusetts Merrimack River basin: U.S. Geological Survey Water-Resources Inves tigations Report 84-4284.
Wandle, S. W., Jr., and Frimpter, M. H., 1982, Drainage divides, Massachusetts Taunton River basin and southeast coastal basins: U.S. Geological Survey Open-File Report 82-870, 24 maps.
Wandle, S. W., Jr., and Keezer, G. R., 1984, Gazetteer of hydrologic characteristics of streams in Massachusetts Taunton and Ten Mile River basins and coastal river basins of Mount Hope Bay, Narragansett Bay, and Rhode Island Sound: U.S. Geological Survey Water- Resources Investigations Report 84-4283.
Wandle, S. W., Jr., and LeBlanc, J. A., 1984, Gazetteer of hydrologic characteristics of streams in Massachusetts Thames River basin: U.S. Geological Survey Water-Resources Investi gations Report 84-4287.
Wandle, S. W., Jr., and Lippert, R. G., 1984, Gazetteer of hydrologic characteristics of streams in Massachusetts Housatonic River basin: U.S. Geological Survey Water-Resources Inves tigations Report 84-4285.
Wandle, S. W., Jr., and Phipps, A. F., 1984, Gazetteer of hydrologic characteristics of streams in Massachusetts Blackstone River basin: U.S. Geological Survey Water-Resources Inves tigations Report 84-4286.
Williams, J. R., and Tasker G. D., 1974a, Water resources of the coastal drainage basins of southeastern Massachusetts, Weir River, Hingham, to Jones River, Kingston: U.S. Geological Survey Hydrologic Investigations Atlas HA-504.
___1974b, Water resources of the coastal drainage basins of southeastern Massachusetts, Plymouth to Weweantic River, Wareham: U.S. Geological Survey Hydrologic Investigations Atlas HA-507.
___1978, Water resources of the coastal drainage basins of southeastern Massachusetts, north west shore of Buzzards Bay: U.S. Geological Survey Hydrologic Investigations Atlas HA-560.
Williams, J. R., Tasker, G. D., and Willey, R. E., 1977, Hydrologic data of the coastal drainage basins of southeastern Massachusetts, Plymouth to Weweantic River, Wareham: U.S. Geological Survey open-file report 77-186, Massachusetts Hydrologic-Data Report No. 18, 31 p., 1 pi.
Williams, J. R., Willey, R. E., and Tasker, G. D., 1975, Hydrologic data of the coastal drainage basins of southeastern Massachusetts, Weir River, Hingham, to Jones River, Kingston: U.S. Geological Survey open-file report, Massachusetts Hydrologic-Data Report No. 16, 63 p., 1 pi.
___1980, Hydrologic data of the coastal drainage basins of southeastern Massachusetts, Northwest Shore of Buzzards Bay: U.S. Geological Survey Open-File Report 80-583, Massachusetts Hydrologic-Data Report No. 20, 30 p., 1 pi.