61
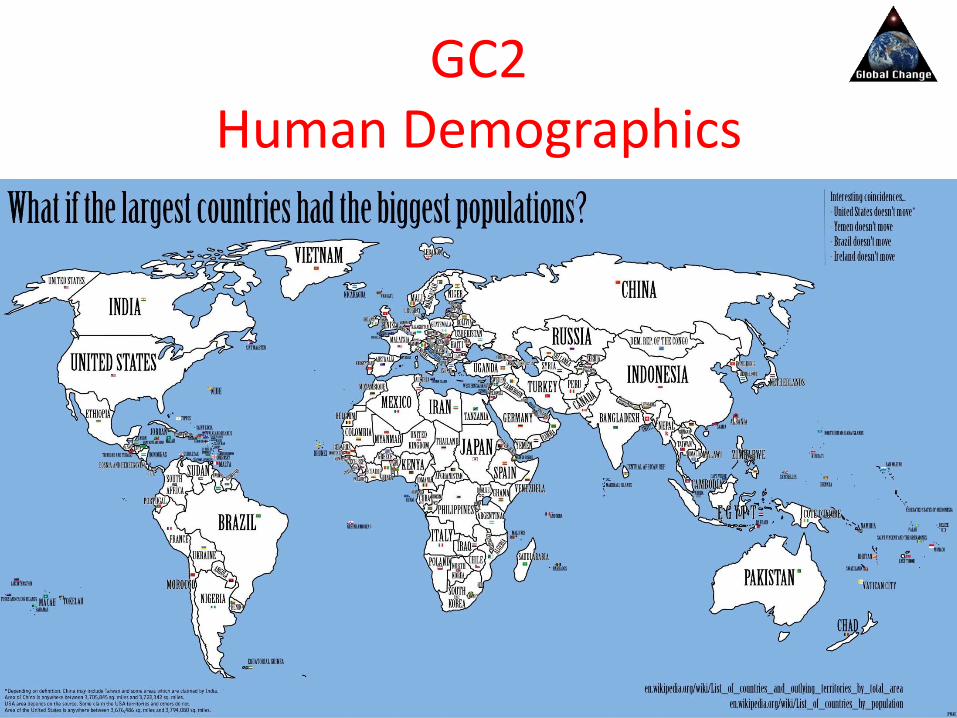
GC2 Human Demographics

GC2 Human Demographics

Humans Demographics We discuss …
o World Population
o Growth curves
o Population pyramids
o Demographic Trends (e.g., nations, urbanization)
o Demographic transition
o Health and societal well-being
o (Wealth)

GAPMINDER Database

GAPMINDERworld
4
Human Development Index: “human well-being” (health, education, employment, wealth) website

Copernicus Galileo Kepler
Bacon Descartes Newton
The SCIENTIFIC REVOLUTION:
•REDUCTIONISM
•DUALISM
•MECHANISM
•ATOMISM
•ANTHROPOCENTRISM
•EMPIRICISM
•AND MANY OTHER “ISMS”
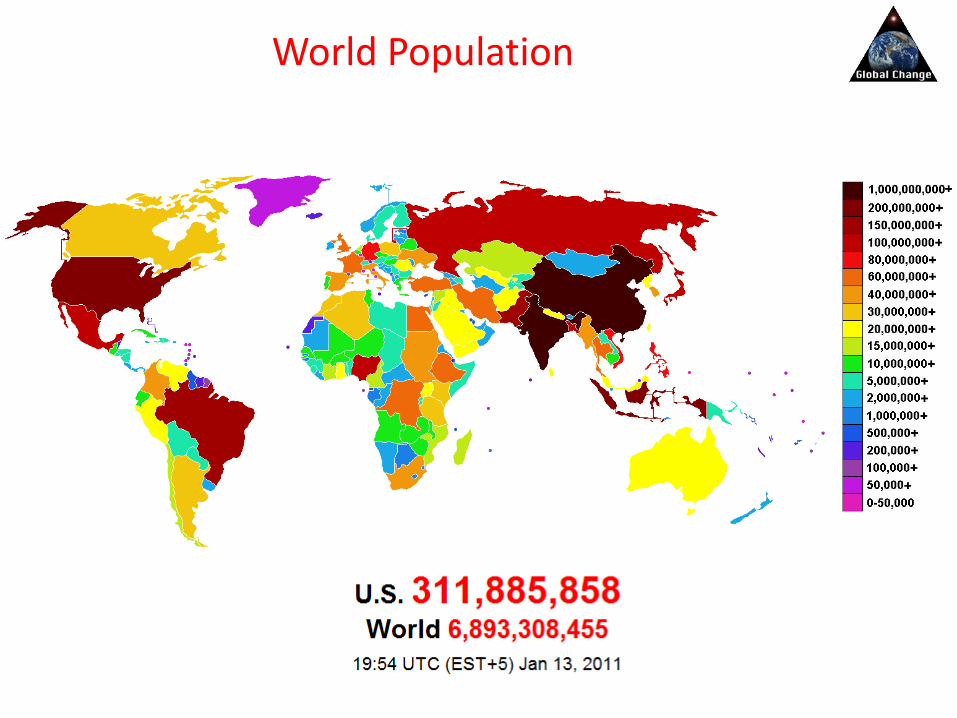
World Population

Humans through time
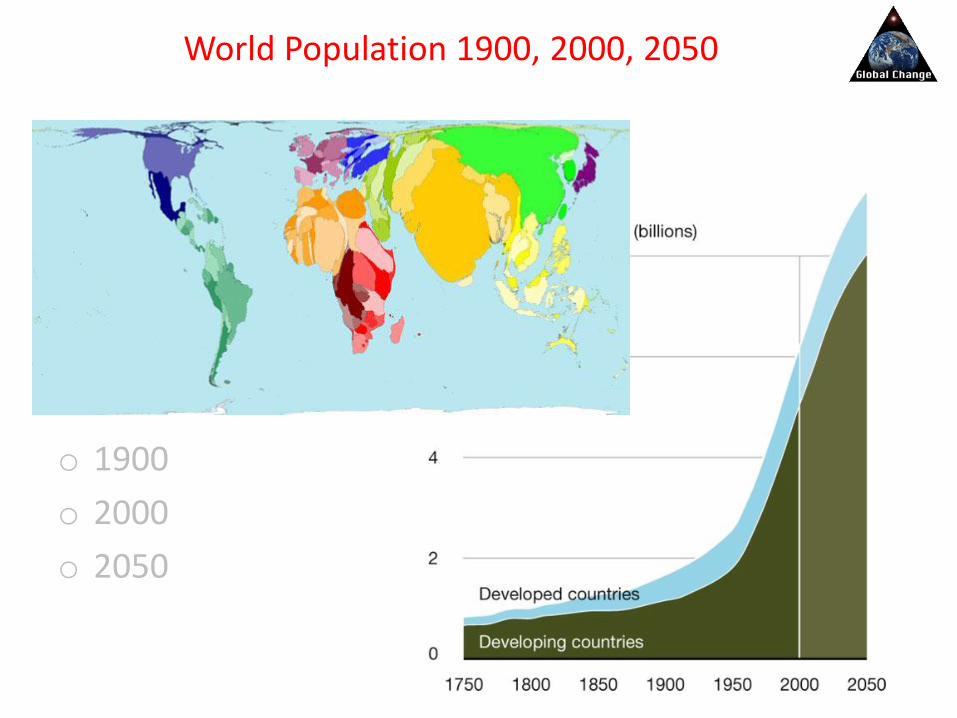
World Population 1900, 2000, 2050
o 1900
o 2000
o 2050

What if ….
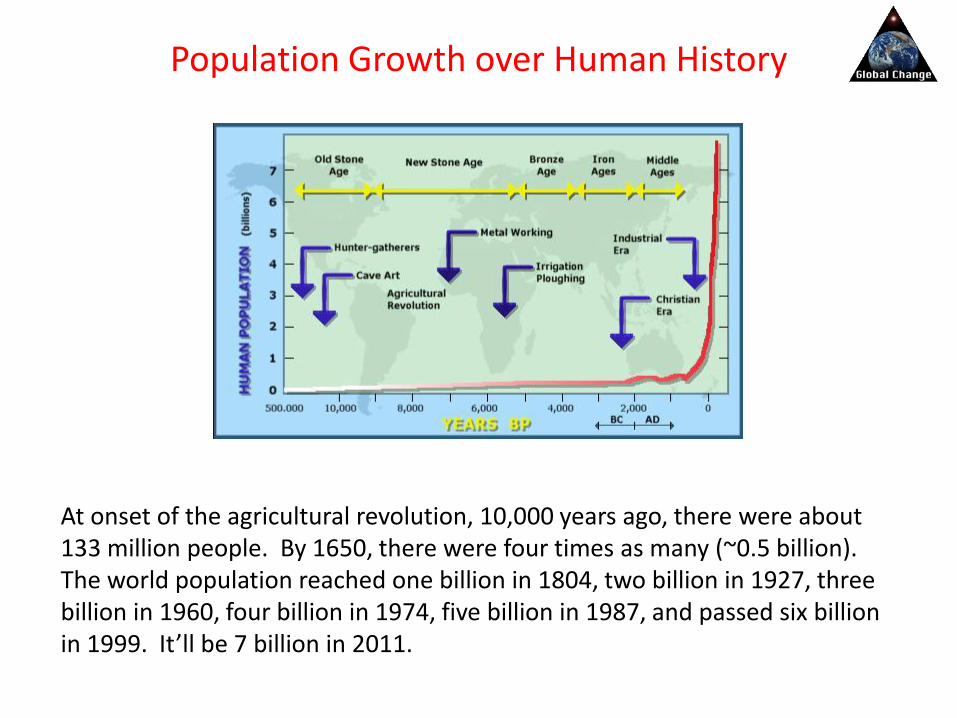
Population Growth over Human History
At onset of the agricultural revolution, 10,000 years ago, there were about 133 million people. By 1650, there were four times as many (~0.5 billion). The world population reached one billion in 1804, two billion in 1927, three billion in 1960, four billion in 1974, five billion in 1987, and passed six billion in 1999. It’ll be 7 billion in 2011.
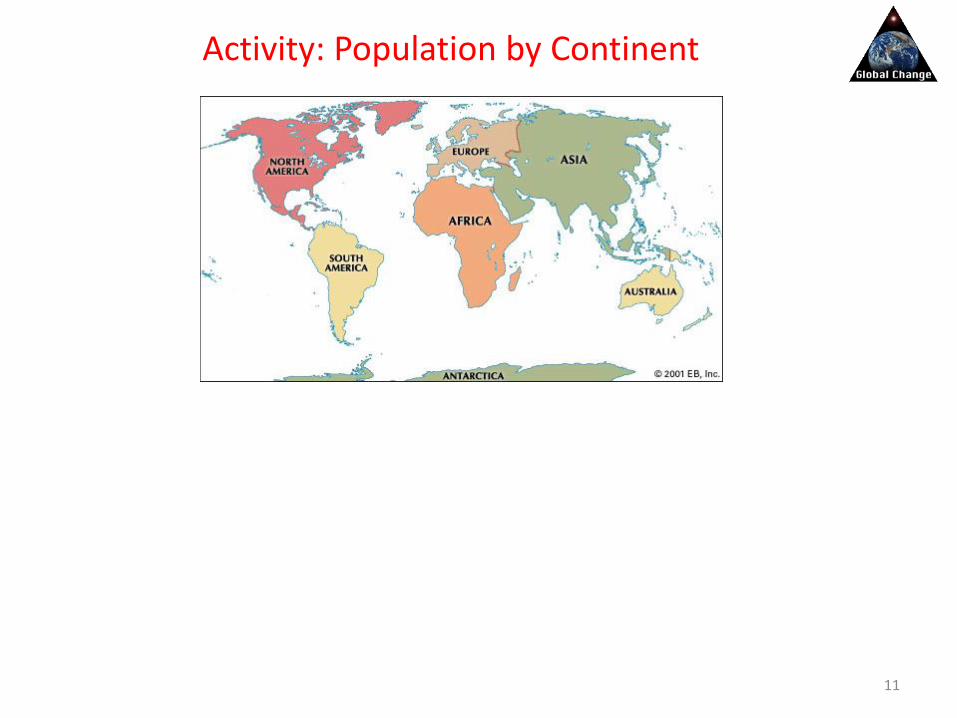
Activity: Population by Continent
11
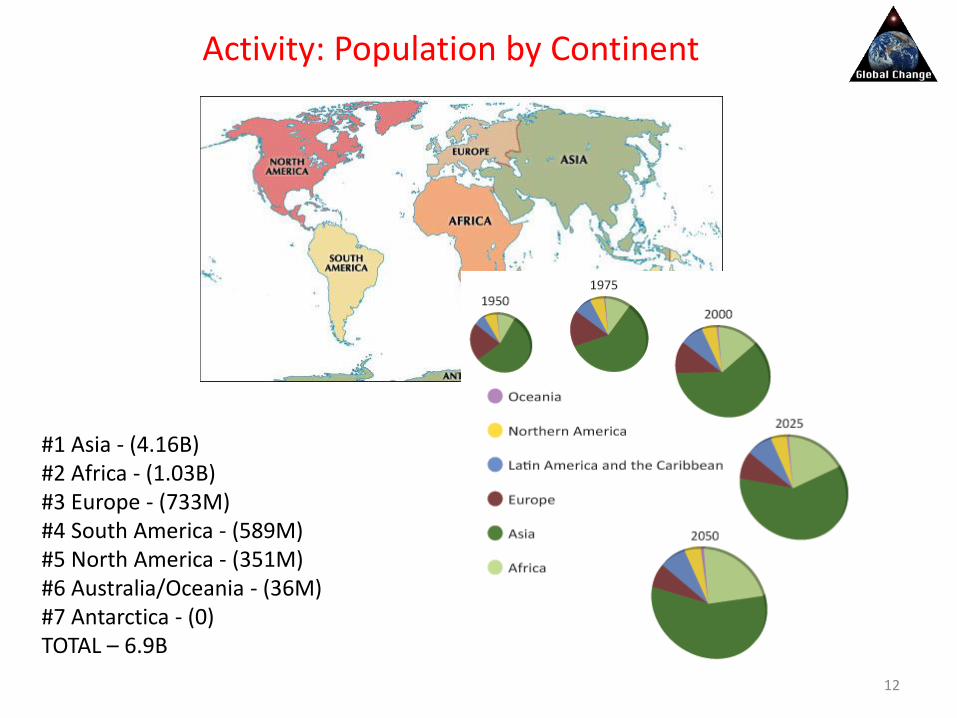
Activity: Population by Continent
#1 Asia - (4.16B) #2 Africa - (1.03B) #3 Europe - (733M) #4 South America - (589M) #5 North America - (351M) #6 Australia/Oceania - (36M) #7 Antarctica - (0) TOTAL – 6.9B
12

World population growth rate

Human Population Growth
1800 world reaches one billion
1927 2 billion
1961 3 billion
1974 4 billion
1986 5 billion
1999 6 billion
2011 7 billion
2050 9-10 billion
127 years
34 years
13 years
12 years
13 years
12 years
~40 years

Fig. 1-7b, p. 6
Linear versus exponential growth
From J- to S-shaped
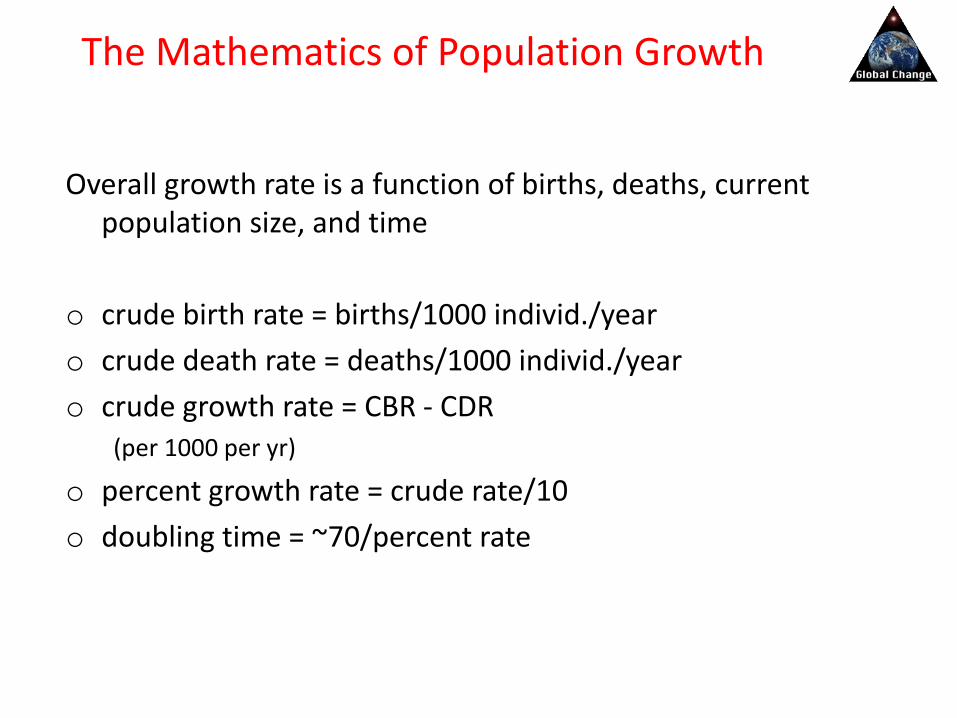
The Mathematics of Population Growth
Overall growth rate is a function of births, deaths, current population size, and time
o crude birth rate = births/1000 individ./year
o crude death rate = deaths/1000 individ./year
o crude growth rate = CBR - CDR (per 1000 per yr)
o percent growth rate = crude rate/10
o doubling time = ~70/percent rate

Some Examples of Crude Birth and Death Rates
Country C.B.R. C.D.R. %GR DT
USA-1975 15.7 9.2 ____ ____
USA-1995 15.9 8.8 ____ ____
Kenya-1975 52.9 17.3 ____ ____
Kenya-1995 44.5 11.7 ____ ____
Thailand-1975 35.1 9.3 ____ ____
Thailand-1995 19.4 6.1 ____ ____
0.65 107 yrs
3.28
2.58
1.33
0.71
3.56
98
19
21
27
52

Crude Birth and Death Rates
Country C.B.R. C.D.R. %GR DT
Italy-1975 13.0 9.8 ____ ____
Italy-1995 9.7 9.6 ____ ____
0.32 217 yrs
0.01 ~
Ghana-1995 47.2 14.9 ____ ____
Mexico-1995 27.0 5.2 ____ ____
Kuwait-1995 40.1 4.2 ____ ____
Bangladesh-1995 19.4 6.1 ____ ____
2.68 26
2.18 32
3.59 19
1.33 52
Data from http://esa.un.org/unpp/
doubling time (DT) 70/percent growth rate

Human Population Growth
o J-shaped over human history, hardly affected by wars and plagues
o doubling time today is ~ 55 years
o current growth rate of ~1.4% per year is down from peak of ~2% in 1965-70
o each hour >14,500 people are born

Population Change
Population by continent, percentages
Annual growth (2007), percentages

Population Age Pyramids
o Age pyramids are useful descriptor and forecaster of a population’s growth pattern
o sort individuals into (usually) 5-year groupings, by males and by females
o a steeply triangular pyramid depicts a population that has experienced rapid growth, and will continue for one or more generations
o a rectangular pyramid depicts slow or zero growth
o A narrow base reflects negative growth

Examples of Population Pyramid Distributions

Population Age Pyramids
Note greater number of younger, relative to older people in developing world. As 0-15 year-olds become 15-30 year-olds, population will increase further.
Magenta bar = 1975
Blue bar = 2000
Population Age Pyramids
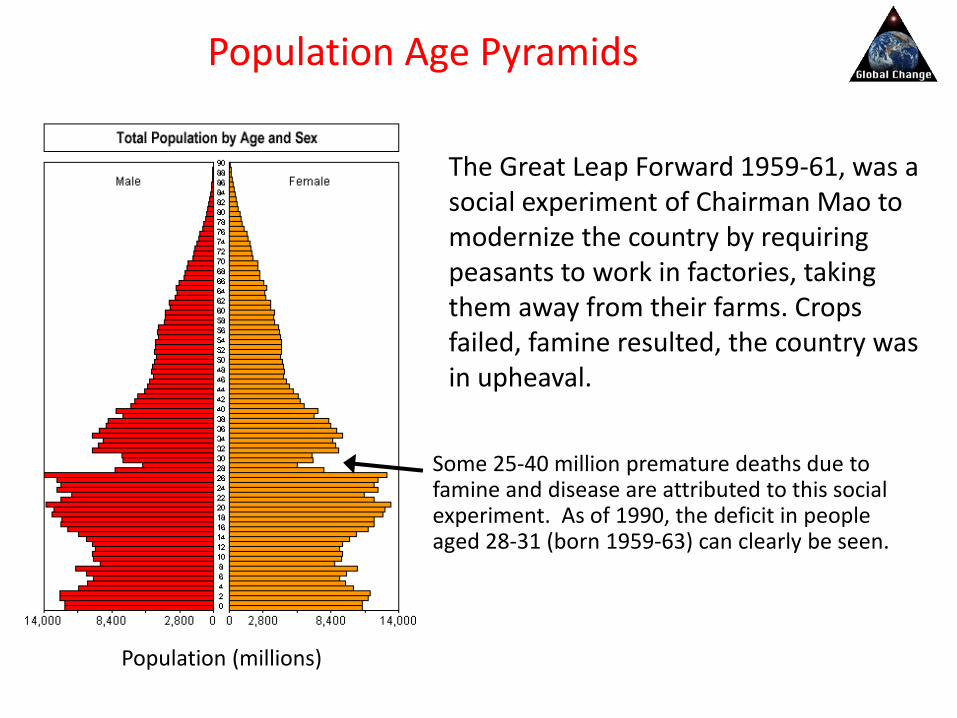
The Great Leap Forward 1959-61, was a social experiment of Chairman Mao to modernize the country by requiring peasants to work in factories, taking them away from their farms. Crops failed, famine resulted, the country was in upheaval.
Some 25-40 million premature deaths due to famine and disease are attributed to this social experiment. As of 1990, the deficit in people aged 28-31 (born 1959-63) can clearly be seen.
Population (millions)

Global Trend toward Urbanization
Movement of people towards cities is accelerating, particularly in less developed countries.
Due to increased births, and migration from rural surround.
Urban share has grown from 1/3 (1960) to half (2000), and projected to be >60% by 2030.
Another global trend is towards increased urbanization, most dramatically in less-developed countries. In 1960, only New York and Tokyo were “megacities” (10 million people). By 1999 there were 17 megacities, 13 in less-developed regions. By 2015, there will be 26.

Changing Distribution of World Population
Global trend is towards increased urbanization, most dramatically in less-developed countries. In 1960, only New York and Tokyo were “megacities” (10 million people). By 1999 there were 17 megacities, 13 in less-developed regions. By 2015, 26 or more megacities.
2015 Top cities: Tokyo 35M Seoul 23M Mumbai (Ind) 22M Mexico City 22M São Paulo 21M New York 20M Delhi, Shanghai, Jakarta..
http://www.citypopulation.de/World.html

Developed countries are more urbanized than poorer countries.
Developed means Urbanization

US Population Trend: Urbanization
1/20/2011 28
A
l
GC2 Human Demographics

The Demographic Transition
Will population continue to grow?
What differences might we expect among different regions and societies?
To address these questions we to a universal pattern of the modern world:
the Demographic Transition
This is transition from high to low birth and death rates.
There have been TWO major demographic transitions:
Past Demographic Transition
Present Demographic Transition
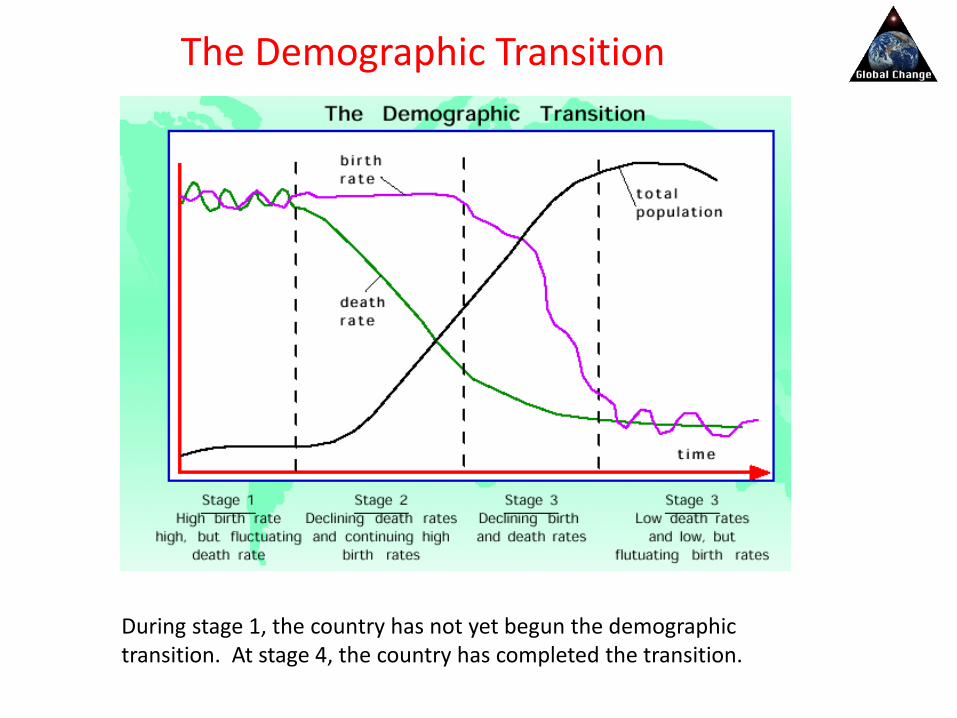
The Demographic Transition
During stage 1, the country has not yet begun the demographic transition. At stage 4, the country has completed the transition.
Past Demographic Transition
England and Wales
1700 50 1800 50 1900 50 20000
10
20
30
40
50
CBR
CDR
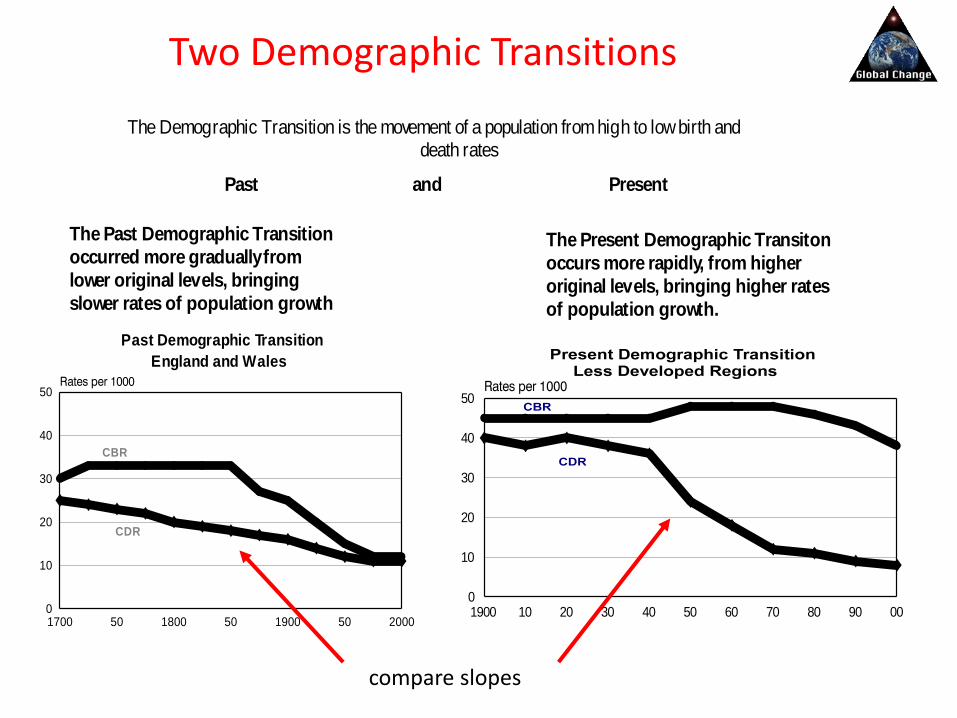
The Past Demographic Transition
occurred more gradually from
lower original levels, bringing
slower rates of population growth
The Present Demographic Transiton
occurs more rapidly, from higher
original levels, bringing higher rates
of population growth.
Past and Present
1900 10 20 30 40 50 60 70 80 90 000
10
20
30
40
50
The Demographic Transition is the movement of a population from high to low birth and death rates
Two Demographic Transitions
compare slopes
Two Demographic Transitions

1750 60 70 80 90 1800 10 20 30 40 50 60 70 80 90 1900 10 20 30 40 50 60 70 80 90 2000
0
10
20
30
40
50
60
0
10
20
30
40
50
60
Sweden
China
The past transition moved slowly from high, variable, death rates and infectious diseases to low, stable, death rates and degenerative diseases (e.g. Sweden). Today, death rates can be reduced more rapidly. China’s DR fell more in 40 years than Sweden’s did in 200 years
Death rates (optional)

1750 60 70 80 90 1800 10 20 30 40 50 60 70 80 90 1900 10 20 30 40 50 60 70 80 90 2000
0
10
20
30
40
50
60
0
10
20
30
40
50
60
Sweden CBR and CDR
CBR
CDR
China’s birth rate fell as much in 40 years as Sweden’s fell in 200 years.
1750 60 70 80 90 1800 10 20 30 40 50 60 70 80 90 1900 10 20 30 40 50 60 70 80 90 2000
0
10
20
30
40
50
0
10
20
30
40
50
Sweden China
Sweden’s birth date and death rate Sweden and China’s birth rates (past demographic transition)
Birth Rates (optional)
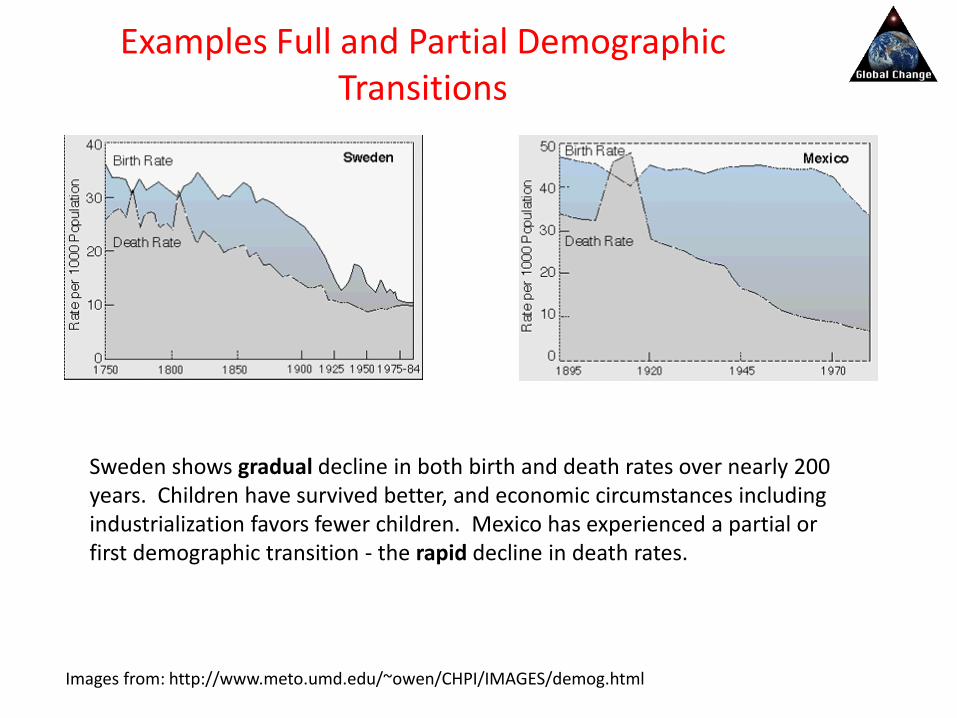
Examples Full and Partial Demographic Transitions
Images from: http://www.meto.umd.edu/~owen/CHPI/IMAGES/demog.html
Sweden shows gradual decline in both birth and death rates over nearly 200 years. Children have survived better, and economic circumstances including industrialization favors fewer children. Mexico has experienced a partial or first demographic transition - the rapid decline in death rates.

Regional Distinctions
Developing countries of Asia/Pacific, Africa, Latin America and Caribbean
Industrialized countries of Europe, N. America, Japan, Oceania
Roughly speaking, industrialized countries have completed their demographic transition (“past” model), while developing countries are in transition (“present” model)

Advances in Health
http://www.plumbingstore.com/psthomas.html
Thomas Crapper (b. 1836) is commonly, but erroneously, credited with invention of the toilet (17th C).
In the middle ages, even until the 1800’s, chamber pots were emptied from windows. Walkers beware!
http://www.plumbingworld.com/toilethistoryindia.html
Sanitation: flushing toilets, sewers, and sewage treatment, largely came to Europe in the mid-1800s

European Death Rate History
Decline in death rate is attributed to improved sanitation and hygiene, medical advances and control of serious infectious diseases.
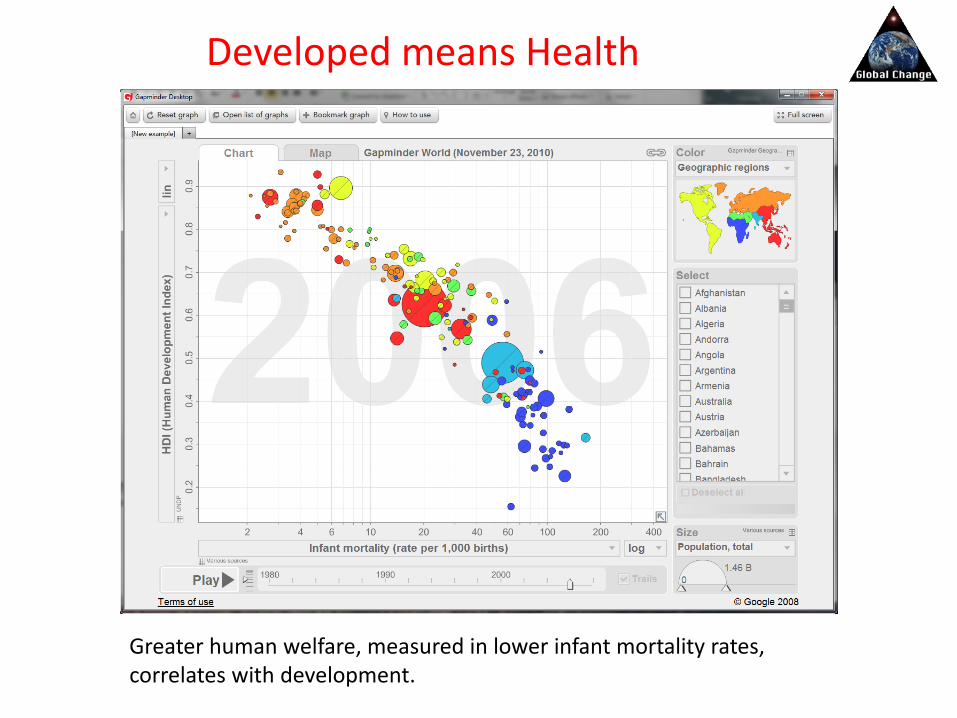
Greater human welfare, measured in lower infant mortality rates, correlates with development.
Developed means Health

There are major reasons for the increased speed of the new transition:
• New medical technology to attack infectious diseases
• Global organizations to spread that technology rapidly.
• Changes in fertility trends
The UN World Health Organization played a major role, by bringing better health and education to millions of world’s population.
The same holds for fertility transition.
The difference ....
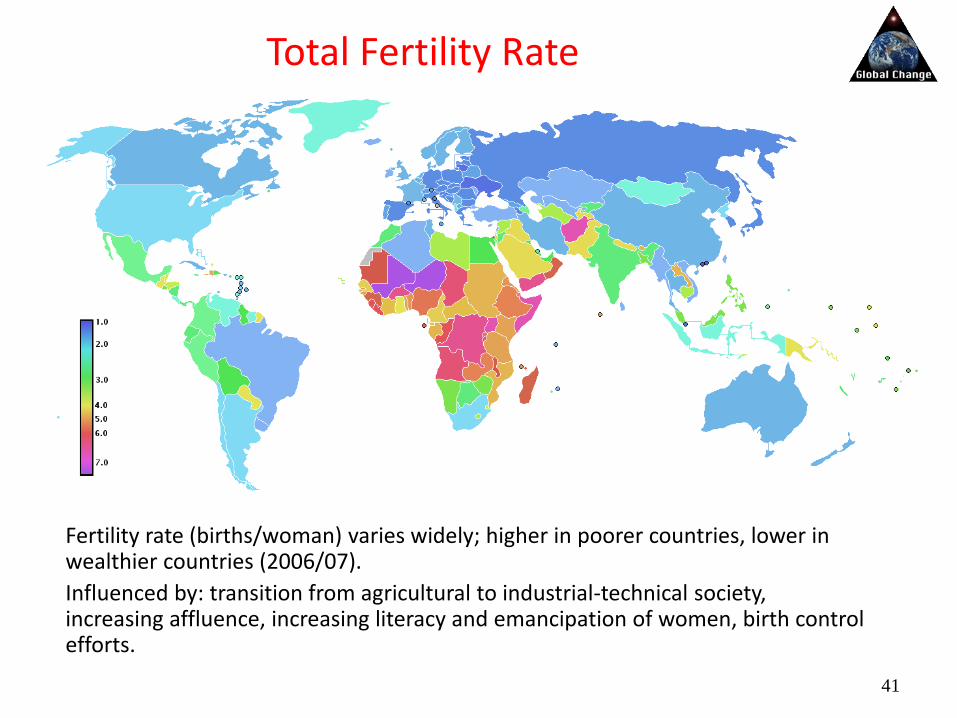
Total Fertility Rate
41
Fertility rate (births/woman) varies widely; higher in poorer countries, lower in wealthier countries (2006/07).
Influenced by: transition from agricultural to industrial-technical society, increasing affluence, increasing literacy and emancipation of women, birth control efforts.

Fertility Rate
42
Total Fertility Rate
The number of children a woman has in her child-bearing years.
China and Thailand
1950 60 70 80 90 0 10 20 30 40 500
1
2
3
4
5
6
7
actual proj ected
Thailand
China
Latin American and East Africa
1950 60 70 80 90 0 10 20 30 40 500
2
4
6
8
actual proj ected
East Africa
Latin
America
Declined rapidly in China and
Thailand, due to effective primary
education, primary health care, and
family planning programming
Has declined only moderately in Latin
America, and remains high in Africa.
W eak government health, education
and family planning programs are
main causes.

Developed means Lower Fertility
Developed countries are growing more slowly because they have lower fertility than poor countries. (link)
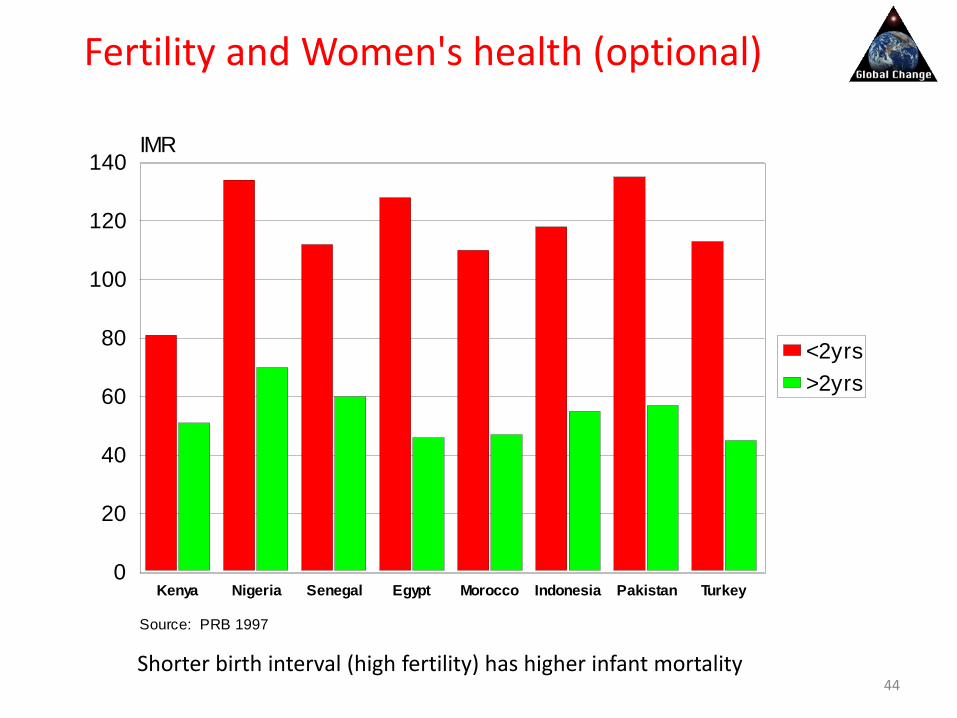
Fertility and Women's health (optional)
44
Kenya Nigeria Senegal Egypt Morocco Indonesia Pakistan Turkey0
20
40
60
80
100
120
140IMR
<2yrs
>2yrs
Short birth intervals bring higher infant mortality
Source: PRB 1997
Shorter birth interval (high fertility) has higher infant mortality

Fertility and Women’s health (optional)
45
Higher fertility has higher maternal mortality (but more is involved in MM)
Nigeria Mauritius Nepal China Haiti Costa Rica0
200
400
600
800
1000
1200
1400
1600MMR
0
1
2
3
4
5
6TFR
TFR MMR
Higher total fertility implies higher maternal mortality in all regions
Africa Asia L. America/Car.
(But obviously more is involved than just fertility)
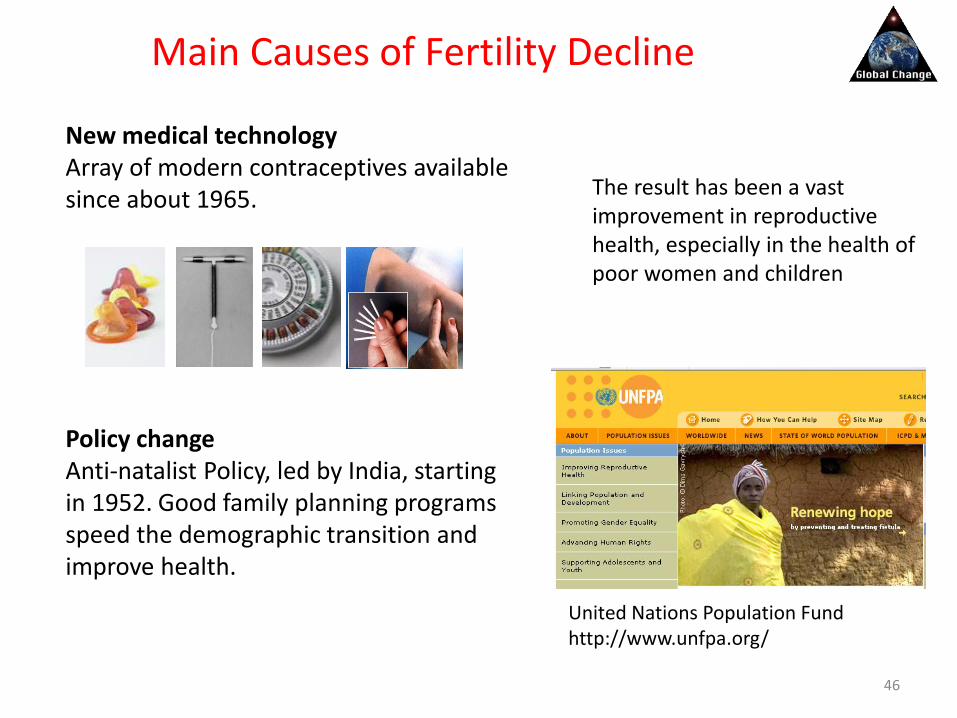
Main Causes of Fertility Decline
46
New medical technology Array of modern contraceptives available since about 1965.
Policy change Anti-natalist Policy, led by India, starting in 1952. Good family planning programs speed the demographic transition and improve health.
The result has been a vast improvement in reproductive health, especially in the health of poor women and children
United Nations Population Fund http://www.unfpa.org/

Benefits of Family Planning
47
• Considered to be among the most cost-effective development and health programs we have.
• Provides immediate improvements in health of women and children – groups who usually benefit last and least from other types of development programs.
• Enhances social stability (“angry young men”).

Young Males
48
• Young males (15-19 years old) are a highly energetic, inexperienced, and volatile population.
• They can be led to acts of heroism, making them attractive to armed forces.
• They can be led to acts of great altruism (self-sacrifice).
• They can also be led to acts of terrible violence, as we saw, for example, in the 1990’s Rwandan (Tutsi-Hutu) genocide.
• Much depends on the leadership and social infrastructure that gives them some hope for the future.
• But demographics show their numbers will increase rapidly.

Young Males
49
Growth of young males (15-19y) will be greatest in those regions least able to provide them with schools, jobs or hope. (link)
1950 60 70 80 90 0 10 20 30 40 50 0
20
40
60
80 Millions
Least Developed Regions
North America
Actual Projected

Young Males: Thailand
50
In Thailand, young men are in schools, sports and scouts, with reasonable chances for jobs. And their numbers are declining! There were 3.1 million in 1985 and 2.8 million in 2000.

Young Males: Pakistan
51
In Pakistan the scenario is less hopeful. Government expenditures are heavily weighted to the military. Education and health receive far lower priorities. There is also anger against western world.
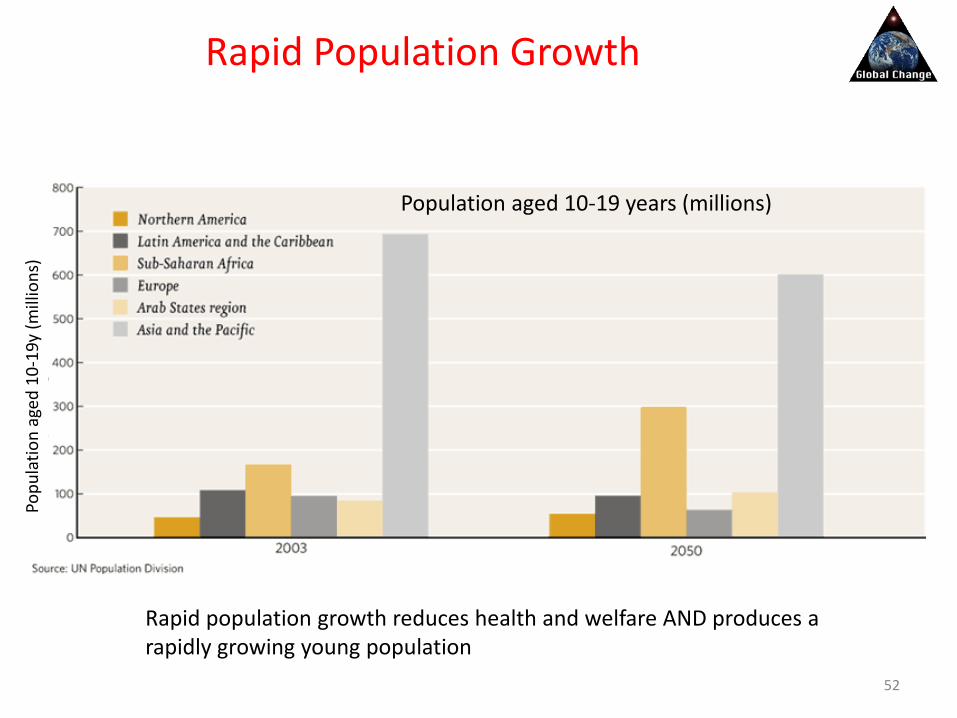
Rapid Population Growth
52
Rapid population growth reduces health and welfare AND produces a rapidly growing young population
Pop
ula
tio
n a
ged
10
-19
y (m
illio
ns)
Population aged 10-19 years (millions)

http://www.undp.org/popin/wdtrends/fer/fermap.htm
Age-specific fertility rates (births per 1,000 women) are low and declining everywhere in Europe
Too few people? Fertility rates in Europe (optional)

• Bologna, Italy, is ground zero for a social revolution: its fertility rate is ~0.8
• At present reproductive rates, in 20 years, for each child < 5 yrs there will be:
– 25 adults > 50 yrs
– 10 adults > 80 years
• Elsewhere, developed world may face a different future of aging and decline, unless births per woman increases, while less-developed world continues to grow dramatically.
An Upside Down Society ?

• Leads to inverted pyramids in which a few young must support many old people. Schools, pensions, jobs, health care pose financial burdens that may be harder to meet.
• How can economic growth continue, if the number of consumers declines?
• A population that chooses not to have children is a different kind of society. “You cannot have a successful world without children in it.”
• This is a social revolution in some developed countries. Not one country in Europe has replacement reproduction.
Consequences of a “Baby Bust”

Developed countries are growing more slowly than poorer countries. Problem of population growth is located in poor countries.
Developed means Slow Population Growth

Human Population - The Future
o Because of momentum represented by a steeply pyramidal age distribution, population growth surely will continue for one to several generations
o Because developing nations have greatest discrepancy between births and deaths (and steepest age pyramids), most growth will occur in developing nations
o Predications of ~9 billion in mid 21st C and 10-12 billion by late 21st C is the consensus, with more recent estimates favoring low range

Changing Distribution of World Population
The less-developed regions of the world comprised 30% of the global population in 1900, 80% in 2000, and are projected to comprise >90% by 2025
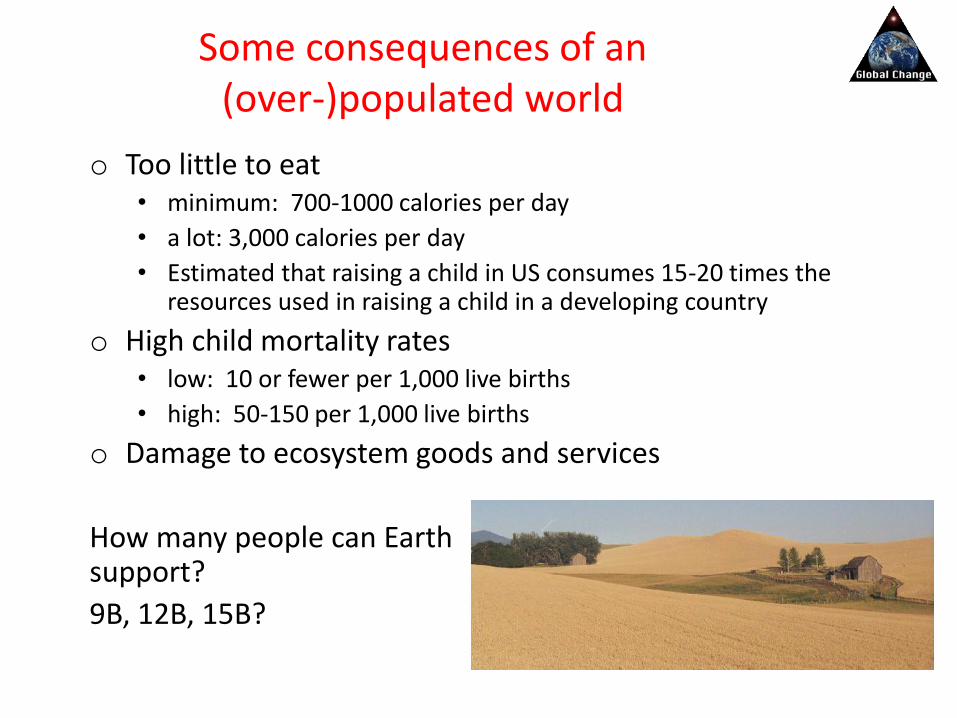
Some consequences of an (over-)populated world
o Too little to eat • minimum: 700-1000 calories per day
• a lot: 3,000 calories per day
• Estimated that raising a child in US consumes 15-20 times the resources used in raising a child in a developing country
o High child mortality rates • low: 10 or fewer per 1,000 live births
• high: 50-150 per 1,000 live births
o Damage to ecosystem goods and services
How many people can Earth support?
9B, 12B, 15B?
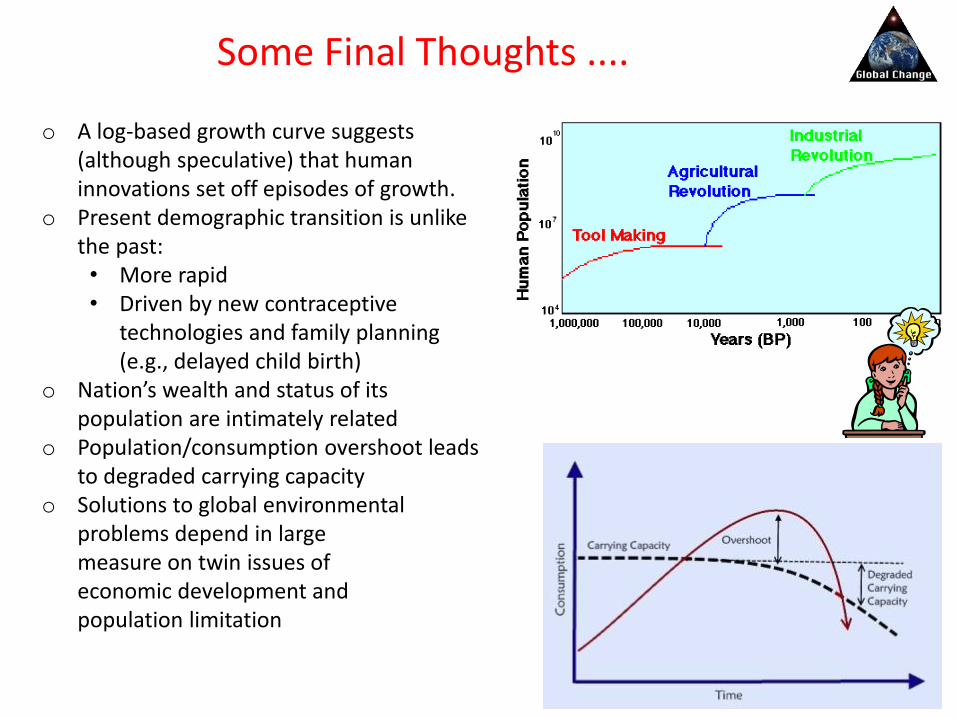
Some Final Thoughts ....
o A log-based growth curve suggests (although speculative) that human innovations set off episodes of growth.
o Present demographic transition is unlike the past: • More rapid • Driven by new contraceptive
technologies and family planning (e.g., delayed child birth)
o Nation’s wealth and status of its population are intimately related
o Population/consumption overshoot leads to degraded carrying capacity
o Solutions to global environmental problems depend in large measure on twin issues of economic development and population limitation


