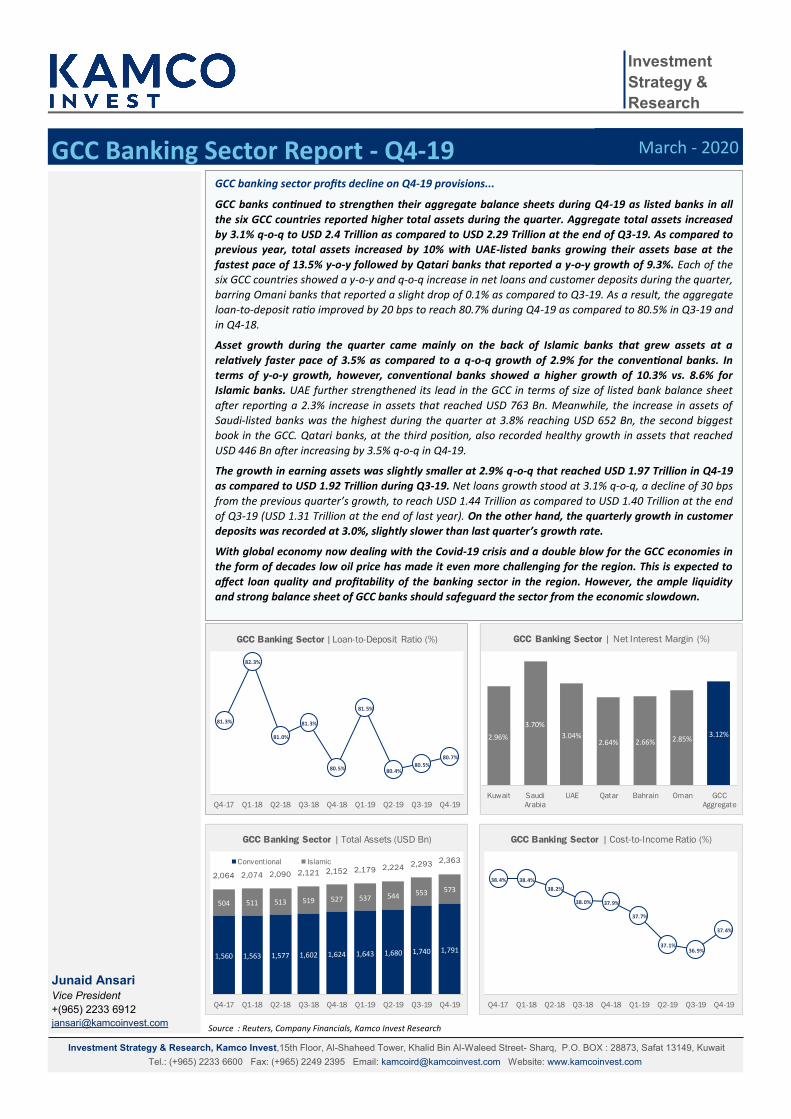
GCC Banking Sector Report - Q4-19 Junaid Ansari Vice President +(965) 2233 6912 [email protected]Investment Strategy & Research, Kamco Invest,15th Floor, Al-Shaheed Tower, Khalid Bin Al-Waleed Street- Sharq, P.O. BOX : 28873, Safat 13149, Kuwait Tel.: (+965) 2233 6600 Fax: (+965) 2249 2395 Email: [email protected]Website: www.kamcoinvest.com GCC banking sector profits decline on Q4-19 provisions... GCC banks connued to strengthen their aggregate balance sheets during Q4-19 as listed banks in all the six GCC countries reported higher total assets during the quarter. Aggregate total assets increased by 3.1% q-o-q to USD 2.4 Trillion as compared to USD 2.29 Trillion at the end of Q3-19. As compared to previous year, total assets increased by 10% with UAE-listed banks growing their assets base at the fastest pace of 13.5% y-o-y followed by Qatari banks that reported a y-o-y growth of 9.3%. Each of the six GCC countries showed a y-o-y and q-o-q increase in net loans and customer deposits during the quarter, barring Omani banks that reported a slight drop of 0.1% as compared to Q3-19. As a result, the aggregate loan-to-deposit rao improved by 20 bps to reach 80.7% during Q4-19 as compared to 80.5% in Q3-19 and in Q4-18. Asset growth during the quarter came mainly on the back of Islamic banks that grew assets at a relavely faster pace of 3.5% as compared to a q-o-q growth of 2.9% for the convenonal banks. In terms of y-o-y growth, however, convenonal banks showed a higher growth of 10.3% vs. 8.6% for Islamic banks. UAE further strengthened its lead in the GCC in terms of size of listed bank balance sheet aſter reporng a 2.3% increase in assets that reached USD 763 Bn. Meanwhile, the increase in assets of Saudi-listed banks was the highest during the quarter at 3.8% reaching USD 652 Bn, the second biggest book in the GCC. Qatari banks, at the third posion, also recorded healthy growth in assets that reached USD 446 Bn aſter increasing by 3.5% q-o-q in Q4-19. The growth in earning assets was slightly smaller at 2.9% q-o-q that reached USD 1.97 Trillion in Q4-19 as compared to USD 1.92 Trillion during Q3-19. Net loans growth stood at 3.1% q-o-q, a decline of 30 bps from the previous quarter’s growth, to reach USD 1.44 Trillion as compared to USD 1.40 Trillion at the end of Q3-19 (USD 1.31 Trillion at the end of last year). On the other hand, the quarterly growth in customer deposits was recorded at 3.0%, slightly slower than last quarter’s growth rate. With global economy now dealing with the Covid-19 crisis and a double blow for the GCC economies in the form of decades low oil price has made it even more challenging for the region. This is expected to affect loan quality and profitability of the banking sector in the region. However, the ample liquidity and strong balance sheet of GCC banks should safeguard the sector from the economic slowdown. March - 2020 Source : Reuters, Company Financials, Kamco Invest Research 1,560 1,563 1,577 1,602 1,624 1,643 1,680 1,740 1,791 504 511 513 519 527 537 544 553 573 2,064 2,074 2,090 2,121 2,152 2,179 2,224 2,293 2,363 Q4-17 Q1-18 Q2-18 Q3-18 Q4-18 Q1-19 Q2-19 Q3-19 Q4-19 GCC Banking Sector | Total Assets (USD Bn) Conventional Islamic 38.4% 38.4% 38.2% 38.0% 37.9% 37.7% 37.1% 36.9% 37.4% Q4-17 Q1-18 Q2-18 Q3-18 Q4-18 Q1-19 Q2-19 Q3-19 Q4-19 GCC Banking Sector | Cost-to-Income Ratio (%) 2.96% 3.70% 3.04% 2.64% 2.66% 2.85% 3.12% Kuwait Saudi Arabia UAE Qatar Bahrain Oman GCC Aggregate GCC Banking Sector | Net Interest Margin (%) 81.3% 82.3% 81.0% 81.3% 80.5% 81.5% 80.4% 80.5% 80.7% Q4-17 Q1-18 Q2-18 Q3-18 Q4-18 Q1-19 Q2-19 Q3-19 Q4-19 GCC Banking Sector | Loan-to-Deposit Ratio (%) Investment Strategy & Research
Highlights - GCC Banking Sector This report analyzes financials reported by 61 listed banks in the GCC for Q4-19. The individual banking data has been aggregated to the
country level as there are minimal differences in the countries’ regulatory and supervisory environment. We believe that the charts and
tables adequately capture the nature and structure of the individual countries’ financial systems, their supervision and their monetary
operations. Some of the key observations from the most recent financial for the GCC Banking Sector includes the following:
Provisions lower profits despite stable NIMs
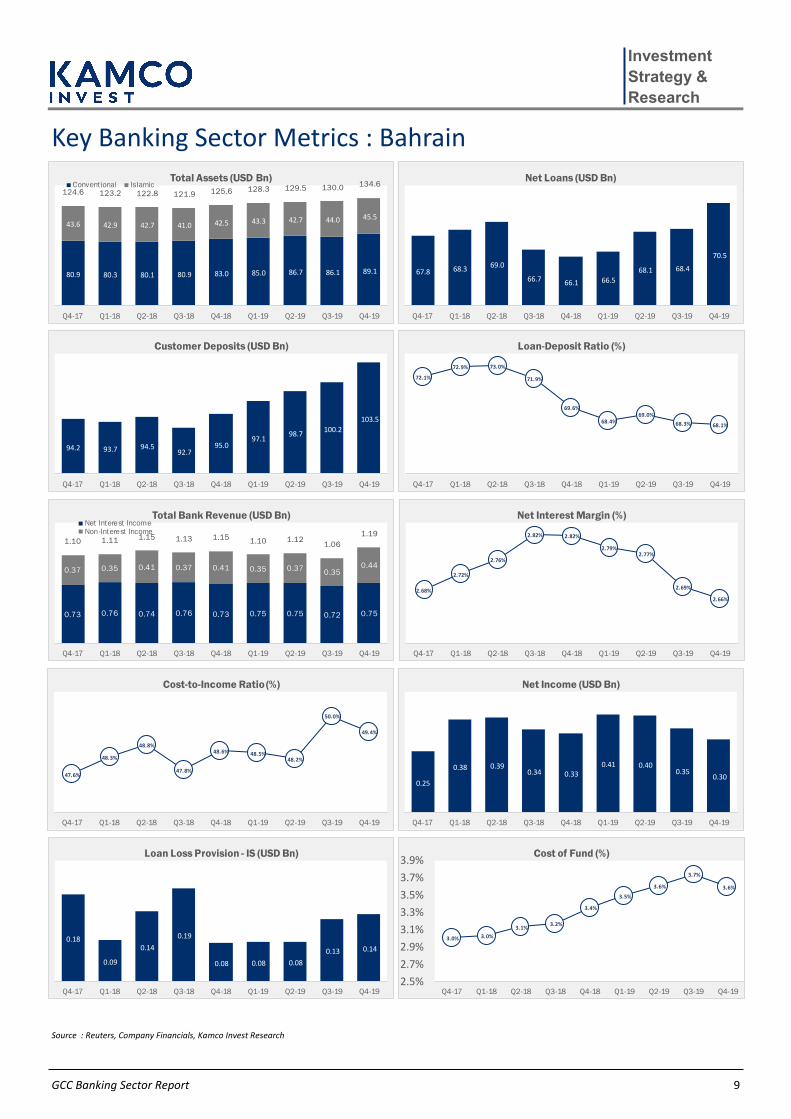
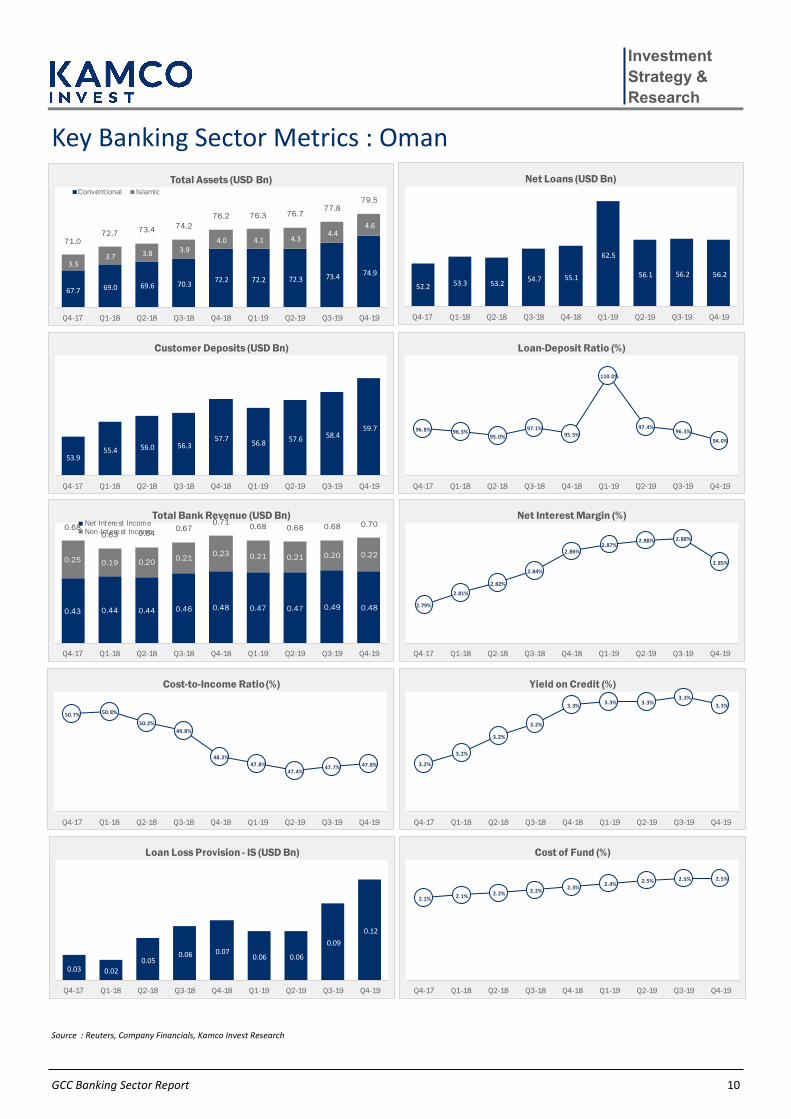
Net interest margins (NIM) remained largely flat across the GCC countries during Q4-19 resulting in flat NIM at the GCC level at 3.1%.
Saudi Arabia recorded the highest NIMs in the GCC at 3.7% led by a relatively higher loan-to-deposit ratio as well as a vibrant lending
activity due to the active project market in the Kingdom. Meanwhile, non-interest income declined in four out of the six GCC markets.
Saudi Arabia and UAE reported double digit q-o-q declines of 12.9% and 11.9%, respectively, in Q4-19, whereas Bahrain and Omani banks
reported growth of 27.2% and 10.4%, respectively.
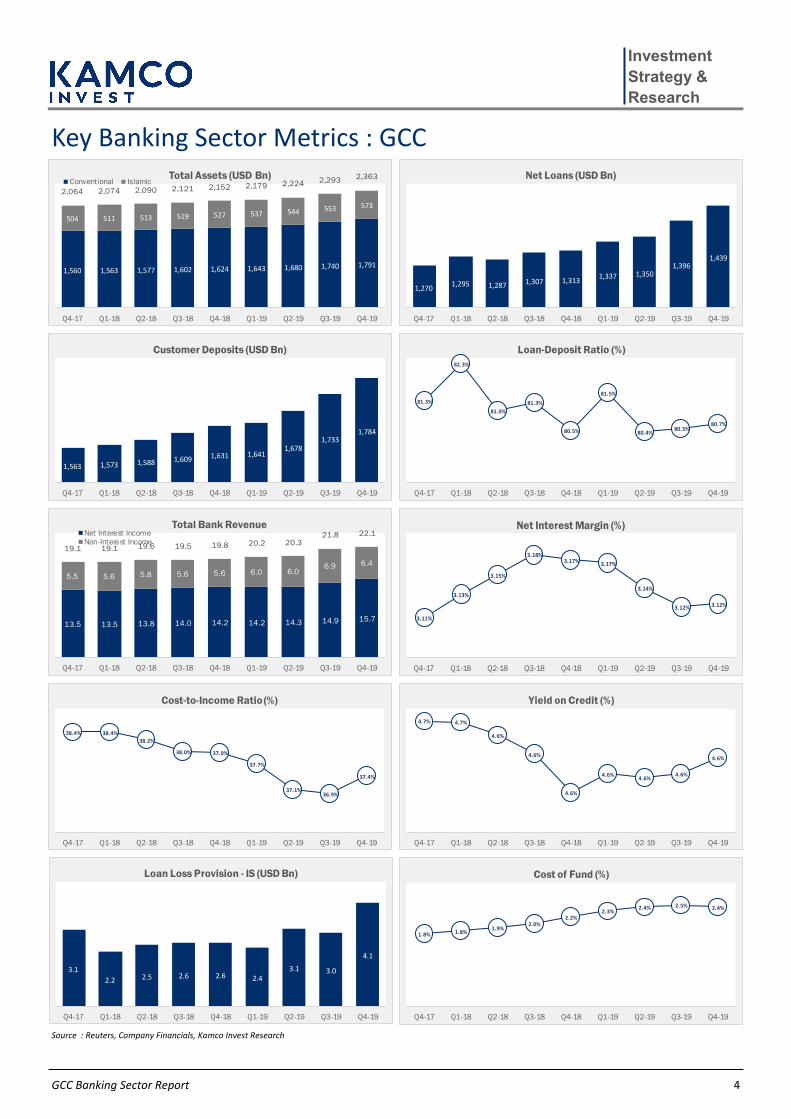
In terms of quarterly provisions, 41 out of the 61 listed GCC banks booked higher loan loss provisions (LLP) during Q4-19 that resulted in a
steep decline in net profits as compared to Q3-19 and Q4-18. Total provisions booked during the quarter stood at USD 4.1 Bn, one of the
highest ever recorded in a single quarter. Banking profits were also affected by higher cost-to-income ratio that increased by 50 bps to
reach 37.4%, the highest level over the last three quarters. As a result, profits during the quarter dropped to the lowest level in eleven
quarters to USD 7.9 Bn. For the full year 2019, loan loss provisions stood at USD 12.6 Bn, one of the highest over the years. This resulted
in a smaller growth in net profits during the year that grew by 3.5% to reach USD 37.1 Bn in 2019 vs. USD 35.9 Bn during 2018.
Saudi Arabian banks recorded the biggest q-o-q increase in LLP during Q4-19 by 78.2% followed by Qatari banks with an increase of
69.3%. Bahraini and Kuwaiti banks reported the smallest increase of 7.5% and 13.6%, respectively. In Saudi Arabia, provisions booked
more than doubled for a majority of the banks during Q4-19, but the aggregate provisions of USD 1.1 Bn was still less than the aggregate
for Q2-19 that stood at USD 1.2 Bn (that was mainly led by provisions booked by SABB and Saudi Investment Bank during the quarter).
NCB was the only bank that reported a decline in provisions in Q4-19. In Qatar, higher aggregate Q4-19 provisions came on the back of
doubling of LLP reported by QNB, whereas smaller Qatari banks reported even higher growth in provisions.
Total Assets - Saudi Arabian banks increase their share in Q4-19
Total asset growth remained positive across the GCC banking sector in Q4-19 resulting in one of the highest quarterly growth. GCC-listed
banks saw their assets increase by 3.1% during the quarter to reach USD 2.4 Trillion. This growth was primarily on the back of Saudi
Arabian banks that reported a 3.8% growth in assets followed by 3.5% q-o-q growth recorded by banks in Qatar and Bahrain.
On the individual country front, UAE continues to boast the biggest share of total listed banking assets in the GCC recorded at USD 763 Bn
or 32.3% of the total GCC banking assets. Saudi Arabia followed after UAE with total assets of USD 652 Bn or 27.6% of the GCC at the end
of Q4-19. The top ten banks in the region accounted for 56.0% of the total GCC listed banks’ assets during Q4-19 as compared to 55.8%
during Q3-19.
Loan-to-Deposit Ratio remains subdued at 80.7% that limits profitability growth
The growth in net loans continued for the fifth consecutive month improving by 3.1% in Q4-19 to reach USD 1.44 Trillion. The growth was
broad-based as merely 15 banks out of 61 GCC banks reported a q-o-q decline. Listed banks in Qatar reported the biggest q-o-q increase
in net loans of 3.5% with 6 out of the 8 listed banks recording a growth. The region’s biggest bank, QNB, reported a 4% increase in net
loans during the quarter whereas smaller bank QIIB reported the biggest q-o-q growth of 10% in Qatar. Saudi and UAE banks followed
with q-o-q net loan increase of 3.3% during Q4-19. Customer deposits growth was also positive across the board for the GCC banks. The
increase in customer deposits was one of the highest over the last few quarters at 3.0% to reach USD 1.78 Trillion, slightly below last
quarters growth rate of 3.3%. Saudi Arabian banks posted the biggest q-o-q growth in customer deposits during Q4-19 at 3.9% followed
by Qatar at 3.6% and Bahrain at 3.4%.
The net effect was a marginally better loan-to-deposit ratio at 80.7% in Q4-19 as compared to 80.5% during the previous quarter. The
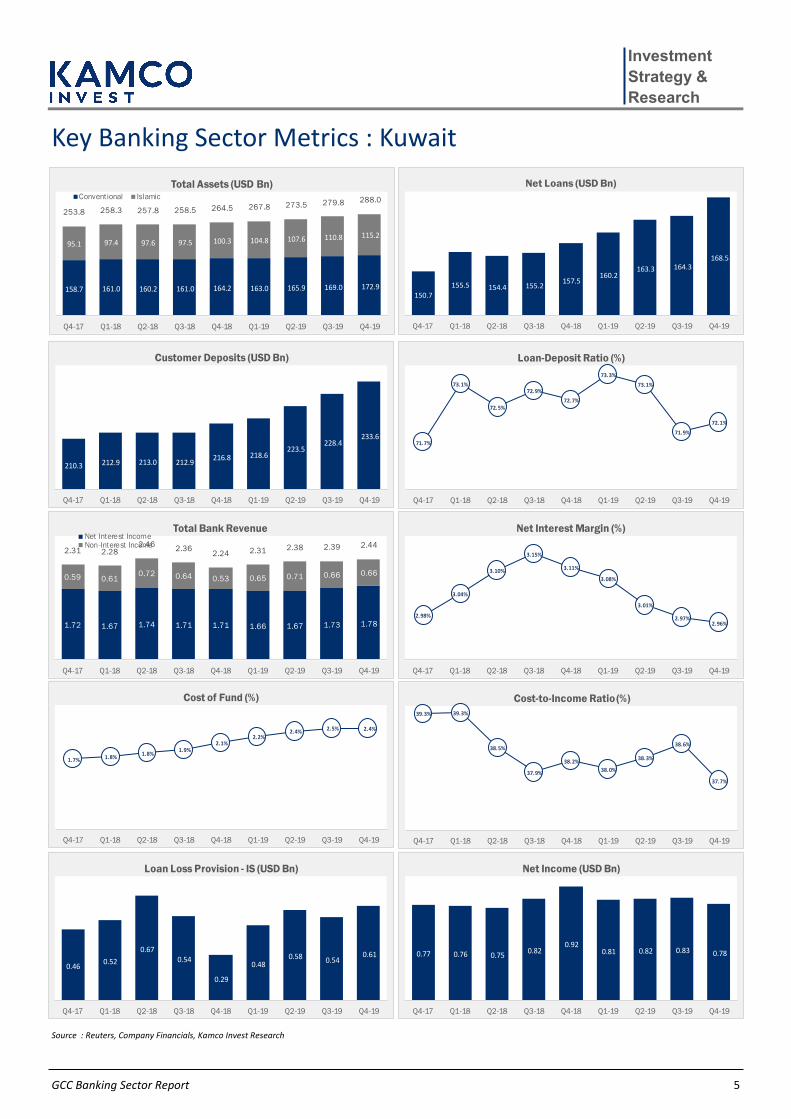
ratio remains the highest in the case of Oman at 94.0% followed by Qatar at 90.6%, whereas Kuwaiti banks reported the lowest ratio of
72.1%. The ratio for UAE banks also remained low as compared to global averages at 79.6%.
3
GCC Banking Sector Report
Investment
Strategy &
Research
Total Bank Revenues - healthy growth in all GCC countries barring UAE
Total bank revenues for GCC-listed banks reached USD 22.1 Bn during Q4-19 as compared to USD 21.8 Bn during Q3-19, a q-o-q growth of
1.4%. Aggregate revenues for each of the GCC countries, barring UAE-listed banks, increased during the quarter with Bahraini banks
reporting the biggest growth of 12.5%. Qatari banks were next with a growth of 3.4% followed by Saudi Arabian banks at 2.8%. The q-o-q
decline in UAE banks came after more than half of the listed banks reported a q-o-q drop in revenues during the quarter. The 12.5%
decline in revenues reported by ENBD, as the previous quarter included fair value gains from disposal of an associate, primarily resulted
in decline in aggregate revenues for the UAE.
The growth in GCC bank’s net interest income (NII) was the highest in the last ten quarters during Q4-19 at 5.3% to reach USD 15.7 Bn vs.
USD 14.9 Bn during Q3-19. The increase was mainly led by 8.1% growth in NII for Saudi Arabian banks followed by 5.3% growth for Qatari
and Bahraini banks. Omani banks recorded a q-o-q decline in NII that receded by 1.2%. In Saudi Arabia, NCB reported a significant surge
in NII by 33% led by higher interest income and a decline in interest expense during the quarter. SABB also reported a healthy growth of
15.6% in its net interest income during the quarter. Saudi Arabian banks have seen consistent increase in lending over the last few
quarters led by an increase in project activity.
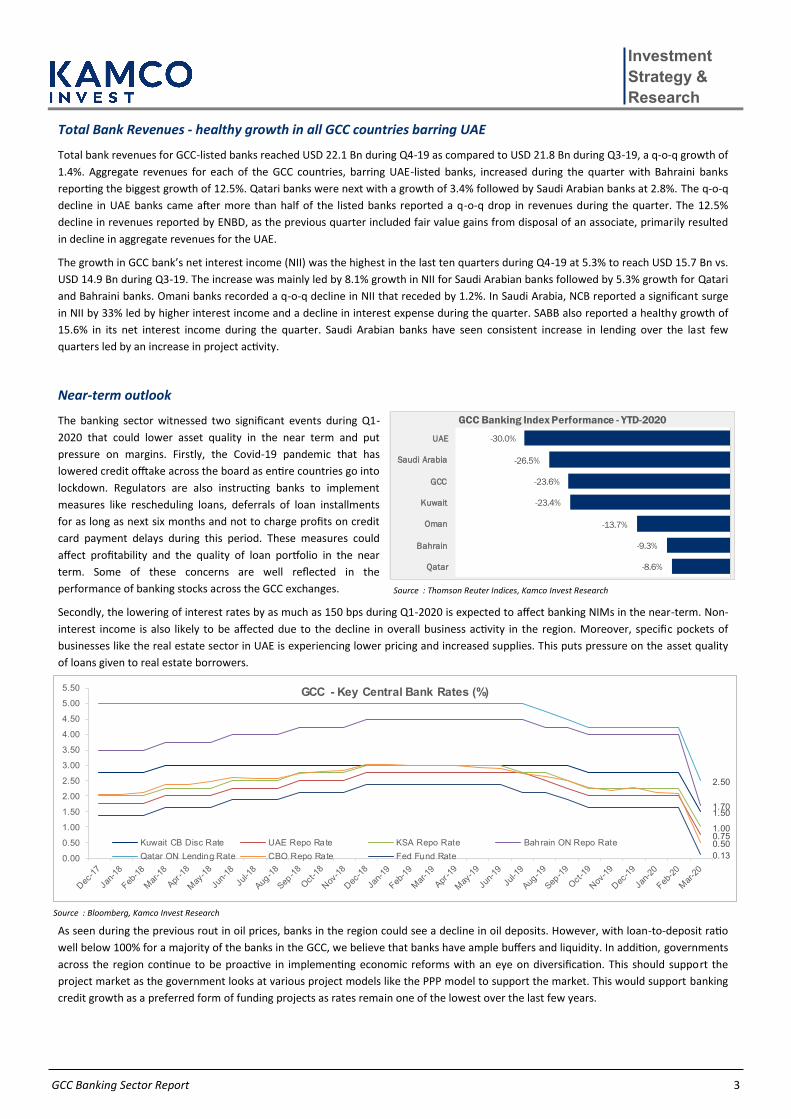
Near-term outlook
The banking sector witnessed two significant events during Q1-
2020 that could lower asset quality in the near term and put
pressure on margins. Firstly, the Covid-19 pandemic that has
lowered credit offtake across the board as entire countries go into
lockdown. Regulators are also instructing banks to implement
measures like rescheduling loans, deferrals of loan installments
for as long as next six months and not to charge profits on credit
card payment delays during this period. These measures could
affect profitability and the quality of loan portfolio in the near
term. Some of these concerns are well reflected in the
performance of banking stocks across the GCC exchanges.
Secondly, the lowering of interest rates by as much as 150 bps during Q1-2020 is expected to affect banking NIMs in the near-term. Non-
interest income is also likely to be affected due to the decline in overall business activity in the region. Moreover, specific pockets of
businesses like the real estate sector in UAE is experiencing lower pricing and increased supplies. This puts pressure on the asset quality
of loans given to real estate borrowers.
As seen during the previous rout in oil prices, banks in the region could see a decline in oil deposits. However, with loan-to-deposit ratio
well below 100% for a majority of the banks in the GCC, we believe that banks have ample buffers and liquidity. In addition, governments
across the region continue to be proactive in implementing economic reforms with an eye on diversification. This should support the
project market as the government looks at various project models like the PPP model to support the market. This would support banking
credit growth as a preferred form of funding projects as rates remain one of the lowest over the last few years.
Source : Thomson Reuter Indices, Kamco Invest Research
Kamco Invest is authorized and fully regulated by the Capital Markets Authority ("CMA, Kuwait") and partially regulated by the Central Bank of Kuwait (“CBK”)
This document is provided for informational purposes only. Nothing contained in this document constitutes investment, an offer to invest , legal, tax or other advice or guidance and should be disregarded when considering or making investment decisions. In preparing this document, Kamco Invest did not take into account the investment objectives, financial situation and particular needs of any particular person. Accordingly, before acting on this document, investors should independently evaluate the investments and strategies referred to herein and make their own determination of whether it is appropriate in light of their own financial circumstances and objectives. The entire content of this document is subject to copyright with all rights reserved. This research and the information contained herein may not be reproduced, distributed or transmitted in Kuwait or in any other jurisdiction to any other person or incorporated in any way into another document or other material without our prior written consent.
Analyst Certification
Each of the analysts identified in this report certifies, with respect to the sector, companies or securities that the individual analyses, that (1) the views expressed in this report reflect his or her personal views about all of the subject companies and securities and (2) no part of his or her compensation was, is or will be directly or indirectly dependent on the specific recommendations or views expressed in this report.
Kamco Invest Ratings
Kamco Invest research is based on the analysis of regional and country economics, industries and company fundamentals. Kamco Invest company research reflects a long-term (12-month) target price for a company or stock. The ratings bands are:
Outperform: Target Price represents expected returns >= 10% in the next 12 months
Neutral: Target Price represents expected returns between -10% and +10% in the next 12 months
Underperform: Target Price represents an expected return of <-10% in the next 12 months
In certain circumstances, ratings may differ from those implied by a fair value target using the criteria above. Kamco Invest policy is to maintain up-to-date fair value targets on the companies under its coverage, reflecting any material changes to the analyst’s outlook on a company. Share price volatility may cause a stock to move outside the rating range implied by Kamco Invest’s fair value target. Analysts may not necessarily change their ratings if this happens, but are expected to disclose the rationale behind their view to Kamco Invest clients.
Any terms and conditions proposed by you which are in addition to or which conflict with this Disclaimer are expressly rejected by Kamco Invest and shall be of no force or effect. The information contained in this document is based on current trade, statistical and other public information we consider reliable. We do not represent or warrant that such information is fair, accurate or complete and it should not be relied upon as such. Kamco Invest has no obligation to update, modify or amend this document or to otherwise notify a recipient thereof in the event that any opinion, forecast or estimate set forth herein, changes or subsequently becomes inaccurate. The publication is provided for informational uses only and is not intended for trading purposes. The information on publications does not give rise to any legally binding obligation and/or agreement, including without limitation any obligation to update such information. You shall be responsible for conducting your own investigation and analysis of the information contained or referred to in this document and of evaluating the merits and risks involved in the securities forming the subject matter of this or other such document. Moreover, the provision of certain data/information in the publication may be subject to the terms and conditions of other agreements to which Kamco Invest is a party.
Nothing in this document should be construed as a solicitation or offer, or recommendation, to acquire or dispose of any investment or to engage in any other transaction, or to provide any investment advice or service. This document is directed at Professional Clients and not Retail Clients within the meaning of CMA rules. Any other persons in receipt of this document must not rely upon or otherwise act upon it. Entities and individuals into whose possession this document comes are required to inform themselves about, and observe such restrictions and should not rely upon or otherwise act upon this document where it is unlawful to make to such person such an offer or invitation or recommendation without compliance with any authorization, registration or other legal requirements.
Kamco Investment Company (DIFC) Limited (“Kamco Invest DIFC”) is regulated by the Dubai Financial Services Authority (DFSA). Kamco Invest DIFC may only undertake the financial services activities that fall within the scope of its existing DFSA licence. This document is intended for Professional Clients or Market Counterparties only as defined by the DFSA, and no other person should act upon it.’
Risk Warnings
Any prices, valuations or forecasts are indicative and are not intended to predict actual results, which may differ substantially from those reflected. The value of an investment may go up as well as down. The value of and income from any investment may fluctuate from day to day as a result of changes in relevant economic markets (including, without limitation, foreseeable or unforeseeable changes in interest rates, foreign exchange rates, default rates, prepayment rates, political or financial conditions, etc.).
Past performance is not indicative of future results. Any opinions, estimates, valuations or projections (target prices and ratings in particular) are inherently imprecise and a matter of judgment. They are statements of opinion and not of fact, based on current expectations, estimates and projections, and rely on beliefs and assumptions. Actual outcomes and returns may differ materially from what is expressed or forecasted. There are no guarantees of future performance. Certain transactions, including those involving futures, options, and other derivatives, give rise to substantial risk and are not suitable for all investors. This document does not propose to identify or to suggest all of the risks (direct or indirect) which may be associated with the investments and strategies referred to herein.
Conflict of Interest
Kamco Invest and its affiliates provide full investment banking services, and they and their directors, officers and employees, may take positions which conflict with the views expressed in this document. Salespeople, traders, and other professionals of Kamco Invest may provide oral or written market commentary or trading strategies to our clients and our proprietary trading desks that reflect opinions that are contrary to the opinions expressed in this document. Our asset management area, our proprietary trading desks and investing businesses may make investment decisions that are inconsistent with the recommendations or views expressed in this document. Kamco Invest may have or seek investment banking or other business relationships for which it will receive compensation from the companies that are the subject of this document. Facts and views presented in this document have not been reviewed by, and may not reflect information known to, professionals in other Kamco Invest business areas, including investment banking personnel. United Gulf Bank, Bahrain owns majority of Kamco Invest’s shareholding and this ownership may create, or may create the appearance of, conflicts of interest.
No Liability & Warranty
Kamco Invest makes neither implied nor expressed representations or warranties and, to the fullest extent permitted by applicable law, we hereby expressly disclaim any and all express, implied and statutory representations and warranties of any kind, including, without limitation, any warranty as to accuracy, timeliness, completeness, and fitness for a particular purpose and/or non-infringement. Kamco Invest will accept no liability in any event including (without limitation) your reliance on the information contained in this document, any negligence for any damages or loss of any kind, including (without limitation) direct, indirect, incidental, special or consequential damages, expenses or losses arising out of, or in connection with your use or inability to use this document, or in connection with any error, omission, defect, computer virus or system failure, or loss of any profit, goodwill or reputation, even if expressly advised of the possibility of such loss or damages, arising out of or in connection with your use of this document. We do not exclude our duties or liabilities under binding applicable law.
Disclaimer & Important Disclosures
Kamco Invest
Kamco Invest
Kamco Investment Company - K.S.C. (Public)
Al-Shaheed Tower, Khalid Bin Al-Waleed Street- Sharq