44
GCC PLASTIC INDUSTRY INDICATORS 2016
GCC PLASTIC INDUSTRYINDICATORS 2016
CONTENTS
GCC plastics industry in numbers – Year 2016 5
Section 1: GCC polymer industry landscape 6
Section 2: GCC global polymer market share 14
Section 3: Employment in GCC polymer industry 20
Section 4: GCC domestic polymer consumption 22
Section 5: GCC polymer export 30
Section 6: Polymers capacity expansion 34
Section 7: GCC plastic recycling 40
GCC plastics industry innumbers – Year 2016
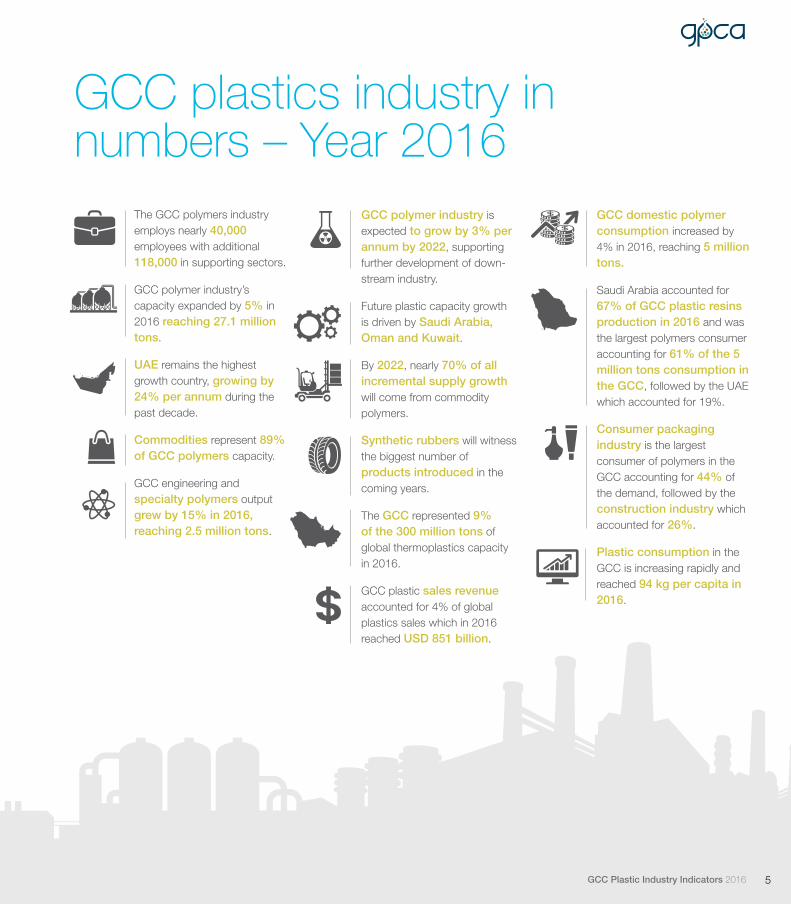
The GCC polymers industry employs nearly 40,000 employees with additional 118,000 in supporting sectors.
GCC polymer industry’s capacity expanded by 5% in 2016 reaching 27.1 million tons.
UAE remains the highest growth country, growing by 24% per annum during the past decade.
Commodities represent 89% of GCC polymers capacity.
GCC engineering and specialty polymers output grew by 15% in 2016, reaching 2.5 million tons.
GCC polymer industry is expected to grow by 3% per annum by 2022, supporting further development of down-stream industry.
Future plastic capacity growth is driven by Saudi Arabia, Oman and Kuwait.
By 2022, nearly 70% of all incremental supply growth will come from commodity polymers.
Synthetic rubbers will witness the biggest number of products introduced in the coming years.
The GCC represented 9% of the 300 million tons of global thermoplastics capacity in 2016.
GCC plastic sales revenue accounted for 4% of global plastics sales which in 2016 reached USD 851 billion.
GCC domestic polymer consumption increased by 4% in 2016, reaching 5 million tons.
Saudi Arabia accounted for 67% of GCC plastic resins production in 2016 and was the largest polymers consumer accounting for 61% of the 5 million tons consumption in the GCC, followed by the UAE which accounted for 19%.
Consumer packaging industry is the largest consumer of polymers in the GCC accounting for 44% of the demand, followed by the construction industry which accounted for 26%.
Plastic consumption in the GCC is increasing rapidly and reached 94 kg per capita in 2016.
5GCC Plastic Industry Indicators 2016

Section 1: GCC polymerindustry landscape

6.5
0.6 1.3
0.7 0.3
18.2
4.7
2.2 1.0 0.9
Saudi Arabia UAE Qatar Kuwait Oman
2006 2016
11%
24% 5.5% 3% 11%
GCC polymers production capacity (mtpa) and growth CAGR (2006-2016)
1.1 Regional capacity growth
The industry grew 11% per annum over the past decade
GCC polymer industry
expanded by 5% in
2016 reaching 27.1 million tons
The GCC polymer industry has returned to its historic growth rate, growing by 5% year on year in 2016, up from 2% for the same period a year ago. With a production capacity of 27.1 million tons
Source: Gulf Petrochemicals and Chemicals Association, 2017
9.4 12.1 12.7 17.6 19.3 20.0 22.5 22.8 25.2 25.7 27.1
2006 2007 2008 2009 2010 2011 2012 2013 2014 2015 2016
CAGR (2006 - 2016) 11%
Saudi Arabia
67%
UAE 18%
Qatar 8%
Kuwait 4%
Oman 3%
2016
GCC polymers production capacity, million tons (2006-2016)
per annum of resists, the polymer industry expanded by 11% per annum over the past decade.
7GCC Plastic Industry Indicators 2016
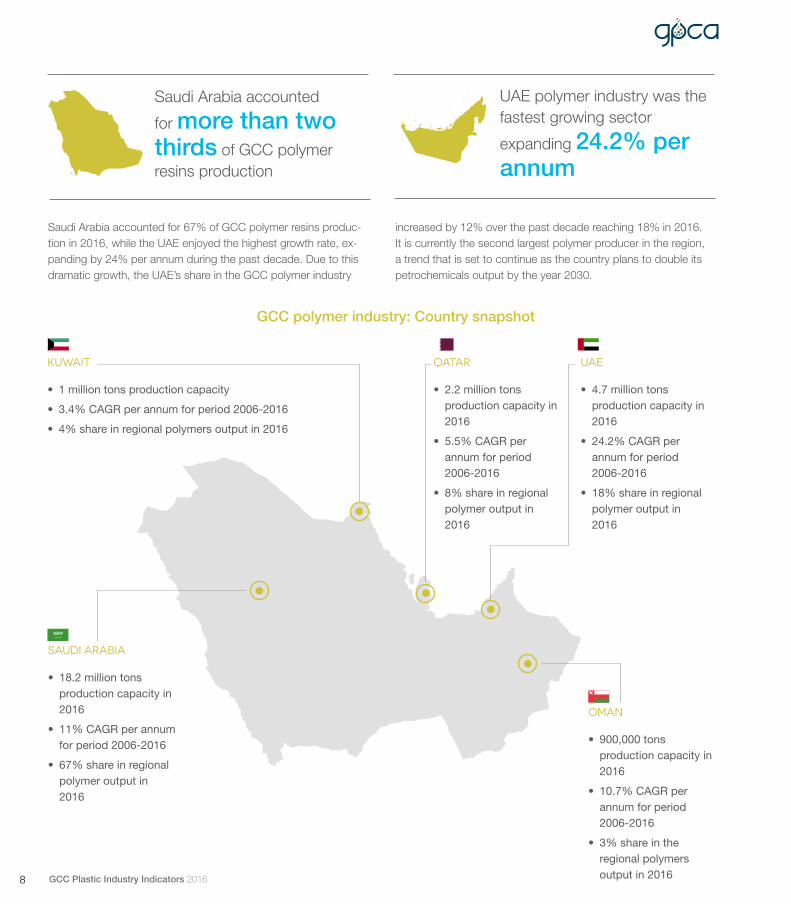
Saudi Arabia accounted
for more than two thirds of GCC polymer resins production
UAE polymer industry was the fastest growing sector
expanding 24.2% per annum
Saudi Arabia accounted for 67% of GCC polymer resins produc-tion in 2016, while the UAE enjoyed the highest growth rate, ex-panding by 24% per annum during the past decade. Due to this dramatic growth, the UAE’s share in the GCC polymer industry
SAUDI ARABIA
• 18.2 million tons production capacity in 2016
• 11% CAGR per annum for period 2006-2016
• 67% share in regional polymer output in 2016
UAE
• 4.7 million tons production capacity in 2016
• 24.2% CAGR per annum for period 2006-2016
• 18% share in regional polymer output in 2016
OMAN
• 900,000 tons production capacity in 2016
• 10.7% CAGR per annum for period 2006-2016
• 3% share in the regional polymers output in 2016
KUWAIT
• 1 million tons production capacity
• 3.4% CAGR per annum for period 2006-2016
• 4% share in regional polymers output in 2016
QATAR
• 2.2 million tons production capacity in 2016
• 5.5% CAGR per annum for period 2006-2016
• 8% share in regional polymer output in 2016
increased by 12% over the past decade reaching 18% in 2016. It is currently the second largest polymer producer in the region, a trend that is set to continue as the country plans to double its petrochemicals output by the year 2030.
GCC polymer industry: Country snapshot
8 GCC Plastic Industry Indicators 2016

In 2016, GCC produced 22 unique products most of which are first of their kind in the Middle East
The majority of new products in the region were manufac-
tured in Saudi Arabia
In 2016, the GCC polymer industry produced 22 unique prod-ucts excluding various grades of the same product. This is dou-ble the number of products manufactured in the region in 2005.
The biggest number of new products were in the commodities and engineering polymers, most of which are first of their kind in the Middle East and manufactured in Saudi Arabia.
9.0 9.4
12.1 12.7
17.6 19.3 20.0
22.5 22.8 25.2 25.7 27.1
10 10 10 10 12 12 13 14
16 18 19
22
0
5
10
15
20
25
0
5
10
15
20
25
30
2005 2006 2007 2008 2009 2010 2011 2012 2013 2014 2015 2016
Mill
ion
tons
Production Capacity (million tons) Number of products
CAGR (2006 - 2016) 11%
GCC polymers production capacity and number of products(2006-2016)
6
1 3
0
10
6 5
1
Commodity Engineering & Specialty Polymers
Thermoset Synthetic rubber
Number of polymer products by category
2005 2016 Source: Gulf Petrochemicals and Chemicals Association, 2017
9GCC Plastic Industry Indicators 2016
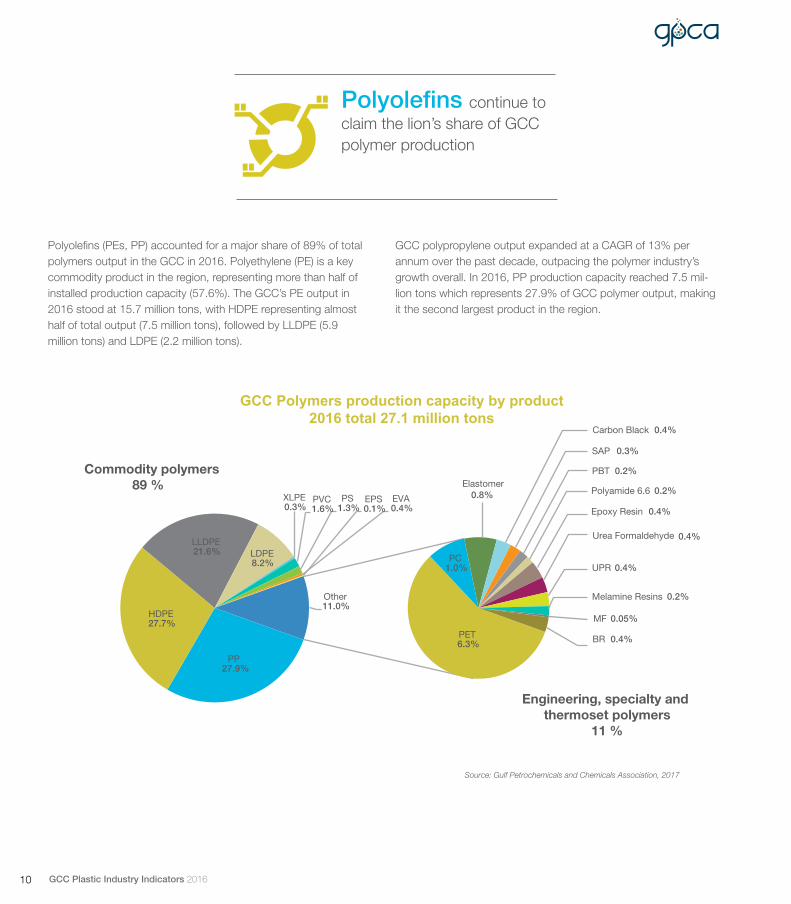
Polyolefins (PEs, PP) accounted for a major share of 89% of total polymers output in the GCC in 2016. Polyethylene (PE) is a key commodity product in the region, representing more than half of installed production capacity (57.6%). The GCC’s PE output in 2016 stood at 15.7 million tons, with HDPE representing almost half of total output (7.5 million tons), followed by LLDPE (5.9 million tons) and LDPE (2.2 million tons).
GCC polypropylene output expanded at a CAGR of 13% per annum over the past decade, outpacing the polymer industry’s growth overall. In 2016, PP production capacity reached 7.5 mil-lion tons which represents 27.9% of GCC polymer output, making it the second largest product in the region.
PP 27.9%
HDPE 27.7%
LLDPE 21.6% LDPE
8.2%
XLPE 0.3%
PVC 1.6%
PS 1.3%
EVA 0.4%
EPS 0.1%
PET 6.3%
PC 1.0%
Elastomer 0.8%
Carbon Black 0.4%
SAP 0.3%
PBT 0.2%
Polyamide 6.6 0.2%
Epoxy Resin 0.4%
Urea Formaldehyde 0.4%
UPR 0.4%
Melamine Resins 0.2%
MF 0.05%
BR 0.4%
Other 11.0%
Engineering, specialty and thermoset polymers
11 %
Commodity polymers89 %
GCC Polymers production capacity by product 2016 total 27.1 million tons
Source: Gulf Petrochemicals and Chemicals Association, 2017
Polyolefins continue to claim the lion’s share of GCC polymer production
10 GCC Plastic Industry Indicators 2016
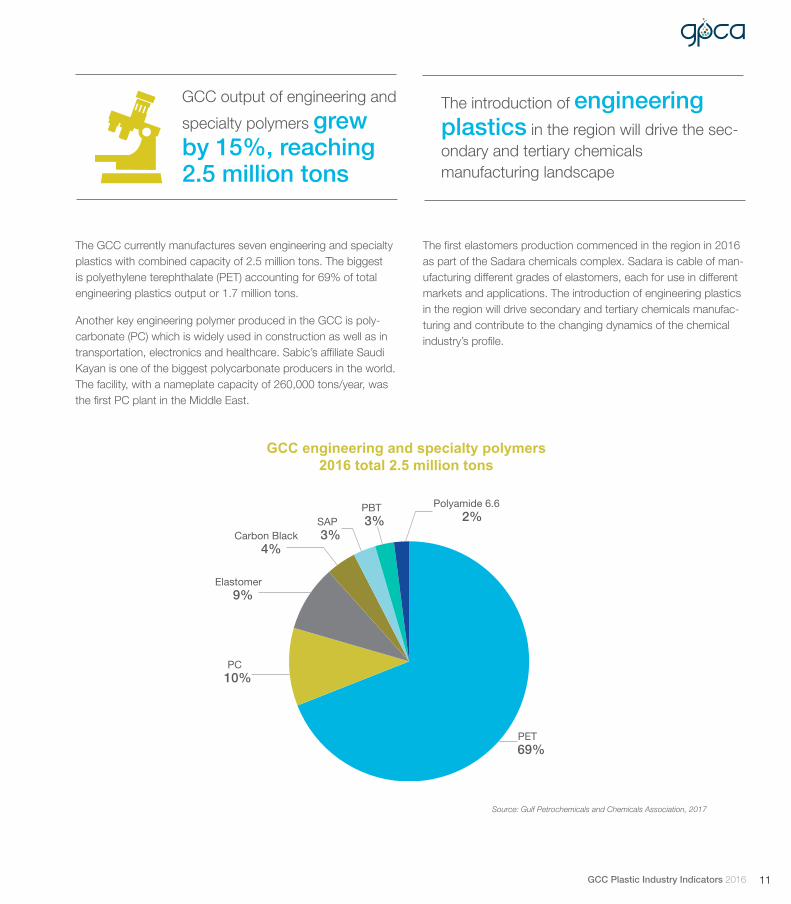
The GCC currently manufactures seven engineering and specialty plastics with combined capacity of 2.5 million tons. The biggest is polyethylene terephthalate (PET) accounting for 69% of total engineering plastics output or 1.7 million tons.
Another key engineering polymer produced in the GCC is poly-carbonate (PC) which is widely used in construction as well as in transportation, electronics and healthcare. Sabic’s affiliate Saudi Kayan is one of the biggest polycarbonate producers in the world. The facility, with a nameplate capacity of 260,000 tons/year, was the first PC plant in the Middle East.
Source: Gulf Petrochemicals and Chemicals Association, 2017
GCC output of engineering and
specialty polymers grew by 15%, reaching 2.5 million tons
The introduction of engineering plastics in the region will drive the sec-ondary and tertiary chemicals manufacturing landscape
The first elastomers production commenced in the region in 2016 as part of the Sadara chemicals complex. Sadara is cable of man-ufacturing different grades of elastomers, each for use in different markets and applications. The introduction of engineering plastics in the region will drive secondary and tertiary chemicals manufac-turing and contribute to the changing dynamics of the chemical industry’s profile.
PET 69%
PC 10%
Elastomer 9%
Carbon Black 4%
SAP 3%
PBT 3%
Polyamide 6.6 2%
GCC engineering and specialty polymers 2016 total 2.5 million tons
11GCC Plastic Industry Indicators 2016

Polymer sales revenue in the GCC represents more than one third of total chemical sales (36%). In 2016, polymer sales were estimated at USD 33-34 billion, up from USD 28.7 billion the year before. With less than 20% share in total production output, the polymer industry generates one third of total chemical sales revenue, making it a high earner compared to other industry segments. Over the past five years, GCC polymer sales have
demonstrated a positive growth trend of 9% per annum, higher than the 6% production growth rate for the same period.
The GCC plastics producers’ sales in 2016 represented 4% of the global industry sales revenue. In previous years, Saudi Arabia alone accounted for 2% of global polymer sales, and ranked as the top 8th plastics producer globally.
Chemicals
46%
Polymers
36%
Fertilizers
8%
Basic Chemicals
3%
Intermediates
2%
GCC chemicals industry sales revenue, 2015: USD 79.7 billion
Source: Gulf Petrochemicals and Chemicals Association, 2016
1.2 GCC polymer sales
GCC polymer sales revenue grew by
around 9% per annum, reaching
USD 34 billion in 2016
12 GCC Plastic Industry Indicators 2016
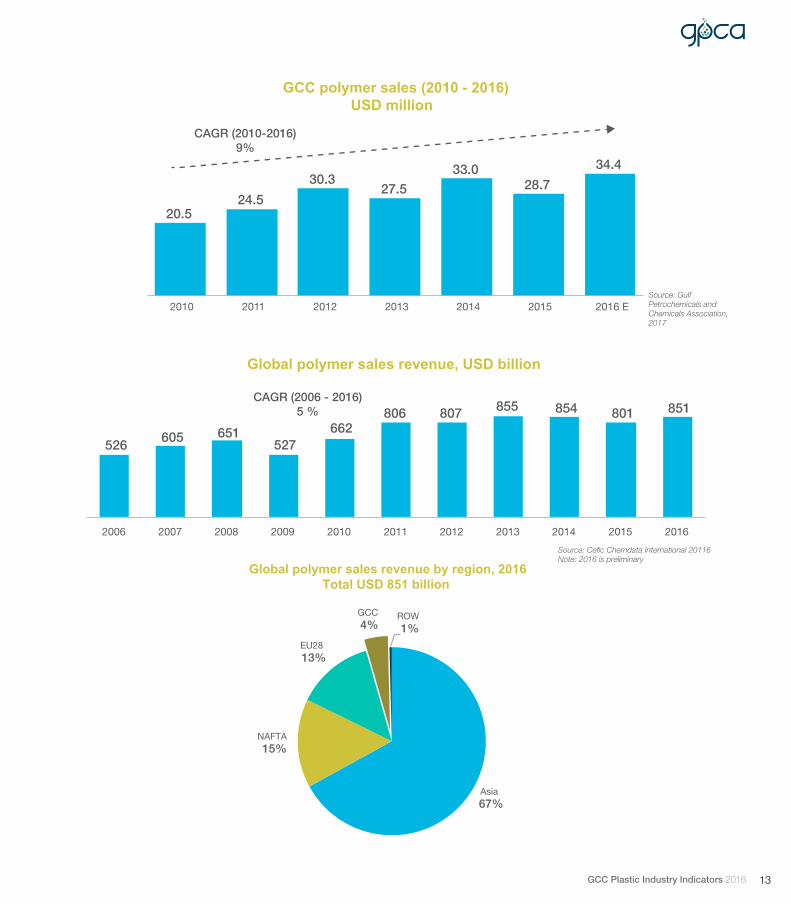
GCC polymer sales (2010 - 2016)USD million
CAGR (2010-2016) 9%
20.5 24.5
30.3 27.5
33.0 28.7
34.4
2010 2011 2012 2013 2014 2015 2016 E Source: Gulf Petrochemicals and Chemicals Association, 2017
526 605 651
527 662
806 807 855 854 801 851
2006 2007 2008 2009 2010 2011 2012 2013 2014 2015 2016
Global polymer sales revenue, USD billion
CAGR (2006 - 2016)5 %
Asia 67%
NAFTA 15%
EU28 13%
GCC 4%
ROW 1%
Global polymer sales revenue by region, 2016Total USD 851 billion
Source: Cefic Chemdata International 20116Note: 2016 is preliminary
13GCC Plastic Industry Indicators 2016

Section 2: GCC global polymermarket share
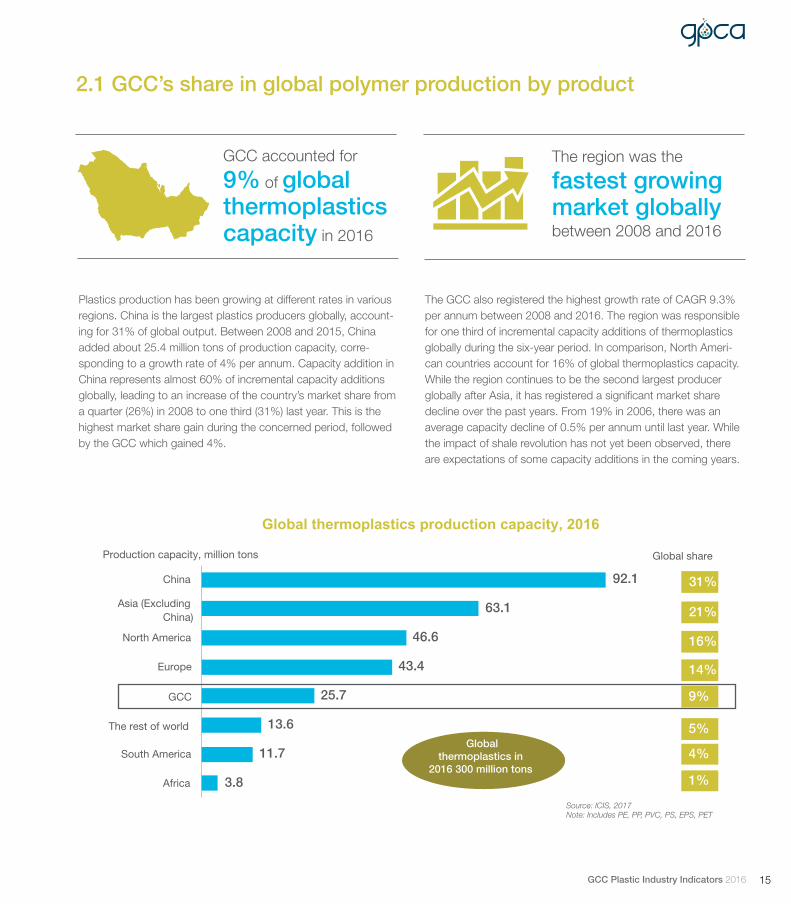
2.1 GCC’s share in global polymer production by product
Plastics production has been growing at different rates in various regions. China is the largest plastics producers globally, account-ing for 31% of global output. Between 2008 and 2015, China added about 25.4 million tons of production capacity, corre-sponding to a growth rate of 4% per annum. Capacity addition in China represents almost 60% of incremental capacity additions globally, leading to an increase of the country’s market share from a quarter (26%) in 2008 to one third (31%) last year. This is the highest market share gain during the concerned period, followed by the GCC which gained 4%.
The GCC also registered the highest growth rate of CAGR 9.3% per annum between 2008 and 2016. The region was responsible for one third of incremental capacity additions of thermoplastics globally during the six-year period. In comparison, North Ameri-can countries account for 16% of global thermoplastics capacity. While the region continues to be the second largest producer globally after Asia, it has registered a significant market share decline over the past years. From 19% in 2006, there was an average capacity decline of 0.5% per annum until last year. While the impact of shale revolution has not yet been observed, there are expectations of some capacity additions in the coming years.
GCC accounted for
9% of global thermoplastics capacity in 2016
The region was the
fastest growing market globally between 2008 and 2016
3.8
11.7
13.6
25.7
43.4
46.6
63.1
92.1
Africa
South America
The rest of world
GCC
Europe
North America
Asia (Excluding China)
China
Global thermoplastics in
2016 300 million tons
31%
Production capacity, million tons Global share
21%
16%
14%
9%
5%
4%
1%
Global thermoplastics production capacity, 2016
Source: ICIS, 2017Note: Includes PE, PP, PVC, PS, EPS, PET
15GCC Plastic Industry Indicators 2016

GCC share globally in 2016
0.3%
1%
2%
5%
9%
10%
10%
16%
17%
EPS
PVC
PS
PET
Thermoplastics
LDPE
PP
HDPE
LLDPE
Source: ICIS, 2017
Polyethylene continues to be the most widely used plastic resin in the world, benefiting from its versatility, easy processability, and recyclability. Asia continues to be the largest and fastest growing polyethylene market, fueled by strong growth in China, which alone accounted for nearly 40% of global output in 2016. North America and Europe are other major producers representing 20% and 16% of global output respectively. Global demand for polyethylene resins rose 2% in 2016 to 103.4 million tons. Gains match overall world economic growth, fueled by an acceleration in consumer spending and manufacturing activity.
HDPE production shifted from conventional centers such as North America and Western Europe to the Middle East and Asia. Between 2008 and 2016, around 40% of incremental HDPE ca-pacity was located in the GCC, followed by China which account-ed for 30%. As a result, GCC’s global market share increased from 9% in 2008 to 16% in 2016. Similarly, China’s share grew from 10% to 15% during the same period.
GCC represents 15% of global polyethylene production capacity, the largest among all polymers
In 2016, production capacity globally for linear low-density poly-ethylene (LLDPE) reached 35.3 million tons, up by 3% from the previous year. While other regions around the world continue to expand, GCC’s share remained similar throughout the years, at 17%. LLDPE output in Asia grew by an average 17% per annum between 2008 and 2016, reaching 15.7 million tons, which ac-counts for 45% of world’s total.
Global low density polyethylene (LDPE) capacity remained unchanged in 2016 at 21.7 million tons, with Asia and Europe ac-counting for a major share of 28-29%, followed by North America with 17%. Most incremental production capacity of LDPE globally came on stream in the GCC, which doubled its share from 5% in 2008 to 10% in 2015.
China and the GCC were the only regions with positive PP market share growth during the past years. Since 2008, China’s share globally has increased from 16% to 27%, and the GCC from 7% to 10% during the same period.
16 GCC Plastic Industry Indicators 2016

Note: Includes HDPE, LDPE, LLDPE Source: ICIS, 2017
China accounted for the majority of incremental polystyrene (PS) capacity since 2008 and currently holds 23% market share glob-ally, up from 16% in 2008. In the GCC, capacity growth was one of the highest in the world. However, the region remains a minor producer with just 2% market share.
Led by rising demand from the packaging industry in developing countries, as well as increasing demand from consumer elec-tronics, global PS demand is expected to grow by an average of 4.5% between now and 2020.
1.5
4.4
6.8
15.6
16.1
16.6
20.6
21.9
Africa
South America
The rest of world
GCC
Europe
China
North America
Asia (Excluding China)
Global PE capacity 103.4 million tons
Production capacity, million tons Global share
21%
20%
16%
16%
15%
7%
4%
1%
Global PE production capacity 2016
1.3
3.1
3.3
7.6
8.6
11.0
18.7
20.2
Africa
South America
The rest of world
GCC
North America
Europe
Asia (Excluding China)
China
Global PP capacity 73.7 million tons
Production capacity, million tons Global share
27%
25%
15%
12%
10%
5%
4%
2%
Global PP production capacity, 2016
17GCC Plastic Industry Indicators 2016
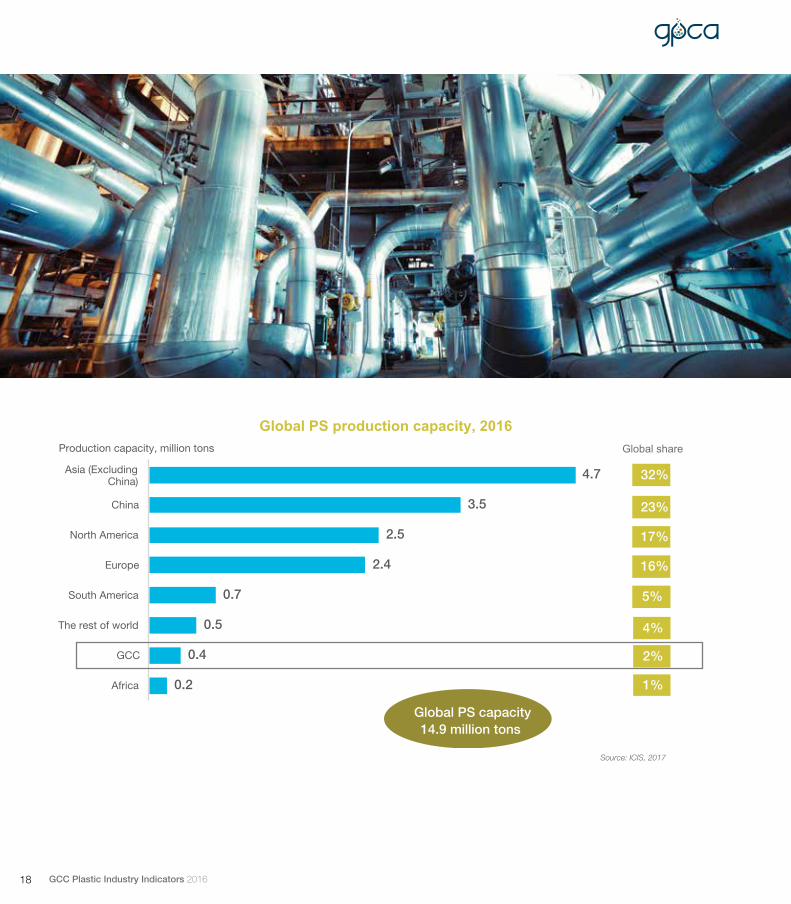
0.2
0.4
0.5
0.7
2.4
2.5
3.5
4.7
Africa
GCC
The rest of world
South America
Europe
North America
China
Asia (Excluding China)
Global PS capacity 14.9 million tons
Production capacity, million tons Global share
32%
23%
17%
16%
5%
4%
2%
1%
Global PS production capacity, 2016
Source: ICIS, 2017
18 GCC Plastic Industry Indicators 2016


Section 3: Employment in GCCpolymer industry
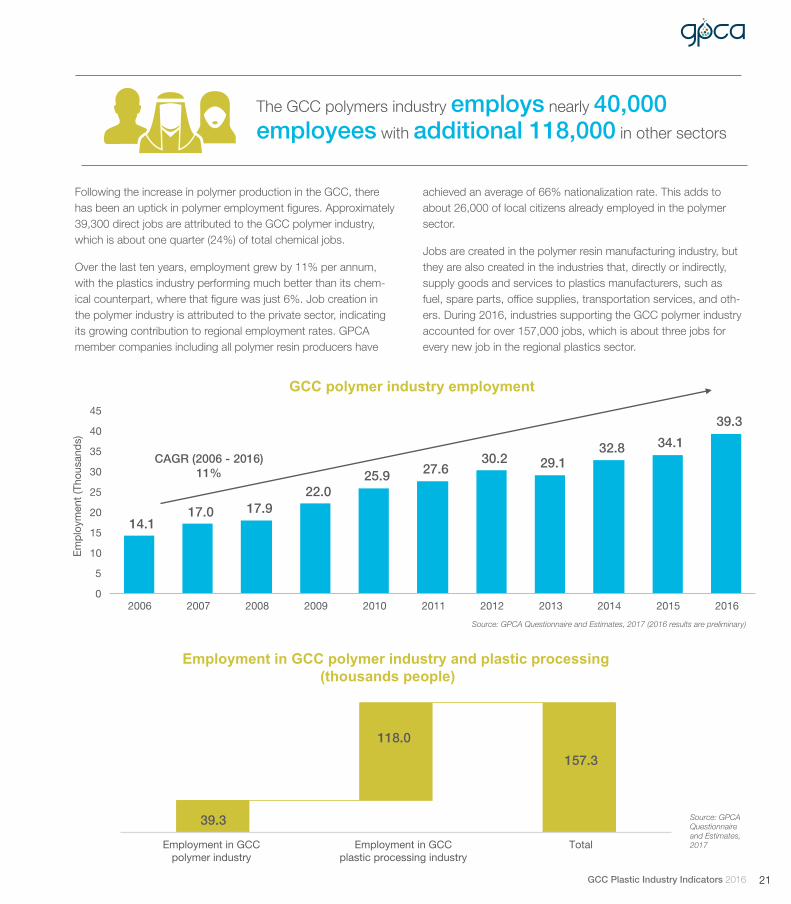
The GCC polymers industry employs nearly 40,000 employees with additional 118,000 in other sectors
Following the increase in polymer production in the GCC, there has been an uptick in polymer employment figures. Approximately 39,300 direct jobs are attributed to the GCC polymer industry, which is about one quarter (24%) of total chemical jobs.
Over the last ten years, employment grew by 11% per annum, with the plastics industry performing much better than its chem-ical counterpart, where that figure was just 6%. Job creation in the polymer industry is attributed to the private sector, indicating its growing contribution to regional employment rates. GPCA member companies including all polymer resin producers have
achieved an average of 66% nationalization rate. This adds to about 26,000 of local citizens already employed in the polymer sector.
Jobs are created in the polymer resin manufacturing industry, but they are also created in the industries that, directly or indirectly, supply goods and services to plastics manufacturers, such as fuel, spare parts, office supplies, transportation services, and oth-ers. During 2016, industries supporting the GCC polymer industry accounted for over 157,000 jobs, which is about three jobs for every new job in the regional plastics sector.
14.1 17.0 17.9
22.0 25.9 27.6
30.2 29.1 32.8 34.1
39.3
0
5
10
15
20
25
30
35
40
45
2006 2007 2008 2009 2010 2011 2012 2013 2014 2015 2016
Em
plo
ymen
t (T
hous
and
s)
GCC polymer industry employment
CAGR (2006 - 2016) 11%
Source: GPCA Questionnaire and Estimates, 2017 (2016 results are preliminary)
Source: GPCA Questionnaire and Estimates, 2017
39.3
118.0
157.3
Employment in GCC polymer industry
Employment in GCC plastic processing industry
Total
Employment in GCC polymer industry and plastic processing(thousands people)
21GCC Plastic Industry Indicators 2016
Section 4: GCC domestic polymer consumption
4.1 Consumption by product
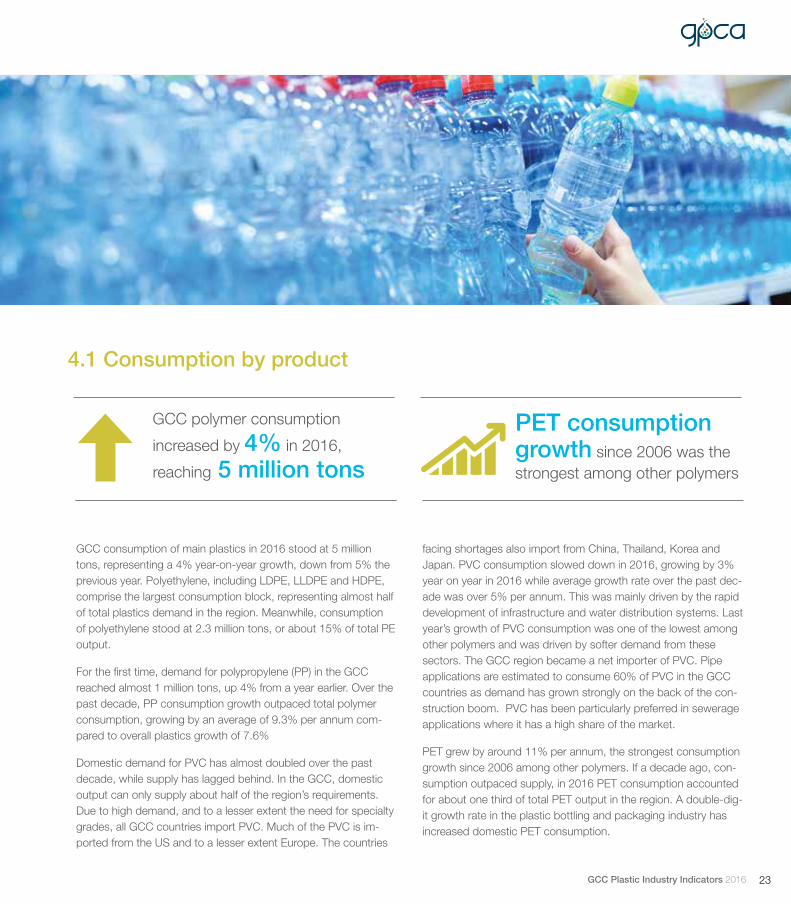
GCC consumption of main plastics in 2016 stood at 5 million tons, representing a 4% year-on-year growth, down from 5% the previous year. Polyethylene, including LDPE, LLDPE and HDPE, comprise the largest consumption block, representing almost half of total plastics demand in the region. Meanwhile, consumption of polyethylene stood at 2.3 million tons, or about 15% of total PE output.
For the first time, demand for polypropylene (PP) in the GCC reached almost 1 million tons, up 4% from a year earlier. Over the past decade, PP consumption growth outpaced total polymer consumption, growing by an average of 9.3% per annum com-pared to overall plastics growth of 7.6%
Domestic demand for PVC has almost doubled over the past decade, while supply has lagged behind. In the GCC, domestic output can only supply about half of the region’s requirements. Due to high demand, and to a lesser extent the need for specialty grades, all GCC countries import PVC. Much of the PVC is im-ported from the US and to a lesser extent Europe. The countries
facing shortages also import from China, Thailand, Korea and Japan. PVC consumption slowed down in 2016, growing by 3% year on year in 2016 while average growth rate over the past dec-ade was over 5% per annum. This was mainly driven by the rapid development of infrastructure and water distribution systems. Last year’s growth of PVC consumption was one of the lowest among other polymers and was driven by softer demand from these sectors. The GCC region became a net importer of PVC. Pipe applications are estimated to consume 60% of PVC in the GCC countries as demand has grown strongly on the back of the con-struction boom. PVC has been particularly preferred in sewerage applications where it has a high share of the market.
PET grew by around 11% per annum, the strongest consumption growth since 2006 among other polymers. If a decade ago, con-sumption outpaced supply, in 2016 PET consumption accounted for about one third of total PET output in the region. A double-dig-it growth rate in the plastic bottling and packaging industry has increased domestic PET consumption.
GCC polymer consumption
increased by 4% in 2016,
reaching 5 million tons
PET consumption growth since 2006 was the strongest among other polymers
23GCC Plastic Industry Indicators 2016

LDPE and LLDPE
HDPE
Milk bottles,toys
Flower pot, car bumpers
Window frames,boots
Bottles
Sponge, eye glasses frames
Food packaging,plastic cups
Reusable bags,�lm for food packaging
25%
21% PP
20%
PVC 17%
PET
11%
PS 5%
EPS 1%
GCC polymer consumption, million tons (2006 - 2016)
2.4 2.9 3.2 3.3 3.6 3.9 4.2 4.4 4.6 4.8 5.0
2006 2007 2008 2009 2010 2011 2012 2013 2014 2015 2016
CAGR (2006 - 2016) 7.6 %
Source: IHS, 2017
24 GCC Plastic Industry Indicators 2016
4.2 Polymers consumption by volume and country
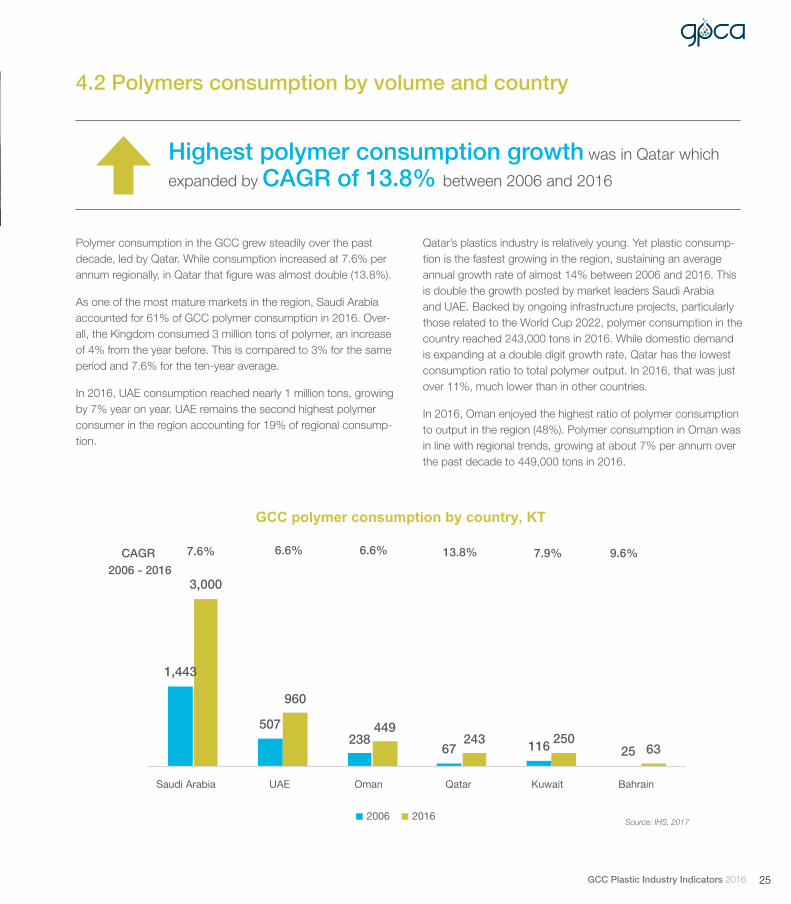
Polymer consumption in the GCC grew steadily over the past decade, led by Qatar. While consumption increased at 7.6% per annum regionally, in Qatar that figure was almost double (13.8%).
As one of the most mature markets in the region, Saudi Arabia accounted for 61% of GCC polymer consumption in 2016. Over-all, the Kingdom consumed 3 million tons of polymer, an increase of 4% from the year before. This is compared to 3% for the same period and 7.6% for the ten-year average.
In 2016, UAE consumption reached nearly 1 million tons, growing by 7% year on year. UAE remains the second highest polymer consumer in the region accounting for 19% of regional consump-tion.
Highest polymer consumption growth was in Qatar which
expanded by CAGR of 13.8% between 2006 and 2016
Qatar’s plastics industry is relatively young. Yet plastic consump-tion is the fastest growing in the region, sustaining an average annual growth rate of almost 14% between 2006 and 2016. This is double the growth posted by market leaders Saudi Arabia and UAE. Backed by ongoing infrastructure projects, particularly those related to the World Cup 2022, polymer consumption in the country reached 243,000 tons in 2016. While domestic demand is expanding at a double digit growth rate, Qatar has the lowest consumption ratio to total polymer output. In 2016, that was just over 11%, much lower than in other countries.
In 2016, Oman enjoyed the highest ratio of polymer consumption to output in the region (48%). Polymer consumption in Oman was in line with regional trends, growing at about 7% per annum over the past decade to 449,000 tons in 2016.
GCC polymer consumption by country, KT
2006 2016
1,443
507 238
67 116 25
3,000
960
449 243 250
63
Saudi Arabia UAE Oman Qatar Kuwait Bahrain
7.6% 6.6% 6.6% 13.8% 7.9% 9.6% CAGR 2006 - 2016
Source: IHS, 2017
25GCC Plastic Industry Indicators 2016

Saudi Arabia 61%
UAE 19%
Oman 9%
Qatar 5%
Kuwait 5%
Bahrain 1%
2016 5 million
tons
Saudi Arabia 60%
UAE 21%
Oman
10%
Qatar 3%
Kuwait 5%
Bahrain 1%
2006 2.4 million
tons
Bahrain
Qatar
UAE
Oman
Kuwait
Saudi Arabia
3,000 KT449 KT
960 KT
243 KT
63 KT
250 KT
Source: IHS, 2017
GCC polymer consumption by country
26 GCC Plastic Industry Indicators 2016
4.3 Consumption per capita
Global plastic consumption has roughly tripled over the past 20 years. In the GCC, plastic consumption increased by about 50% in the past decade, from 64 kg per capita in 2006 to 94 kg in 2016. This growth is driven by an increase of disposable income and urbanization which creates strong demand for packaging, healthcare and other sectors.
Plastic consumption in Qatar, UAE and Oman have exceeded 100 kg per person. While this is considerably high, it is still far behind developed nations such as the US, where plastic consumption is about 170 kg per capita, and Western Europe with about 140 kg per capita.
Plastics consumption per capita shows an upward trend over the past decade in all GCC countries, mainly owing to the develop-ment of new products and material substitution in established markets. In many cases, plastics have become the material of choice, displacing metals, paper, leather, glass, and wood in a range of common products. In Saudi Arabia, which is the largest
country in the GCC, plastic consumption increased from about 57 kg in 2006 to 95 kg per capita in 2016. This corresponds to about 5% per annum and is higher than the GCC overall growth of 4%.
Interestingly, Bahrain registered the lowest plastic consumption per capita of about 45 kg. At the same time the consumption growth over the past decade was the highest among other countries at 6% per annum. Should the consumption continue at its current rate, it will reach the GCC’s average within the next ten years.
The UAE is one of the highest plastic consumers in the GCC with close to 105 kg of plastic consumption per capita. Yet growth has been quite low compared to other countries in the region, at just 1% per annum between 2006 and 2016. If growth remains at the same levels over the next ten years, UAE plastic consumption will lag behind the GCC average.
Plastic consumption in the GCC increased
rapidly reaching 94 kg per capita in 2016
Saudi Arabia which
represents about 60% of total GCC population, consumed 95 kg per person, higher than GCC overall
Qatar has the highest plastic consumption per capita
of almost 109 kg per person
GCC plastic consumption grew by
4% per annum during the past decade
27GCC Plastic Industry Indicators 2016

45.5
64.2
94.2
95.1
100.0
104.9
108.8
Bahrain
Kuwait
GCC
Saudi
Arabia
Oman
UAE
Qatar
Consumption per capita (KG)
GCC plastic consumption per capita in 2016
1
1
3
4
5
5
6
UAE
Oman
Kuwait
GCC
Qatar
Saudi Arabia
Bahrain
GCC plastic consumption per capita growth CAGR (2006 - 2016)
Source: GPCA analysis
28 GCC Plastic Industry Indicators 2016

4.4 Consumption by end user industry segment
In the GCC, by far the greatest proportion of polymer consump-tion in terms of volume is taken by packaging and construction, with market shares of 44% and 26% respectively. The packaging market is the largest consumer of polymers in the GCC due to their flexibility, lightweight and ease of processing. The industry continues to represent the largest end user segment for polymer consumption in the region. However, demand growth of just 6% per annum over the past decade was the lowest compared to other segments.
With 1.2 million tons of polymer consumed in 2016, the GCC construction industry is the second largest end user segment in
the region, and currently accounts for 26% of regional consump-tion. The main polymers used by the construction sector are PVS, EPS and PU across a number of key applications including insulation, piping, windows and doors.
Industrial packaging demand for polymers has doubled in the past decade, from 260,000 tons of polymer in 2006 to 650,000 tons in 2016. This was the highest growth among all end user sectors in the GCC. While it is considered a standalone end user segment, packaging is tightly linked to the industries it serves including chemicals, lubricants, bulk food and beverage as well as building and construction.
Consumer packaging and construction accounts for the majority of polymer consumption in the GCC
Industrial packaging is the fastest growing end user market for polymers in the region
GCC polymer consumption by end user
Consumer packaging 44%
Construction26%
Industrial packaging13%
Textiles 6%
Consumer goods 6%
Agriculture3%
Automotive/Appliances 2%
20165 million
tons
Source: IHS, 2017
29GCC Plastic Industry Indicators 2016
Section 5: GCC polymer export

On the back of rising polymer output in 2016, GCC polymer exports continue to grow. In 2016, shipments from the region jumped 9% year on year, reaching 21.8 million tons valued at USD 25.3 billion. This is an increase from the last few years, when exports grew slowly at a rate of just 5% per annum. GCC polymer exports are directly influenced by the supply and demand balance in main export markets.
Regional industrial powerhouse Saudi Arabia remains the biggest GCC exporter of polymers. The Kingdom claims 67% of total
The GCC polymer export
reached 21.8 million tons in 2016 valued at about
USD 25.3 billion
Saudi Arabia accounted
for major share of 67% of polymer exports in 2016, while UAE registered fastest growth over the past decade
5.1 Export by country
regional polymer exports and earns over USD 16 billion in export revenue. Last year polymer manufactures increased again by about 10% while exports rose by 9%.
UAE is the second largest producer and exporter of polymers in the GCC with market share of 18-19%. UAE polymer exports were the highest in volume among all GCC states, generating over USD 5 billion in revenue. At 22%, its annual growth between 2006 and 2016 was double the regional average.
7.6 8.3 8.1 10.8
14.3 14.8
18.0 19.1 19.9 20.0
21.8
7.6 9.1 10.0 10.7
16.8 20.2
23.7 25.7
27.9
23.2 25.3
0
5
10
15
20
25
30
0
5
10
15
20
25
2006 2007 2008 2009 2010 2011 2012 2013 2014 2015 2016
US
D b
illio
n
Mill
ion
Tons
GCC polymer export (million tons and USD billion)
Volume of export Value of export
Source: United Nations, GPCA analysis, 2017Note: 2016 is preliminary
31GCC Plastic Industry Indicators 2016
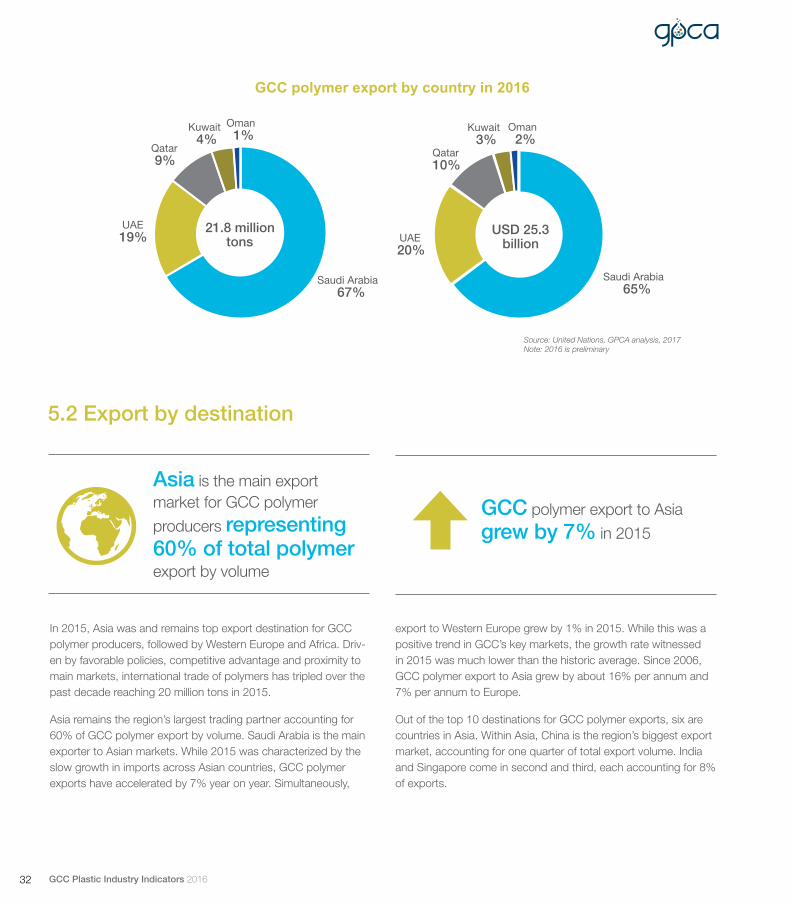
Saudi Arabia 67%
UAE 19%
Qatar 9%
Kuwait 4%
Oman 1%
21.8 million tons
Saudi Arabia 65%
UAE 20%
Qatar 10%
Kuwait 3%
Oman 2%
USD 25.3 billion
GCC polymer export by country in 2016
Source: United Nations, GPCA analysis, 2017Note: 2016 is preliminary
In 2015, Asia was and remains top export destination for GCC polymer producers, followed by Western Europe and Africa. Driv-en by favorable policies, competitive advantage and proximity to main markets, international trade of polymers has tripled over the past decade reaching 20 million tons in 2015.
Asia remains the region’s largest trading partner accounting for 60% of GCC polymer export by volume. Saudi Arabia is the main exporter to Asian markets. While 2015 was characterized by the slow growth in imports across Asian countries, GCC polymer exports have accelerated by 7% year on year. Simultaneously,
Asia is the main export market for GCC polymer
producers representing 60% of total polymer export by volume
GCC polymer export to Asia
grew by 7% in 2015
5.2 Export by destination
export to Western Europe grew by 1% in 2015. While this was a positive trend in GCC’s key markets, the growth rate witnessed in 2015 was much lower than the historic average. Since 2006, GCC polymer export to Asia grew by about 16% per annum and 7% per annum to Europe.
Out of the top 10 destinations for GCC polymer exports, six are countries in Asia. Within Asia, China is the region’s biggest export market, accounting for one quarter of total export volume. India and Singapore come in second and third, each accounting for 8% of exports.
32 GCC Plastic Industry Indicators 2016

Source: United Nations, GPCA analysis, 2017
China 24%
India 8%
Singapore 8%
Turkey 6% Vietnam
5%
Malaysia 5%
Belgium 4%
Pakistan 3%
Egypt 2%
Italy 2%
Others 33%
GCC polymer export in 2015Top 10 destinations
Asia
60%
Western Europe
17%
Africa
11%
GCC
7%
Central and Eastern Europe
2% Rest of the world
3%
GCC polymer export by region2015 total 20 million tons
33GCC Plastic Industry Indicators 2016
Section 6: Polymers capacityexpansion

The GCC polymer industry is expected to grow at a CAGR of 3% between 2016 and 2022. Over this period, Saudi Arabia accounts for a solid share of 39% of total incremental growth in polymer output, remaining the largest producer in the region. The King-dom is leading the region in developing engineering polymers pro-duction. More than 70% of engineering polymers output, which is expected to come on stream in the region by 2022, is planned in Saudi Arabia. Within the next five years, output of PET will more than double reaching 1.6 million tons by 2022. This increase will support the downstream conversion industry in Saudi Arabia and will be used in the production of sheet and films for the packaging of food and consumer goods.
While Saudi Arabia is expected to remain the leading polymer producer in the region, Kuwait is set to move from a minor
5.2 Export by destination
producer with 3% market share to a mid-sized player account-ing for 9% of total regional output by 2022. Over this period, the polymer industry in Kuwait will grow by 22% per annum, reaching 3.2 million tons. While the growth is significant, polymer capacity additions will take place only within the commodities.
Oman is another growth market for polymers in the GCC, ac-counting for 20% of total incremental growth. Similarly to Kuwait, Oman is expected to become a mid-size producer in the region with 7% market share by 2022. Along with Liwa Plastics project, Oman plans to increase its production capacity of engineering polymers. PET production will double reaching 1.1 million tons in the next five years. Locally produced PET will be used to produce packaging bottles for soft drinks and beverages and will replace import along with raw materials sourced locally.
GCC polymer industry is projected to reach 34.5 million tons by 2022, supporting further downstream development
The industry sees the
shift to liquid feed-stock cracking as an op-portunity to differentiate its product portfolio
27.1 29.0 29.0 30.6 31.5 32.2 34.5
2016 2017 2018 2019 2020 2021 2022
Saudi Arabia 38%
Kuwait 30%
Oman 22%
UAE 10%
GCC polymers production capacity expansion (2016 - 2022)
Incremental polymer production capacity by country (2016 - 2022) Total 7.4 million tons
Source: Gulf Petrochemicals and Chemicals Association, 2017
35GCC Plastic Industry Indicators 2016

18.2
Saudi Arabia
2016 (Million Tons)
2022 (Million Tons)
Kuwait
Qatar
UAE
Oman
21
1.0
3.2
2.2 2.2
0.92.5
4.7 5.5
Source: Gulf Petrochemicals and Chemicals Association, 2017
Following the rapid development of the GCC polymer industry, petrochemical producers started diversifying their portfolios, investing in new products and moving away from traditional com-modity polymers towards engineering plastics. Going forward, it will be the synthetic rubbers segment which will drive product diversification in the GCC. The strong emergence of synthetic rubbers in the global rubber market can be chiefly attributed to several interconnected factors. The fast growing transport sector in the Middle East and Asia are creating strong demand for synthetic rubber products. Automotive and tire sectors are key markets for synthetic rubber. Additionally, construction sector generates significant demand of synthetic rubber in many end use
6.2 Expansion by product
By 2022, nearly 70% of all incremental supply growth will come
from commodity polymers
Synthetic rubbers will
see the biggest number of products introduced
applications such as paving and roads, adhesives and sealants. It is also very useful to the food industry with several uses such as labelling, packaging, and more. Synthetic rubbers are also a material of choice for appliances, footwear, personal care, medical applications and others.
All of these trends combined have a huge significance for the re-gion. GCC countries rely heavily on imported synthetic rubbers for the extrusion and molding of rubber products. With an increased domestic synthetic rubber production, not only import substitution will be made possible but also vehicle and components manu-factures that can utilize materials made locally can be attracted to the region.
36 GCC Plastic Industry Indicators 2016

Source: Gulf Petrochemicals and Chemicals Association, 2017
27.1
5.0
1.8 0.4
34.5
GCC polymer capacity (2016)
Polyole�ns Engineering plastics Synthetic rubber GCC polymer capacity (2022)
GCC polymer industry expansion (2016 - 2022), million tons
1
9
7
5 5
11
9
6
4
3 2
1
0
1
2
3
4
0
2
4
6
8
10
12
Synthetic rubber Polyole�ns Engineering and performance polymers
Thermoset
2016 2022 Increment
Total new products 9
Number of polymer products by type
37GCC Plastic Industry Indicators 2016
6.3 New project developments in the GCC
Sadara Chemical, Saudi Arabia: Sadara has started operat-ing its mixed-feed cracker at the joint venture’s petrochemical complex in Jubail during 2016. As well as producing solution polyethylene, LLDPE and propylene, Sadara brings new technolo-gies and other first-time processes to the region in a large, highly integrated manufacturing complex that is the largest ever built in the world in a single phase.
Petro-Rabigh Phase 2, Saudi Arabia: The project has almost been completed and is expected to come on stream in 2017. The Rabigh phase II expansion is aimed at diversifying the portfolio of chemicals made at the site, bringing on production of ethylene propylene rubber (EPR), thermoplastic polyolefin (TPO), methyl methacrylate (MMA), polymethyl methacrylate (PMMA), low den-sity polyethylene/ethylene vinyl acetate (LDPE/EVA), paraxylene/benzene, cumene and phenol/acetone.
Al Jubail Petrochemical Company (KEMYA) Elastomer Plant, Saudi Arabia: The plant started commercial operations at 100,000 tpa of polybutadiene rubber and 50,000 tpa carbon black plants in 2016. Production capacity at the plants will reach 400,000 tpa of rubber including halobutyl, styrene butadiene, polybutadiene, and ethylene propylene diene monomer (EPDM) rubbers, thermoplastic specialty polymers, and carbon black.
Al Zour dehydrogenation (PDH) and polypropylene (PP) Plant, Kuwait: Following feasibility studies into projects that would be built downstream from Kuwait’s Al Zour refinery, developers de-cided to build propane dehydrogenation (PDH) and polypropylene (PP) production facilities as well as its second aromatics complex. PDH plant will be designed to produce 650,000 tpa of propylene while the PP unit will have capacity for 940,000 tpa. The Al Zour petrochemical projects, including the FCC and PDH units, PP and aromatics plants, are planned on stream in 2022.
Liwa Plastics Industries Complex, Oman: LPIC is expected to be the largest downstream projects in Oman making Orpic an internationally recognized player in the polymers markets. With a capacity of 800,000 tons per annum of ethylene, this mixed cracker will produce 300,000 tpa of high density polyethylene (HDPE), 500,000 tpa of linear low density polyethylene (LLDPE), 215,000 tpa of polypropylene. While no new products are going to be introduced with this project, it carries strategic importance for Oman in transforming society and developing the Sultanate’s downstream industrial capabilities.
Overseas polymer project developments
Newpropane dehydrogenation (PDH) Plant, South Korea: In 2016, Advanced Petrochemical started commercial operations at its 600,000 tpa new propane dehydrogenation (PDH) plant in Ulsan, South Korea. The plant is operated by a JV between Ad-vanced Petrochemical and SK Gas and Petrochemical Industries Co. (PIC).
Polypropylene Plant, Canada: Pembina Pipeline and Kuwait’s Petrochemical Industries Company are undertaking a feasibility study for a world-scale integrated polypropylene facility in Alberta, Canada. The final investment decision is expected in the middle of 2017, and if approved, the project is expected to be in service by 2020. The facility could be capable of processing approximate-ly 35,000 barrels per day (bpd) of propane and produce up to 800,000 metric tons per year of polypropylene.
6.4 GCC polymer conversion industry
The GCC plastic conversion industry was created out of the need to meet local demand, substitute imports, create local jobs and build foundation for industrial infrastructure and manufacturing industries. Huge investments in the plastic conversion industry in the GCC took place during 2000s with new capacity coming on stream. Over the past decade, GCC has grown at a CAGR of 7.6%. In 2016, regional converters consumed about 5 million tons of plastics. Some 61% of the volume processed was in Saudi Arabia, followed by the UAE which accounts for 19%. Compared with polymer resin production, polymer consumption represents only one fifth of the resins volume.
To promote the development of downstream industries in the region, GCC countries invest significantly in the development of industrial conversion parks. Chemical parks, where producers share a location, become vertically integrated with other compa-nies, share infrastructure, services and facilities, is a winning mod-el around the globe. Only a few years ago, the plastic conversion industry in Saudi Arabia was concentrated across industrial parks. Similarly, in the UAE there are industrial sites in Dubai and Sharjah where the majority of plastic converters are located. Currently, a number of industrial parks focused on polymer conversion and multi industry are under development in the region, and some are being built next to big resin production facilities
38 GCC Plastic Industry Indicators 2016
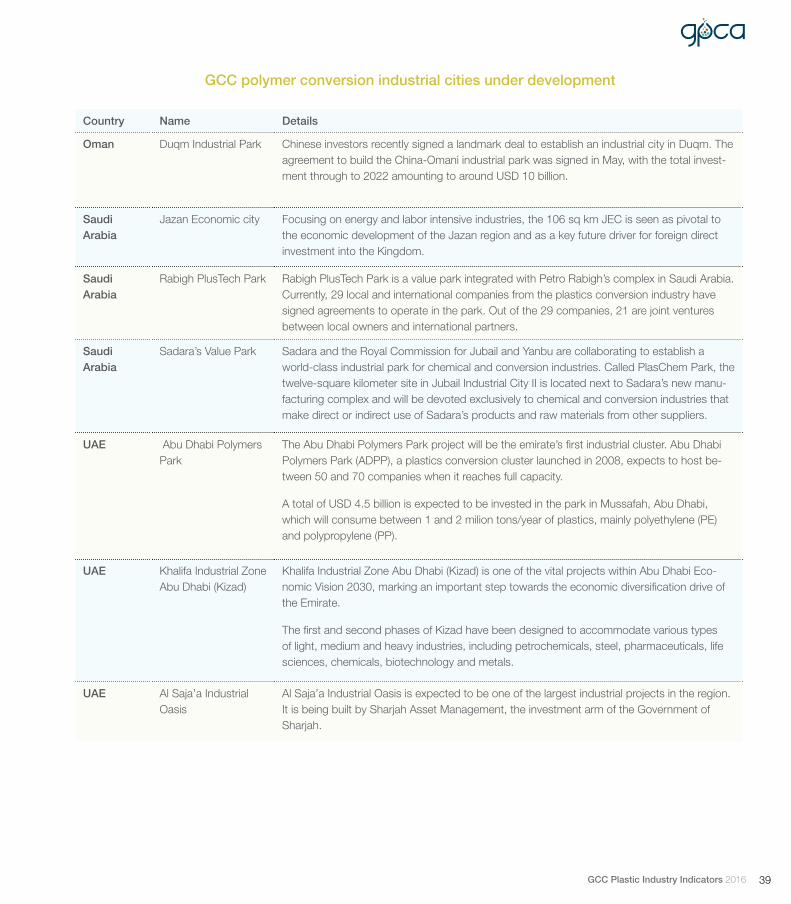
GCC polymer conversion industrial cities under development
Country Name Details
Oman Duqm Industrial Park Chinese investors recently signed a landmark deal to establish an industrial city in Duqm. The agreement to build the China-Omani industrial park was signed in May, with the total invest-ment through to 2022 amounting to around USD 10 billion.
Saudi Arabia
Jazan Economic city Focusing on energy and labor intensive industries, the 106 sq km JEC is seen as pivotal to the economic development of the Jazan region and as a key future driver for foreign direct investment into the Kingdom.
Saudi Arabia
Rabigh PlusTech Park Rabigh PlusTech Park is a value park integrated with Petro Rabigh’s complex in Saudi Arabia. Currently, 29 local and international companies from the plastics conversion industry have signed agreements to operate in the park. Out of the 29 companies, 21 are joint ventures between local owners and international partners.
Saudi Arabia
Sadara’s Value Park Sadara and the Royal Commission for Jubail and Yanbu are collaborating to establish a world-class industrial park for chemical and conversion industries. Called PlasChem Park, the twelve-square kilometer site in Jubail Industrial City II is located next to Sadara’s new manu-facturing complex and will be devoted exclusively to chemical and conversion industries that make direct or indirect use of Sadara’s products and raw materials from other suppliers.
UAE Abu Dhabi Polymers Park
The Abu Dhabi Polymers Park project will be the emirate’s first industrial cluster. Abu Dhabi Polymers Park (ADPP), a plastics conversion cluster launched in 2008, expects to host be-tween 50 and 70 companies when it reaches full capacity.
A total of USD 4.5 billion is expected to be invested in the park in Mussafah, Abu Dhabi, which will consume between 1 and 2 milion tons/year of plastics, mainly polyethylene (PE) and polypropylene (PP).
UAE Khalifa Industrial Zone Abu Dhabi (Kizad)
Khalifa Industrial Zone Abu Dhabi (Kizad) is one of the vital projects within Abu Dhabi Eco-nomic Vision 2030, marking an important step towards the economic diversification drive of the Emirate.
The first and second phases of Kizad have been designed to accommodate various types of light, medium and heavy industries, including petrochemicals, steel, pharmaceuticals, life sciences, chemicals, biotechnology and metals.
UAE Al Saja’a Industrial Oasis
Al Saja’a Industrial Oasis is expected to be one of the largest industrial projects in the region. It is being built by Sharjah Asset Management, the investment arm of the Government of Sharjah.
39GCC Plastic Industry Indicators 2016

Section 7: GCC plasticrecycling

Gross urban waste generation quantity from GCC countries has crossed 70 million tons per annum. This volume is expected to double by 2025. Nearly 90% of total volume of solid waste gen-erated in the GCC is in Saudi Arabia, Kuwait and the UAE. Kuwait has the highest rate of solid waste per capita, about 5.7 kg per day. This is about four times higher than in Saudi Arabia where the same figure is 1.3 kg. Per capita solid waste generation in the UAE ranges between 1.76 to 2.3 kg/day. Qatar’s waste genera-tion is similar to Saudi Arabia at 1.3 kg per capita per day.
Economic expansion, urbanization and population growth goes hand in hand with increased waste generation. Waste compo-sition is influenced by many factors, such as level of economic development, cultural norms, geographical location, energy sources, and climate. Composition of solid waste in the GCC and in the world in general differs slightly. Globally, about 10% of solid waste generated is plastics. In the GCC this is almost twice as high, at about 18%. The largest share of plastics in total waste is reported by Oman and Kuwait with more than 20%. In terms of absolute volume, GCC plastic waste generated reached about 13 million tons per year. This is almost triple of the polymer volume consumed by polymer processors and contains plastics which are wasted as a result of use imported goods.
GCC governments are increasingly concerned with the problems faced by waste management and recycling authorities. Based on the currently available statistics, only 11% of total waste in the UAE is being recycled; similar figure is in Kuwait. Saudi Arabia reported about industrial waste recycling in Jubail Industrial City which represented 1% of total waste collected in the country in 2015. Similarly, in Qatar the total volume of recycled waste represents only 1% of total solid waste generated. Taking those recycling shares, the total volume of plastic recycled in the GCC is about 1.2 million tons and represents 9% of the total plastic waste generated in a year.
Compared to global recycling rates, the GCC is lagging behind many countries. However, it is certainly not the worst globally. Many countries are shining examples of recycling success such as Germany where 65% of all municipal waste is recycled or composed. The US is struggling to make progress and currently recycles only 35% of total municipal waste. Some of the countries with performance lower than the GCC are Mexico, Turkey and Chile.
Plastic represents about 18% of total solid waste generated in the GCC and only
about 9% of plastic waste is recycled
UAE, Oman and Kuwait have the highest recycling rates in the GCC,
at 11%
0.7
1.1
1.3
1.3
1.7
2.0
5.7
Oman
Bahrain
Saudi Arabia
Qatar
UAE
GCC
Kuwait
Solid waste generationPer capita (kg per capita per day)
Source: World Bank
41GCC Plastic Industry Indicators 2016
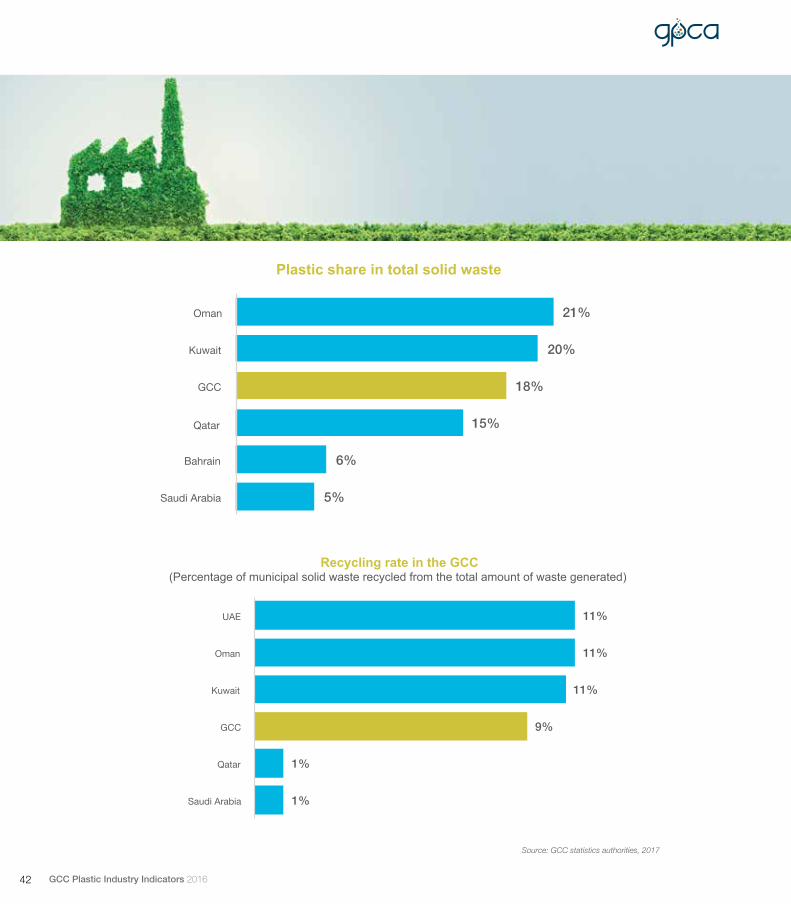
5%
6%
15%
18%
20%
21%
Saudi Arabia
Bahrain
Qatar
GCC
Kuwait
Oman
Plastic share in total solid waste
1%
1%
9%
11%
11%
11%
Saudi Arabia
Qatar
GCC
Kuwait
Oman
UAE
Recycling rate in the GCC(Percentage of municipal solid waste recycled from the total amount of waste generated)
Source: GCC statistics authorities, 2017
42 GCC Plastic Industry Indicators 2016
Share of recycled waste in total municipal waste in OECD countries
The Gulf Petrochemicals and Chemicals Association (GPCA) represents the downstream hydrocarbon industry in the Arabian Gulf. Established in 2006, the association voices the common interests of more than 250 member companies from the chemical and allied industries, accounting for over 95% of chemical output in the Gulf region. The industry makes up the second largest manufacturing sector in the region, producing up to US$108 billion’s worth of products a year.
The association supports the region’s petrochemical and chemical industry through advocacy, networking and thought leadership initiatives that help member companies to connect, to share and advance knowledge, to contribute to international dialogue, and to become prime influencers in shaping the future of the global petrochemicals industry.
Committed to providing a regional platform for stakeholders from across the industry, the GPCA manages six working committees - Plastics, Supply Chain, Fertilizers, International Trade, Research and Innovation and Responsible Care - and organizes six world-class events each year. The association also publishes an annual report, regular newsletters and reports.
For more information, please visit www.gpca.org.ae
Gulf Petrochemicals & Chemicals Association (GPCA) PO Box 123055 1601, 1602Vision Tower, Business BayDubai, United Arab Emirates T +971 4 451 0666F +971 4 451 0777Email: [email protected]

![REPORT - home - pubs.iied.org.Mine, which was capable of producing about 5 million tones of copper ore per annum, was producing about 2 million tonnes per annum [Mining Report; 1990].](https://static.documents.pub/doc/80x56/5f798c5f2f947123d229de61/report-home-pubsiiedorg-mine-which-was-capable-of-producing-about-5-million.jpg)


