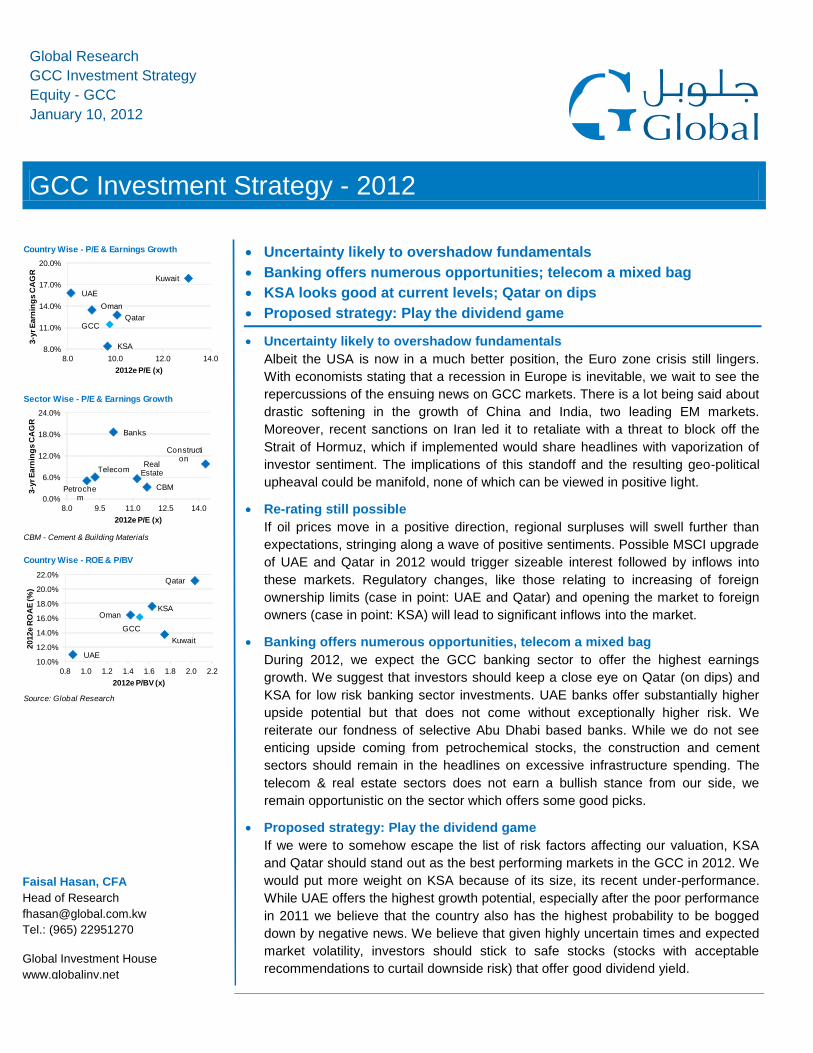
Global Research GCC Investment Strategy Equity - GCC January 10, 2012 GCC Investment Strategy - 2012 Faisal Hasan, CFA Head of Research [email protected]Tel.: (965) 22951270 Global Investment House www.globalinv.net Country Wise - P/E & Earnings Growth Sector Wise - P/E & Earnings Growth CBM - Cement & Building Materials Country Wise - ROE & P/BV Source: Global Research UAE Kuwait Oman Qatar KSA GCC 8.0% 11.0% 14.0% 17.0% 20.0% 8.0 10.0 12.0 14.0 3-yr Earnings CAGR 2012e P/E (x) UAE Kuwait Oman Qatar KSA GCC 10.0% 12.0% 14.0% 16.0% 18.0% 20.0% 22.0% 0.8 1.0 1.2 1.4 1.6 1.8 2.0 2.2 2012e ROAE (%) 2012e P/BV (x) Banks Telecom Petroche m Real Estate Constructi on CBM 0.0% 6.0% 12.0% 18.0% 24.0% 8.0 9.5 11.0 12.5 14.0 3-yr Earnings CAGR 2012e P/E (x) Uncertainty likely to overshadow fundamentals Banking offers numerous opportunities; telecom a mixed bag KSA looks good at current levels; Qatar on dips Proposed strategy: Play the dividend game Uncertainty likely to overshadow fundamentals Albeit the USA is now in a much better position, the Euro zone crisis still lingers. With economists stating that a recession in Europe is inevitable, we wait to see the repercussions of the ensuing news on GCC markets. There is a lot being said about drastic softening in the growth of China and India, two leading EM markets. Moreover, recent sanctions on Iran led it to retaliate with a threat to block off the Strait of Hormuz, which if implemented would share headlines with vaporization of investor sentiment. The implications of this standoff and the resulting geo-political upheaval could be manifold, none of which can be viewed in positive light. Re-rating still possible If oil prices move in a positive direction, regional surpluses will swell further than expectations, stringing along a wave of positive sentiments. Possible MSCI upgrade of UAE and Qatar in 2012 would trigger sizeable interest followed by inflows into these markets. Regulatory changes, like those relating to increasing of foreign ownership limits (case in point: UAE and Qatar) and opening the market to foreign owners (case in point: KSA) will lead to significant inflows into the market. Banking offers numerous opportunities, telecom a mixed bag During 2012, we expect the GCC banking sector to offer the highest earnings growth. We suggest that investors should keep a close eye on Qatar (on dips) and KSA for low risk banking sector investments. UAE banks offer substantially higher upside potential but that does not come without exceptionally higher risk. We reiterate our fondness of selective Abu Dhabi based banks. While we do not see enticing upside coming from petrochemical stocks, the construction and cement sectors should remain in the headlines on excessive infrastructure spending. The telecom & real estate sectors does not earn a bullish stance from our side, we remain opportunistic on the sector which offers some good picks. Proposed strategy: Play the dividend game If we were to somehow escape the list of risk factors affecting our valuation, KSA and Qatar should stand out as the best performing markets in the GCC in 2012. We would put more weight on KSA because of its size, its recent under-performance. While UAE offers the highest growth potential, especially after the poor performance in 2011 we believe that the country also has the highest probability to be bogged down by negative news. We believe that given highly uncertain times and expected market volatility, investors should stick to safe stocks (stocks with acceptable recommendations to curtail downside risk) that offer good dividend yield.
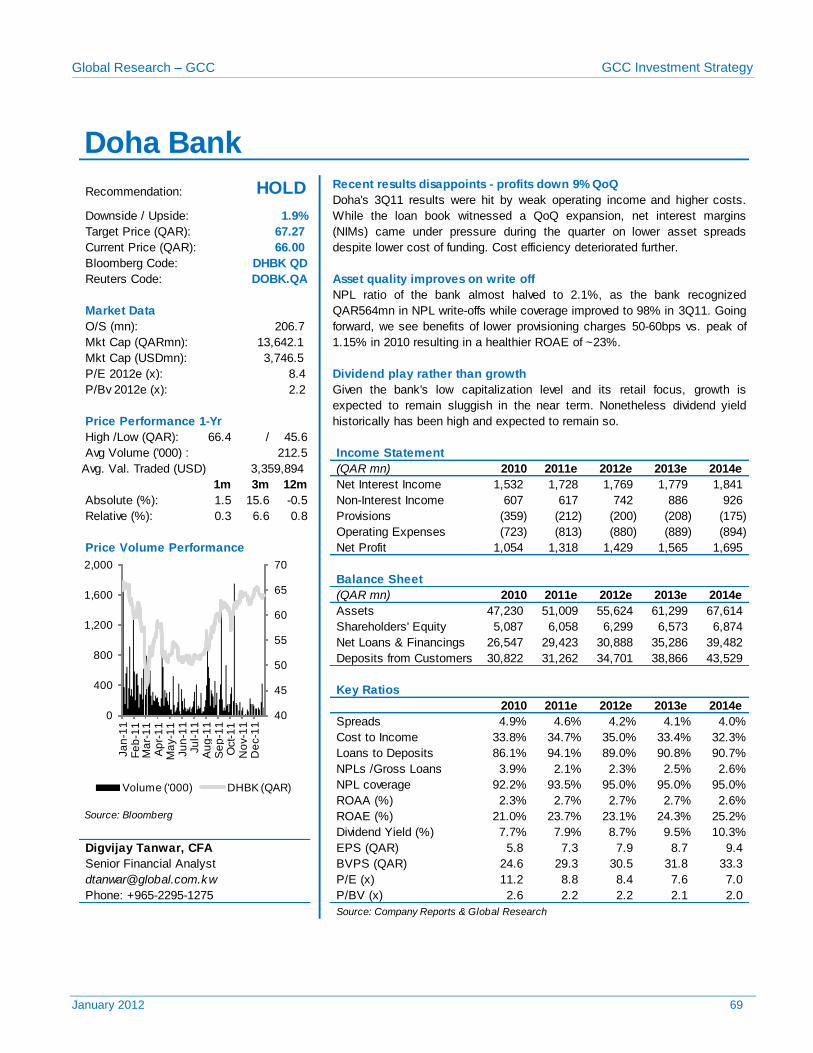
Doha Bank DHBK QD 3,746.8 1.5% 15.6% -0.5% 9.5 2.2 23.1% 2.9% 6.91 66.00 67.27 1.9% HOLD
Al Rayan Bank MARK QD 5,736.7 3.9% 15.3% 44.3% 14.3 2.5 18.1% 3.4% 1.94 27.85 27.24 -2.2% HOLD
Qatar National Cement Company QNCD QD 1,529.3 4.4% 5.0% 3.5% 12.4 2.3 19.2% 16.8% 9.12 113.40 125.40 10.6% BUY
Total 10.06 2.03 21.2% 4.6%
Saudi Arabia
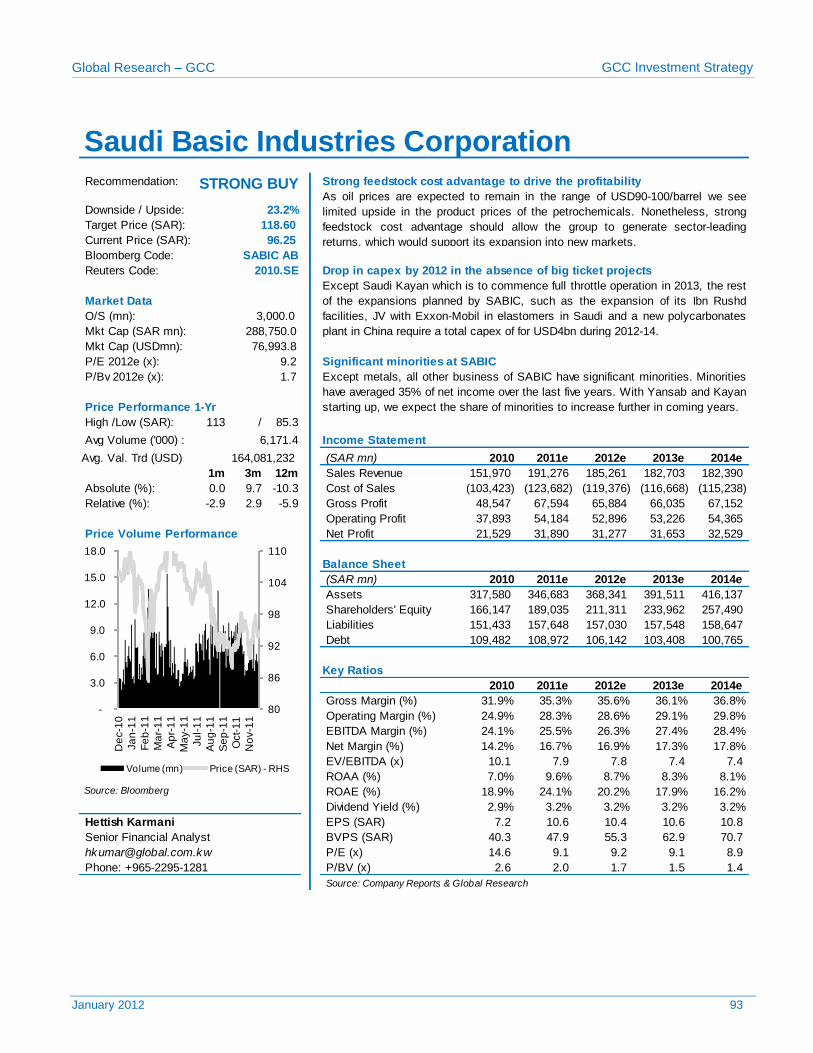
Saudi Basic Industries Corporation SABIC AB 76,993.8 0.0% 9.7% -10.3% 9.2 1.7 20.2% 9.4% 10.43 96.25 118.60 23.2% STRONG BUY
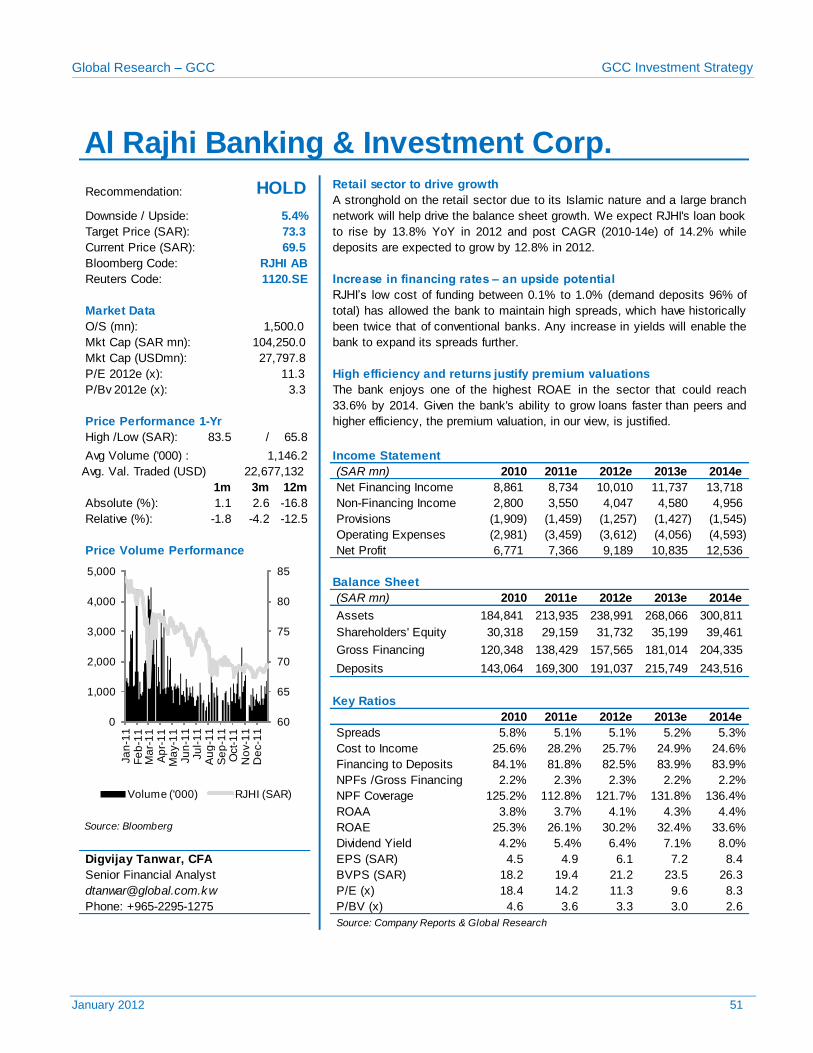
Al Rajhi Bank RJHI AB 27,797.8 1.1% 2.6% -16.8% 11.3 3.3 30.2% 4.6% 6.13 69.50 73.27 5.4% HOLD
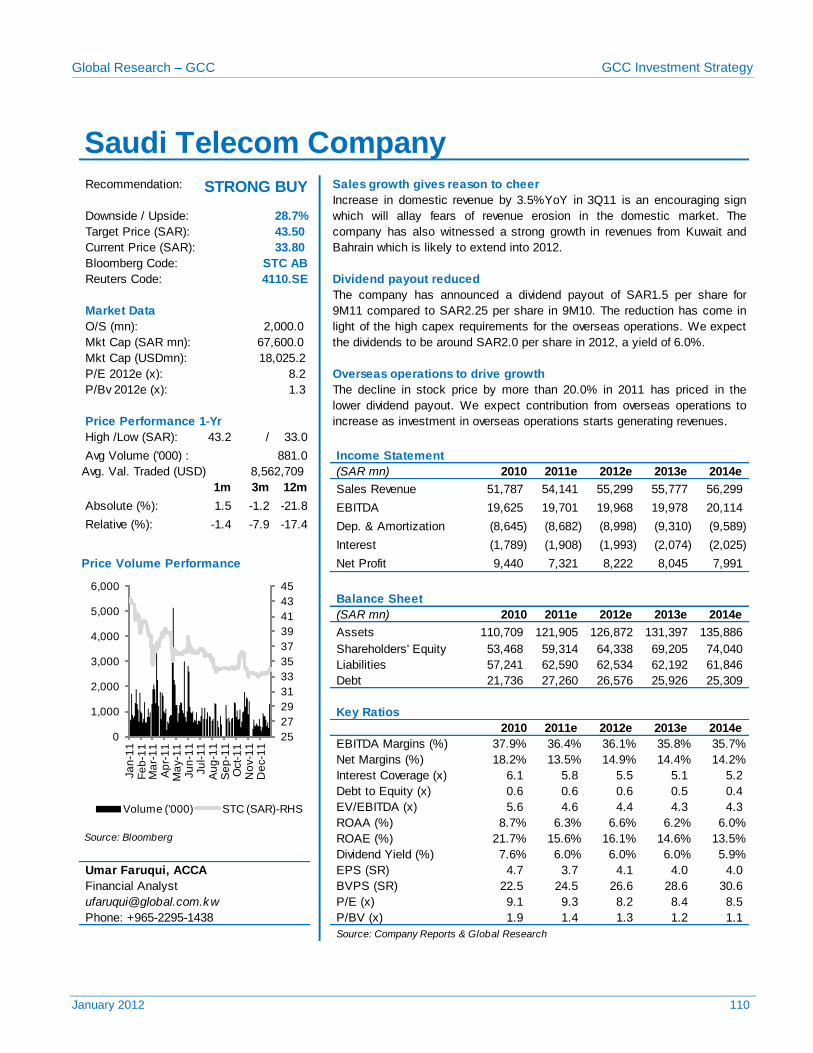
Saudi Telecom Company STC AB 18,025.2 1.5% -1.2% -21.8% 8.2 1.3 16.1% 7.1% 4.11 33.80 43.50 28.7% STRONG BUY
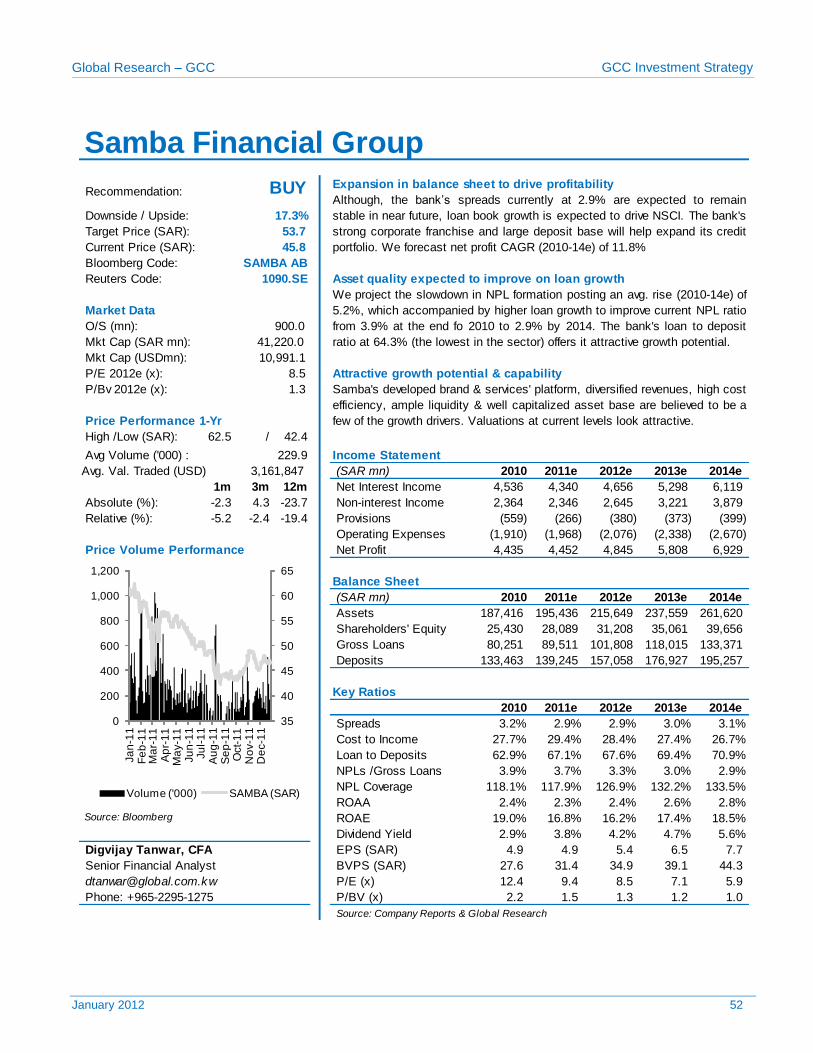
Samba Financial Group SAMBA AB 10,991.1 -2.3% 4.3% -23.7% 8.5 1.3 16.3% 2.5% 5.38 45.80 53.73 17.3% BUY
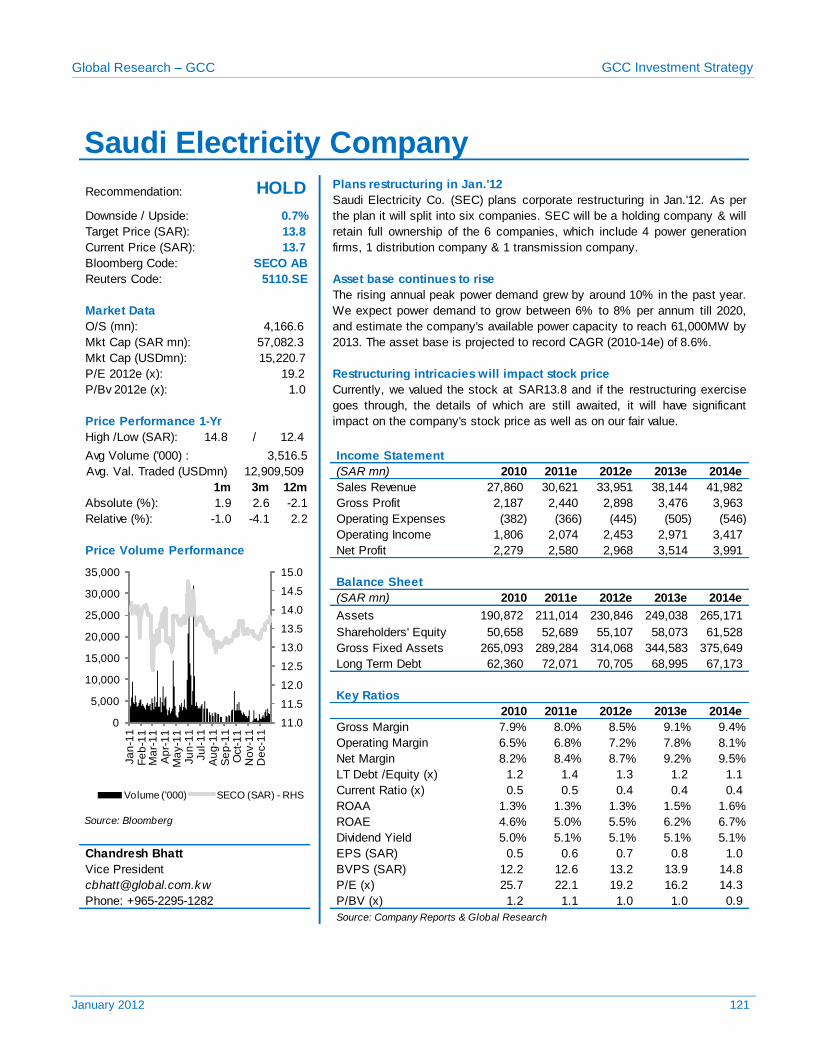
Saudi Electricity Company SECO AB 15,220.7 1.9% 2.6% -2.1% 19.2 1.0 5.5% 1.5% 0.71 13.70 13.80 0.7% HOLD
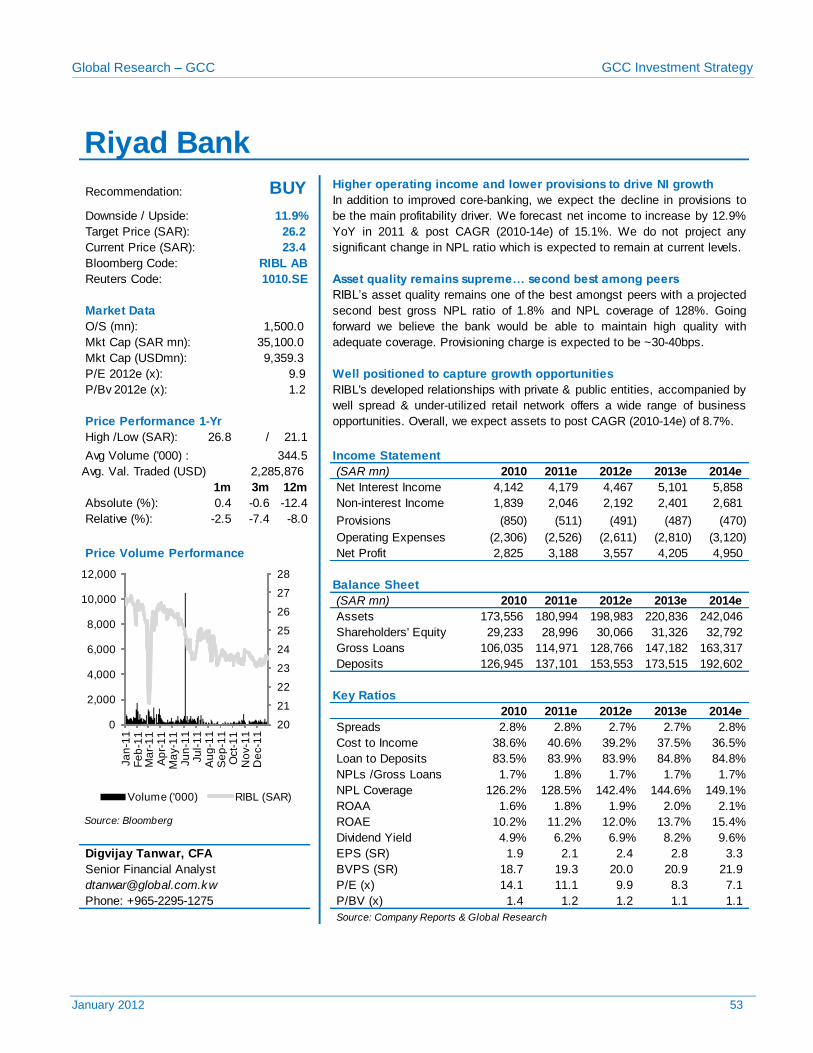
Riyad Bank RIBL AB 9,359.3 0.4% -0.6% -12.4% 9.9 1.2 12.0% 2.0% 2.37 23.40 26.18 11.9% BUY
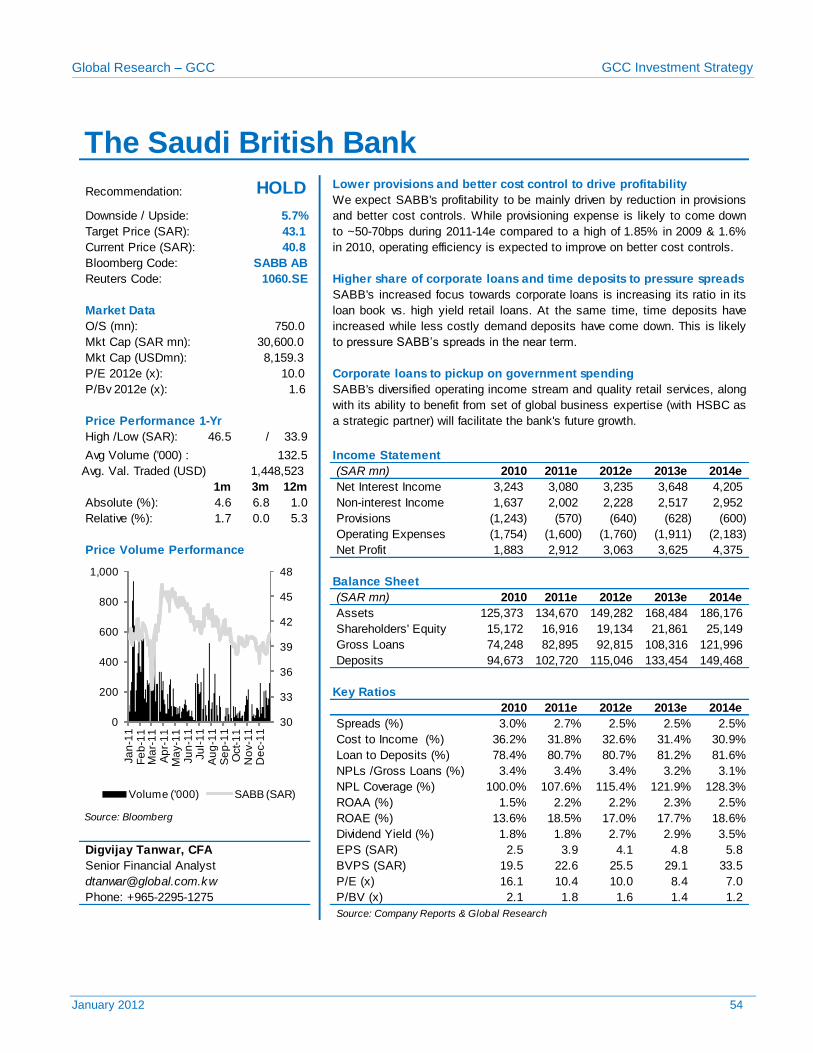
The Saudi British Bank SABB AB 8,159.3 4.6% 6.8% 1.0% 10.0 1.6 17.0% 2.4% 4.08 40.80 43.13 5.7% HOLD
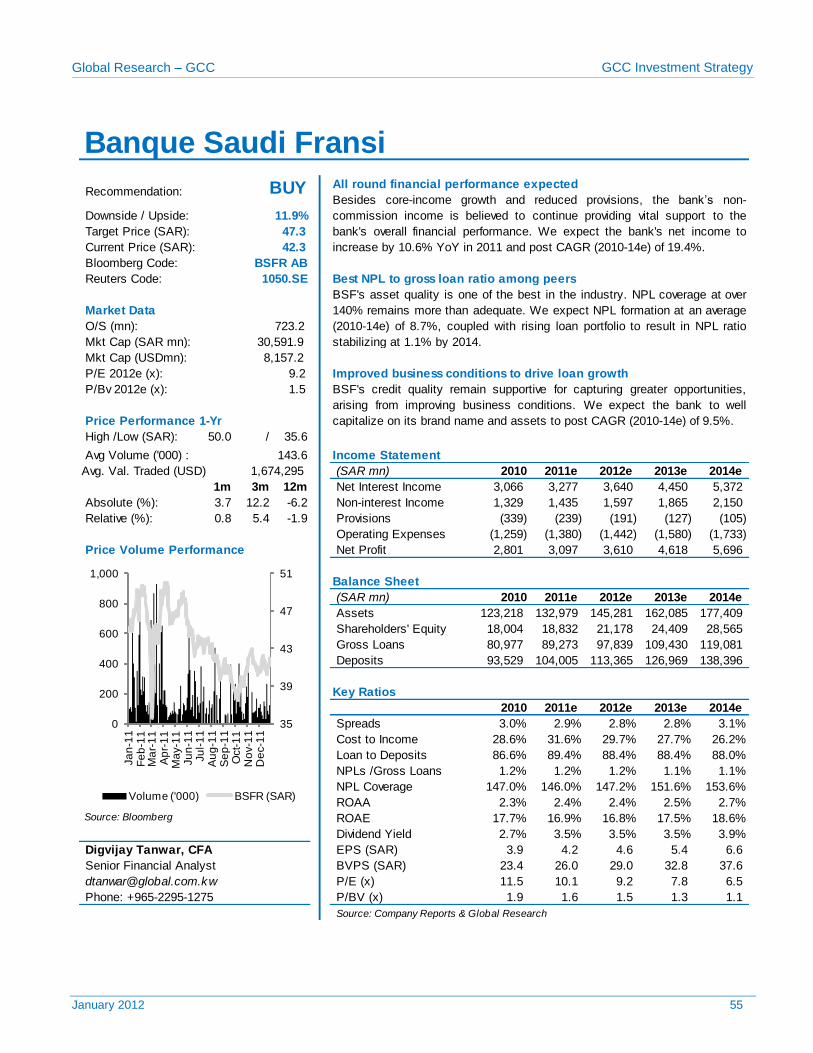
Banque Saudi Fransi BSFR AB 8,157.2 3.7% 12.2% -6.2% 8.5 1.4 18.0% 2.8% 4.99 42.30 47.32 11.9% BUY
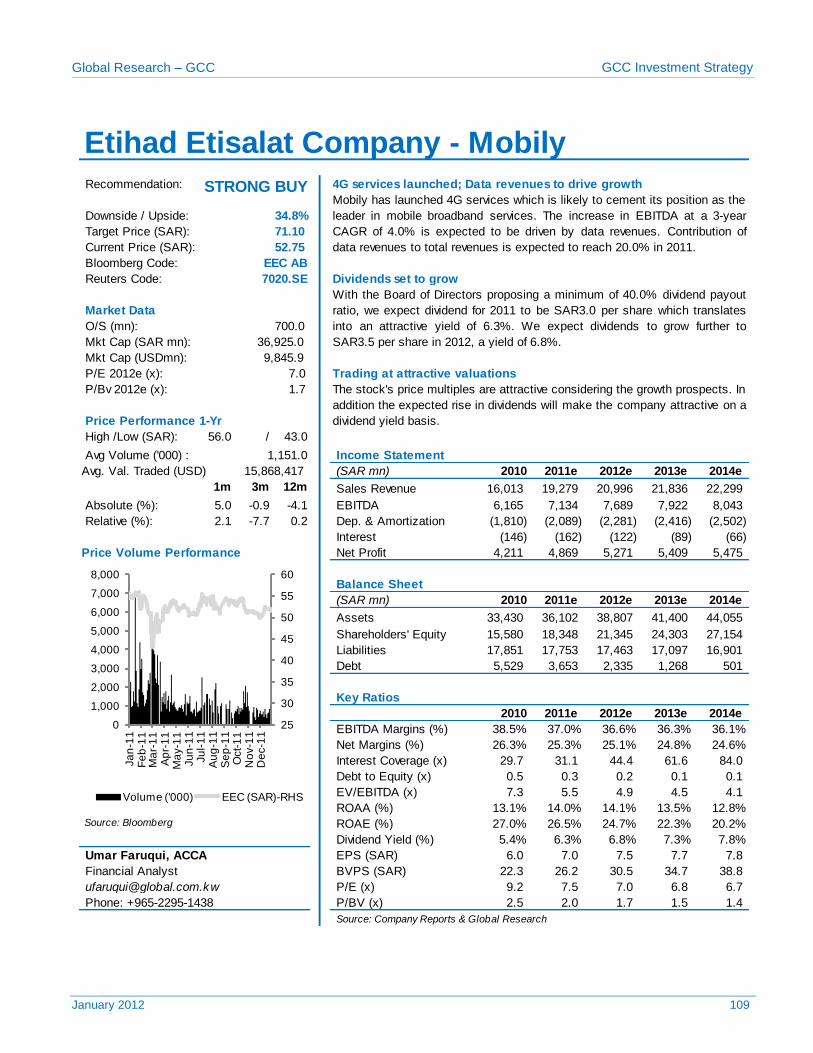
Etihad Etisalat Company EEC AB 9,845.9 5.0% -0.9% -4.1% 7.0 1.7 26.6% 15.2% 7.53 52.75 71.10 34.8% STRONG BUY
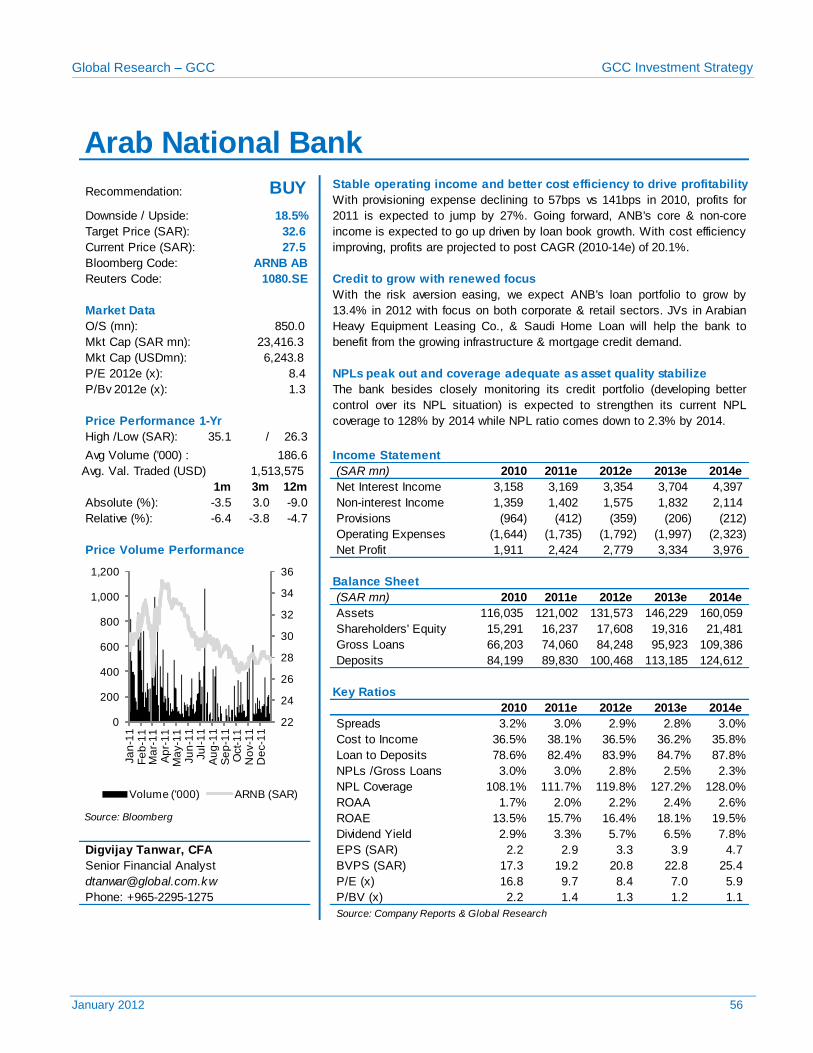
Arab National Bank ARNB AB 6,243.8 -3.5% 3.0% -9.0% 8.4 1.3 16.4% 2.3% 3.27 27.50 32.60 18.5% BUY
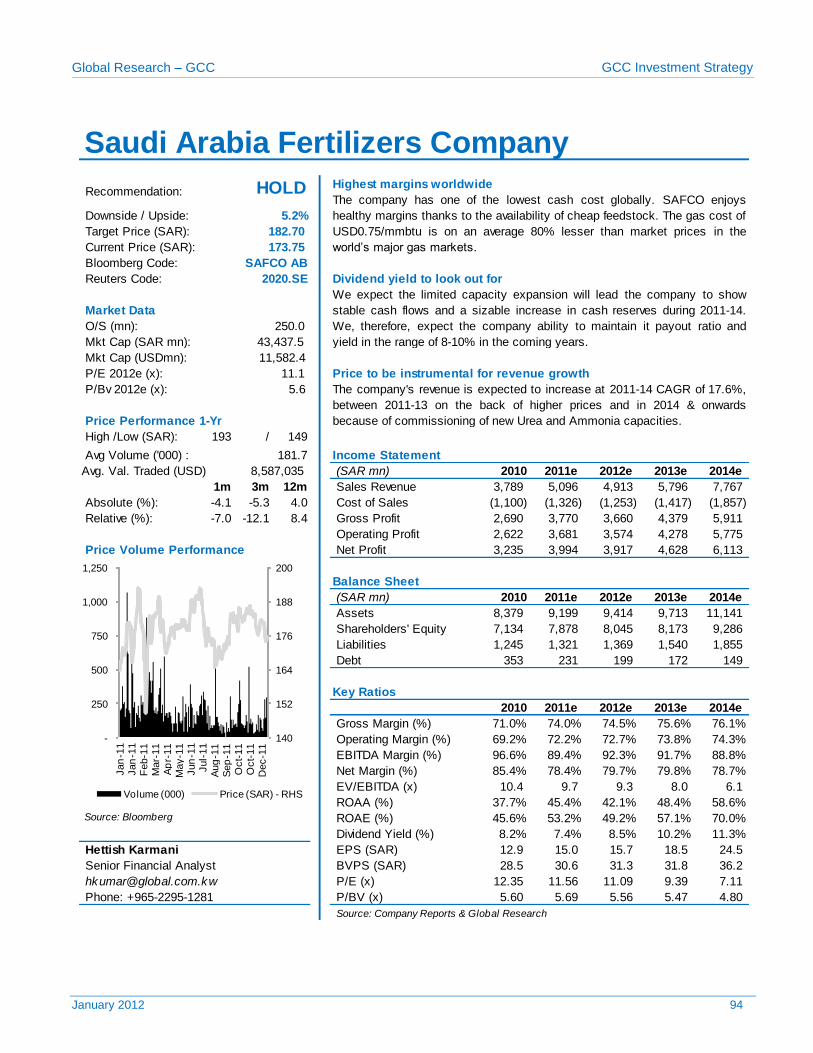
Saudi Arabia Fertilizers Company SAFCO AB 11,582.4 -4.1% -5.3% 4.0% 11.1 5.4 49.2% 44.6% 15.67 173.75 182.70 5.2% HOLD
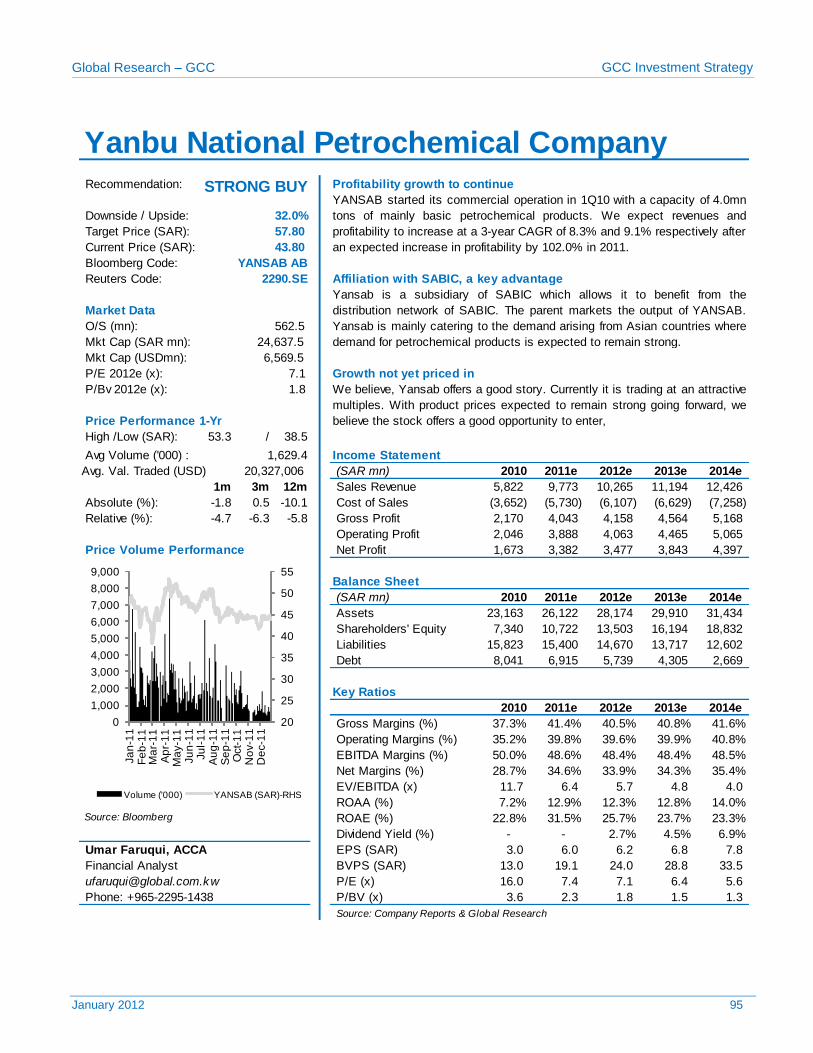
Yanbu National Petrochemicals Company YANSAB AB 6,569.5 -1.8% 0.5% -10.1% 7.1 1.8 28.7% 14.1% 6.18 43.80 57.80 32.0% STRONG BUY
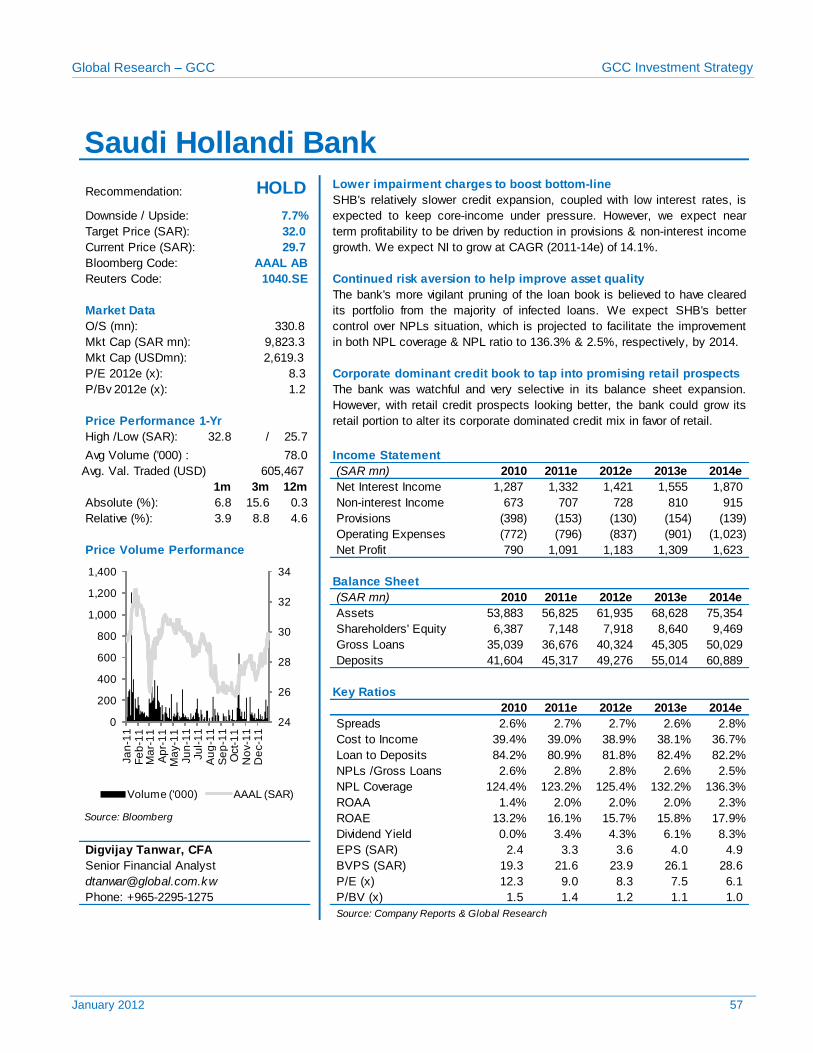
Saudi Hollandi Bank AAAL AB 2,619.3 6.8% 15.6% 0.3% 8.3 1.2 15.7% 2.1% 3.58 29.70 32.00 7.7% HOLD
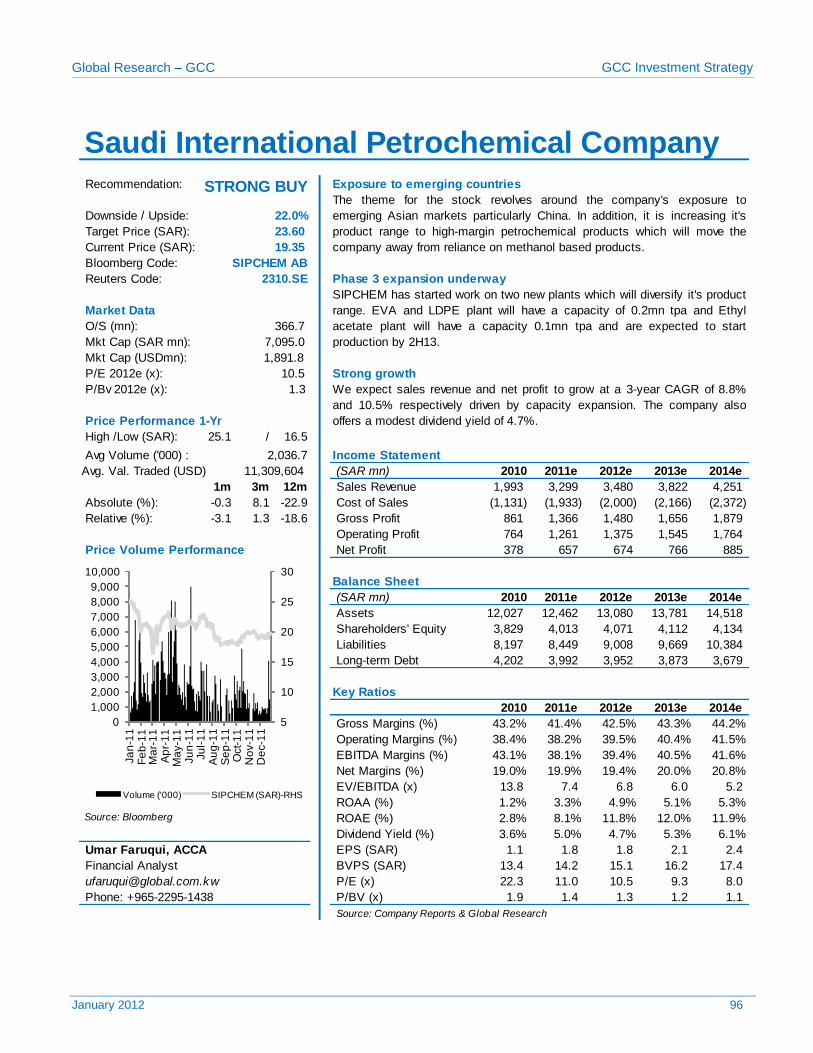
Saudi International Petrochemichal Company SIPCHEM AB 1,891.8 -0.3% 8.1% -22.9% 10.5 1.3 12.5% 5.5% 1.84 19.35 23.60 22.0% STRONG BUY
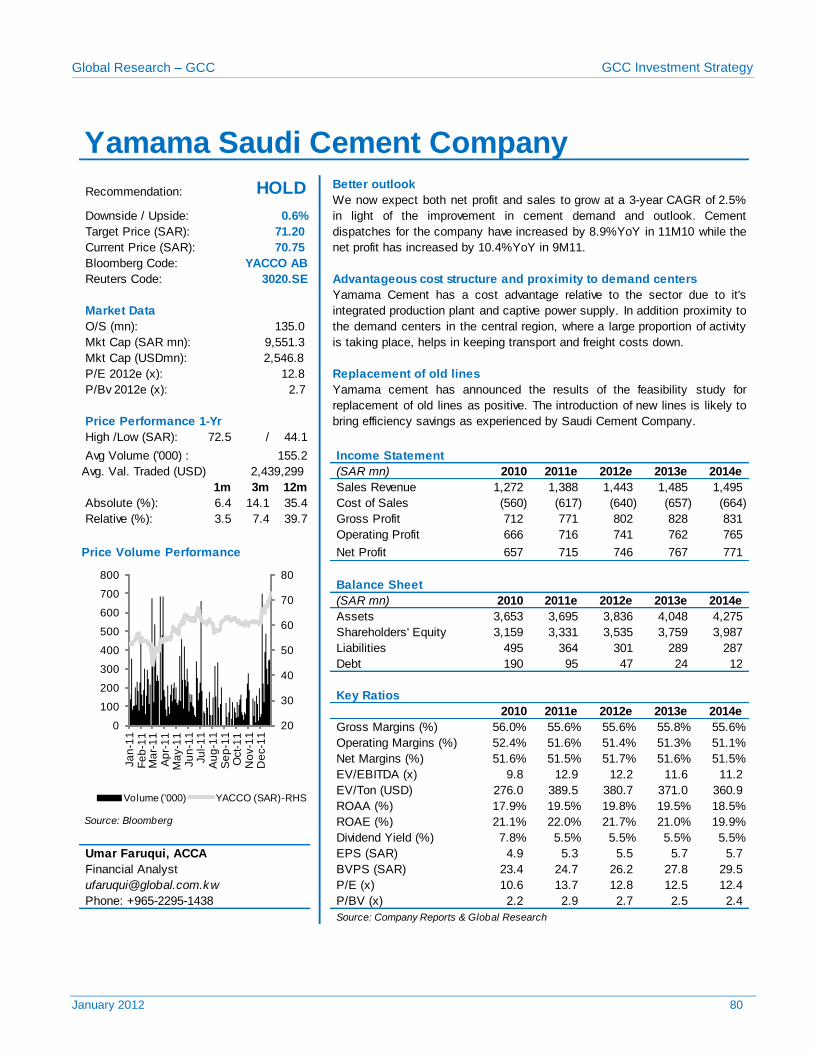
Yamama Saudi Cement Company YACCO AB 2,546.8 6.4% 14.1% 35.4% 12.8 2.7 21.7% 20.3% 5.52 70.75 71.20 0.6% HOLD
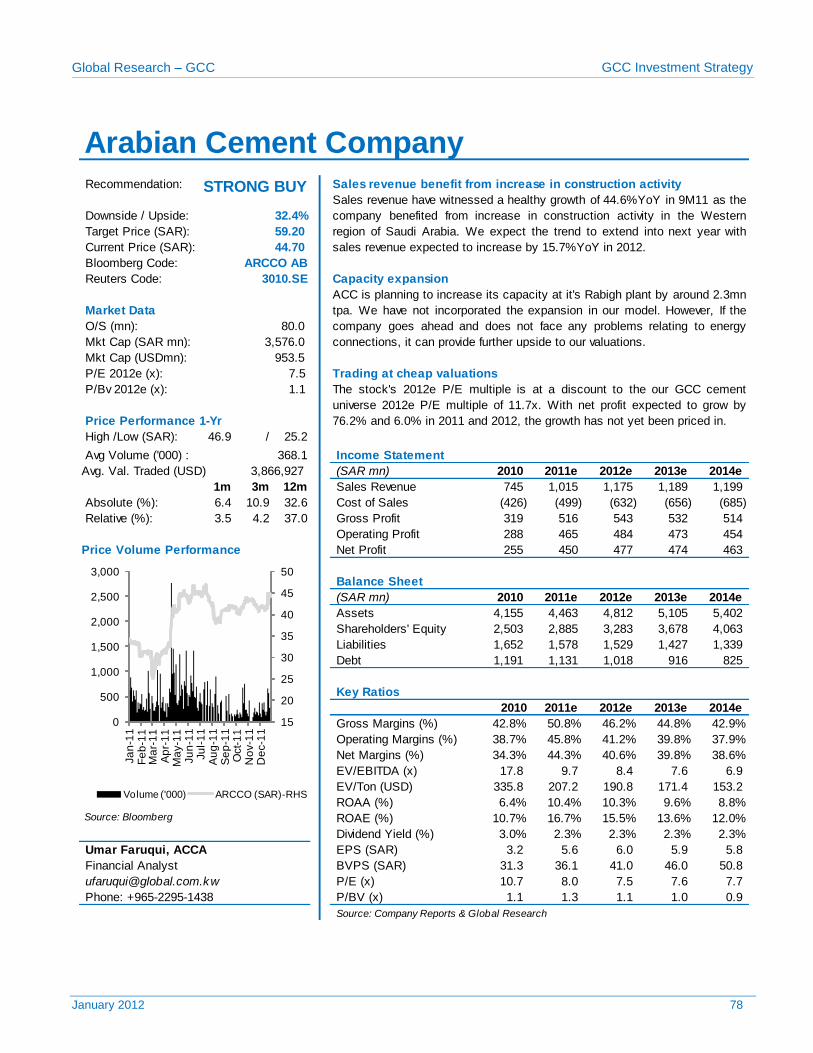
Arabian Cement Co. ARCCO AB 953.5 6.4% 10.9% 32.6% 7.5 1.1 15.8% 11.1% 5.96 44.70 59.20 32.4% STRONG BUY
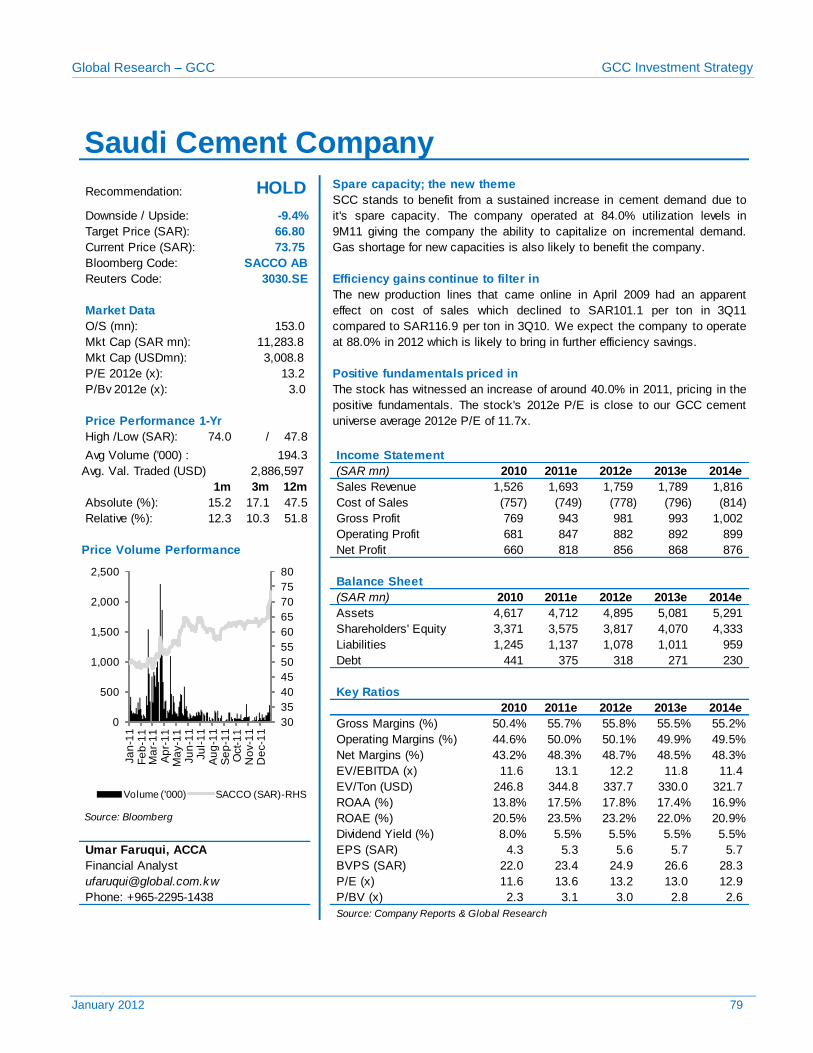
Saudi Cement Company SACCO AB 3,008.8 15.2% 17.1% 47.5% 13.2 3.0 23.2% 18.4% 5.59 73.75 66.80 -9.4% HOLD
Dar Alarkan ALARKAN AB 2,059.0 12.6% 17.2% -22.3% 6.3 0.5 7.7% 5.1% 1.13 7.15 8.90 24.5% STRONG BUY
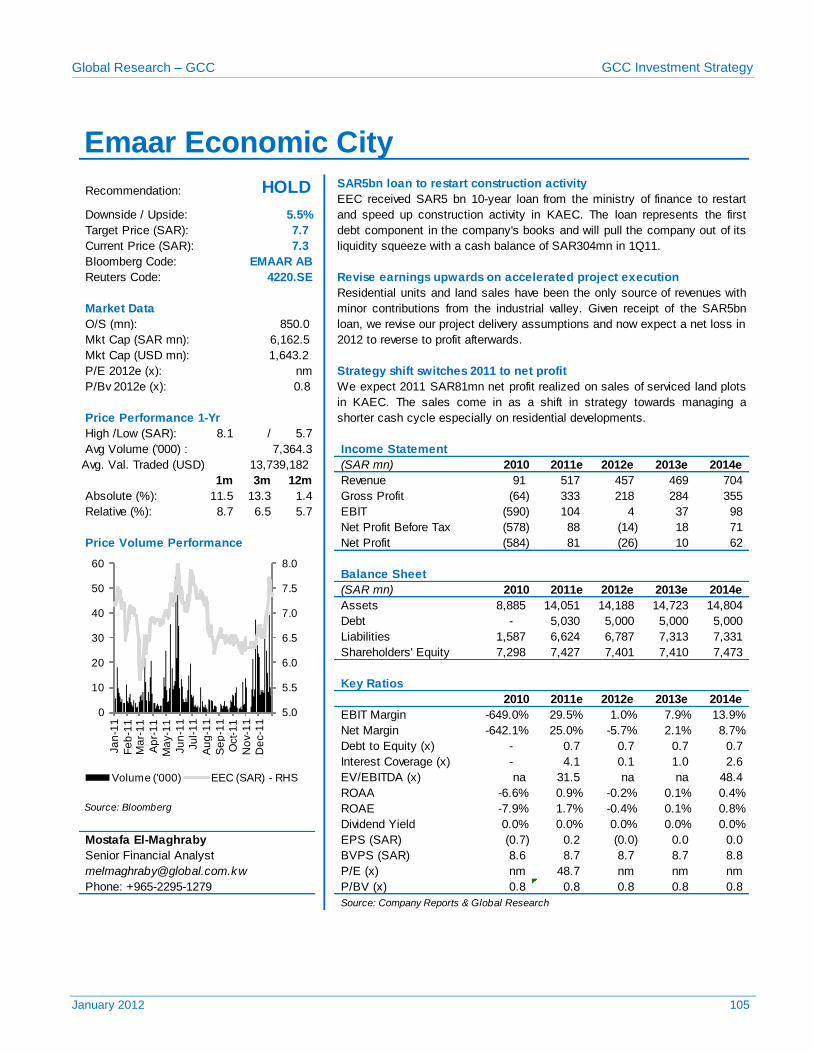
Emaar Economic City EMAAR AB 1,643.2 11.5% 13.3% 1.4% na 0.8 -0.5% -0.3% (0.04) 7.25 7.65 5.5% HOLD
Saudi Real Estate Co. (Akaria) SRECO AB 835.1 13.5% 12.0% -1.5% 25.7 1.0 3.8% 3.5% 1.02 26.10 28.95 10.9% BUY
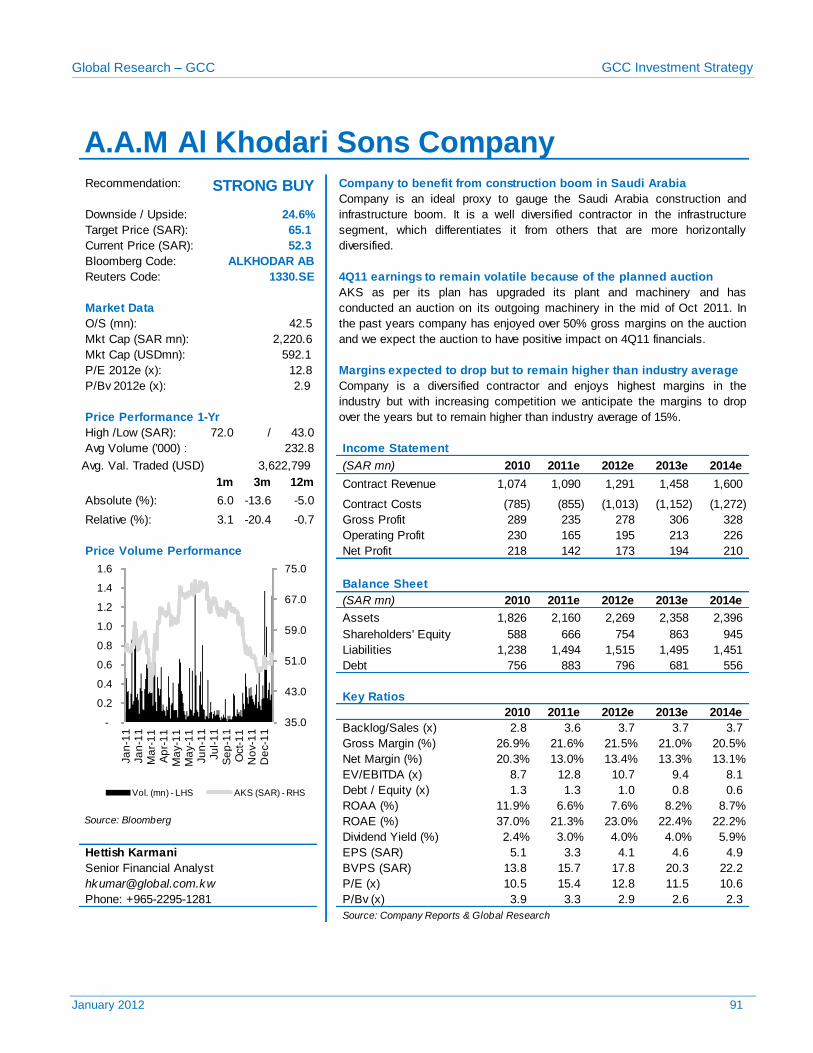
Al Khodari Sons Company ALKHODAR AB 592.1 6.0% -13.6% -5.0% 12.8 2.9 24.4% 8.7% 4.07 52.25 65.10 24.6% STRONG BUY
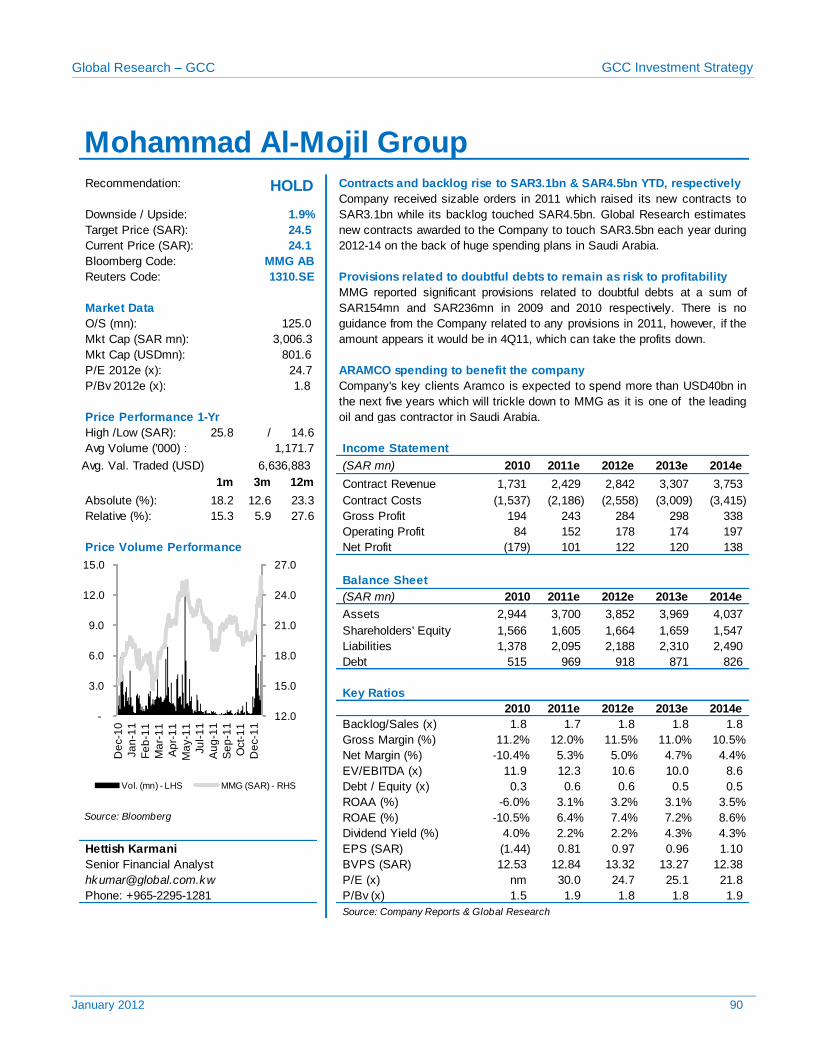
Mohammad Al-Mojil Group MMG AB 801.6 18.2% 12.6% 23.3% 24.7 1.8 7.4% 3.7% 0.97 24.05 24.50 1.9% HOLD
Total 10.35 1.81 18.4% 4.9%
Bahrain
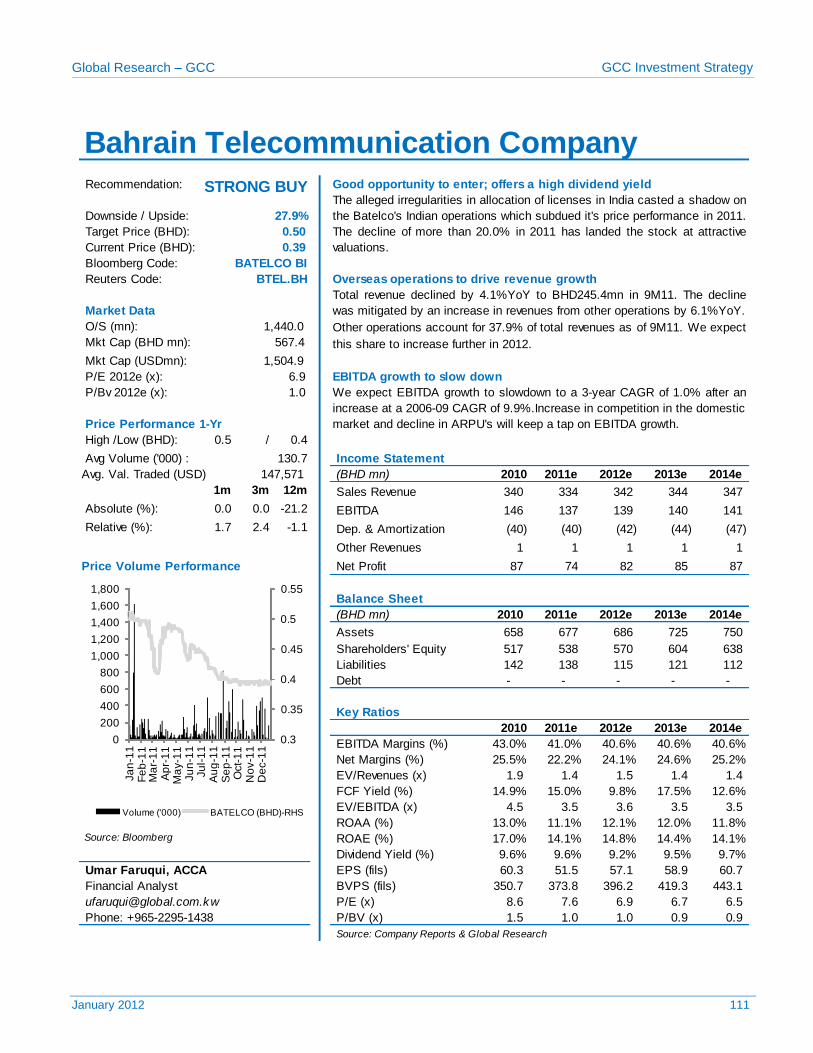
Bahrain Telecommunications Company BATELCO BI 1,504.9 0.0% 0.0% -21.2% 6.9 1.0 15.3% 12.3% 0.06 0.39 0.50 27.9% STRONG BUY
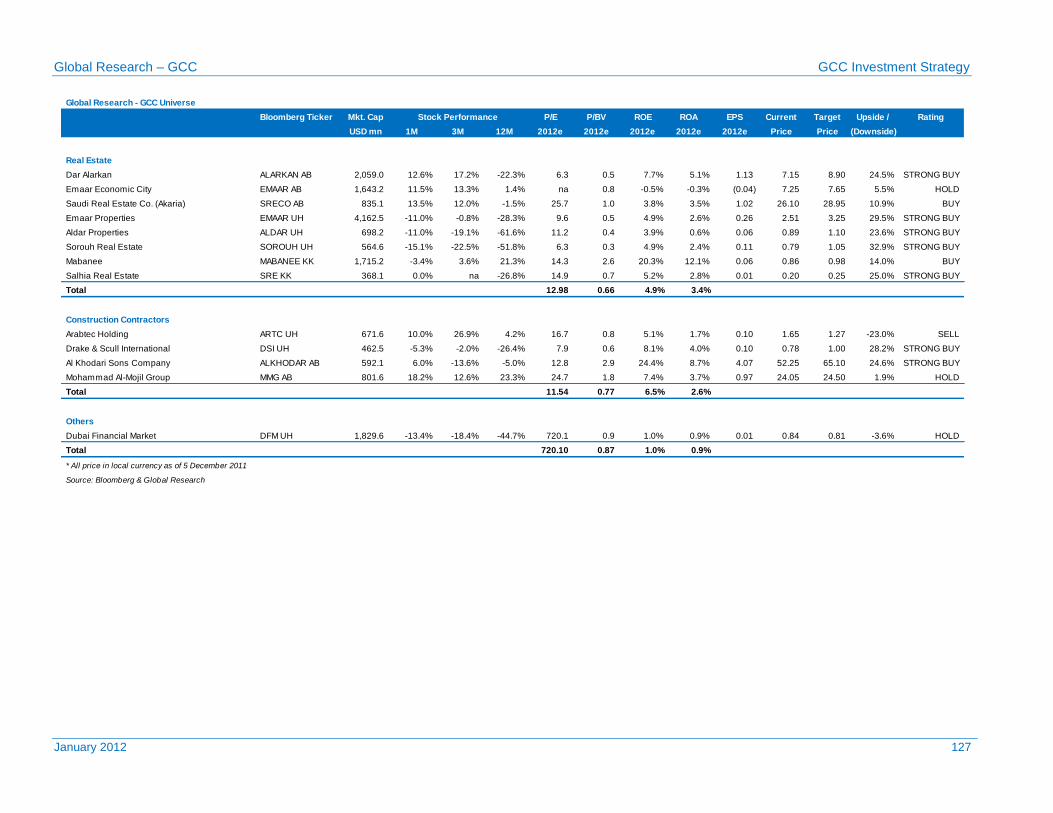
* All price in local currency as of 5 January 2012
Source: Bloomberg & Global Research
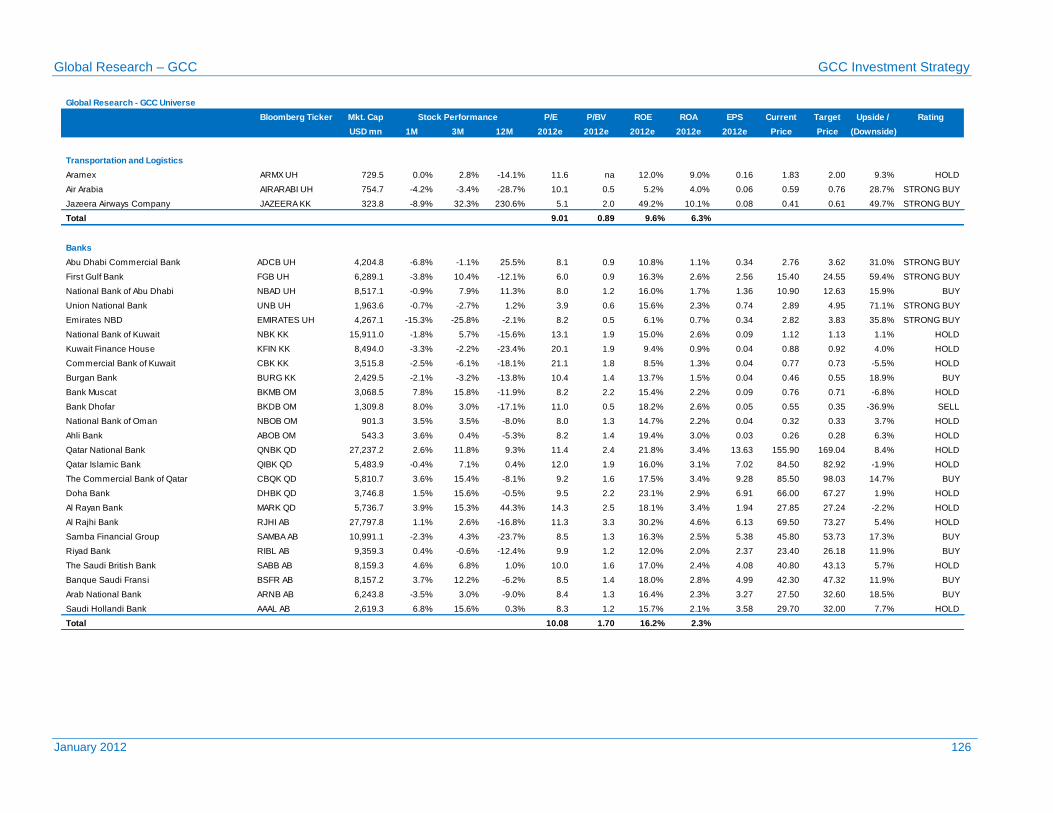
Stock Performance
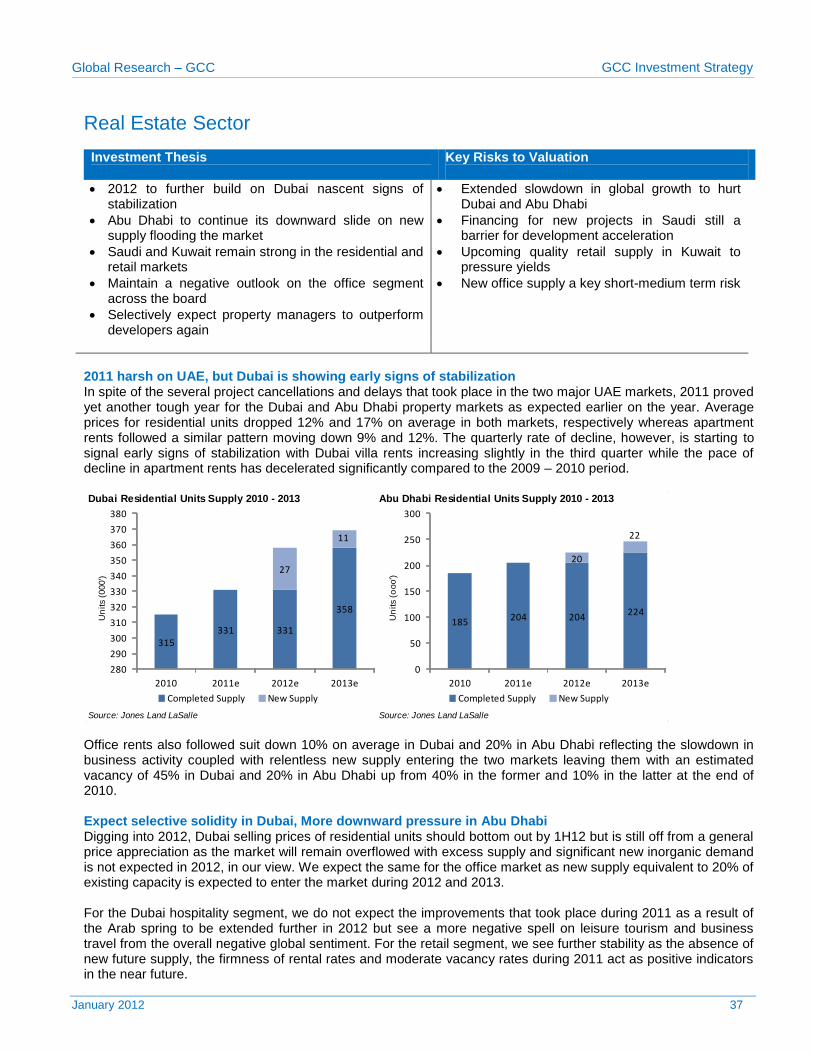
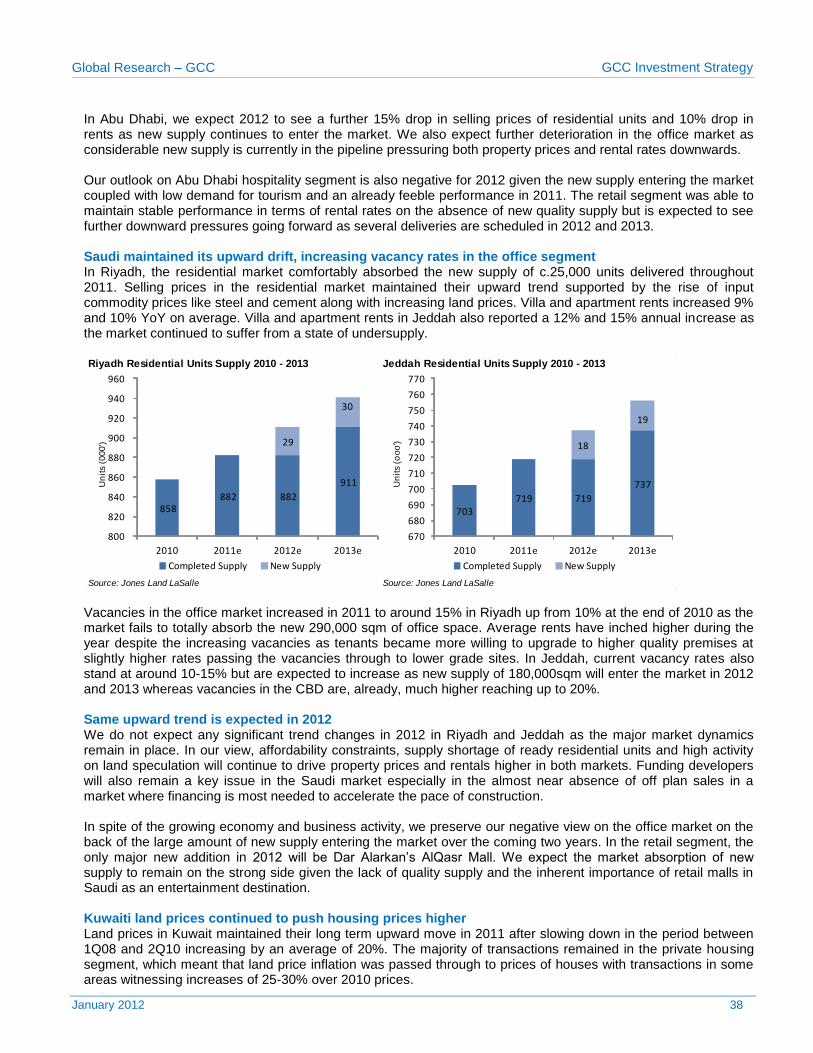
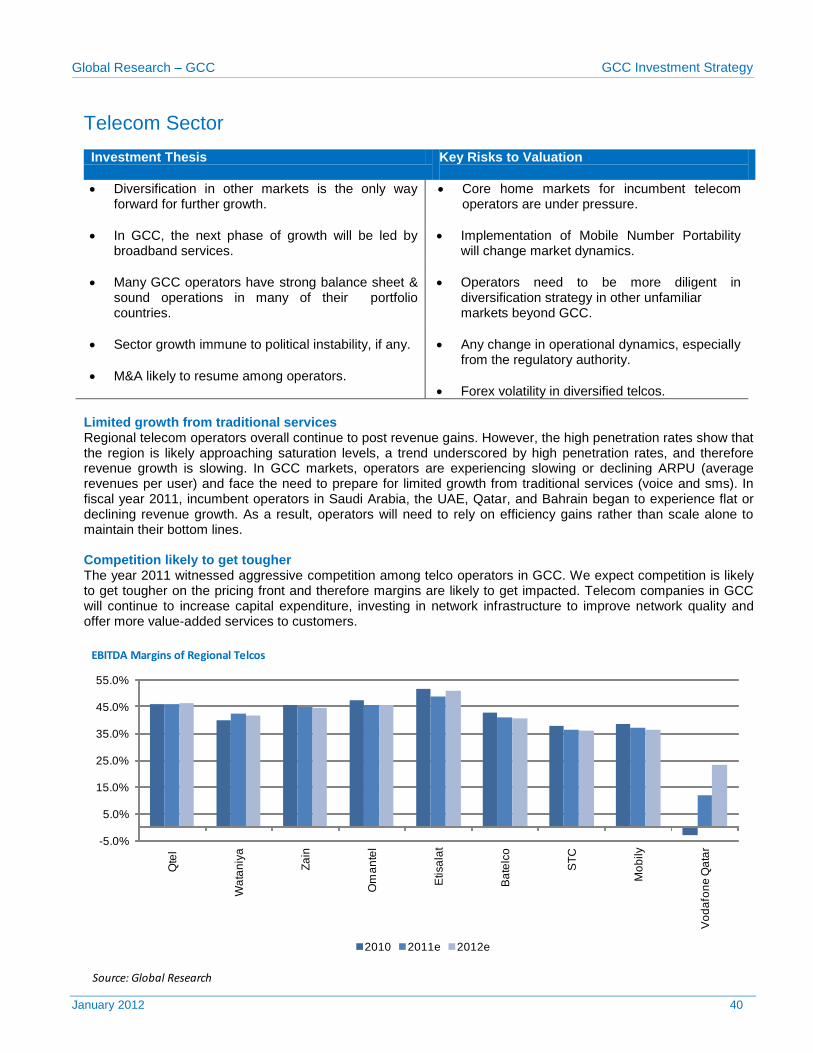
Global Research – GCC GCC Investment Strategy
January 2012 4
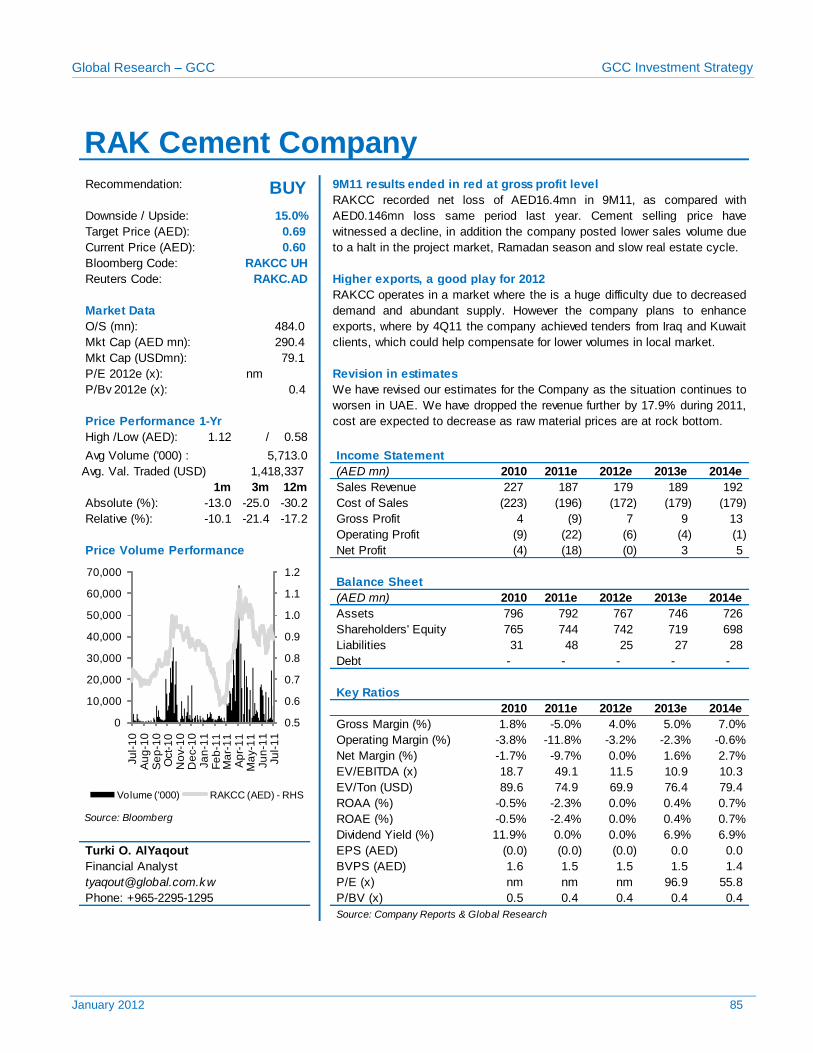
Valuation & Outlook 5 Ras Al Khaimah Cement Company 85
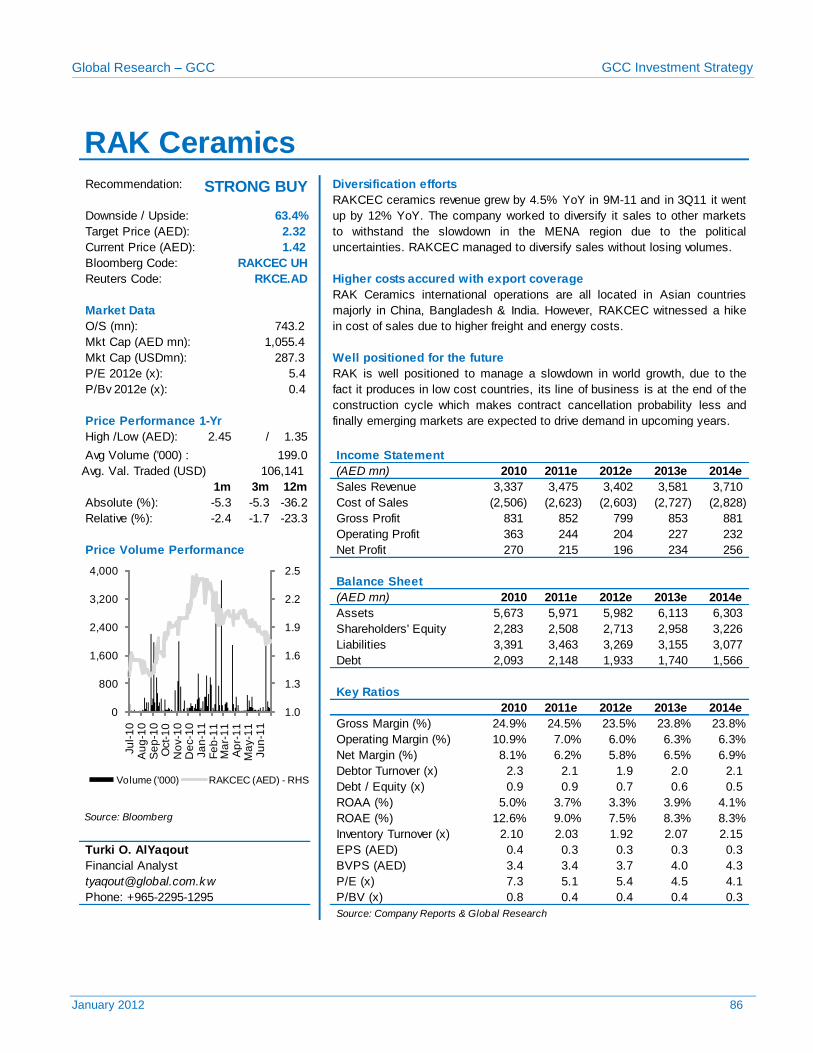
Global Research - GCC Top Picks 11 Ras Al Khaimah Ceramics Co. 86
Macroeconomic Outlook 12
Market Performance 17 Construction Contracting Sector 87
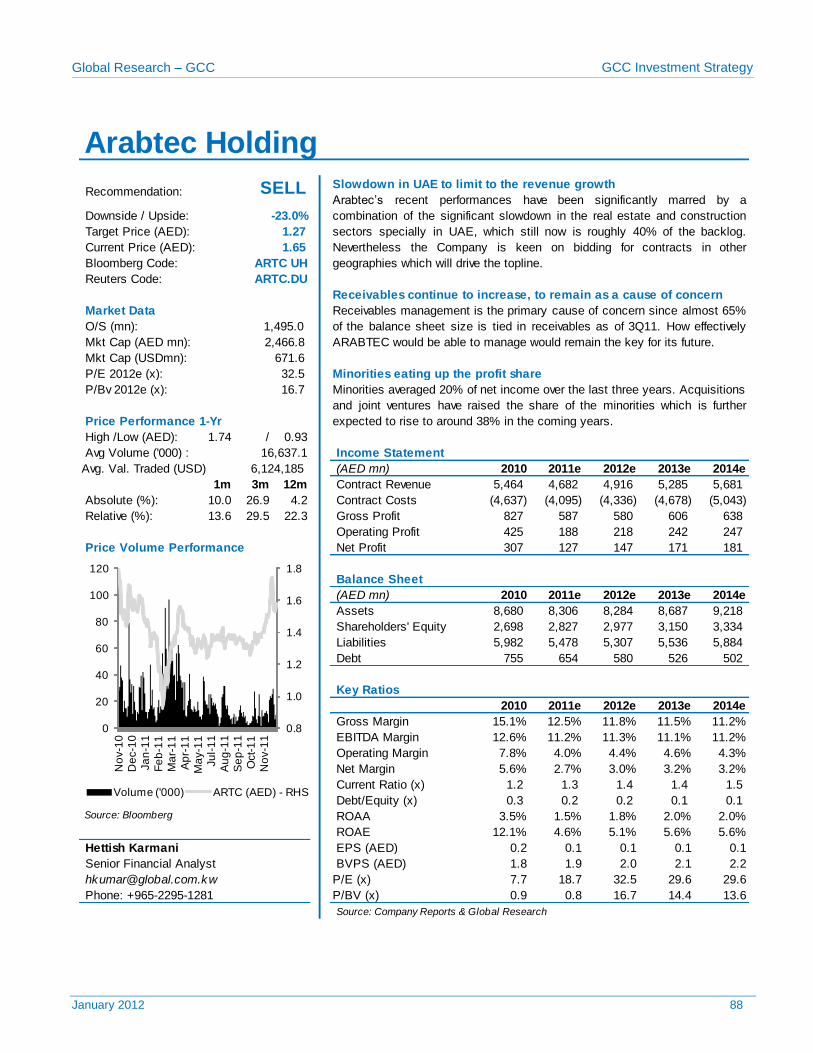
Global Outlook 20 Arabtec Holding 88
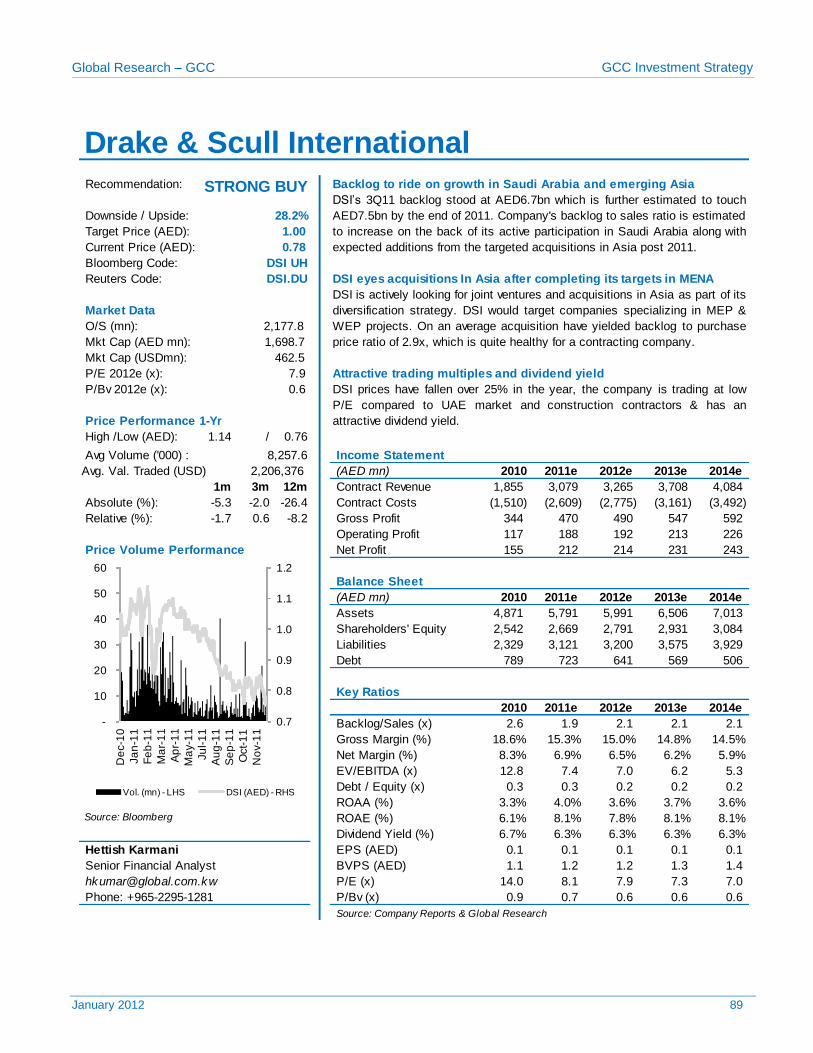
Sectoral Outlook 22 Drake & Scull International 89
Company Profiles 45 Mohammad Al Mojil Group 90
Al Khodari Sons & Company 91
Aviation & Logistics Sector 46
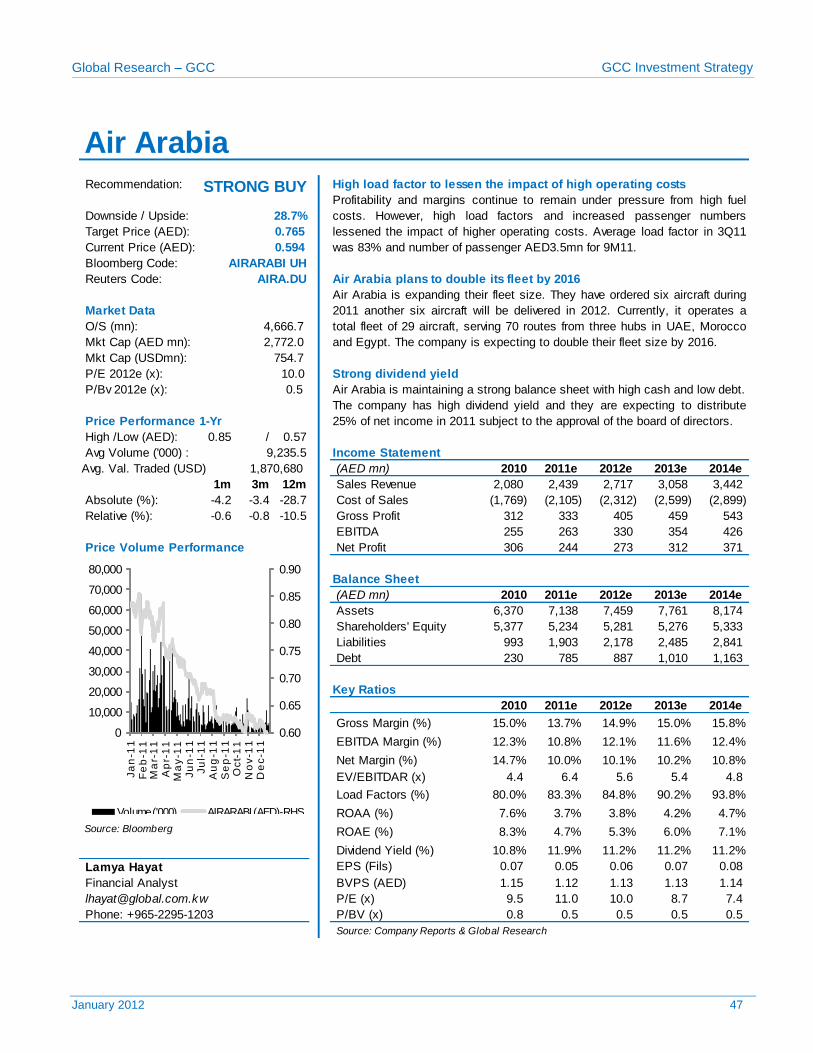
Air Arabia 47 Energy & Petrochemicals Sector 92
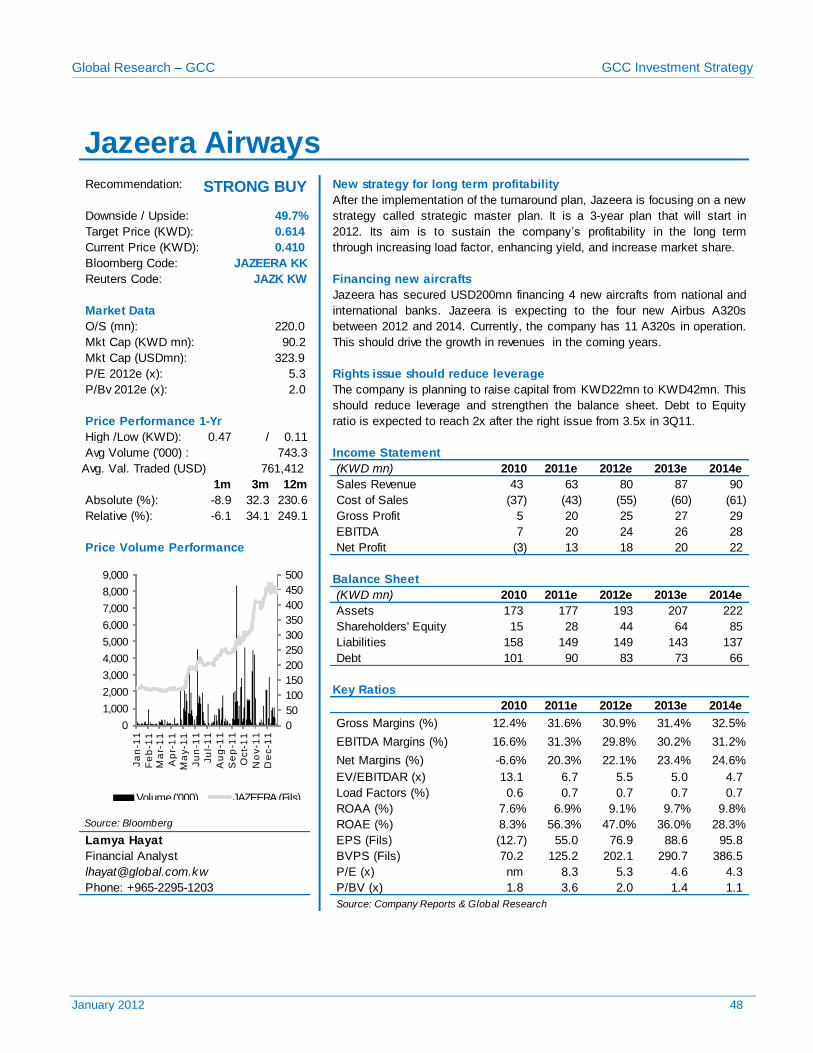
Jazeera Airw ays Company 48 Saudi Basic Industries Corporation 93
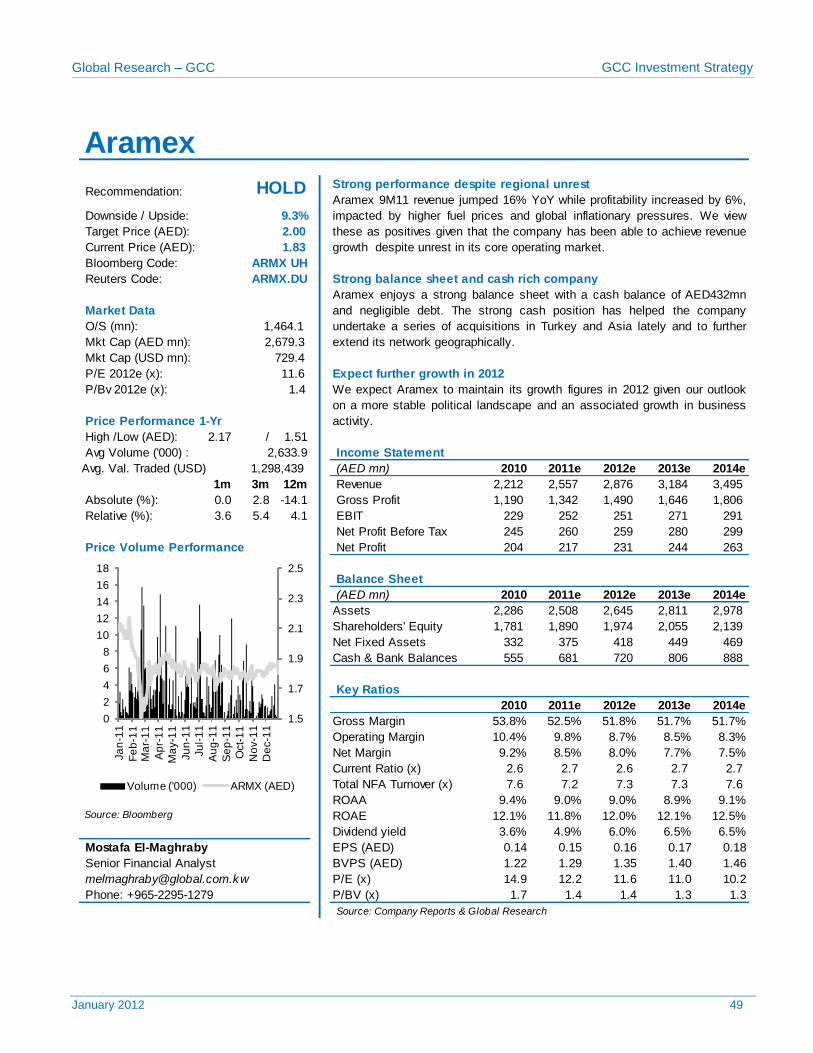
Aramex 49 Saudi Arabia Fertilizers Company 94
Yanbu National Petrochemicals Co. 95
Banking Sector 50 Saudi International Petrochemichal Co. 96
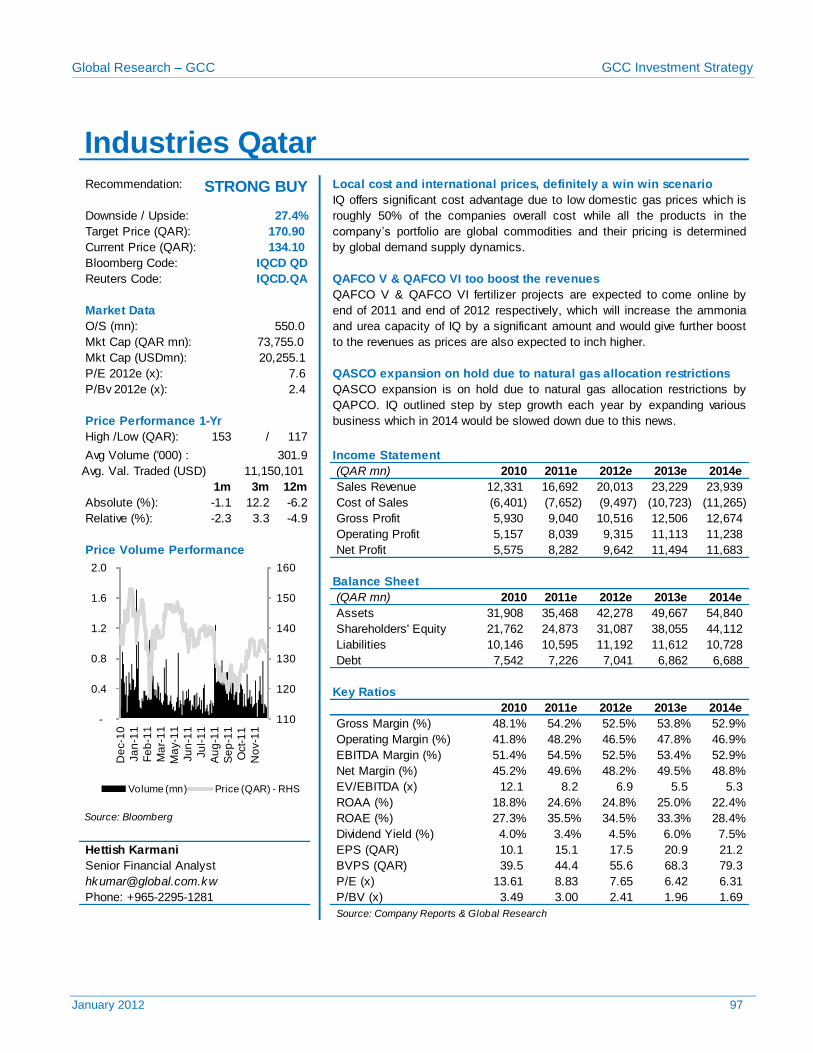
Al Rajhi Bank 51 Industries Qatar 97
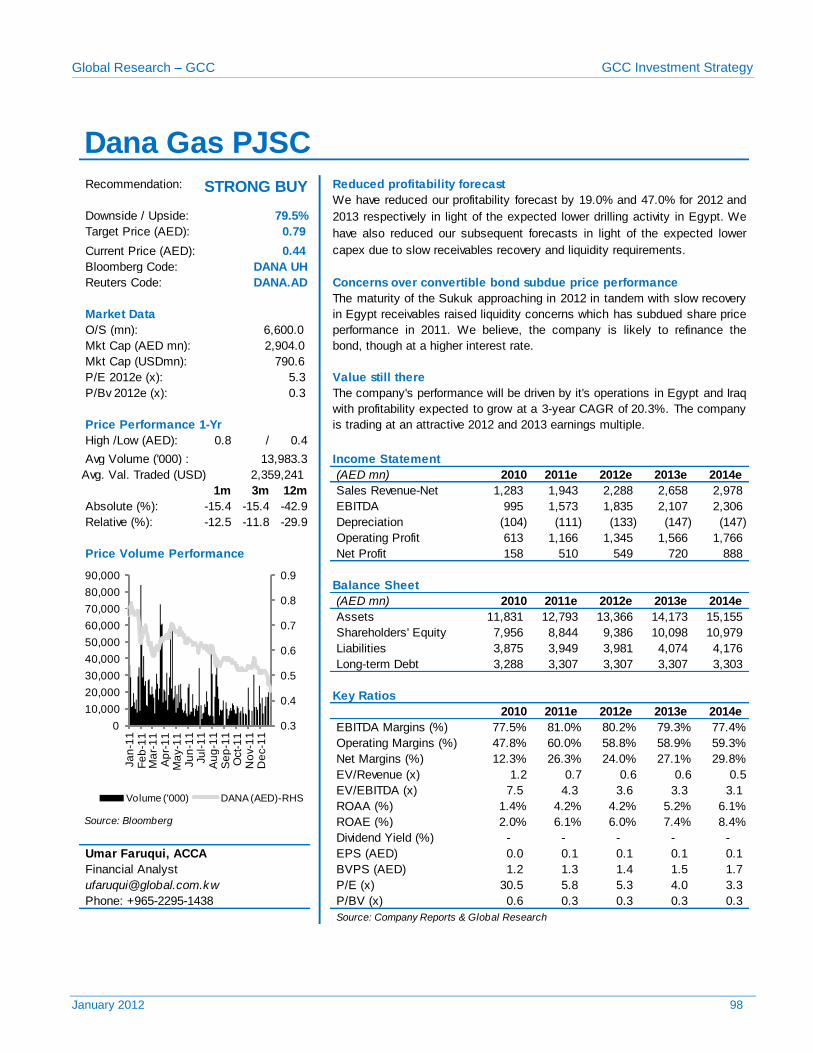
Samba Financial Group 52 Dana Gas 98
Riyad Bank 53
The Saudi British Bank 54 Real Estate Sector 99
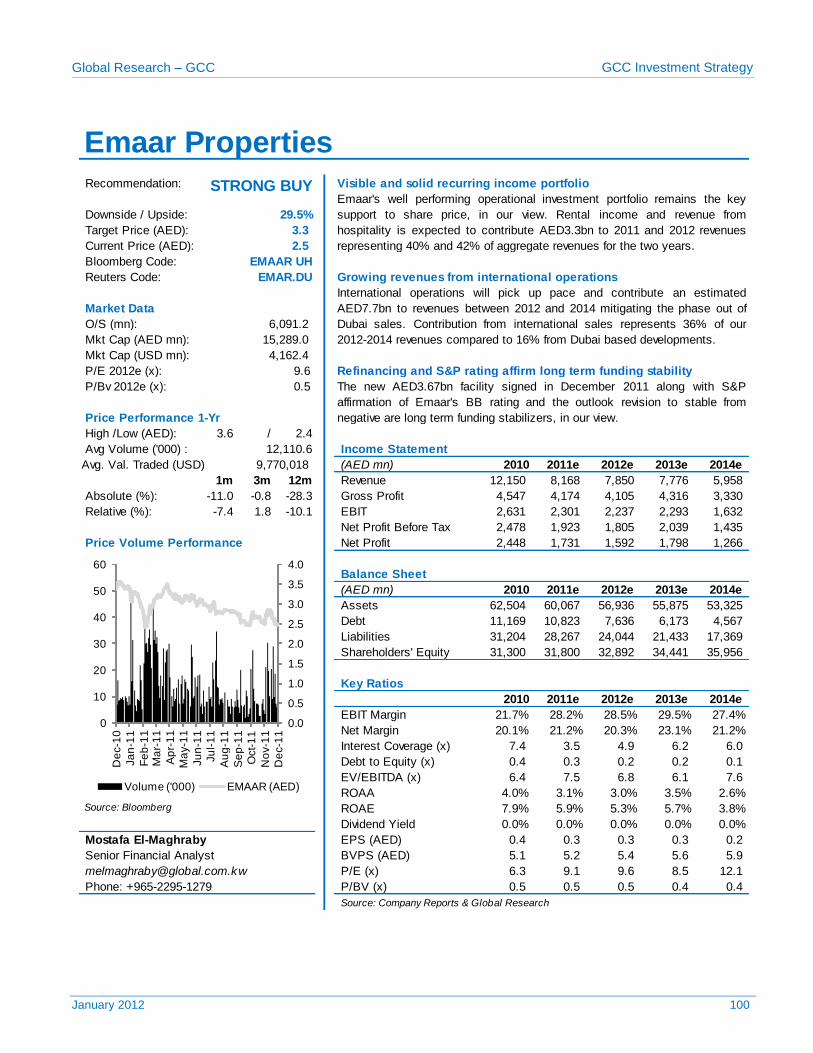
Banque Saudi Fransi 55 Emaar Properties 100
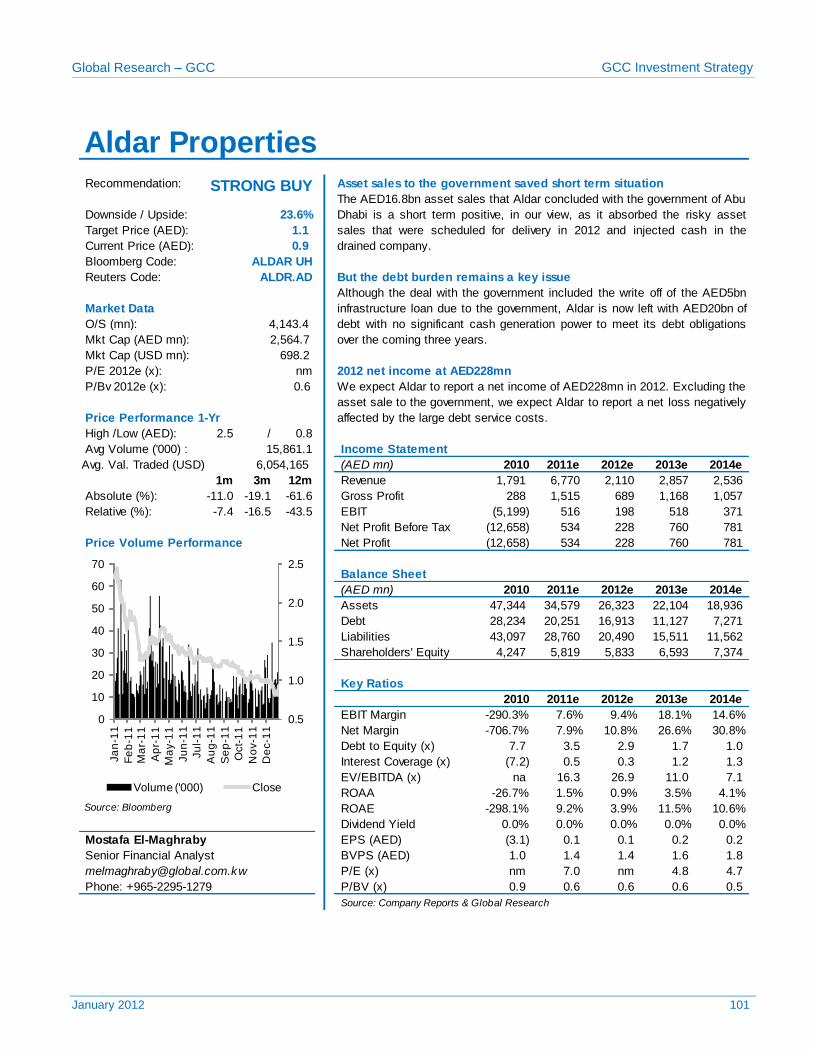
Arab National Bank 56 Aldar Properties 101
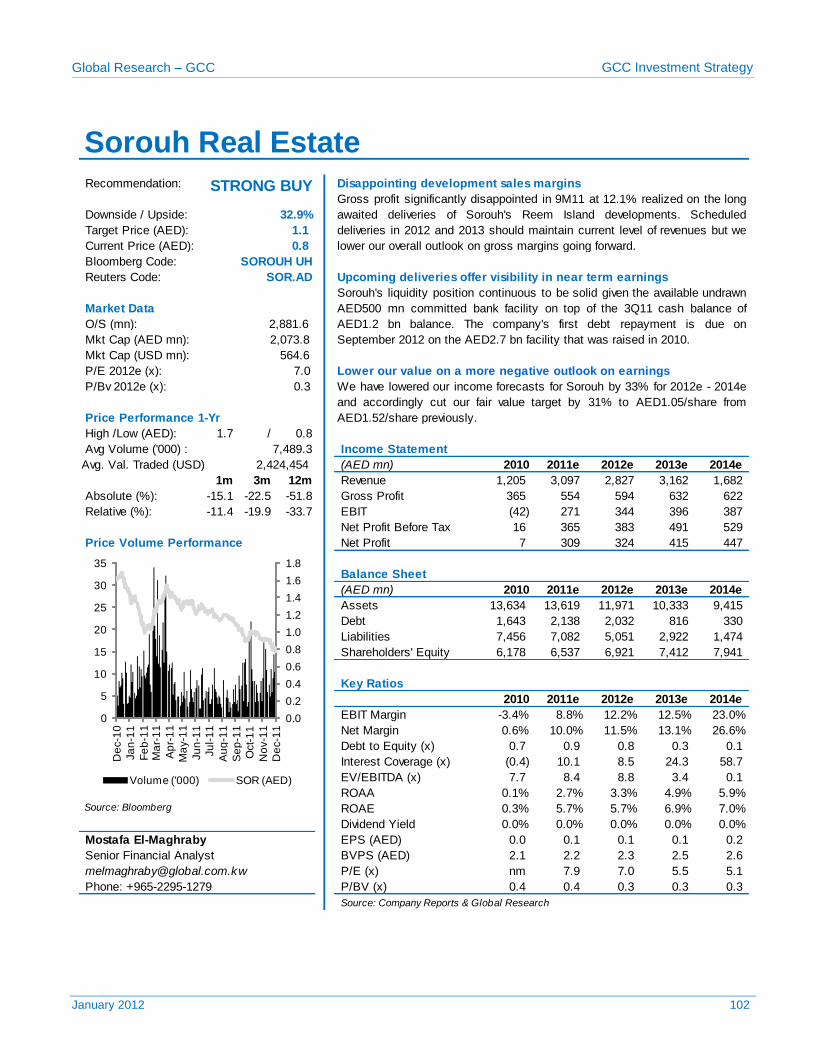
Saudi Hollandi Bank 57 Sorouh Real Estate 102
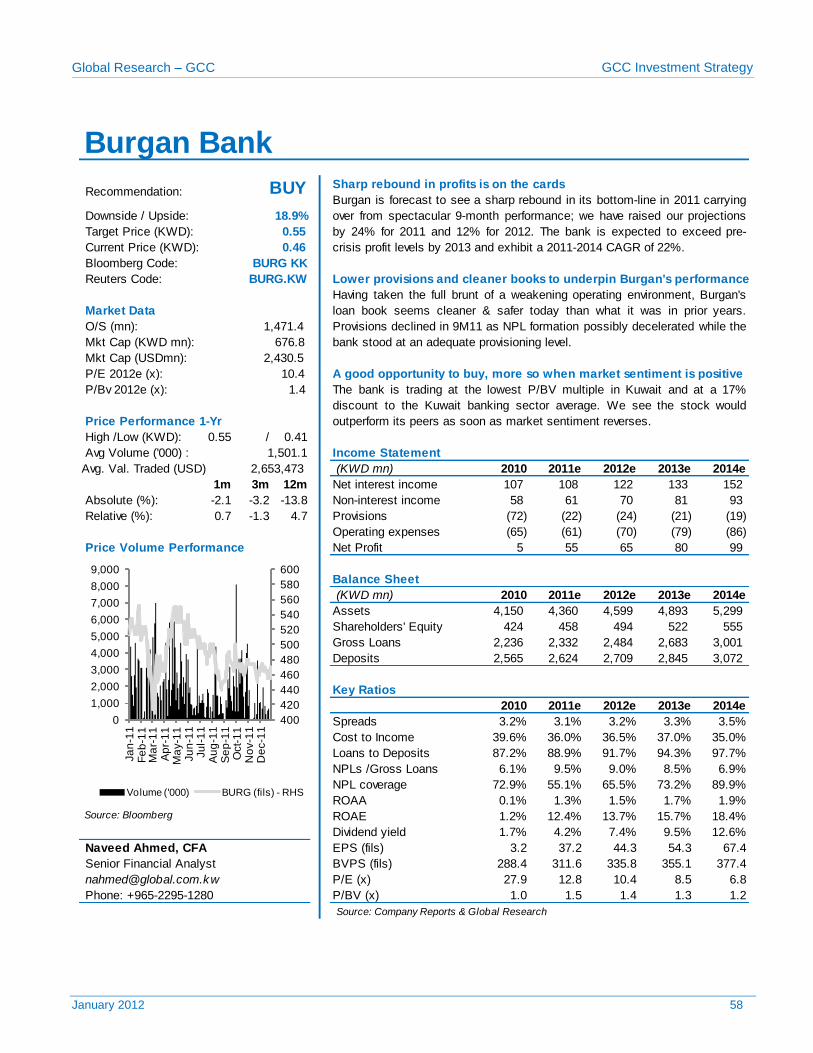
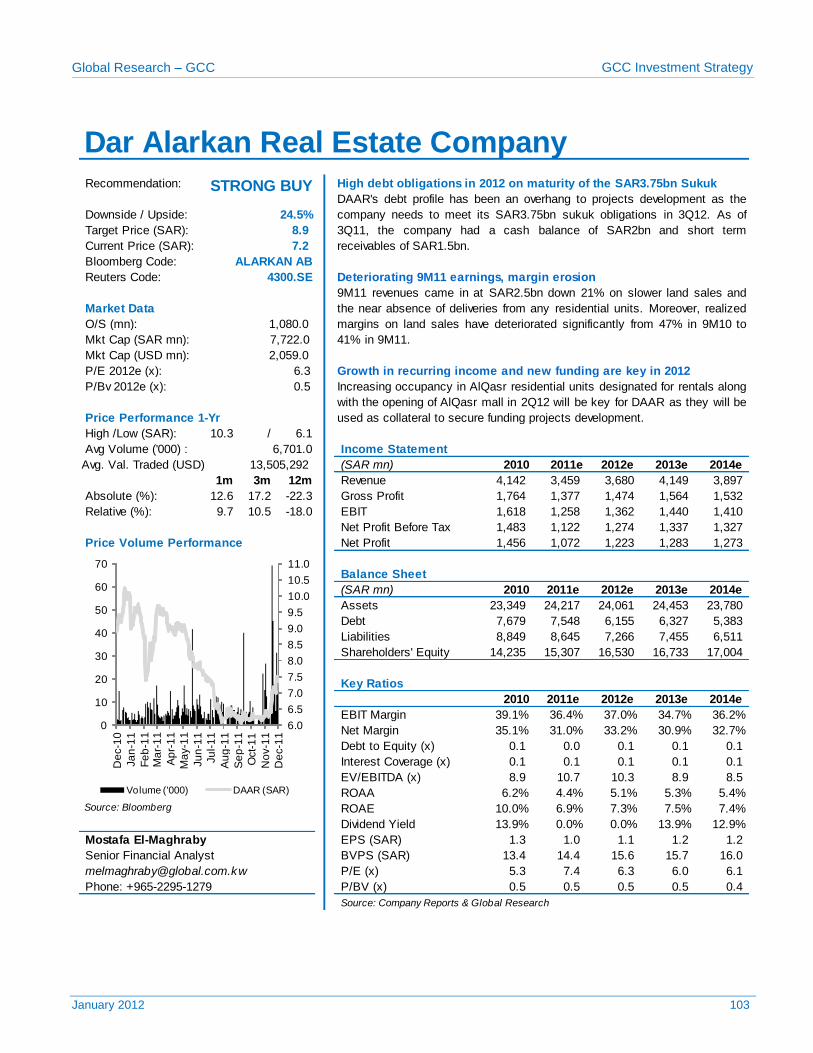
Burgan Bank 58 Dar Al Arkan Real Estate 103
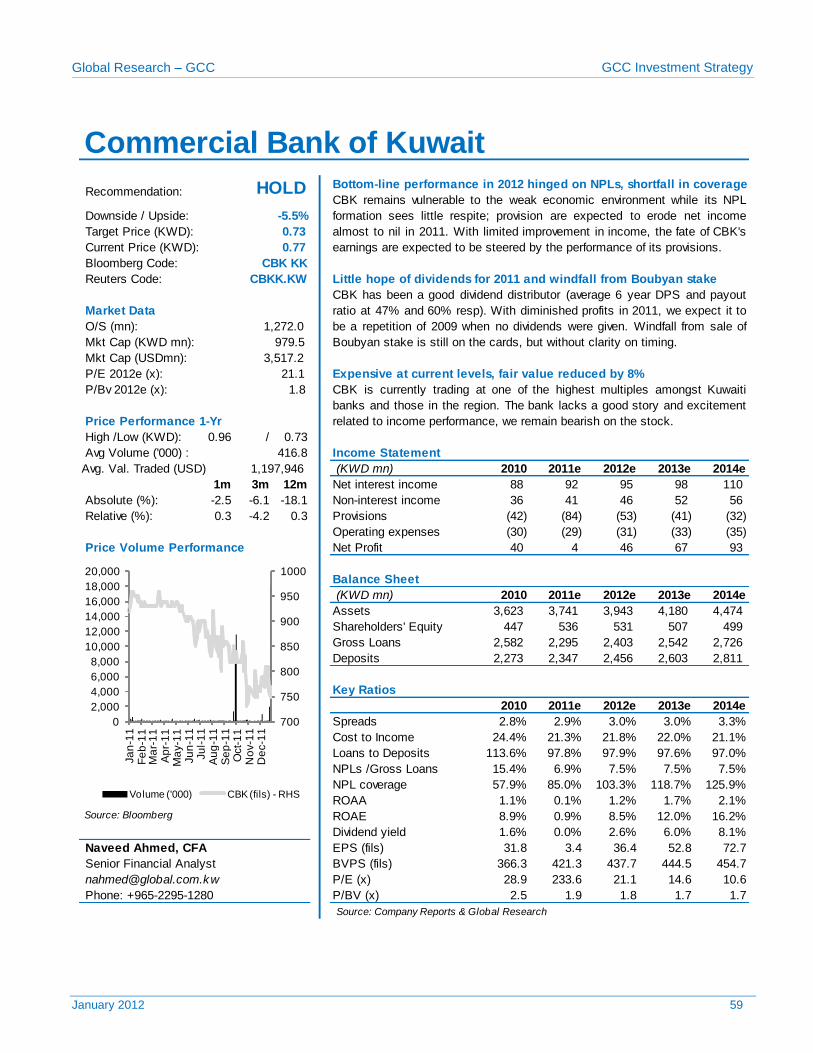
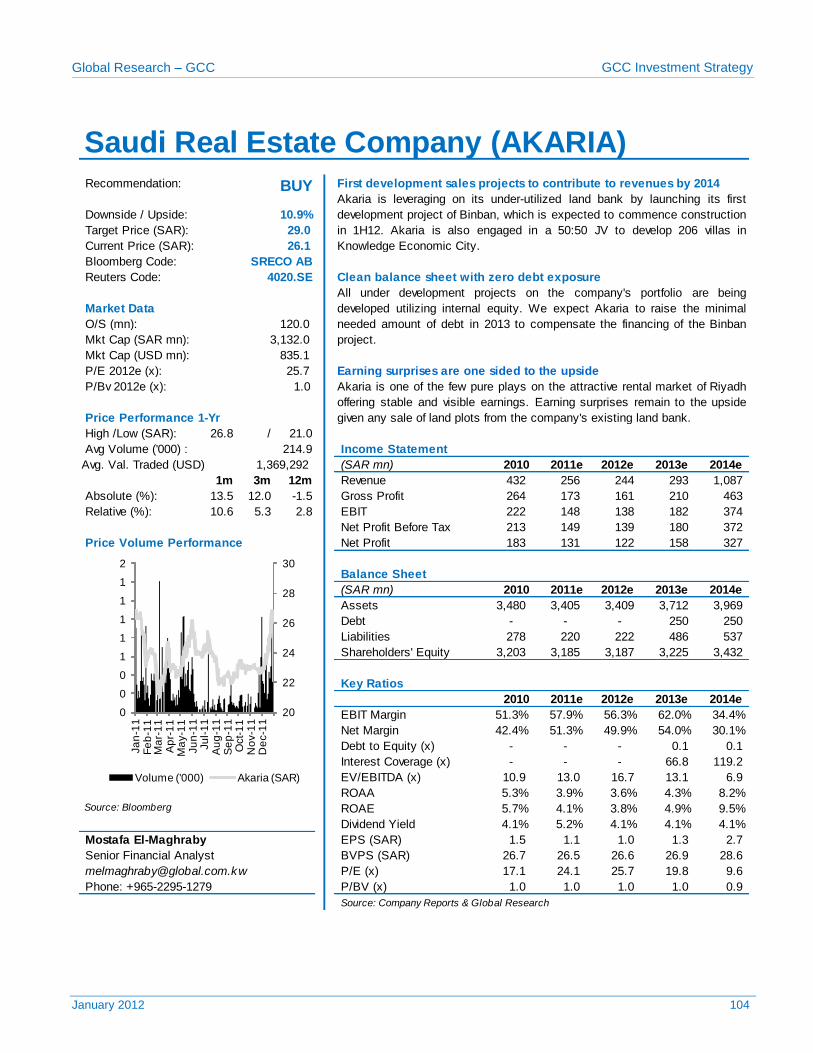
Commercial Bank of Kuw ait 59 Saudi Real Estate Company 104
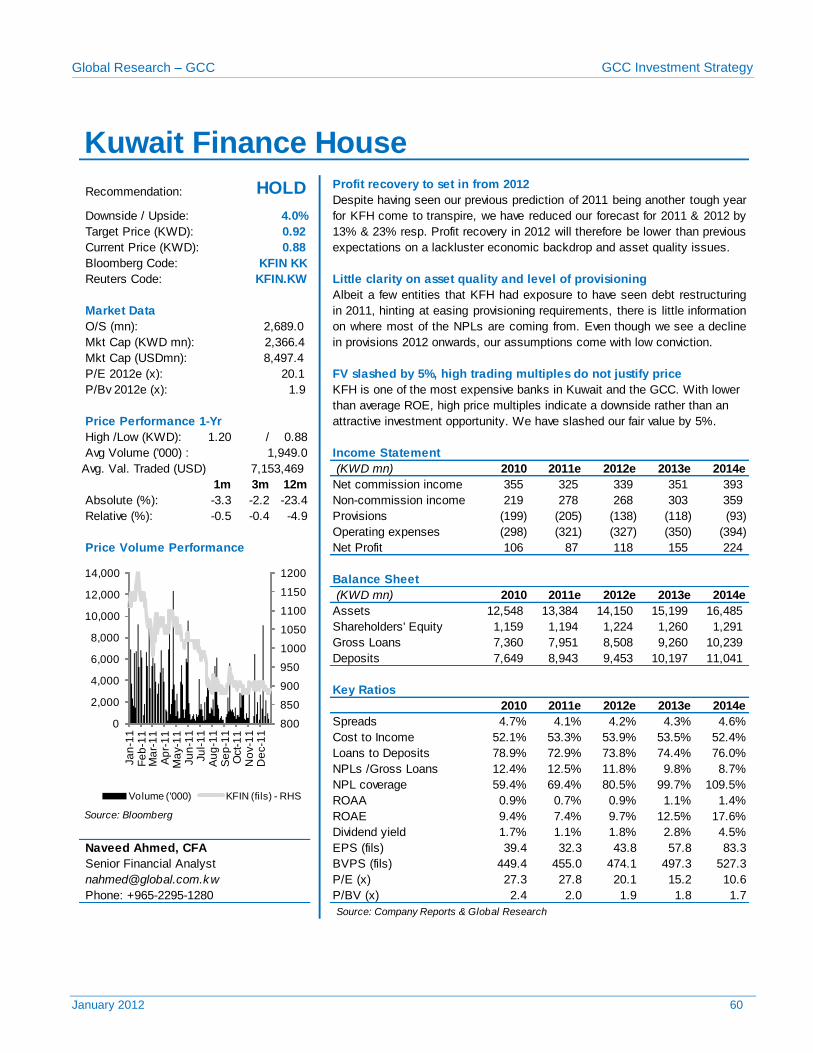
Kuw ait Finance House 60 Emaar Economic City 105
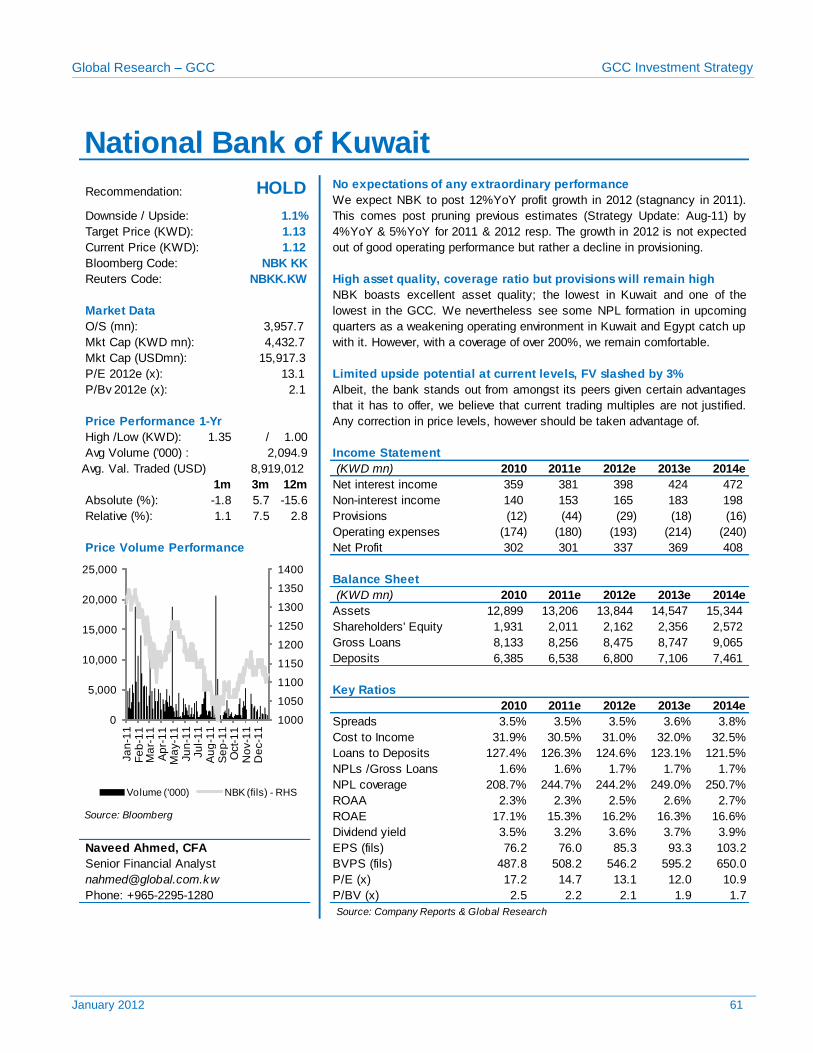
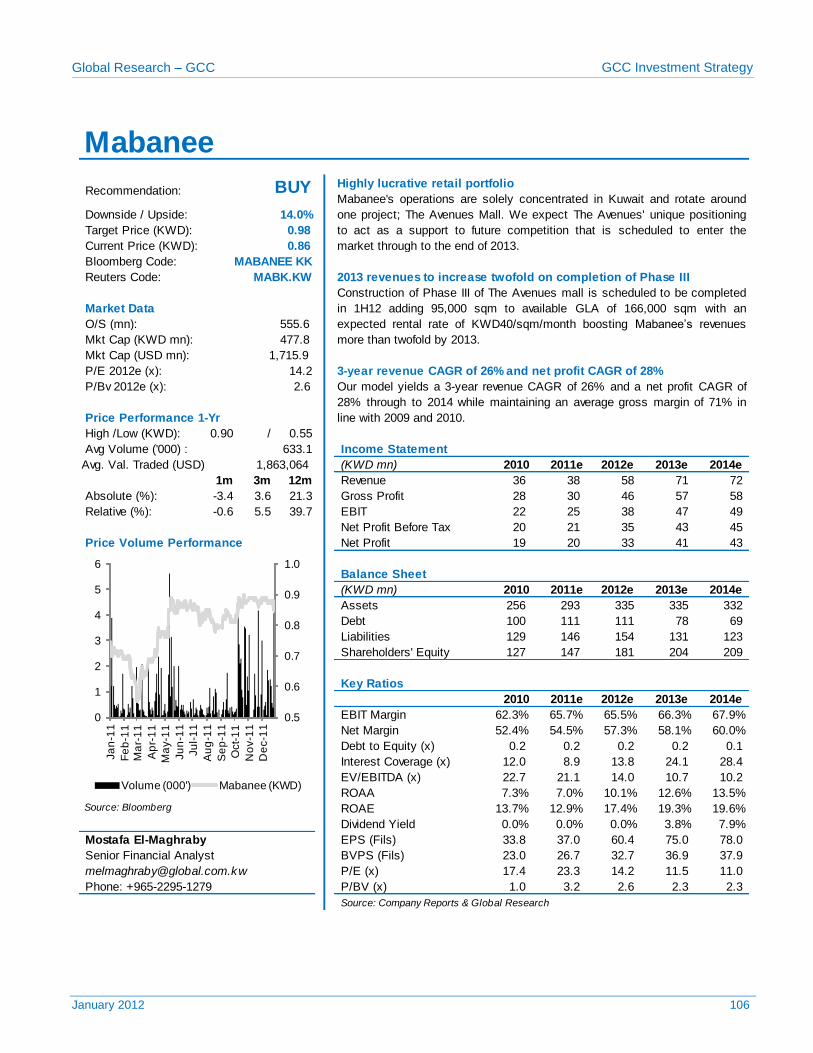
National Bank of Kuw ait 61 Mabanee 106
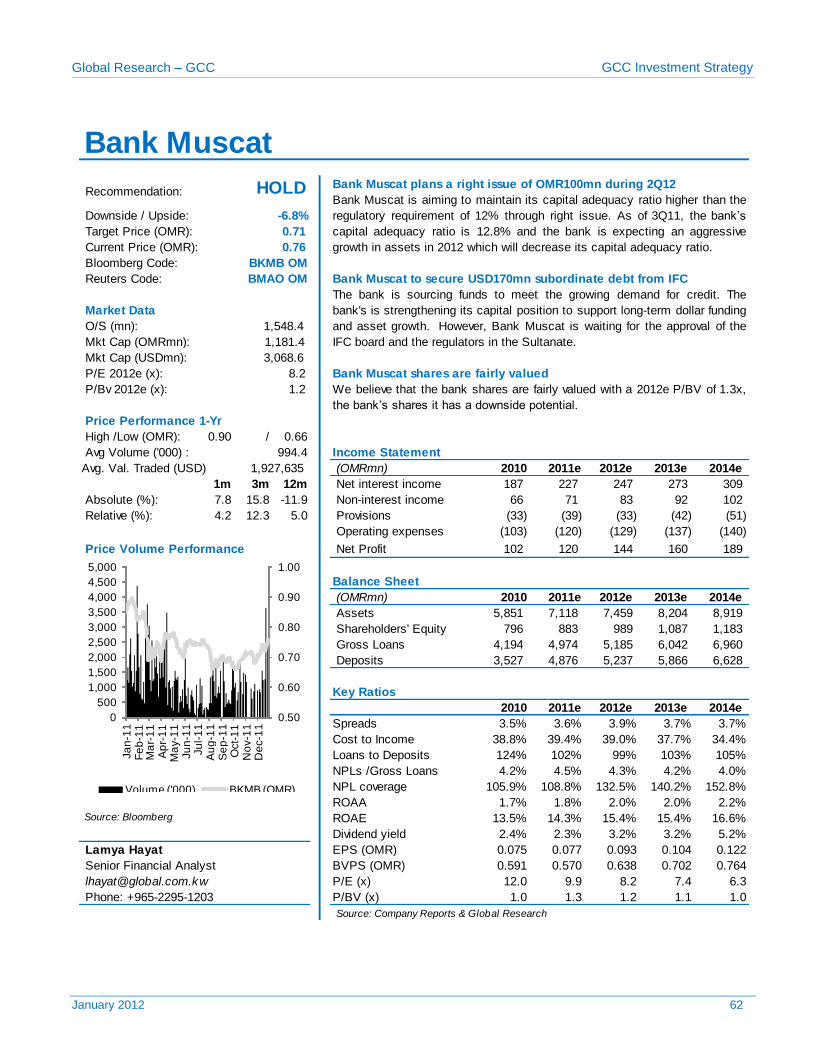
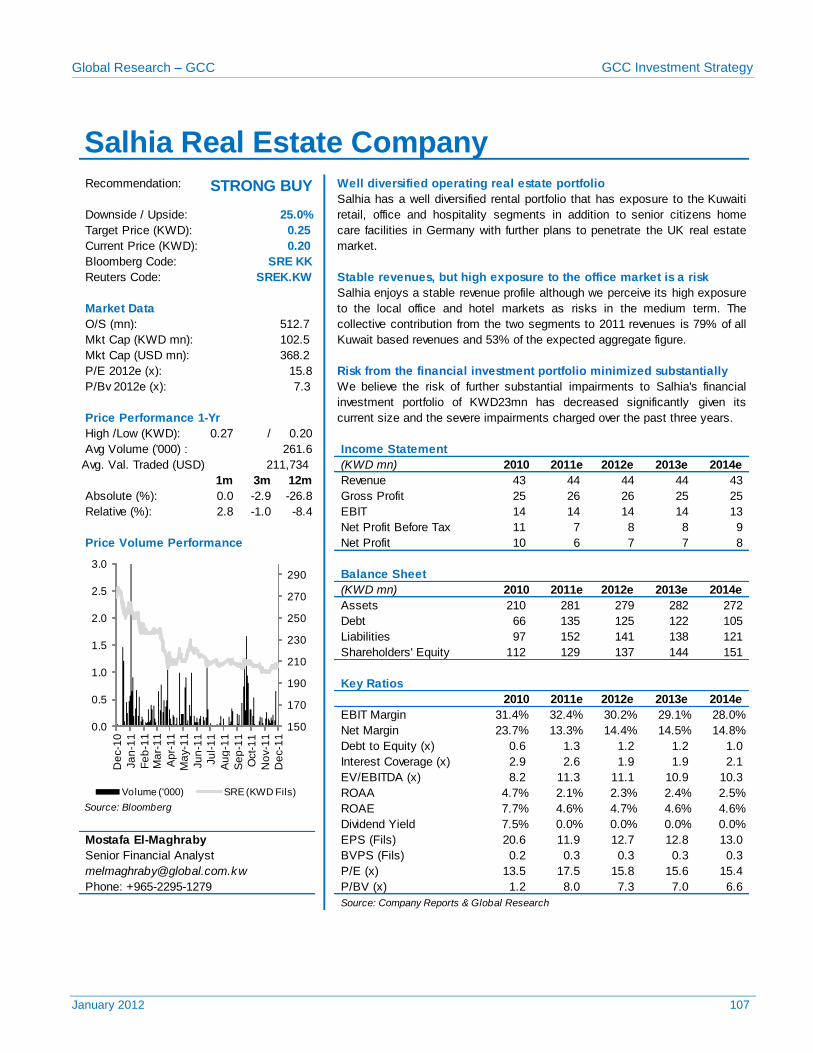
Bank Muscat 62 Salhia Real Estate Company 107
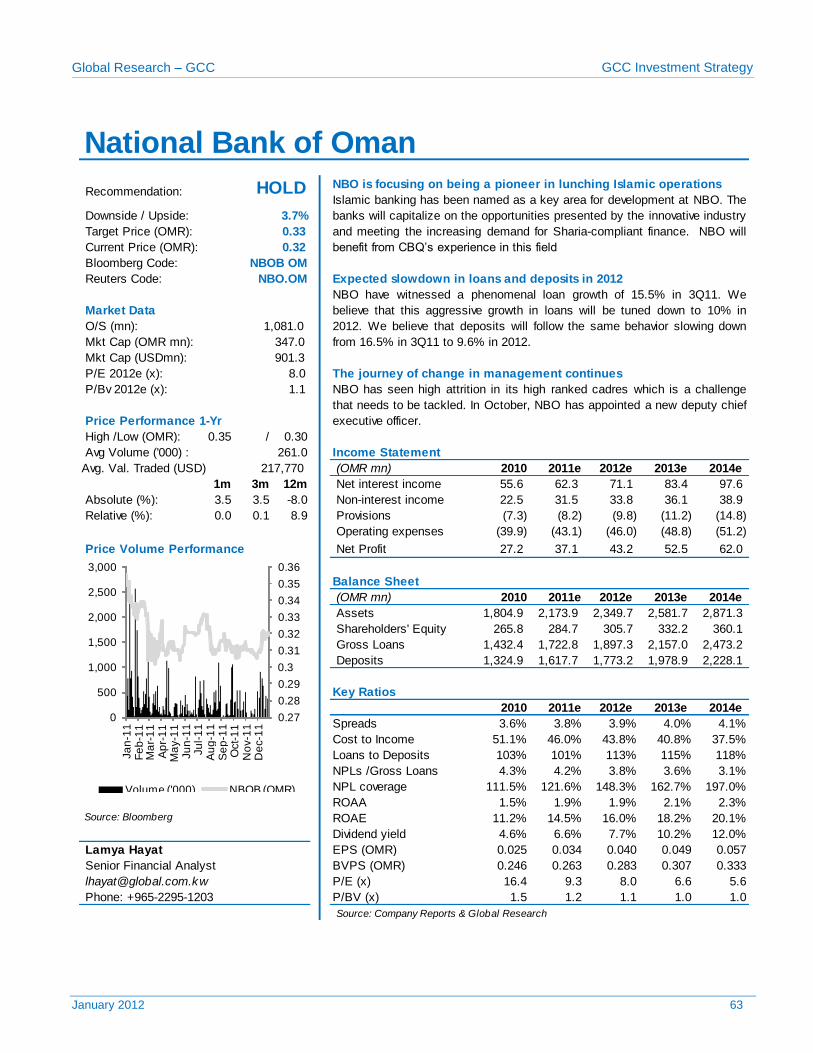
National Bank of Oman 63
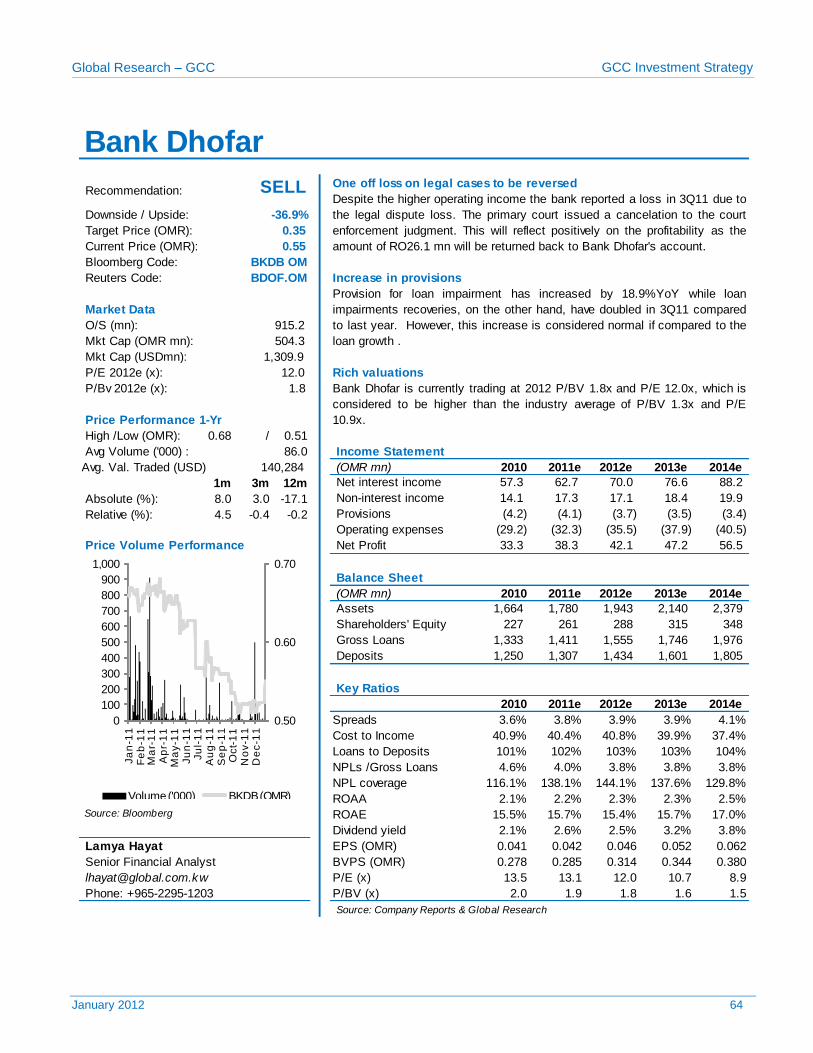
Bank Dhofar 64 Telecom Sector 108
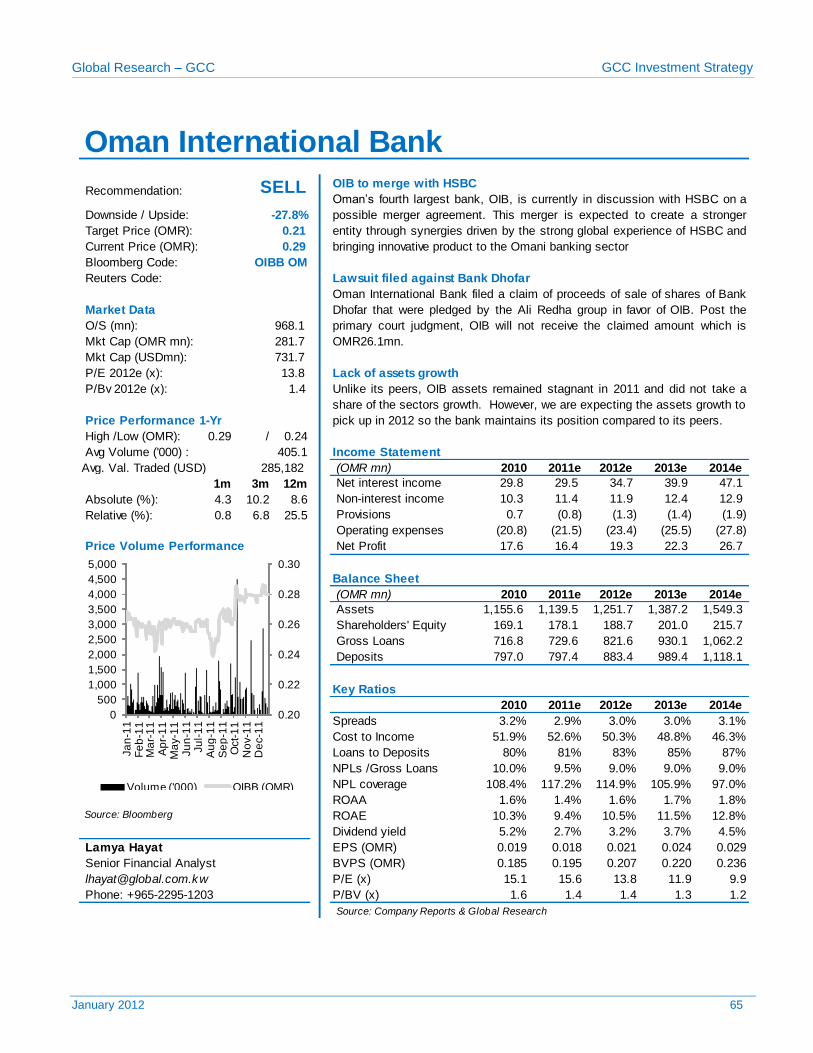
Oman International Bank 65 Etihad Etisalat Company 109
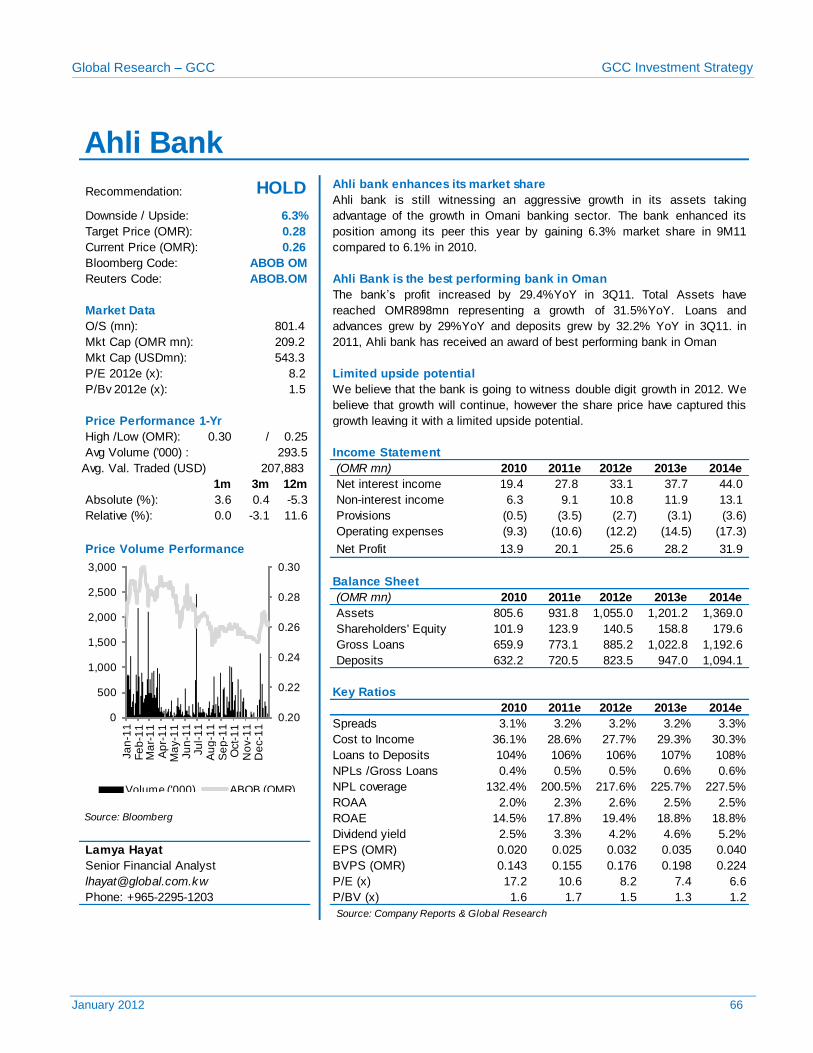
Ahli Bank 66 Saudi Telecom Company 110
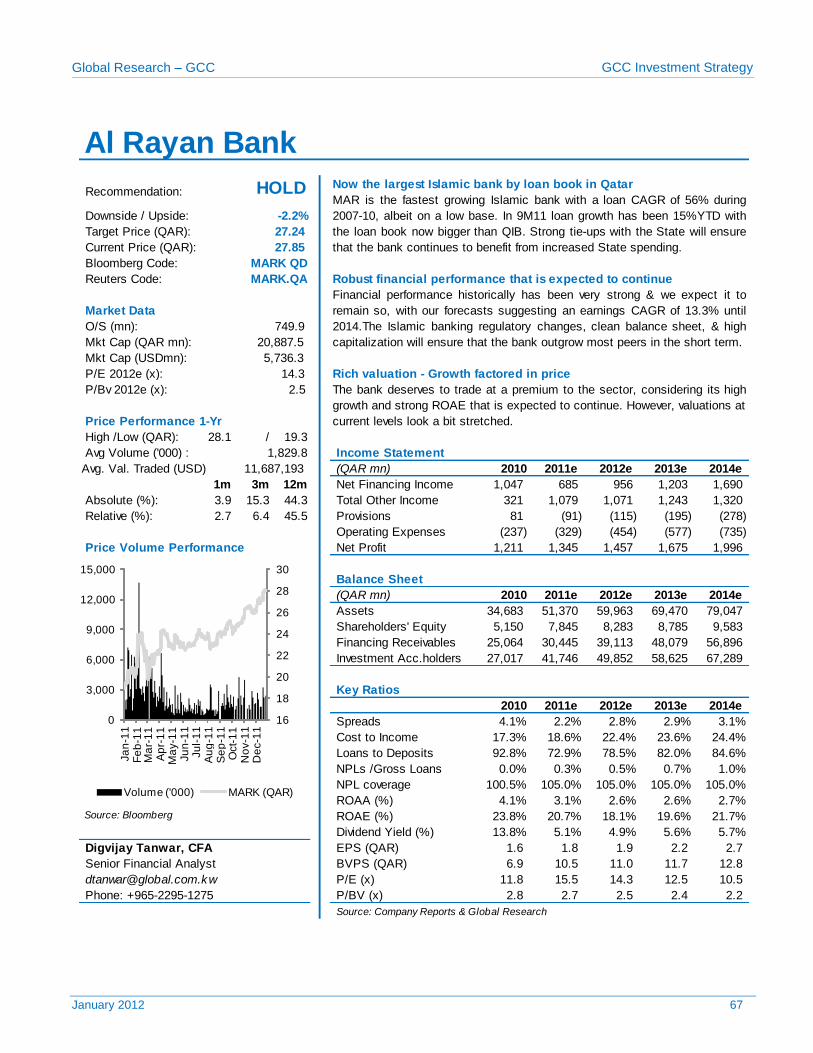
Al Rayan Bank 67 Bahrain Telecommunications Company 111
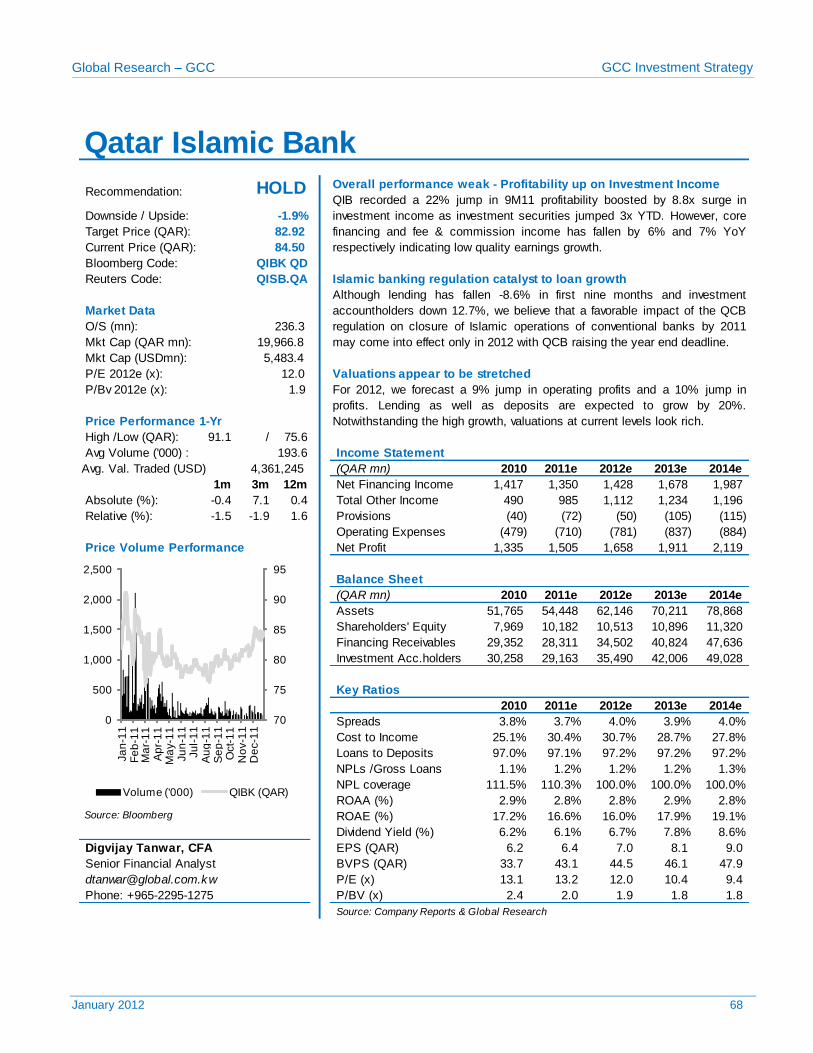
Qatar Islamic Bank 68 National Mobile Telecommunications Co. 112
Doha Bank 69 Mobile Telecommunications Company 113
Commercial Bank of Qatar 70 Qatar Telecom 114
Qatar National Bank 71 Vodafone Qatar 115
First Gulf Bank 72 Emirates Telecommunications Corporation 116
National Bank of Abu Dhabi 73 Omantel 117
Abu Dhabi Commercial Bank 74
Union National Bank 75 Utilities Sector 118
Emirates NBD 76 Qatar Electricity & Water Company 119
Abu Dhabi National Energy 120
Cement & Building Materials Sector 77 Saudi Electricity Company 121
Arabian Cement Co. 78
Saudi Cement Company 79 Others 122
Yamama Saudi Cement Company 80 Dubai Financial Market 123
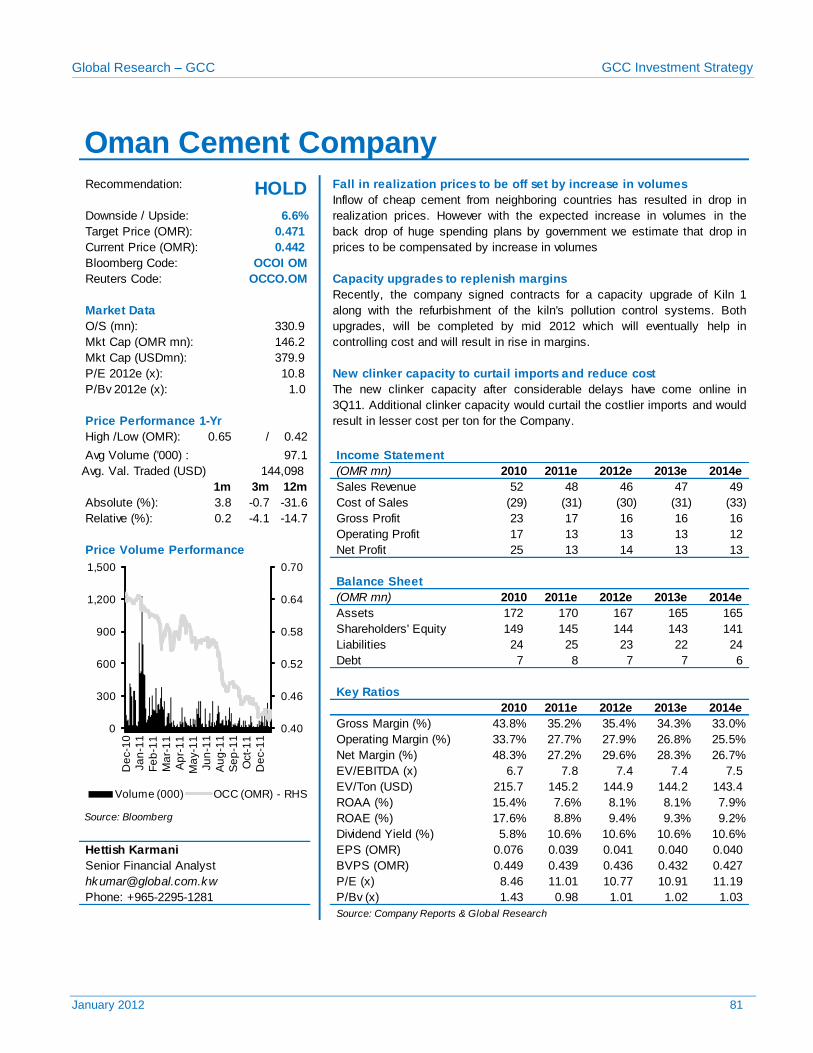
Oman Cement Company 81
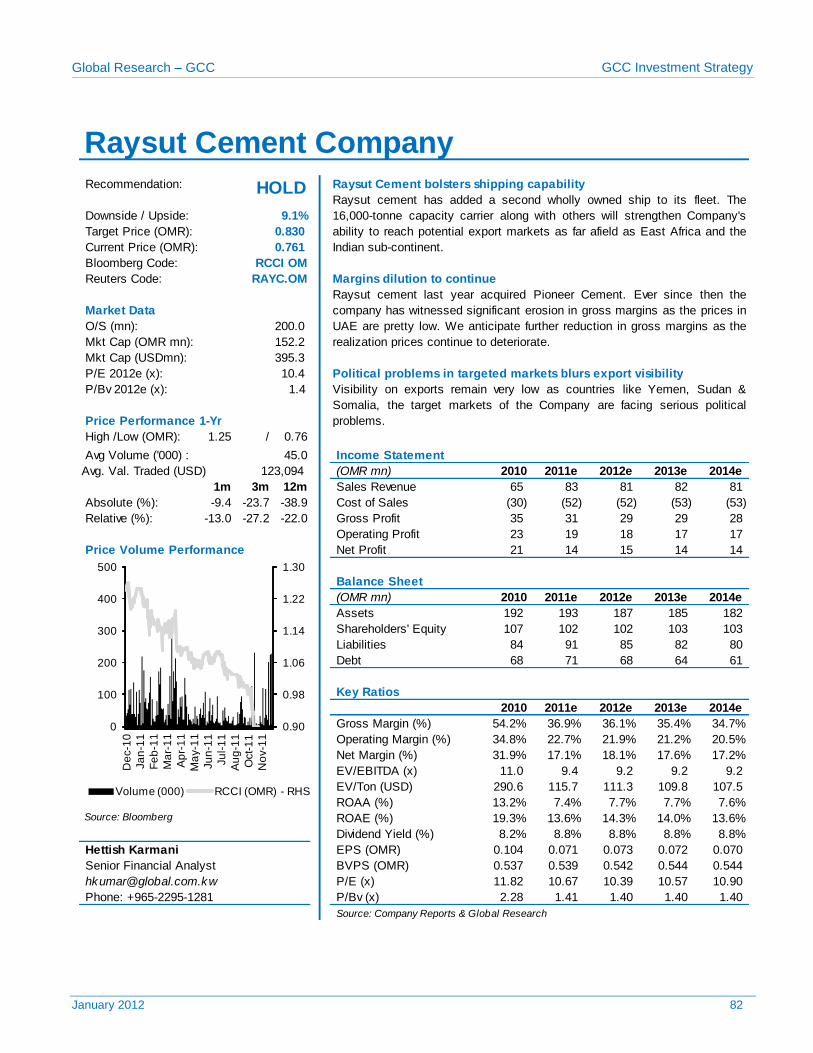
Raysut Cement Company 82 Appendix 124
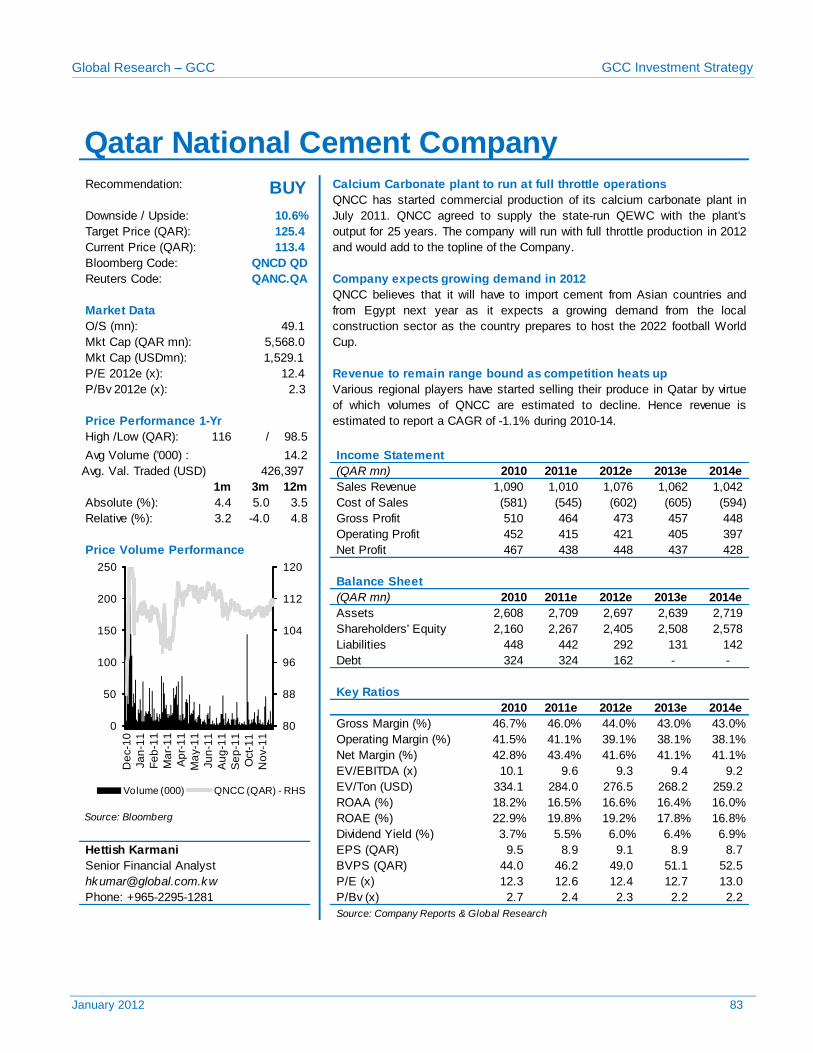
Qatar National Cement Company 83
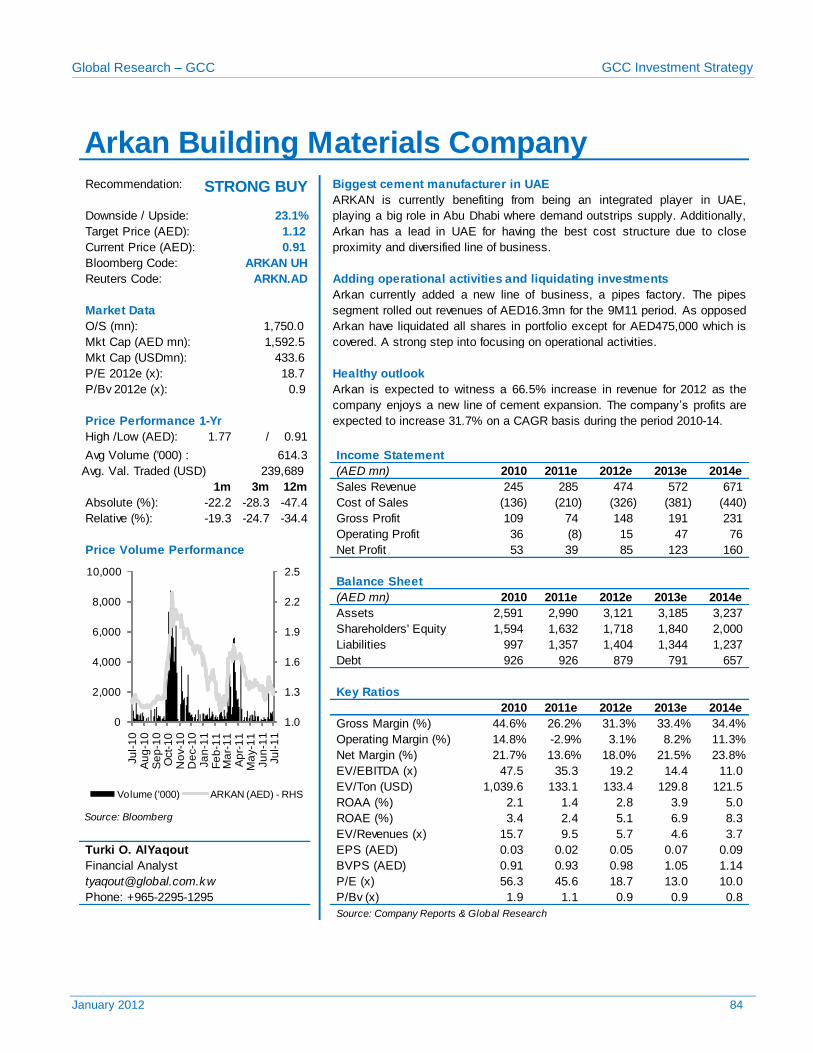
Arkan Building Materials Company 84 Disclosure 128
TABLE OF CONTENTS
Global Research – GCC GCC Investment Strategy
January 2012 5
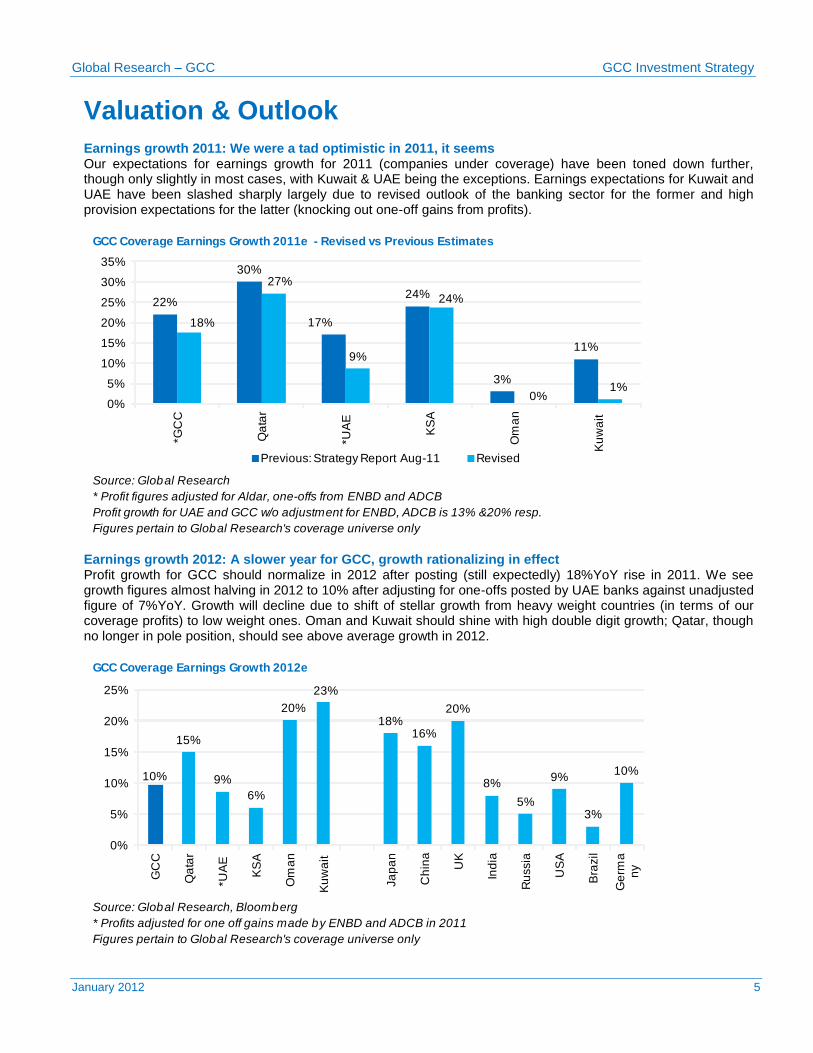
Valuation & Outlook Earnings growth 2011: We were a tad optimistic in 2011, it seems Our expectations for earnings growth for 2011 (companies under coverage) have been toned down further, though only slightly in most cases, with Kuwait & UAE being the exceptions. Earnings expectations for Kuwait and UAE have been slashed sharply largely due to revised outlook of the banking sector for the former and high provision expectations for the latter (knocking out one-off gains from profits).
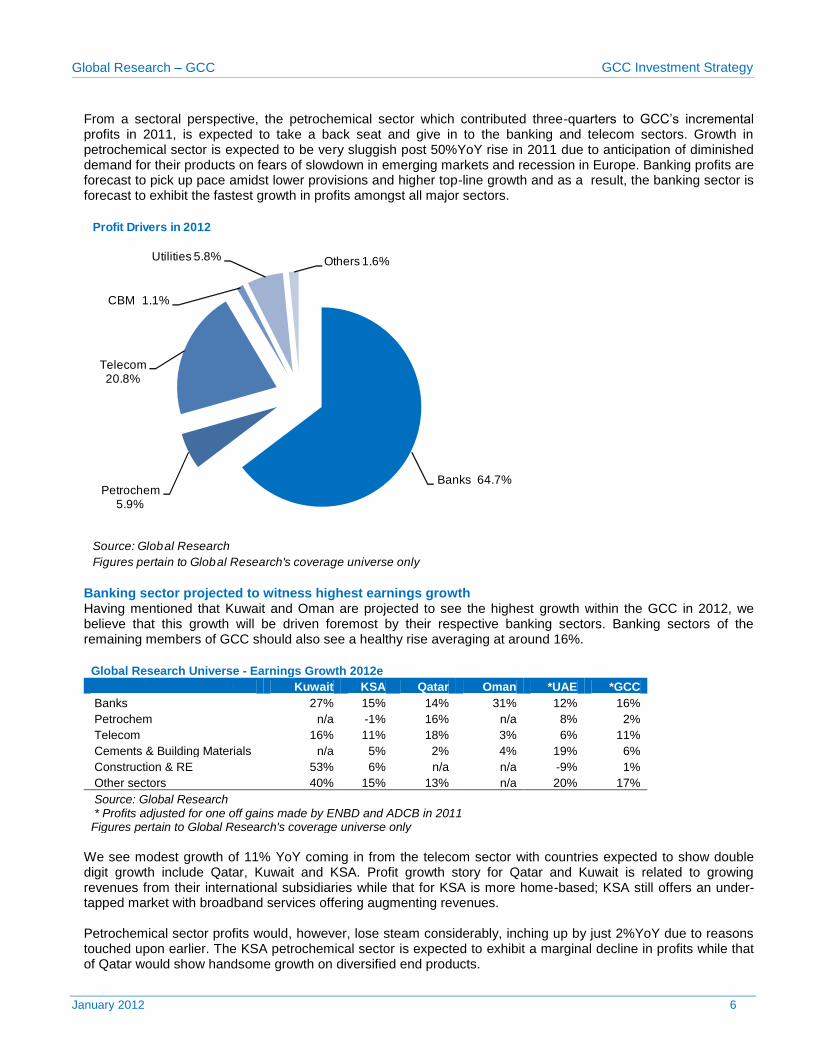
Earnings growth 2012: A slower year for GCC, growth rationalizing in effect Profit growth for GCC should normalize in 2012 after posting (still expectedly) 18%YoY rise in 2011. We see growth figures almost halving in 2012 to 10% after adjusting for one-offs posted by UAE banks against unadjusted figure of 7%YoY. Growth will decline due to shift of stellar growth from heavy weight countries (in terms of our coverage profits) to low weight ones. Oman and Kuwait should shine with high double digit growth; Qatar, though no longer in pole position, should see above average growth in 2012.
Source: Global Research
* Profit figures adjusted for Aldar, one-offs from ENBD and ADCB
Profit growth for UAE and GCC w/o adjustment for ENBD, ADCB is 13% &20% resp.
Figures pertain to Global Research's coverage universe only
GCC Coverage Earnings Growth 2011e - Revised vs Previous Estimates
22%
30%
17%
24%
3%
11%
18%
27%
9%
24%
0%1%
0%
5%
10%
15%
20%
25%
30%
35%
*GC
C
Qa
tar
*UA
E
KS
A
Om
an
Ku
wa
it
Previous: Strategy Report Aug-11 Revised
Source: Global Research, Bloomberg
* Profits adjusted for one off gains made by ENBD and ADCB in 2011
Figures pertain to Global Research's coverage universe only
GCC Coverage Earnings Growth 2012e
10%
15%
9%
6%
20%
23%
18%16%
20%
8%
5%
9%
3%
10%
0%
5%
10%
15%
20%
25%
GC
C
Qa
tar
*UA
E
KS
A
Om
an
Ku
wa
it
Ja
pa
n
Ch
ina
UK
Ind
ia
Ru
ssia
US
A
Bra
zil
Ge
rma
ny
Global Research – GCC GCC Investment Strategy
January 2012 6
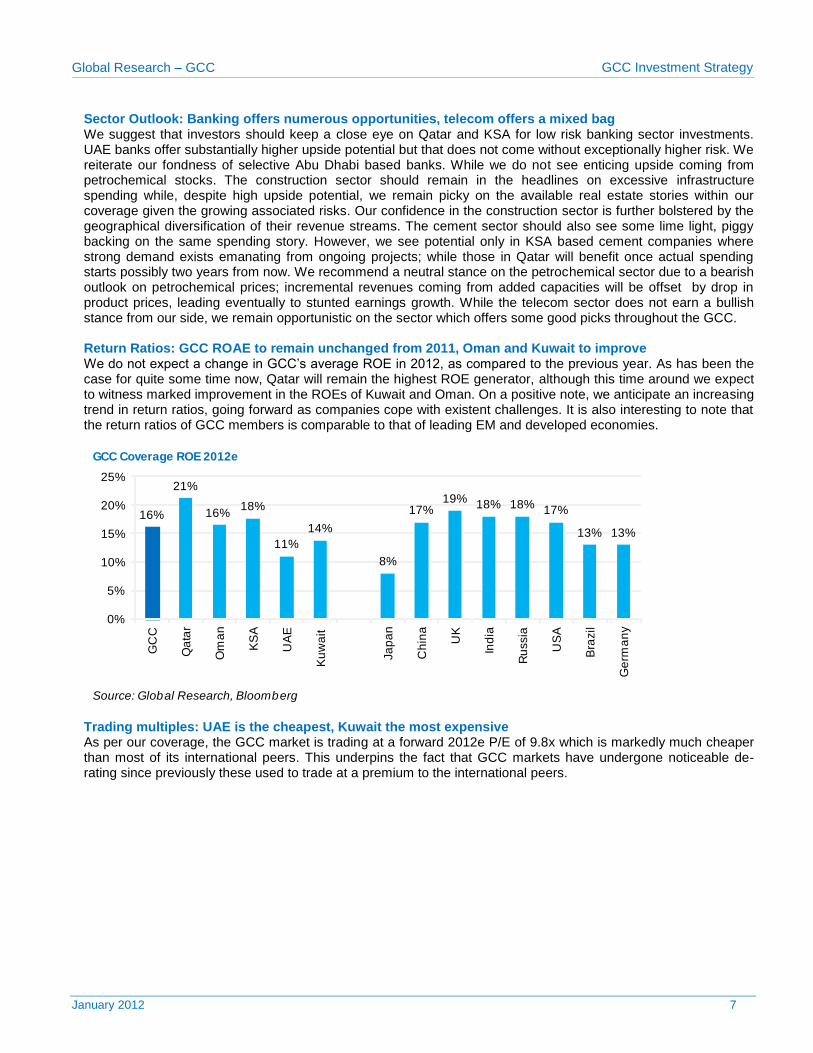
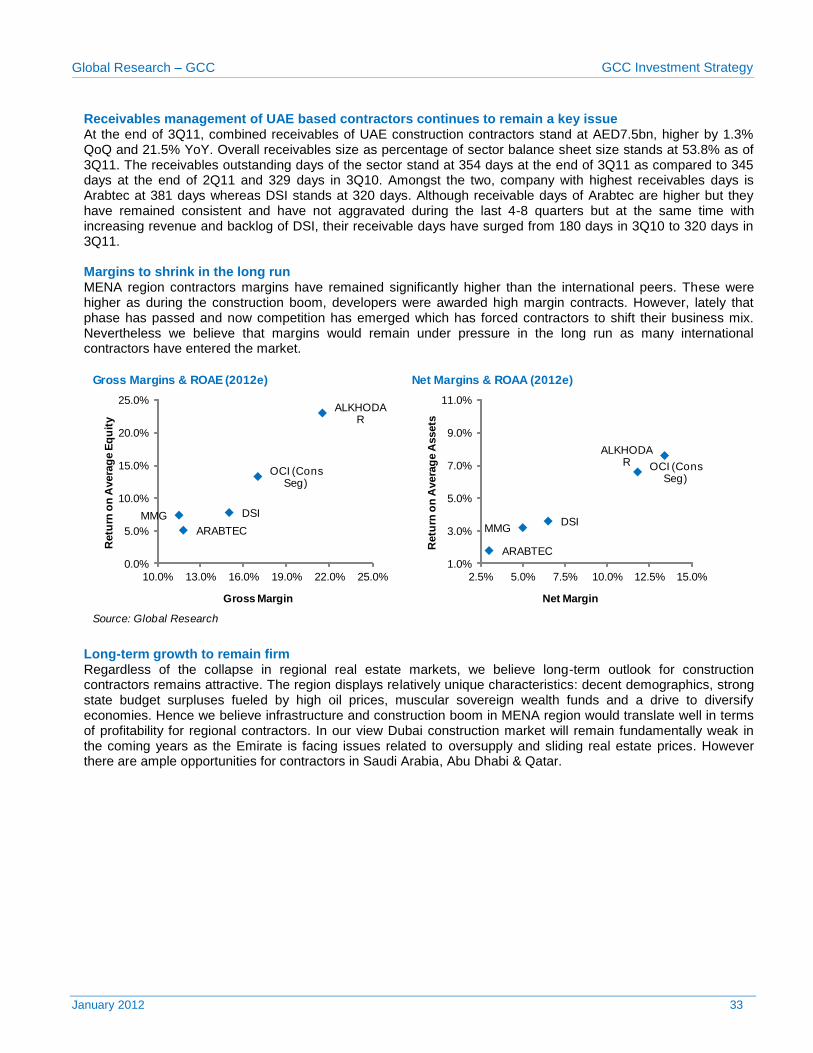
From a sectoral perspective, the petrochemical sector which contributed three-quarters to GCC’s incremental profits in 2011, is expected to take a back seat and give in to the banking and telecom sectors. Growth in petrochemical sector is expected to be very sluggish post 50%YoY rise in 2011 due to anticipation of diminished demand for their products on fears of slowdown in emerging markets and recession in Europe. Banking profits are forecast to pick up pace amidst lower provisions and higher top-line growth and as a result, the banking sector is forecast to exhibit the fastest growth in profits amongst all major sectors.
Banking sector projected to witness highest earnings growth Having mentioned that Kuwait and Oman are projected to see the highest growth within the GCC in 2012, we believe that this growth will be driven foremost by their respective banking sectors. Banking sectors of the remaining members of GCC should also see a healthy rise averaging at around 16%.
Global Research Universe - Earnings Growth 2012e
Kuwait KSA Qatar Oman *UAE *GCC
Banks 27% 15% 14% 31% 12% 16%
Petrochem n/a -1% 16% n/a 8% 2%
Telecom 16% 11% 18% 3% 6% 11%
Cements & Building Materials n/a 5% 2% 4% 19% 6%
Construction & RE 53% 6% n/a n/a -9% 1%
Other sectors 40% 15% 13% n/a 20% 17%
Source: Global Research * Profits adjusted for one off gains made by ENBD and ADCB in 2011 Figures pertain to Global Research's coverage universe only
We see modest growth of 11% YoY coming in from the telecom sector with countries expected to show double digit growth include Qatar, Kuwait and KSA. Profit growth story for Qatar and Kuwait is related to growing revenues from their international subsidiaries while that for KSA is more home-based; KSA still offers an under-tapped market with broadband services offering augmenting revenues. Petrochemical sector profits would, however, lose steam considerably, inching up by just 2%YoY due to reasons touched upon earlier. The KSA petrochemical sector is expected to exhibit a marginal decline in profits while that of Qatar would show handsome growth on diversified end products.
Profit Drivers in 2012
Source: Global Research
Figures pertain to Global Research's coverage universe only
Banks 64.7%Petrochem
5.9%
Telecom 20.8%
CBM 1.1%
Utilities 5.8% Others 1.6%
Global Research – GCC GCC Investment Strategy
January 2012 7
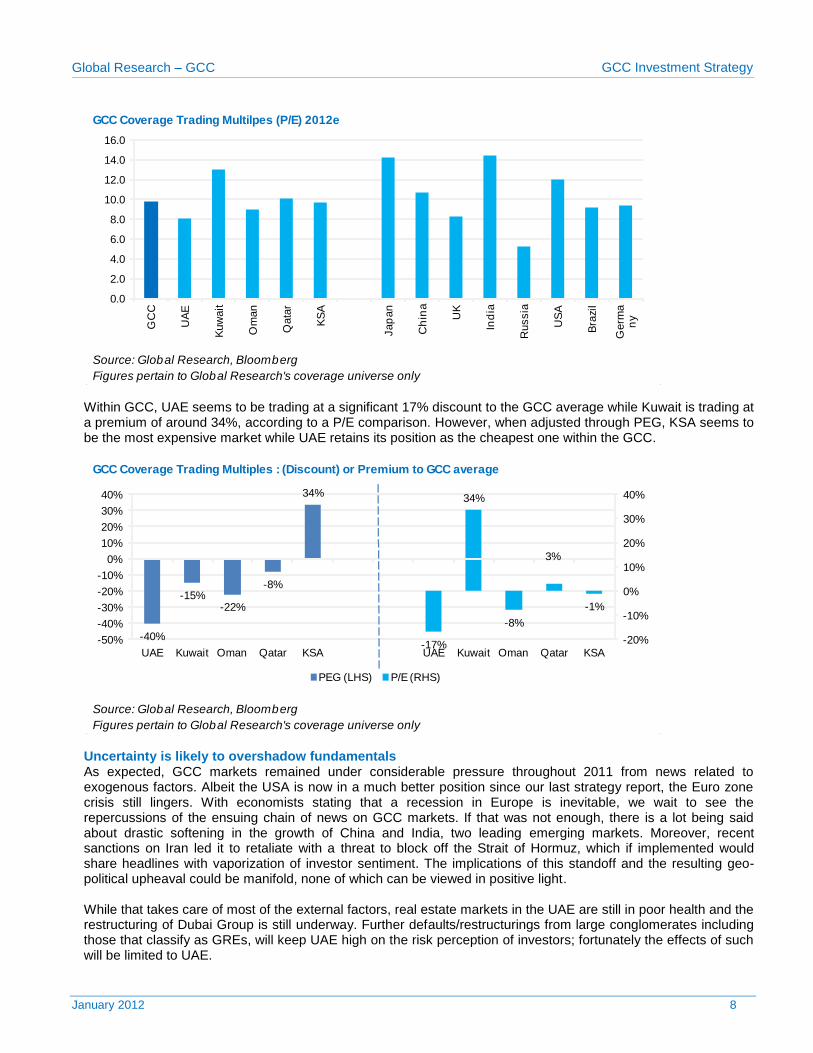
Sector Outlook: Banking offers numerous opportunities, telecom offers a mixed bag We suggest that investors should keep a close eye on Qatar and KSA for low risk banking sector investments. UAE banks offer substantially higher upside potential but that does not come without exceptionally higher risk. We reiterate our fondness of selective Abu Dhabi based banks. While we do not see enticing upside coming from petrochemical stocks. The construction sector should remain in the headlines on excessive infrastructure spending while, despite high upside potential, we remain picky on the available real estate stories within our coverage given the growing associated risks. Our confidence in the construction sector is further bolstered by the geographical diversification of their revenue streams. The cement sector should also see some lime light, piggy backing on the same spending story. However, we see potential only in KSA based cement companies where strong demand exists emanating from ongoing projects; while those in Qatar will benefit once actual spending starts possibly two years from now. We recommend a neutral stance on the petrochemical sector due to a bearish outlook on petrochemical prices; incremental revenues coming from added capacities will be offset by drop in product prices, leading eventually to stunted earnings growth. While the telecom sector does not earn a bullish stance from our side, we remain opportunistic on the sector which offers some good picks throughout the GCC. Return Ratios: GCC ROAE to remain unchanged from 2011, Oman and Kuwait to improve We do not expect a change in GCC’s average ROE in 2012, as compared to the previous year. As has been the case for quite some time now, Qatar will remain the highest ROE generator, although this time around we expect to witness marked improvement in the ROEs of Kuwait and Oman. On a positive note, we anticipate an increasing trend in return ratios, going forward as companies cope with existent challenges. It is also interesting to note that the return ratios of GCC members is comparable to that of leading EM and developed economies.
Trading multiples: UAE is the cheapest, Kuwait the most expensive As per our coverage, the GCC market is trading at a forward 2012e P/E of 9.8x which is markedly much cheaper than most of its international peers. This underpins the fact that GCC markets have undergone noticeable de-rating since previously these used to trade at a premium to the international peers.
GCC Coverage ROE 2012e
Source: Global Research, Bloomberg
16%
21%
16%18%
11%
14%
8%
17%19%
18% 18%17%
13% 13%
0%
5%
10%
15%
20%
25%
GC
C
Qa
tar
Om
an
KS
A
UA
E
Ku
wa
it
Ja
pa
n
Ch
ina
UK
Ind
ia
Ru
ssia
US
A
Bra
zil
Ge
rma
ny
Global Research – GCC GCC Investment Strategy
January 2012 8
Within GCC, UAE seems to be trading at a significant 17% discount to the GCC average while Kuwait is trading at a premium of around 34%, according to a P/E comparison. However, when adjusted through PEG, KSA seems to be the most expensive market while UAE retains its position as the cheapest one within the GCC.
Uncertainty is likely to overshadow fundamentals As expected, GCC markets remained under considerable pressure throughout 2011 from news related to exogenous factors. Albeit the USA is now in a much better position since our last strategy report, the Euro zone crisis still lingers. With economists stating that a recession in Europe is inevitable, we wait to see the repercussions of the ensuing chain of news on GCC markets. If that was not enough, there is a lot being said about drastic softening in the growth of China and India, two leading emerging markets. Moreover, recent sanctions on Iran led it to retaliate with a threat to block off the Strait of Hormuz, which if implemented would share headlines with vaporization of investor sentiment. The implications of this standoff and the resulting geo-political upheaval could be manifold, none of which can be viewed in positive light. While that takes care of most of the external factors, real estate markets in the UAE are still in poor health and the restructuring of Dubai Group is still underway. Further defaults/restructurings from large conglomerates including those that classify as GREs, will keep UAE high on the risk perception of investors; fortunately the effects of such will be limited to UAE.
GCC Coverage Trading Multilpes (P/E) 2012e
Source: Global Research, Bloomberg
Figures pertain to Global Research's coverage universe only
0.0
2.0
4.0
6.0
8.0
10.0
12.0
14.0
16.0G
CC
UA
E
Kuw
ait
Om
an
Qata
r
KS
A
Jap
an
Ch
ina
UK
Ind
ia
Russia
US
A
Bra
zil
Germ
an
y
GCC Coverage Trading Multiples : (Discount) or Premium to GCC average
Source: Global Research, Bloomberg
Figures pertain to Global Research's coverage universe only
-40%
-15%-22%
-8%
34%
-17%
34%
-8%
3%
-1%
-20%
-10%
0%
10%
20%
30%
40%
-50%
-40%
-30%
-20%
-10%
0%
10%
20%
30%
40%
UAE Kuwait Oman Qatar KSA UAE Kuwait Oman Qatar KSA
PEG (LHS) P/E (RHS)
Global Research – GCC GCC Investment Strategy
January 2012 9
Re-rating is still possible Despite the gloomy picture, some events may still propel markets in the right direction. If oil prices move in a positive direction, say above USD120/barrel, regional surpluses will swell further than expectations creating positive sentiment in the market. The petrochemical sector will be the first and the largest beneficiary and has the capacity (market weight) to actually thrust the index forward. Possible MSCI upgrade of UAE and Qatar in 2012 would trigger sizeable interest followed by inflows into these markets. This comes at a very opportune time, when Taiwan and/or South Korea could see a possible upgrade into developed markets, leaving EM indexed funds to scramble for possible replacements. Regulatory changes, like those relating to increasing of foreign ownership limits (case in point: UAE and Qatar) and opening the market to foreign owners (case in point: KSA) will lead to significant inflows into the market, more so in the case of KSA which is the largest stock exchange in the GCC. The FOL of most stocks in Qatar and UAE are already maxed out and any relaxation in the limits will be met with cheer from foreign investors, not to mention that it is already a precondition to the MSCI status upgrade to EM. Resolution of asset quality issues of UAE based banks, a slow-down in corporate defaults and a confirmation from GREs that liquidity positions are in control, would send the right message across. Investors that draw immense riskiness from these factors will see their fears assuaged, inducing a fresh rally in the markets. Similarly, if developmental plans being carried out by governments accelerate and particularly in Kuwait’s case, any actual implementation of the announced projects would bring about a sudden and positive shift in our outlook of the country.
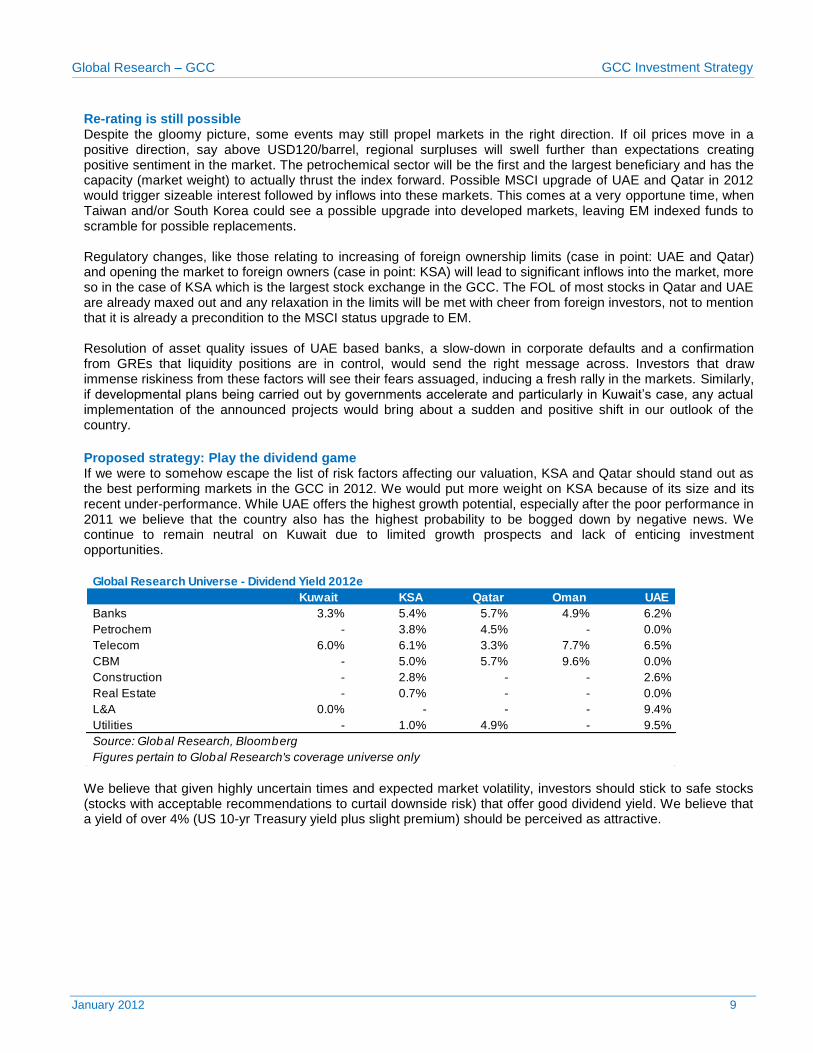
Proposed strategy: Play the dividend game If we were to somehow escape the list of risk factors affecting our valuation, KSA and Qatar should stand out as the best performing markets in the GCC in 2012. We would put more weight on KSA because of its size and its recent under-performance. While UAE offers the highest growth potential, especially after the poor performance in 2011 we believe that the country also has the highest probability to be bogged down by negative news. We continue to remain neutral on Kuwait due to limited growth prospects and lack of enticing investment opportunities.
We believe that given highly uncertain times and expected market volatility, investors should stick to safe stocks (stocks with acceptable recommendations to curtail downside risk) that offer good dividend yield. We believe that a yield of over 4% (US 10-yr Treasury yield plus slight premium) should be perceived as attractive.
Kuwait KSA Qatar Oman UAE
Banks 3.3% 5.4% 5.7% 4.9% 6.2%
Petrochem - 3.8% 4.5% - 0.0%
Telecom 6.0% 6.1% 3.3% 7.7% 6.5%
CBM - 5.0% 5.7% 9.6% 0.0%
Construction - 2.8% - - 2.6%
Real Estate - 0.7% - - 0.0%
L&A 0.0% - - - 9.4%
Utilities - 1.0% 4.9% - 9.5%
Figures pertain to Global Research's coverage universe only
Global Research Universe - Dividend Yield 2012e
Source: Global Research, Bloomberg
Global Research – GCC GCC Investment Strategy
January 2012 10
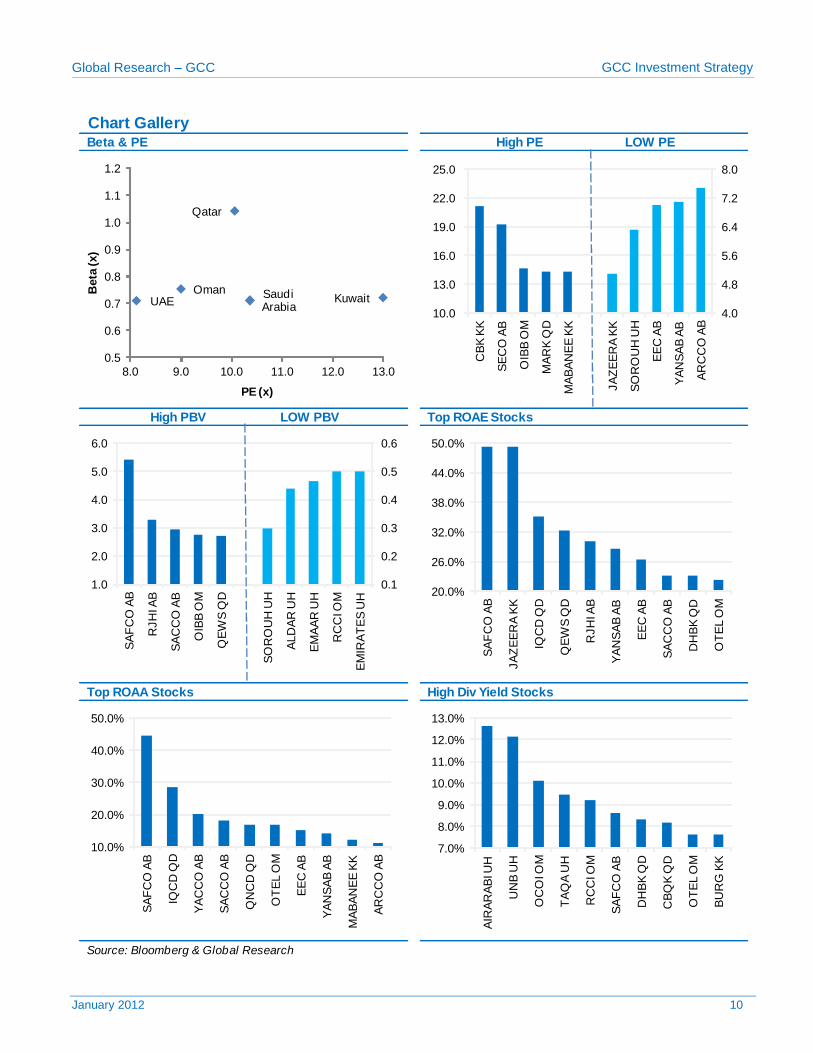
Chart GalleryBeta & PE High PE LOW PE
High PBV LOW PBV Top ROAE Stocks
Top ROAA Stocks High Div Yield Stocks
Source: Bloomberg & Global Research
0.1
0.2
0.3
0.4
0.5
0.6
1.0
2.0
3.0
4.0
5.0
6.0
SA
FC
O A
B
RJH
I AB
SA
CC
O A
B
OIB
B O
M
QE
WS
QD
SO
RO
UH
UH
ALD
AR
UH
EM
AA
R U
H
RC
CI O
M
EM
IRA
TE
S U
H 20.0%
26.0%
32.0%
38.0%
44.0%
50.0%
SA
FC
O A
B
JA
ZE
ER
A K
K
IQC
D Q
D
QE
WS
QD
RJH
I AB
YA
NS
AB
AB
EE
C A
B
SA
CC
O A
B
DH
BK
QD
OT
EL O
M
10.0%
20.0%
30.0%
40.0%
50.0%
SA
FC
O A
B
IQC
D Q
D
YA
CC
O A
B
SA
CC
O A
B
QN
CD
QD
OT
EL O
M
EE
C A
B
YA
NS
AB
AB
MA
BA
NE
E K
K
AR
CC
O A
B
7.0%
8.0%
9.0%
10.0%
11.0%
12.0%
13.0%
AIR
AR
AB
I UH
UN
B U
H
OC
OI O
M
TA
QA
UH
RC
CI O
M
SA
FC
O A
B
DH
BK
QD
CB
QK
QD
OT
EL O
M
BU
RG
KK
4.0
4.8
5.6
6.4
7.2
8.0
10.0
13.0
16.0
19.0
22.0
25.0
CB
K K
K
SE
CO
AB
OIB
B O
M
MA
RK
QD
MA
BA
NE
E K
K
JA
ZE
ER
A K
K
SO
RO
UH
UH
EE
C A
B
YA
NS
AB
AB
AR
CC
O A
B
OmanKuwait
Qatar
UAESaudi Arabia
0.5
0.6
0.7
0.8
0.9
1.0
1.1
1.2
8.0 9.0 10.0 11.0 12.0 13.0
Beta
(x)
PE (x)
Global Research – GCC GCC Investment Strategy
January 2012 11
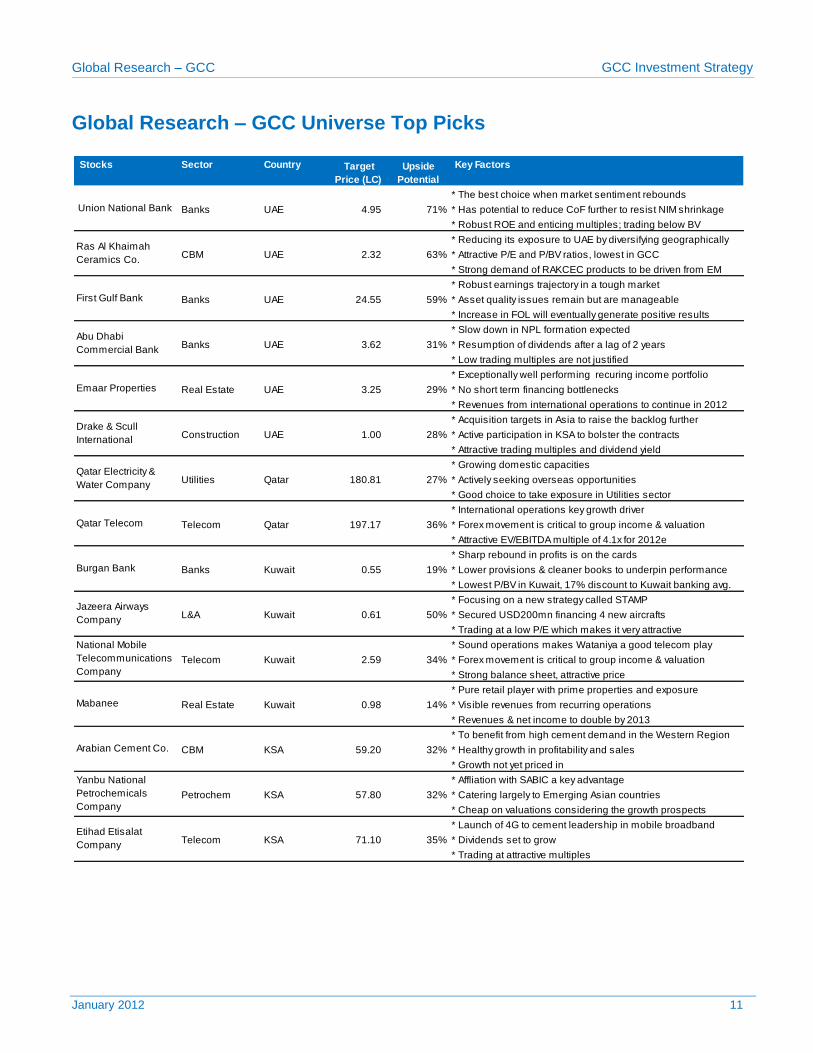
Global Research – GCC Universe Top Picks
Stocks Sector Country Key Factors
* The best choice when market sentiment rebounds
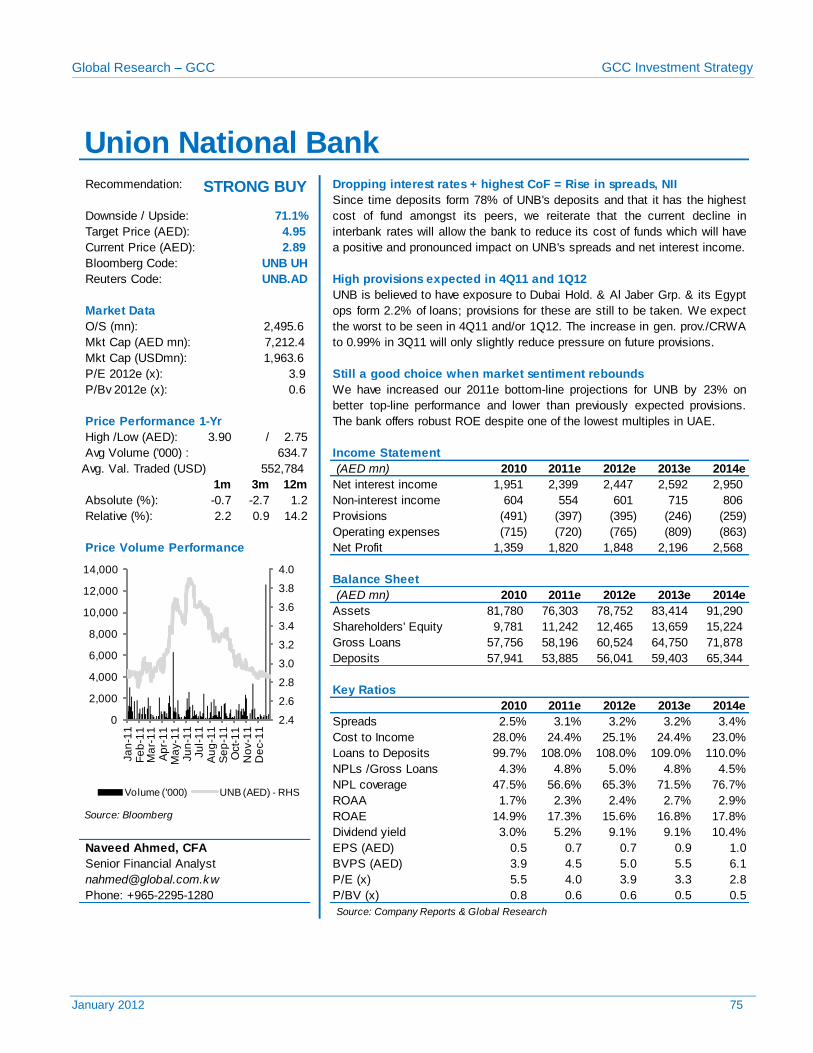
Banks UAE 4.95 71% * Has potential to reduce CoF further to resist NIM shrinkage
* Robust ROE and enticing multiples; trading below BV
* Reducing its exposure to UAE by diversifying geographically
CBM UAE 2.32 63% * Attractive P/E and P/BV ratios, lowest in GCC
* Strong demand of RAKCEC products to be driven from EM
* Robust earnings trajectory in a tough market
Banks UAE 24.55 59% * Asset quality issues remain but are manageable
* Increase in FOL will eventually generate positive results
* Slow down in NPL formation expected
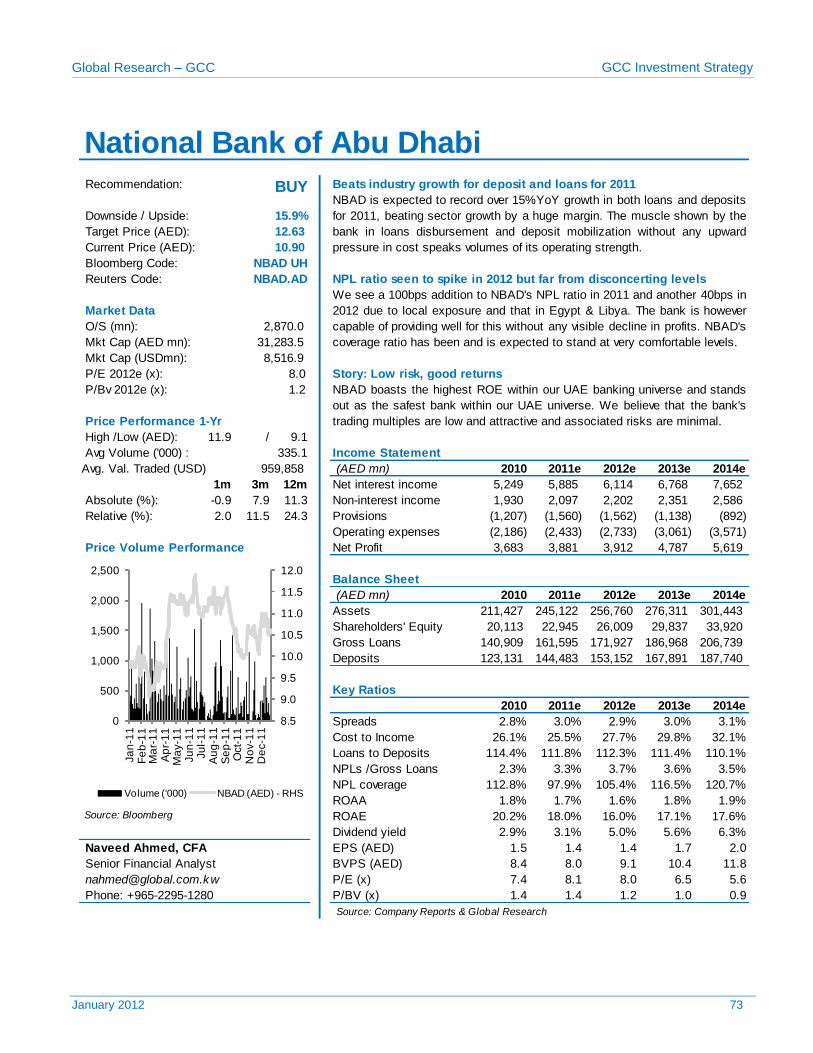
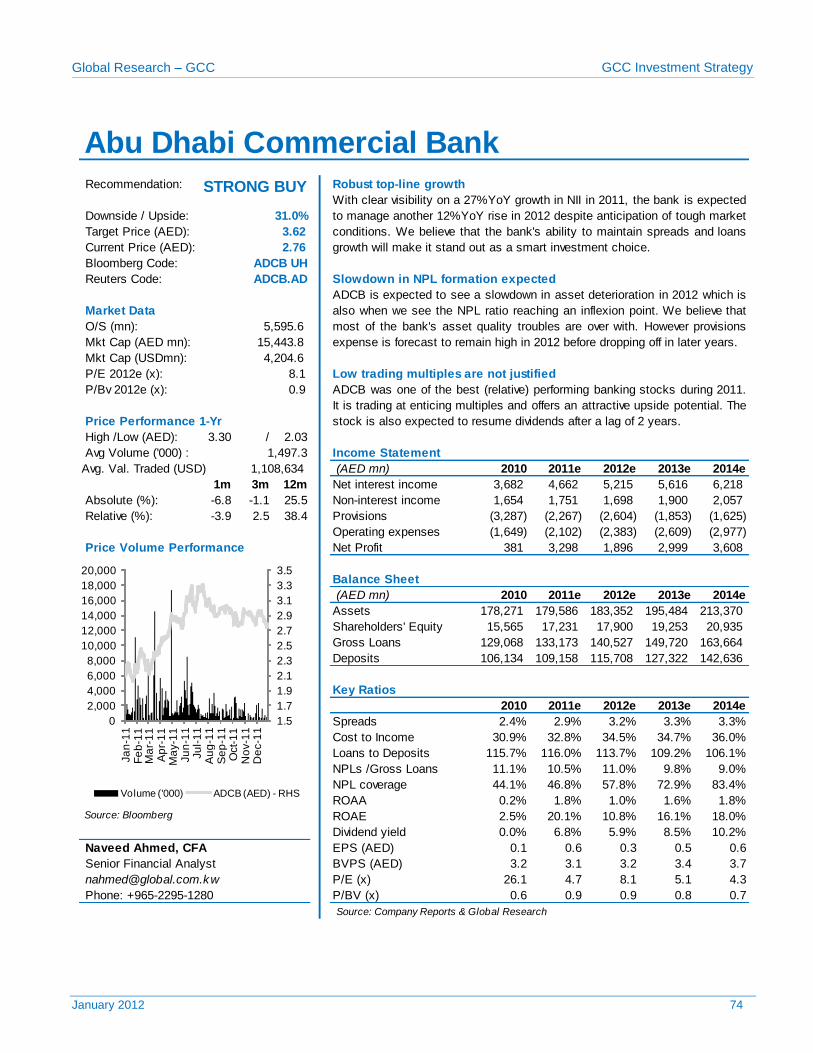
Banks UAE 3.62 31% * Resumption of dividends after a lag of 2 years
* Low trading multiples are not justified
* Exceptionally well performing recuring income portfolio
Real Estate UAE 3.25 29% * No short term financing bottlenecks
* Revenues from international operations to continue in 2012
* Acquisition targets in Asia to raise the backlog further
Construction UAE 1.00 28% * Active participation in KSA to bolster the contracts
* Trading at a low P/E which makes it very attractive
* Sound operations makes Wataniya a good telecom play
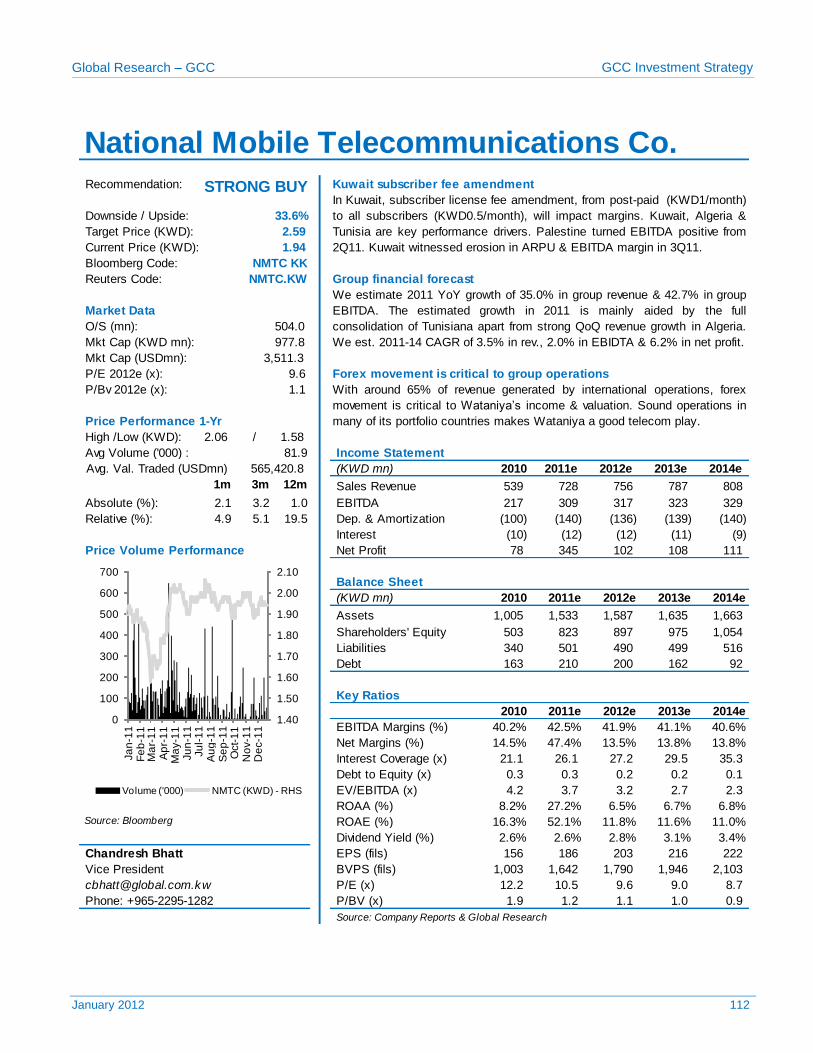
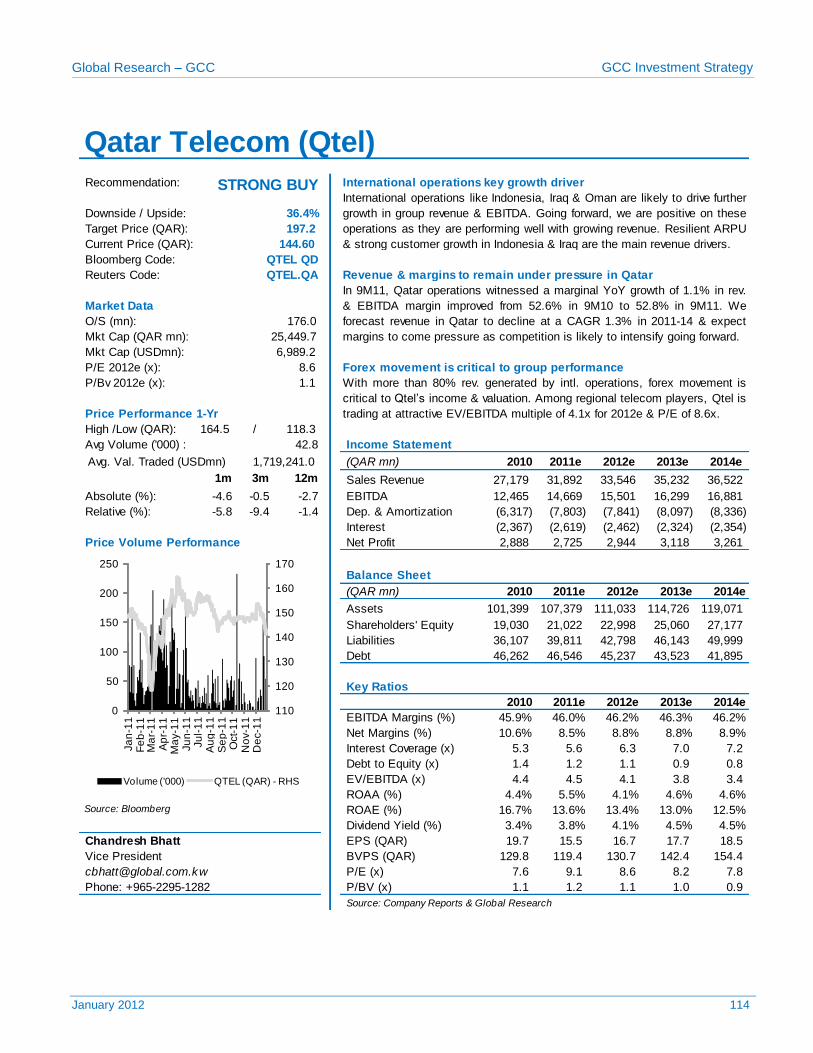
Telecom Kuwait 2.59 34% * Forex movement is critical to group income & valuation
* Strong balance sheet, attractive price
* Pure retail player with prime properties and exposure
Real Estate Kuwait 0.98 14% * Visible revenues from recurring operations
* Revenues & net income to double by 2013
* To benefit from high cement demand in the Western Region
CBM KSA 59.20 32% * Healthy growth in profitability and sales
* Growth not yet priced in
* Affliation with SABIC a key advantage
Petrochem KSA 57.80 32% * Catering largely to Emerging Asian countries
* Cheap on valuations considering the growth prospects
* Launch of 4G to cement leadership in mobile broadband
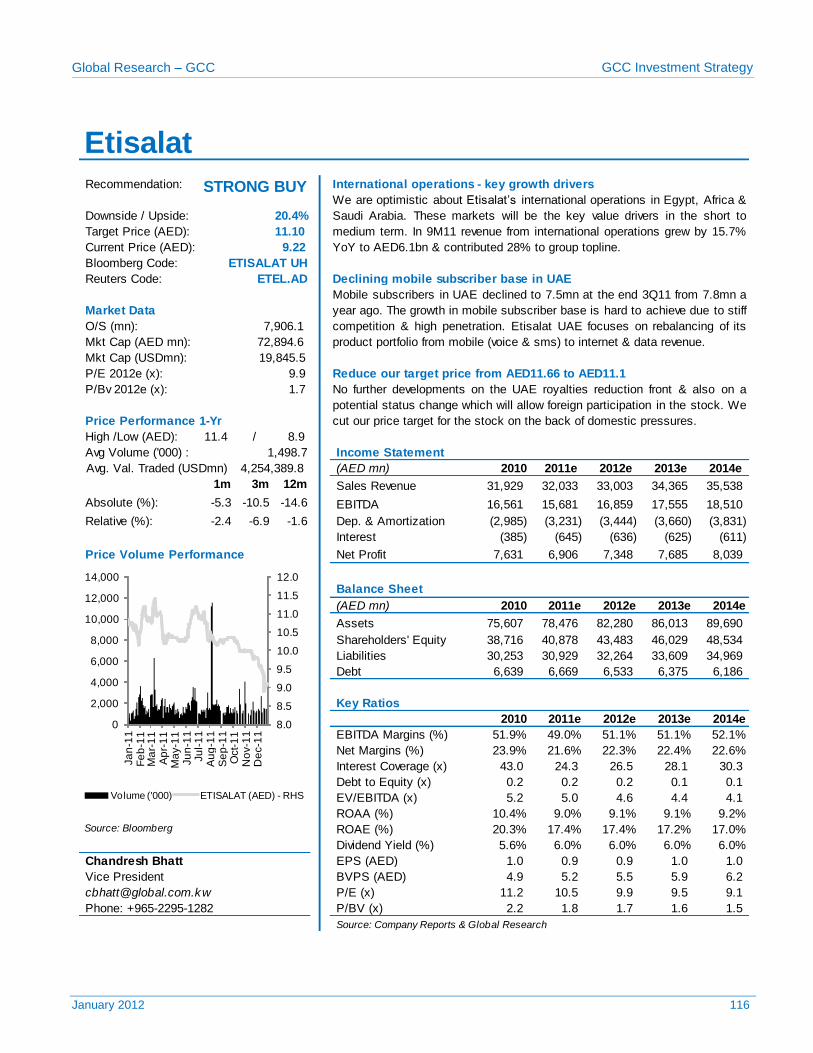
Telecom KSA 71.10 35% * Dividends set to grow
* Trading at attractive multiples
Union National Bank
Ras Al Khaimah
Ceramics Co.
First Gulf Bank
Jazeera Airways
Company
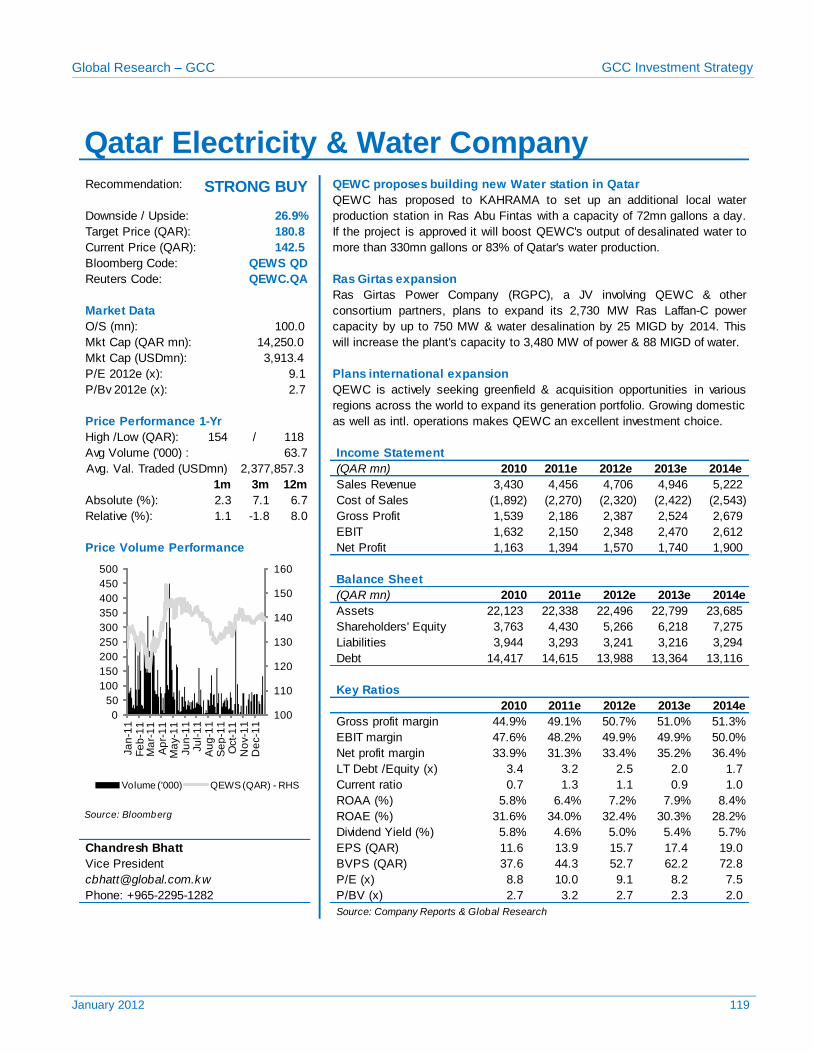
Qatar Electricity &
Water Company
Qatar Telecom
Burgan Bank
Abu Dhabi
Commercial Bank
Emaar Properties
Drake & Scull
International
Etihad Etisalat
Company
National Mobile
Telecommunications
Company
Mabanee
Arabian Cement Co.
Yanbu National
Petrochemicals
Company
Target
Price (LC)
Upside
Potential
Global Research – GCC GCC Investment Strategy
January 2012 12
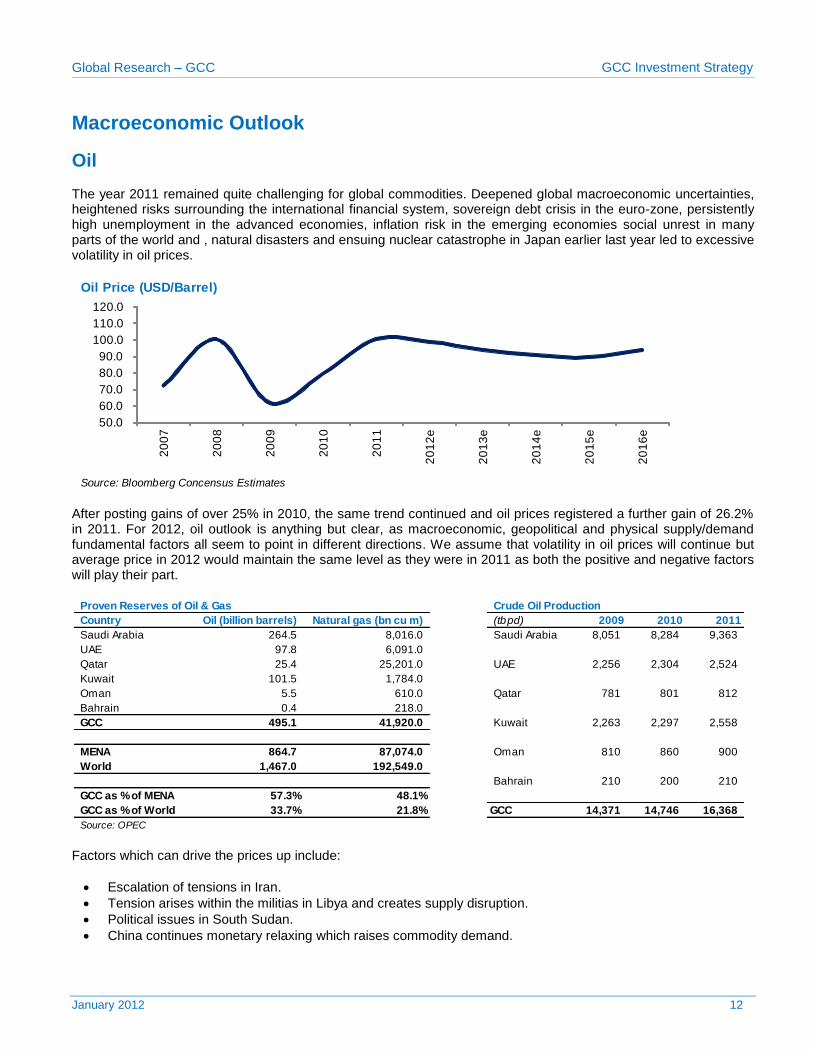
Macroeconomic Outlook
Oil The year 2011 remained quite challenging for global commodities. Deepened global macroeconomic uncertainties, heightened risks surrounding the international financial system, sovereign debt crisis in the euro-zone, persistently high unemployment in the advanced economies, inflation risk in the emerging economies social unrest in many parts of the world and , natural disasters and ensuing nuclear catastrophe in Japan earlier last year led to excessive volatility in oil prices.
After posting gains of over 25% in 2010, the same trend continued and oil prices registered a further gain of 26.2% in 2011. For 2012, oil outlook is anything but clear, as macroeconomic, geopolitical and physical supply/demand fundamental factors all seem to point in different directions. We assume that volatility in oil prices will continue but average price in 2012 would maintain the same level as they were in 2011 as both the positive and negative factors will play their part.
Factors which can drive the prices up include:
Escalation of tensions in Iran.
Tension arises within the militias in Libya and creates supply disruption.
Political issues in South Sudan.
China continues monetary relaxing which raises commodity demand.
Oil Price (USD/Barrel)
Source: Bloomberg Concensus Estimates
50.0
60.0
70.0
80.0
90.0
100.0
110.0
120.0
20
07
20
08
20
09
20
10
20
11
20
12
e
20
13
e
20
14
e
20
15
e
20
16
e
Proven Reserves of Oil & Gas Crude Oil Production
Country Oil (billion barrels) Natural gas (bn cu m) (tbpd) 2009 2010 2011
Saudi Arabia 264.5 8,016.0 Saudi Arabia 8,051 8,284 9,363
UAE 97.8 6,091.0
Qatar 25.4 25,201.0 UAE 2,256 2,304 2,524
Kuwait 101.5 1,784.0
Oman 5.5 610.0 Qatar 781 801 812
Bahrain 0.4 218.0
GCC 495.1 41,920.0 Kuwait 2,263 2,297 2,558
MENA 864.7 87,074.0 Oman 810 860 900
World 1,467.0 192,549.0
Bahrain 210 200 210
GCC as % of MENA 57.3% 48.1%
GCC as % of World 33.7% 21.8% GCC 14,371 14,746 16,368
Source: OPEC
Global Research – GCC GCC Investment Strategy
January 2012 13
Factors which may weigh upon oil prices are:
The likelihood of a European recession and the potential knock-on effects on the rest of the world could pressure crude oil prices.
Security situation eases in Iraq leading to increase in oil production.
Saudi Arabia increases its spare capacity to cover the shortcoming of other countries. Lately there was news that crude production by the Organization of Petroleum Exporting Countries rose to the highest level in three years in December 2011, led by surging Libyan output. Production increased 162,000bpd, or 0.5%, to an average 30.6mbpd from a revised 30.5mbpd. Daily output by the 11 members with quotas, all except Iraq, climbed 167,000 barrels to 27.9mn, 3.1mn barrels above their former target. Libyan output also rose by 100,000 barrels to 700,000 a day last month, the highest level since the uprising. Saudi Arabia, OPEC’s biggest producer, increased output by 50,000 barrels to 9.6mbpd.
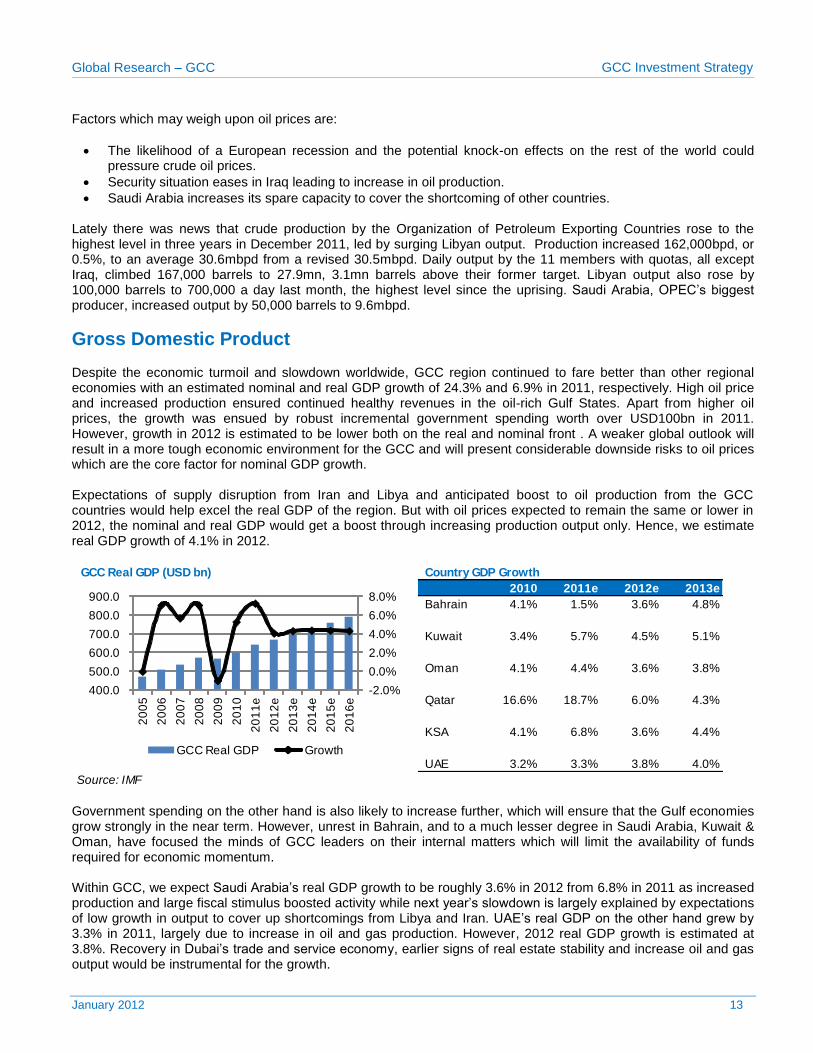
Gross Domestic Product Despite the economic turmoil and slowdown worldwide, GCC region continued to fare better than other regional economies with an estimated nominal and real GDP growth of 24.3% and 6.9% in 2011, respectively. High oil price and increased production ensured continued healthy revenues in the oil-rich Gulf States. Apart from higher oil prices, the growth was ensued by robust incremental government spending worth over USD100bn in 2011. However, growth in 2012 is estimated to be lower both on the real and nominal front . A weaker global outlook will result in a more tough economic environment for the GCC and will present considerable downside risks to oil prices which are the core factor for nominal GDP growth. Expectations of supply disruption from Iran and Libya and anticipated boost to oil production from the GCC countries would help excel the real GDP of the region. But with oil prices expected to remain the same or lower in 2012, the nominal and real GDP would get a boost through increasing production output only. Hence, we estimate real GDP growth of 4.1% in 2012.
Government spending on the other hand is also likely to increase further, which will ensure that the Gulf economies grow strongly in the near term. However, unrest in Bahrain, and to a much lesser degree in Saudi Arabia, Kuwait & Oman, have focused the minds of GCC leaders on their internal matters which will limit the availability of funds required for economic momentum. Within GCC, we expect Saudi Arabia’s real GDP growth to be roughly 3.6% in 2012 from 6.8% in 2011 as increased production and large fiscal stimulus boosted activity while next year’s slowdown is largely explained by expectations of low growth in output to cover up shortcomings from Libya and Iran. UAE’s real GDP on the other hand grew by 3.3% in 2011, largely due to increase in oil and gas production. However, 2012 real GDP growth is estimated at 3.8%. Recovery in Dubai’s trade and service economy, earlier signs of real estate stability and increase oil and gas output would be instrumental for the growth.
GCC Real GDP (USD bn) Country GDP Growth
2010 2011e 2012e 2013e
Bahrain 4.1% 1.5% 3.6% 4.8%
Kuwait 3.4% 5.7% 4.5% 5.1%
Oman 4.1% 4.4% 3.6% 3.8%
Qatar 16.6% 18.7% 6.0% 4.3%
KSA 4.1% 6.8% 3.6% 4.4%
UAE 3.2% 3.3% 3.8% 4.0%
Source: IMF
-2.0%
0.0%
2.0%
4.0%
6.0%
8.0%
400.0
500.0
600.0
700.0
800.0
900.0
20
05
20
06
20
07
20
08
20
09
20
10
20
11
e
20
12
e
20
13
e
20
14
e
20
15
e
20
16
e
GCC Real GDP Growth
Global Research – GCC GCC Investment Strategy
January 2012 14
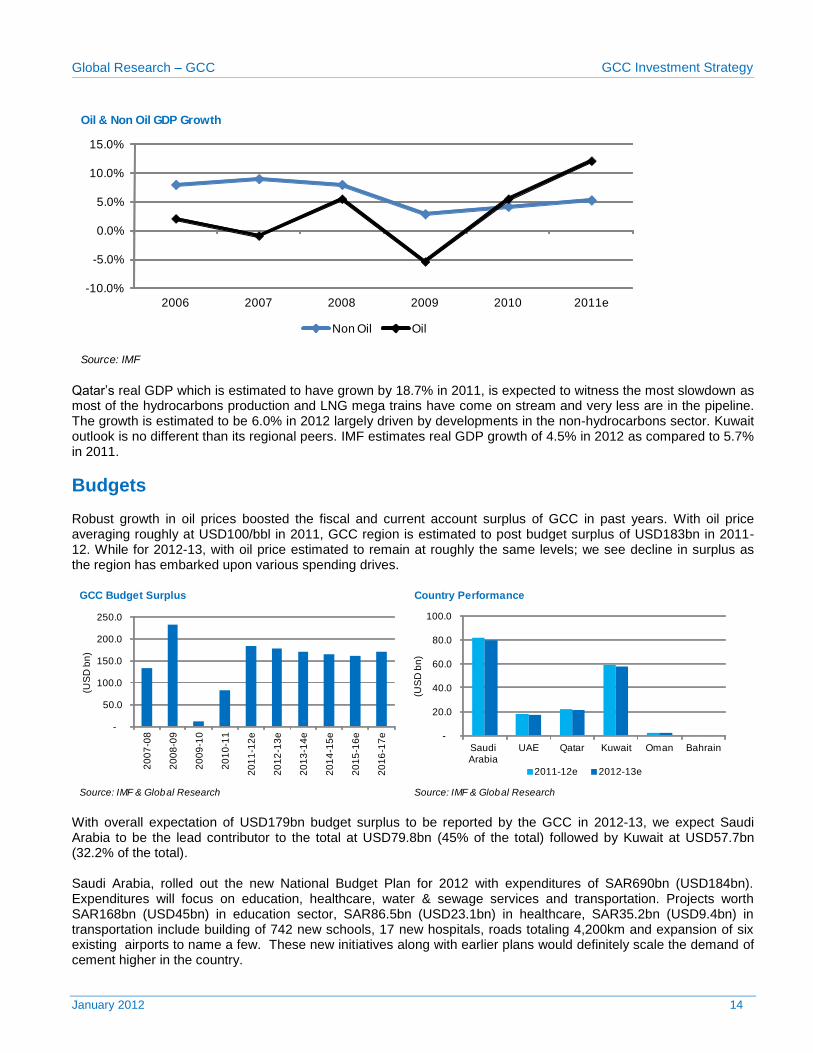
Qatar’s real GDP which is estimated to have grown by 18.7% in 2011, is expected to witness the most slowdown as most of the hydrocarbons production and LNG mega trains have come on stream and very less are in the pipeline. The growth is estimated to be 6.0% in 2012 largely driven by developments in the non-hydrocarbons sector. Kuwait outlook is no different than its regional peers. IMF estimates real GDP growth of 4.5% in 2012 as compared to 5.7% in 2011.
Budgets Robust growth in oil prices boosted the fiscal and current account surplus of GCC in past years. With oil price averaging roughly at USD100/bbl in 2011, GCC region is estimated to post budget surplus of USD183bn in 2011-12. While for 2012-13, with oil price estimated to remain at roughly the same levels; we see decline in surplus as the region has embarked upon various spending drives.
With overall expectation of USD179bn budget surplus to be reported by the GCC in 2012-13, we expect Saudi Arabia to be the lead contributor to the total at USD79.8bn (45% of the total) followed by Kuwait at USD57.7bn (32.2% of the total). Saudi Arabia, rolled out the new National Budget Plan for 2012 with expenditures of SAR690bn (USD184bn). Expenditures will focus on education, healthcare, water & sewage services and transportation. Projects worth SAR168bn (USD45bn) in education sector, SAR86.5bn (USD23.1bn) in healthcare, SAR35.2bn (USD9.4bn) in transportation include building of 742 new schools, 17 new hospitals, roads totaling 4,200km and expansion of six existing airports to name a few. These new initiatives along with earlier plans would definitely scale the demand of cement higher in the country.
Oil & Non Oil GDP Growth
Source: IMF
-10.0%
-5.0%
0.0%
5.0%
10.0%
15.0%
2006 2007 2008 2009 2010 2011e
Non Oil Oil
GCC Budget Surplus Country Performance
Source: IMF & Global Research Source: IMF & Global Research
-
50.0
100.0
150.0
200.0
250.0
20
07
-08
20
08
-09
20
09
-10
20
10
-11
20
11
-12
e
20
12
-13
e
20
13
-14
e
20
14
-15
e
20
15
-16
e
20
16
-17
e
(US
D b
n)
-
20.0
40.0
60.0
80.0
100.0
Saudi Arabia
UAE Qatar Kuwait Oman Bahrain
(US
D b
n)
2011-12e 2012-13e
Global Research – GCC GCC Investment Strategy
January 2012 15
Kuwait revenue is 68% lesser than that of Saudi Arabia but its surplus is 75% of the surplus of Saudi Arabia which is mostly because the Kuwaiti government has generally saved its oil revenues. Kuwait’s spending has mainly been on public sector salaries and subsidies rather than public investment. With the exception of Bahrain, the economic prospects for the other oil-rich Gulf States are strong in the next two to three years. In Qatar, government spending and investment was complemented by a relaxation of foreign ownership laws in the past year. However, double-digit growth rates are unlikely to be sustained but the country would continue to make handsome surplus on the back of its increased gas production levels.
Oman, which has already been affected by social unrest to some degree, will benefit from a 20% increase in government spending in the near term. The country is expected to make roughly USD3bn in surplus in 2011-12 and 5% lesser in 2012-13. In Bahrain, political conditions have improved since the uprising in first quarter of 2011. The country’s financial sector which accounts for 25% of GDP was hit hard and saw various banking and investment giants pulling their operations out of the country. We anticipate Bahrain’s nominal GDP to grow by 3.5% in 2012 and expect it to report a budget deficit as the country is expected to face tough competition from its more-stable neighbors for financial services and tourism business.
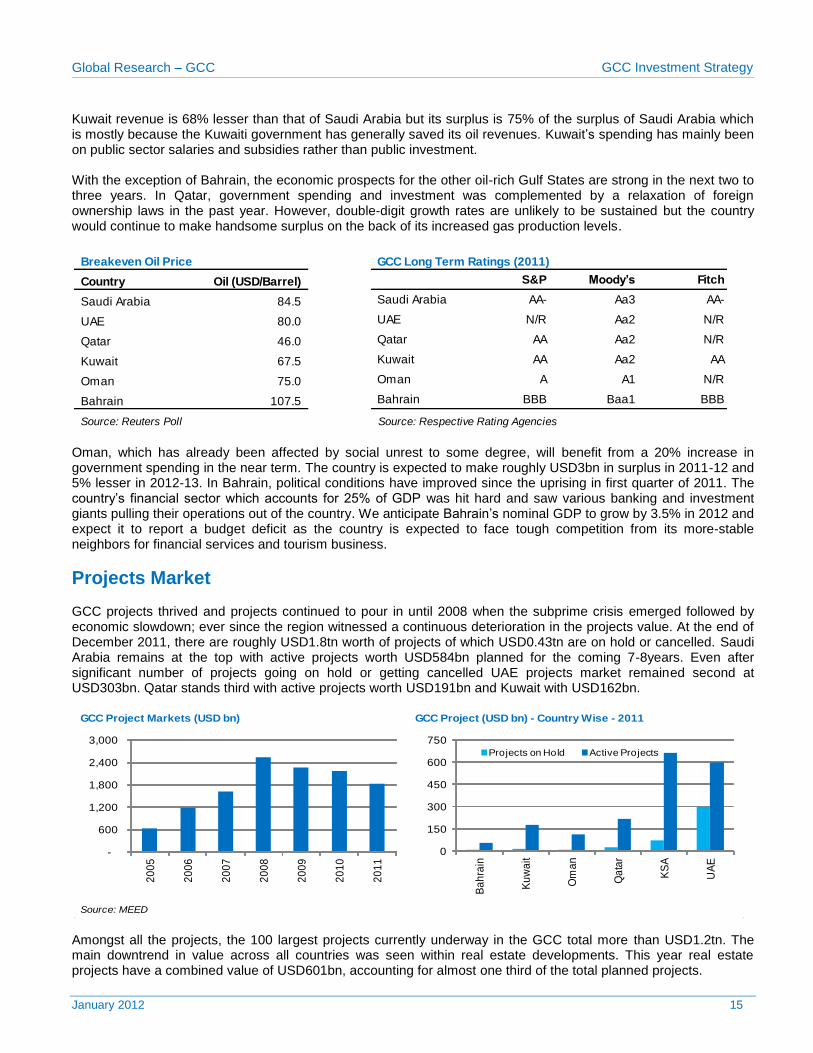
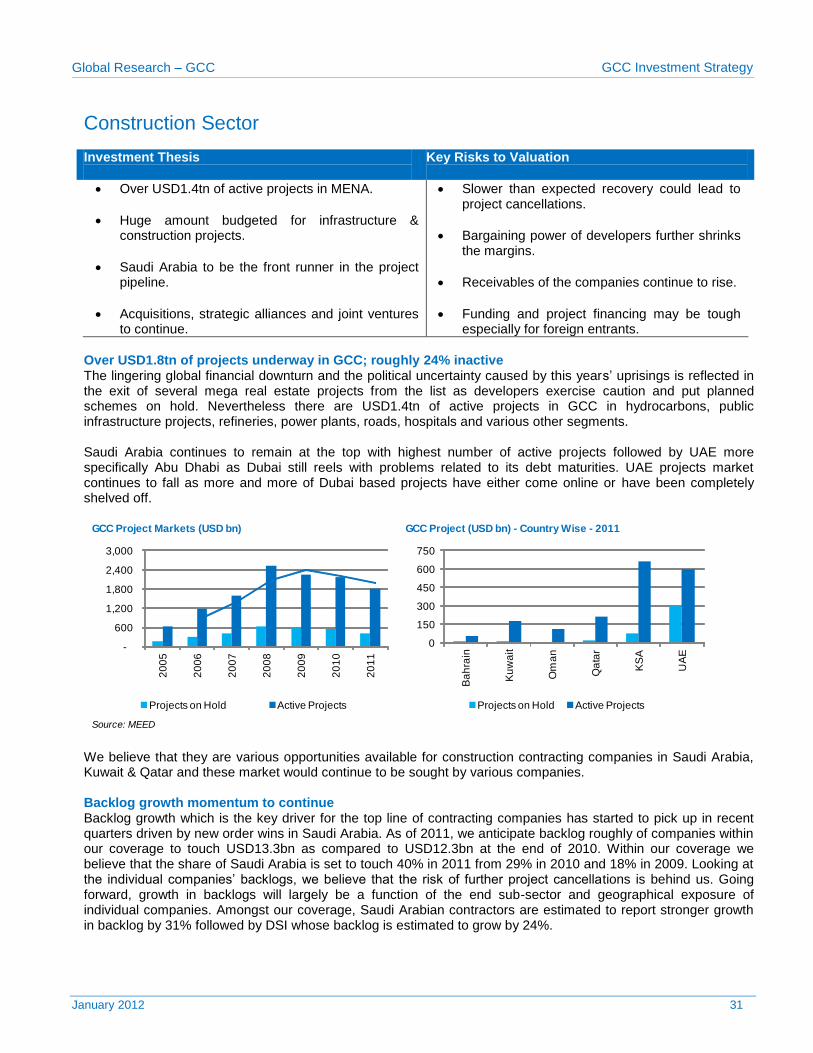
Projects Market GCC projects thrived and projects continued to pour in until 2008 when the subprime crisis emerged followed by economic slowdown; ever since the region witnessed a continuous deterioration in the projects value. At the end of December 2011, there are roughly USD1.8tn worth of projects of which USD0.43tn are on hold or cancelled. Saudi Arabia remains at the top with active projects worth USD584bn planned for the coming 7-8years. Even after significant number of projects going on hold or getting cancelled UAE projects market remained second at USD303bn. Qatar stands third with active projects worth USD191bn and Kuwait with USD162bn.
Amongst all the projects, the 100 largest projects currently underway in the GCC total more than USD1.2tn. The main downtrend in value across all countries was seen within real estate developments. This year real estate projects have a combined value of USD601bn, accounting for almost one third of the total planned projects.
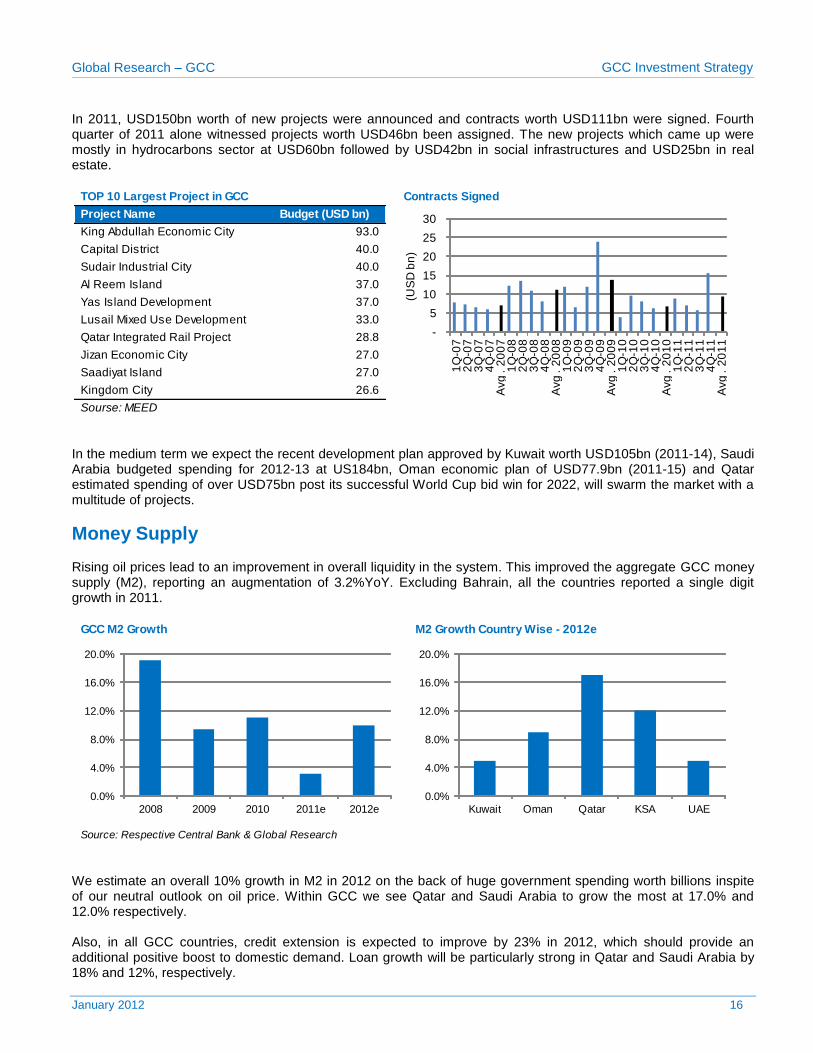
In 2011, USD150bn worth of new projects were announced and contracts worth USD111bn were signed. Fourth quarter of 2011 alone witnessed projects worth USD46bn been assigned. The new projects which came up were mostly in hydrocarbons sector at USD60bn followed by USD42bn in social infrastructures and USD25bn in real estate.
In the medium term we expect the recent development plan approved by Kuwait worth USD105bn (2011-14), Saudi Arabia budgeted spending for 2012-13 at US184bn, Oman economic plan of USD77.9bn (2011-15) and Qatar estimated spending of over USD75bn post its successful World Cup bid win for 2022, will swarm the market with a multitude of projects.
Money Supply Rising oil prices lead to an improvement in overall liquidity in the system. This improved the aggregate GCC money supply (M2), reporting an augmentation of 3.2%YoY. Excluding Bahrain, all the countries reported a single digit growth in 2011.
We estimate an overall 10% growth in M2 in 2012 on the back of huge government spending worth billions inspite of our neutral outlook on oil price. Within GCC we see Qatar and Saudi Arabia to grow the most at 17.0% and 12.0% respectively. Also, in all GCC countries, credit extension is expected to improve by 23% in 2012, which should provide an additional positive boost to domestic demand. Loan growth will be particularly strong in Qatar and Saudi Arabia by 18% and 12%, respectively.
TOP 10 Largest Project in GCC Contracts Signed
Project Name Budget (USD bn)
King Abdullah Economic City 93.0
Capital District 40.0
Sudair Industrial City 40.0
Al Reem Island 37.0
Yas Island Development 37.0
Lusail Mixed Use Development 33.0
Qatar Integrated Rail Project 28.8
Jizan Economic City 27.0
Saadiyat Island 27.0
Kingdom City 26.6
Sourse: MEED
-
5
10
15
20
25
30
1Q
-07
2Q
-07
3Q
-07
4Q
-07
Avg
. 2
00
71
Q-0
82
Q-0
83
Q-0
84
Q-0
8A
vg
. 2
00
81
Q-0
92
Q-0
93
Q-0
94
Q-0
9A
vg
. 2
00
91
Q-1
02
Q-1
03
Q-1
04
Q-1
0A
vg
. 2
01
01
Q-1
12
Q-1
13
Q-1
14
Q-1
1A
vg
. 2
01
1
(US
D b
n)
GCC M2 Growth M2 Growth Country Wise - 2012e
Source: Respective Central Bank & Global Research
0.0%
4.0%
8.0%
12.0%
16.0%
20.0%
2008 2009 2010 2011e 2012e0.0%
4.0%
8.0%
12.0%
16.0%
20.0%
Kuwait Oman Qatar KSA UAE
Global Research – GCC GCC Investment Strategy
January 2012 17
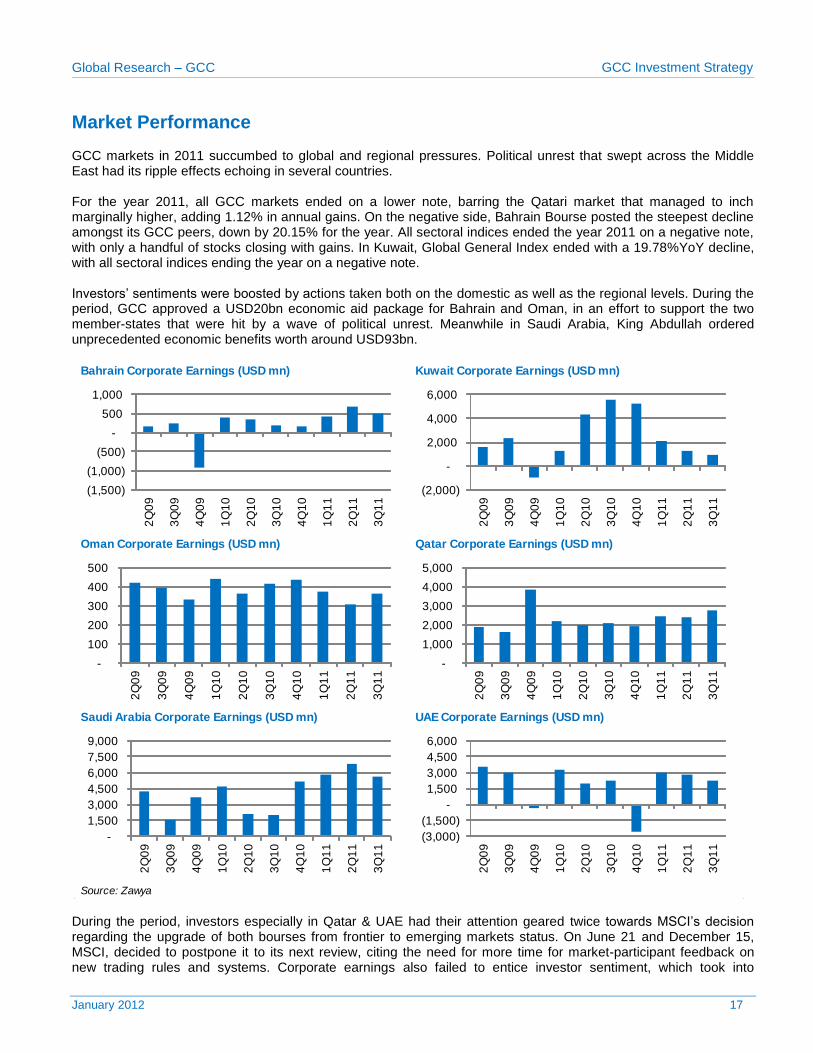
Market Performance GCC markets in 2011 succumbed to global and regional pressures. Political unrest that swept across the Middle East had its ripple effects echoing in several countries. For the year 2011, all GCC markets ended on a lower note, barring the Qatari market that managed to inch marginally higher, adding 1.12% in annual gains. On the negative side, Bahrain Bourse posted the steepest decline amongst its GCC peers, down by 20.15% for the year. All sectoral indices ended the year 2011 on a negative note, with only a handful of stocks closing with gains. In Kuwait, Global General Index ended with a 19.78%YoY decline, with all sectoral indices ending the year on a negative note. Investors’ sentiments were boosted by actions taken both on the domestic as well as the regional levels. During the period, GCC approved a USD20bn economic aid package for Bahrain and Oman, in an effort to support the two member-states that were hit by a wave of political unrest. Meanwhile in Saudi Arabia, King Abdullah ordered unprecedented economic benefits worth around USD93bn.
During the period, investors especially in Qatar & UAE had their attention geared twice towards MSCI’s decision regarding the upgrade of both bourses from frontier to emerging markets status. On June 21 and December 15, MSCI, decided to postpone it to its next review, citing the need for more time for market-participant feedback on new trading rules and systems. Corporate earnings also failed to entice investor sentiment, which took into
consideration a more broader view by looking at imported international events. News of default and bailouts in European countries shook investors confidence in equity markets several times during the year.
Some of the positives for 2012 would be the opening up of Saudi Arabia for further foreign investment, MSCI reviews of UAE & Qatar and earnings surprises. Saudi Arabia is pressing ahead with a long-awaited plan to open up its stock market to foreigners and is expected to formalize its rules by January 15, 2012. The country has been considering a wider opening of its market for several years and recently, news emerged that it plans to offer limited direct foreign ownership. Foreign investors currently are allowed to invest in Saudi Arabian companies only by share swap transactions via international investment banks, who deal with local partners. IPO Activity in GCC Given the macro-economic backdrop, IPO activity remained largely subdued with fund raising falling to its lowest degree of activity in the last ten years. MENA capital markets raised USD843.9mn in 2011 as compared to USD2.8bn in 2010, a decline of 69.3%. The year is closing with IPO funds worth USD226.1mn being raised in the fourth quarter, a decline of 83.5% from USD1.4bn raised in Q4 2010.
Saudi Arabia led the GCC in 2011, raising USD460.5mn through IPOs, followed by the UAE with USD271.3mn and Oman with USD63.9mn. Morocco, Tunisia, Jordan and Syria were the only other MENA countries with IPO activity in 2011. The largest IPO of 2011 in MENA was UAE’s Eshraq Properties Company (USD229.1mn) followed by Saudi Arabia’s Hail Cement Company (USD130.5mn) and the United Electronic Company (USD105.6mn).
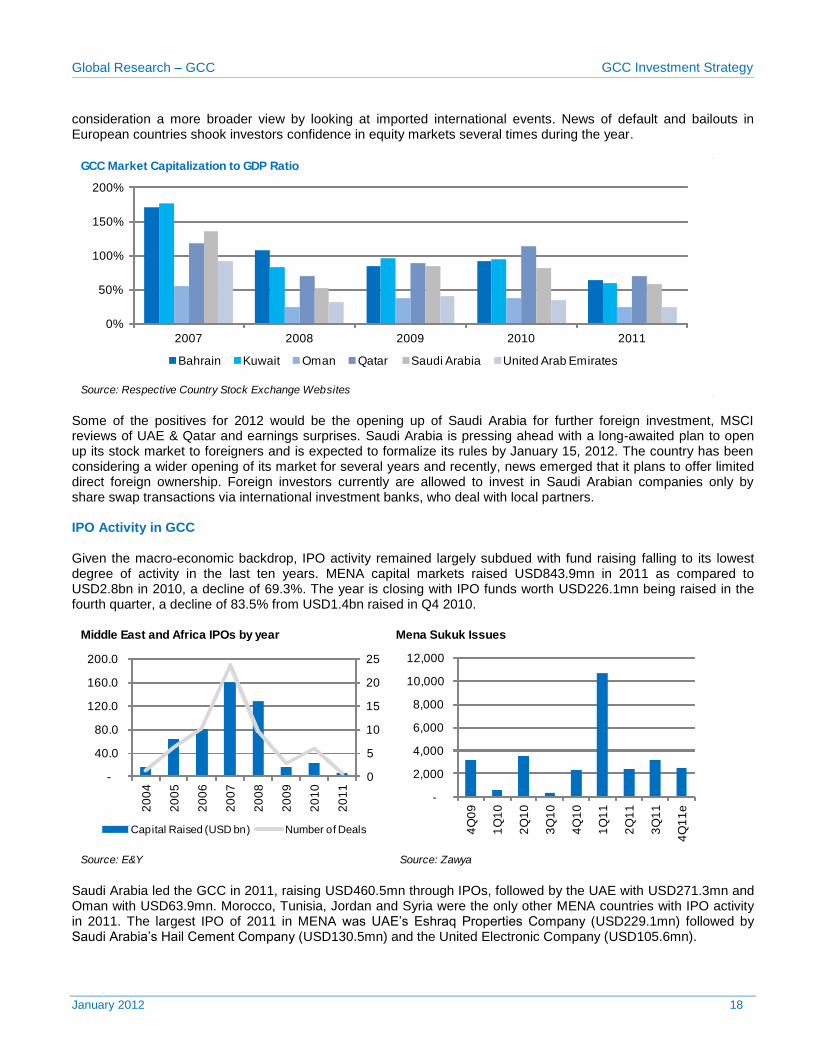
GCC Market Capitalization to GDP Ratio
Source: Respective Country Stock Exchange Websites
0%
50%
100%
150%
200%
2007 2008 2009 2010 2011
Bahrain Kuwait Oman Qatar Saudi Arabia United Arab Emirates
Middle East and Africa IPOs by year Mena Sukuk Issues
Source: E&Y Source: Zawya
0
5
10
15
20
25
-
40.0
80.0
120.0
160.0
200.0
20
04
20
05
20
06
20
07
20
08
20
09
20
10
20
11
Capital Raised (USD bn) Number of Deals
-
2,000
4,000
6,000
8,000
10,000
12,000
4Q
09
1Q
10
2Q
10
3Q
10
4Q
10
1Q
11
2Q
11
3Q
11
4Q
11
e
Global Research – GCC GCC Investment Strategy
January 2012 19
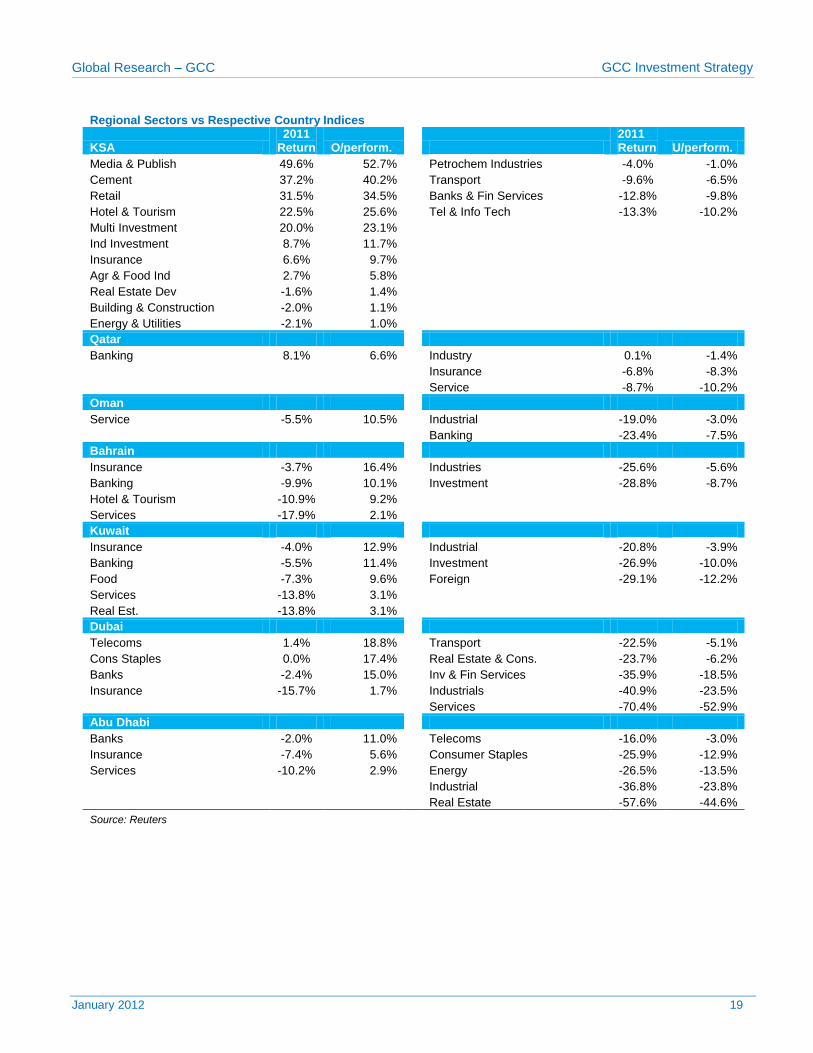
Regional Sectors vs Respective Country Indices
KSA 2011
Return O/perform.
2011 Return U/perform.
Media & Publish 49.6% 52.7% Petrochem Industries -4.0% -1.0%
Cement 37.2% 40.2% Transport -9.6% -6.5%
Retail 31.5% 34.5% Banks & Fin Services -12.8% -9.8%
Hotel & Tourism 22.5% 25.6% Tel & Info Tech -13.3% -10.2%
Multi Investment 20.0% 23.1%
Ind Investment 8.7% 11.7%
Insurance 6.6% 9.7%
Agr & Food Ind 2.7% 5.8%
Real Estate Dev -1.6% 1.4%
Building & Construction -2.0% 1.1%
Energy & Utilities -2.1% 1.0%
Qatar
Banking 8.1% 6.6% Industry 0.1% -1.4%
Insurance -6.8% -8.3%
Service -8.7% -10.2%
Oman
Service -5.5% 10.5% Industrial -19.0% -3.0%
Banking -23.4% -7.5%
Bahrain
Insurance -3.7% 16.4% Industries -25.6% -5.6%
Banking -9.9% 10.1% Investment -28.8% -8.7%
Hotel & Tourism -10.9% 9.2%
Services -17.9% 2.1%
Kuwait
Insurance -4.0% 12.9% Industrial -20.8% -3.9%
Banking -5.5% 11.4% Investment -26.9% -10.0%
Food -7.3% 9.6% Foreign -29.1% -12.2%
Services -13.8% 3.1%
Real Est. -13.8% 3.1%
Dubai
Telecoms 1.4% 18.8% Transport -22.5% -5.1%
Cons Staples 0.0% 17.4% Real Estate & Cons. -23.7% -6.2%
Banks -2.4% 15.0% Inv & Fin Services -35.9% -18.5%
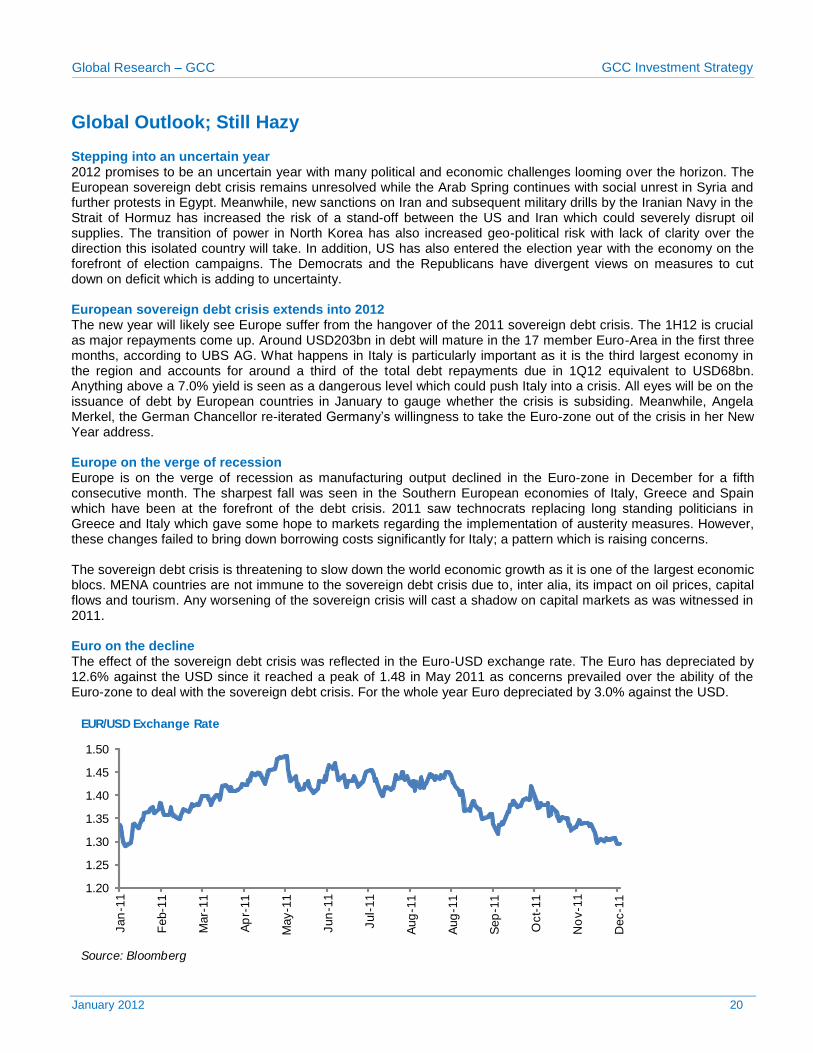
Global Outlook; Still Hazy Stepping into an uncertain year 2012 promises to be an uncertain year with many political and economic challenges looming over the horizon. The European sovereign debt crisis remains unresolved while the Arab Spring continues with social unrest in Syria and further protests in Egypt. Meanwhile, new sanctions on Iran and subsequent military drills by the Iranian Navy in the Strait of Hormuz has increased the risk of a stand-off between the US and Iran which could severely disrupt oil supplies. The transition of power in North Korea has also increased geo-political risk with lack of clarity over the direction this isolated country will take. In addition, US has also entered the election year with the economy on the forefront of election campaigns. The Democrats and the Republicans have divergent views on measures to cut down on deficit which is adding to uncertainty. European sovereign debt crisis extends into 2012 The new year will likely see Europe suffer from the hangover of the 2011 sovereign debt crisis. The 1H12 is crucial as major repayments come up. Around USD203bn in debt will mature in the 17 member Euro-Area in the first three months, according to UBS AG. What happens in Italy is particularly important as it is the third largest economy in the region and accounts for around a third of the total debt repayments due in 1Q12 equivalent to USD68bn. Anything above a 7.0% yield is seen as a dangerous level which could push Italy into a crisis. All eyes will be on the issuance of debt by European countries in January to gauge whether the crisis is subsiding. Meanwhile, Angela Merkel, the German Chancellor re-iterated Germany’s willingness to take the Euro-zone out of the crisis in her New Year address. Europe on the verge of recession Europe is on the verge of recession as manufacturing output declined in the Euro-zone in December for a fifth consecutive month. The sharpest fall was seen in the Southern European economies of Italy, Greece and Spain which have been at the forefront of the debt crisis. 2011 saw technocrats replacing long standing politicians in Greece and Italy which gave some hope to markets regarding the implementation of austerity measures. However, these changes failed to bring down borrowing costs significantly for Italy; a pattern which is raising concerns. The sovereign debt crisis is threatening to slow down the world economic growth as it is one of the largest economic blocs. MENA countries are not immune to the sovereign debt crisis due to, inter alia, its impact on oil prices, capital flows and tourism. Any worsening of the sovereign crisis will cast a shadow on capital markets as was witnessed in 2011. Euro on the decline The effect of the sovereign debt crisis was reflected in the Euro-USD exchange rate. The Euro has depreciated by 12.6% against the USD since it reached a peak of 1.48 in May 2011 as concerns prevailed over the ability of the Euro-zone to deal with the sovereign debt crisis. For the whole year Euro depreciated by 3.0% against the USD.
EUR/USD Exchange Rate
Source: Bloomberg
1.20
1.25
1.30
1.35
1.40
1.45
1.50
Jan
-11
Feb-1
1
Mar-
11
Ap
r-11
May-1
1
Jun
-11
Jul-
11
Aug
-11
Aug
-11
Sep
-11
Oct-
11
No
v-1
1
Dec-1
1
Global Research – GCC GCC Investment Strategy
January 2012 21
Modest growth seen for US in 2012 The US economy seems to be trudging along despite strong headwinds from the Euro-zone crisis and overhang of high debt and deficit. The start of the election year in US was greeted by positive economic news with ISM manufacturing index increasing to 53.9 in December compared to 52.7 in November. US housing starts also increased 9.3% in November to a 19-month high. Meanwhile, unemployment declined to 8.5% in December 2011 after staying above 9.0% for a large part of 2011. The IMF now estimates US economy to grow by 1.8% in 2012. 2011 saw the political system going to brinkmanship in dealing with the debt ceiling issue. The political paralysis was also one of the reasons for US debt rating downgrade by S&P. The super committee which was formed to deal with deficit reduction measures of atleast USD1.2trn failed to come up with an agreement. Now there will be automatic across-the-board cuts beginning in 2013 unless a bipartisan deal is reached or the act is amended. Surprise cut in bank reserve requirement in China a positive sign China’s CPI declined to 4.2% in November, which is a 14 month low, allaying fears of a hard landing. The Chinese Central Bank increased the banks’ reserve requirement ratio six times and the interest rates three times in 2011 to curb inflation. However, in a surprising move the Central Bank cut the reserve requirement ratio in December indicating that the policy makers have turned their focus back on growth in view of the expected slowdown in Euro-zone and other advanced economies. According to IMF, Chinese economy is expected to grow at 9.0% in 2012 compared to an expected 9.5% in 2011. Besides being the global economic growth engine, growth in China is important for GCC countries in particular as China is expected to account for 50.0% of oil demand growth in 2012. China is also a major trading partner of GCC countries in addition to being a major market for petrochemical products.
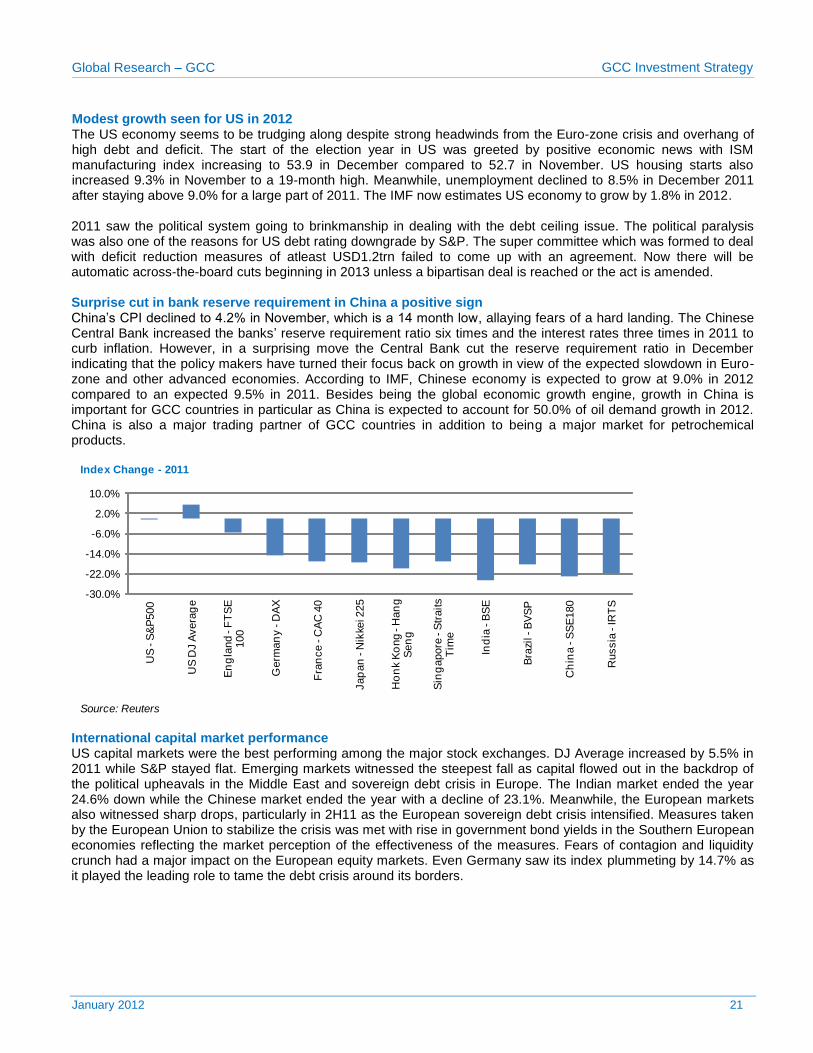
International capital market performance US capital markets were the best performing among the major stock exchanges. DJ Average increased by 5.5% in 2011 while S&P stayed flat. Emerging markets witnessed the steepest fall as capital flowed out in the backdrop of the political upheavals in the Middle East and sovereign debt crisis in Europe. The Indian market ended the year 24.6% down while the Chinese market ended the year with a decline of 23.1%. Meanwhile, the European markets also witnessed sharp drops, particularly in 2H11 as the European sovereign debt crisis intensified. Measures taken by the European Union to stabilize the crisis was met with rise in government bond yields in the Southern European economies reflecting the market perception of the effectiveness of the measures. Fears of contagion and liquidity crunch had a major impact on the European equity markets. Even Germany saw its index plummeting by 14.7% as it played the leading role to tame the debt crisis around its borders.
Index Change - 2011
Source: Reuters
-30.0%
-22.0%
-14.0%
-6.0%
2.0%
10.0%
US
-S
&P
500
US
DJ A
vera
ge
En
gla
nd -
FT
SE
100
Germ
an
y -
DA
X
Fra
nce -
CA
C 4
0
Jap
an
-N
ikke
i 225
Ho
nk K
ong -
Han
g
Sen
g
Sin
gapore
-S
traits
Tim
e
Ind
ia -
BS
E
Bra
zil -
BV
SP
Ch
ina -
SS
E180
Russia
-IR
TS
Global Research – GCC GCC Investment Strategy
January 2012 22
SECTOR OUTLOOK
Global Research – GCC GCC Investment Strategy
January 2012 23
Banking Sector
Investment Thesis
Key Risk to Valuation
2012 should see acceleration in top-line growth for GCC banks, healthy profit growth
KSA upgraded to POSITIVE on cheap valuations, low risk
Qatari story is still ripe, buy on dips
Qatar and KSA spending spree augers well for their banking sectors
We retain our neutral stance on Kuwait, UAE offers good opportunities but at considerable risk
Slow down in world economies, negatively impacting GCC economies and spending programs
Unaccounted for corporate defaults, inability of GREs to service debt specifically in UAE
Exposure to construction & real estate and contraction in government spending
Unexpected changes in the direction or magnitude of interest rates
Market sentiment goes for a toss
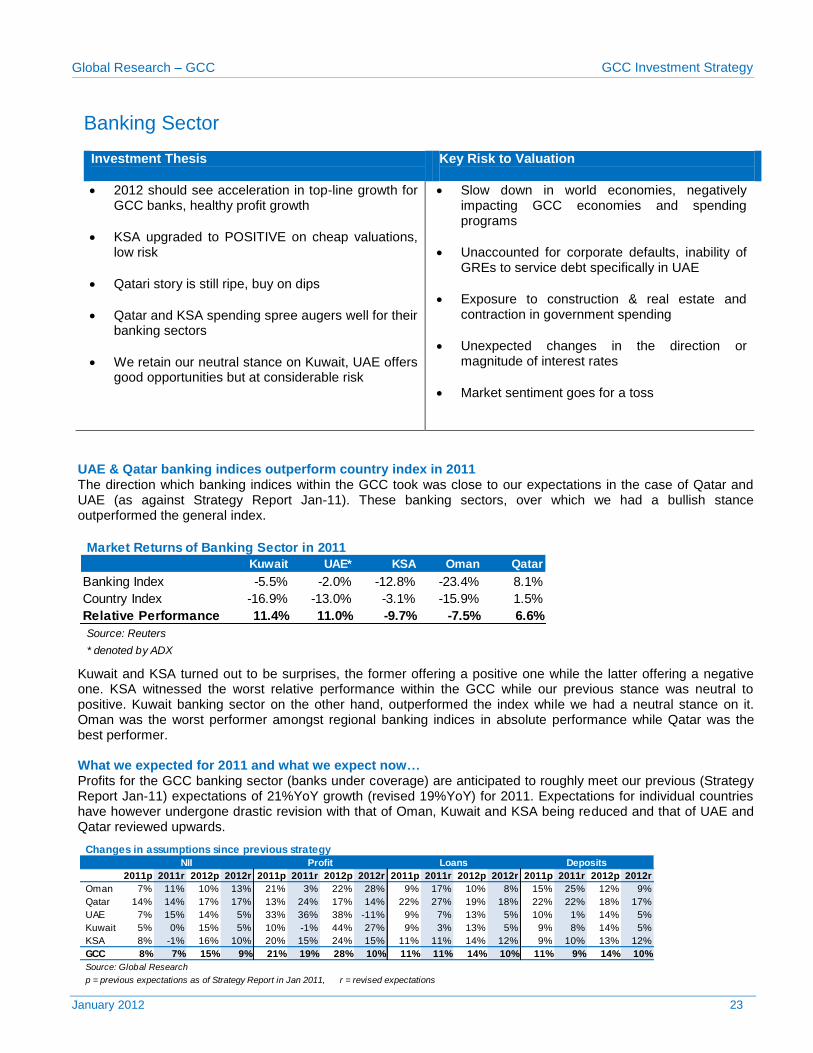
UAE & Qatar banking indices outperform country index in 2011 The direction which banking indices within the GCC took was close to our expectations in the case of Qatar and UAE (as against Strategy Report Jan-11). These banking sectors, over which we had a bullish stance outperformed the general index.
Kuwait and KSA turned out to be surprises, the former offering a positive one while the latter offering a negative one. KSA witnessed the worst relative performance within the GCC while our previous stance was neutral to positive. Kuwait banking sector on the other hand, outperformed the index while we had a neutral stance on it. Oman was the worst performer amongst regional banking indices in absolute performance while Qatar was the best performer. What we expected for 2011 and what we expect now… Profits for the GCC banking sector (banks under coverage) are anticipated to roughly meet our previous (Strategy Report Jan-11) expectations of 21%YoY growth (revised 19%YoY) for 2011. Expectations for individual countries have however undergone drastic revision with that of Oman, Kuwait and KSA being reduced and that of UAE and Qatar reviewed upwards.
p = previous expectations as of Strategy Report in Jan 2011, r = revised expectations
Changes in assumptions since previous strategy
Source: Global Research
DepositsNII Profit Loans
Global Research – GCC GCC Investment Strategy
January 2012 24
Oman: Lowered our profit forecast for 2011 drastically on expectations of much higher provisions. We previously forecast a 12%YoY decline in provisions but now expect an 81%YoY increase. This comes despite a heavy upward revision in NII and non-interest income forecast. Qatar: Increased our profit forecast for 2011 significantly on higher than previously anticipated non-interest income. This comes despite increasing our forecast on provisions from expecting a decline of 27% to a rise of 18%. UAE: Increased our profit forecast for 2011 slightly due to higher than anticipated one-off gains made by ENBD and inclusion of extraordinary gains made by ADCB. Excluding the impact of both, profit growth expectations were actually reduced to 20 – 24% (against previous forecast of 33%). This comes due to a major downward shift in our growth forecast for non-interest income and a rise in provisions against previous expectations of a decline offset to some extent by an increase in forecast for NII. Kuwait: The only country we see exhibiting a drop in profits; we have lowered our forecast due to a downward revision in our growth outlook for NII and an upward revision in provisions. KSA: Decreased our profit forecast for 2011 slightly due to downward revision in forecast for NII which more than offset the upward revision in non-interest income. Our predictions for the banking sector in 2012…
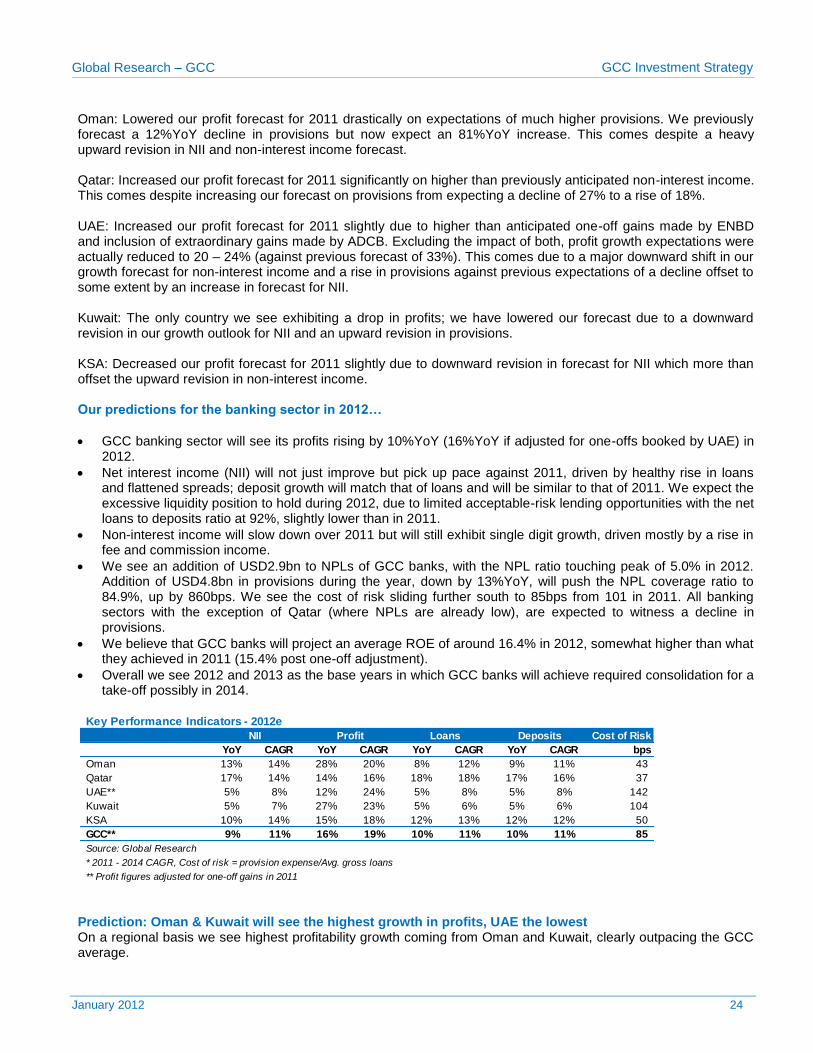
GCC banking sector will see its profits rising by 10%YoY (16%YoY if adjusted for one-offs booked by UAE) in 2012.
Net interest income (NII) will not just improve but pick up pace against 2011, driven by healthy rise in loans and flattened spreads; deposit growth will match that of loans and will be similar to that of 2011. We expect the excessive liquidity position to hold during 2012, due to limited acceptable-risk lending opportunities with the net loans to deposits ratio at 92%, slightly lower than in 2011.
Non-interest income will slow down over 2011 but will still exhibit single digit growth, driven mostly by a rise in fee and commission income.
We see an addition of USD2.9bn to NPLs of GCC banks, with the NPL ratio touching peak of 5.0% in 2012. Addition of USD4.8bn in provisions during the year, down by 13%YoY, will push the NPL coverage ratio to 84.9%, up by 860bps. We see the cost of risk sliding further south to 85bps from 101 in 2011. All banking sectors with the exception of Qatar (where NPLs are already low), are expected to witness a decline in provisions.
We believe that GCC banks will project an average ROE of around 16.4% in 2012, somewhat higher than what they achieved in 2011 (15.4% post one-off adjustment).
Overall we see 2012 and 2013 as the base years in which GCC banks will achieve required consolidation for a take-off possibly in 2014.
Prediction: Oman & Kuwait will see the highest growth in profits, UAE the lowest On a regional basis we see highest profitability growth coming from Oman and Kuwait, clearly outpacing the GCC average.
** Profit figures adjusted for one-off gains in 2011
Global Research – GCC GCC Investment Strategy
January 2012 25
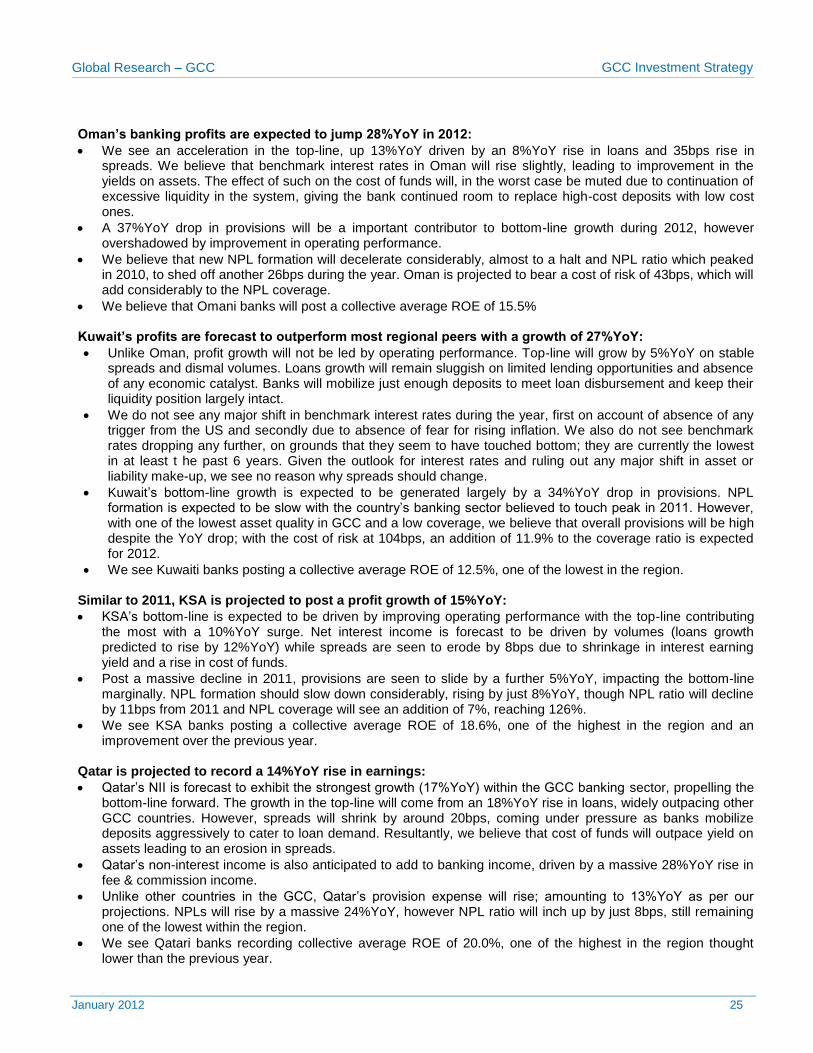
Oman’s banking profits are expected to jump 28%YoY in 2012:
We see an acceleration in the top-line, up 13%YoY driven by an 8%YoY rise in loans and 35bps rise in spreads. We believe that benchmark interest rates in Oman will rise slightly, leading to improvement in the yields on assets. The effect of such on the cost of funds will, in the worst case be muted due to continuation of excessive liquidity in the system, giving the bank continued room to replace high-cost deposits with low cost ones.
A 37%YoY drop in provisions will be a important contributor to bottom-line growth during 2012, however overshadowed by improvement in operating performance.
We believe that new NPL formation will decelerate considerably, almost to a halt and NPL ratio which peaked in 2010, to shed off another 26bps during the year. Oman is projected to bear a cost of risk of 43bps, which will add considerably to the NPL coverage.
We believe that Omani banks will post a collective average ROE of 15.5%
Kuwait’s profits are forecast to outperform most regional peers with a growth of 27%YoY:
Unlike Oman, profit growth will not be led by operating performance. Top-line will grow by 5%YoY on stable spreads and dismal volumes. Loans growth will remain sluggish on limited lending opportunities and absence of any economic catalyst. Banks will mobilize just enough deposits to meet loan disbursement and keep their liquidity position largely intact.
We do not see any major shift in benchmark interest rates during the year, first on account of absence of any trigger from the US and secondly due to absence of fear for rising inflation. We also do not see benchmark rates dropping any further, on grounds that they seem to have touched bottom; they are currently the lowest in at least t he past 6 years. Given the outlook for interest rates and ruling out any major shift in asset or liability make-up, we see no reason why spreads should change.
Kuwait’s bottom-line growth is expected to be generated largely by a 34%YoY drop in provisions. NPL formation is expected to be slow with the country’s banking sector believed to touch peak in 2011. However, with one of the lowest asset quality in GCC and a low coverage, we believe that overall provisions will be high despite the YoY drop; with the cost of risk at 104bps, an addition of 11.9% to the coverage ratio is expected for 2012.
We see Kuwaiti banks posting a collective average ROE of 12.5%, one of the lowest in the region. Similar to 2011, KSA is projected to post a profit growth of 15%YoY:
KSA’s bottom-line is expected to be driven by improving operating performance with the top-line contributing the most with a 10%YoY surge. Net interest income is forecast to be driven by volumes (loans growth predicted to rise by 12%YoY) while spreads are seen to erode by 8bps due to shrinkage in interest earning yield and a rise in cost of funds.
Post a massive decline in 2011, provisions are seen to slide by a further 5%YoY, impacting the bottom-line marginally. NPL formation should slow down considerably, rising by just 8%YoY, though NPL ratio will decline by 11bps from 2011 and NPL coverage will see an addition of 7%, reaching 126%.
We see KSA banks posting a collective average ROE of 18.6%, one of the highest in the region and an improvement over the previous year.
Qatar is projected to record a 14%YoY rise in earnings:
Qatar’s NII is forecast to exhibit the strongest growth (17%YoY) within the GCC banking sector, propelling the bottom-line forward. The growth in the top-line will come from an 18%YoY rise in loans, widely outpacing other GCC countries. However, spreads will shrink by around 20bps, coming under pressure as banks mobilize deposits aggressively to cater to loan demand. Resultantly, we believe that cost of funds will outpace yield on assets leading to an erosion in spreads.
Qatar’s non-interest income is also anticipated to add to banking income, driven by a massive 28%YoY rise in fee & commission income.
Unlike other countries in the GCC, Qatar’s provision expense will rise; amounting to 13%YoY as per our projections. NPLs will rise by a massive 24%YoY, however NPL ratio will inch up by just 8bps, still remaining one of the lowest within the region.
We see Qatari banks recording collective average ROE of 20.0%, one of the highest in the region thought lower than the previous year.
Global Research – GCC GCC Investment Strategy
January 2012 26
UAE’s adjusted profits to pick up pace in 2012, to grow by 12%YoY:
UAE’s banking profits will decline by 11%YoY on un-adjusted basis due to one-off gains made by ENBD and ADCB in 2011 but jump by 12%YoY on adjusted basis.
Top-line growth will be sluggish, growing by 5%YoY mimicking loans growth expectations of 5%YoY while spreads remain relatively unchanged from levels seen in the previous year.
Non-interest income is not expected to fare any better with fee and commission income which is the main contributor, increasing by just 2%YoY due to the new retail regulations from the CBUAE.
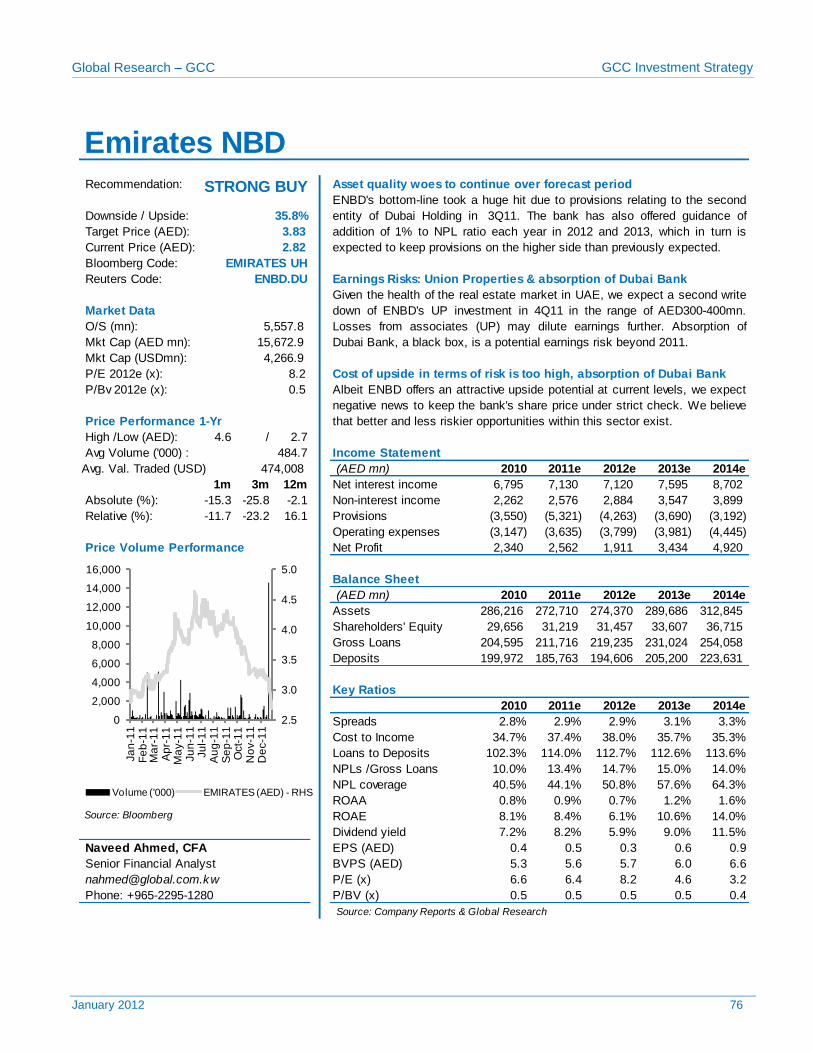
Decline in provisions, will therefore be the next largest contributor to income after NII; we see provision expense decline by just 7%YoY. We believe that NPLs ratio will touch peak (addition of 66bps to reach 8.8%) during the year, with NPLs rising by 14%YoY (addition of AED7.7bn); a considerable slow-down from the previous years. The rise in NPLs will be fueled largely by recognition of exposure to Dubai Group, amalgamation of Dubai Bank into ENBD and possibly Al Jaber Group.
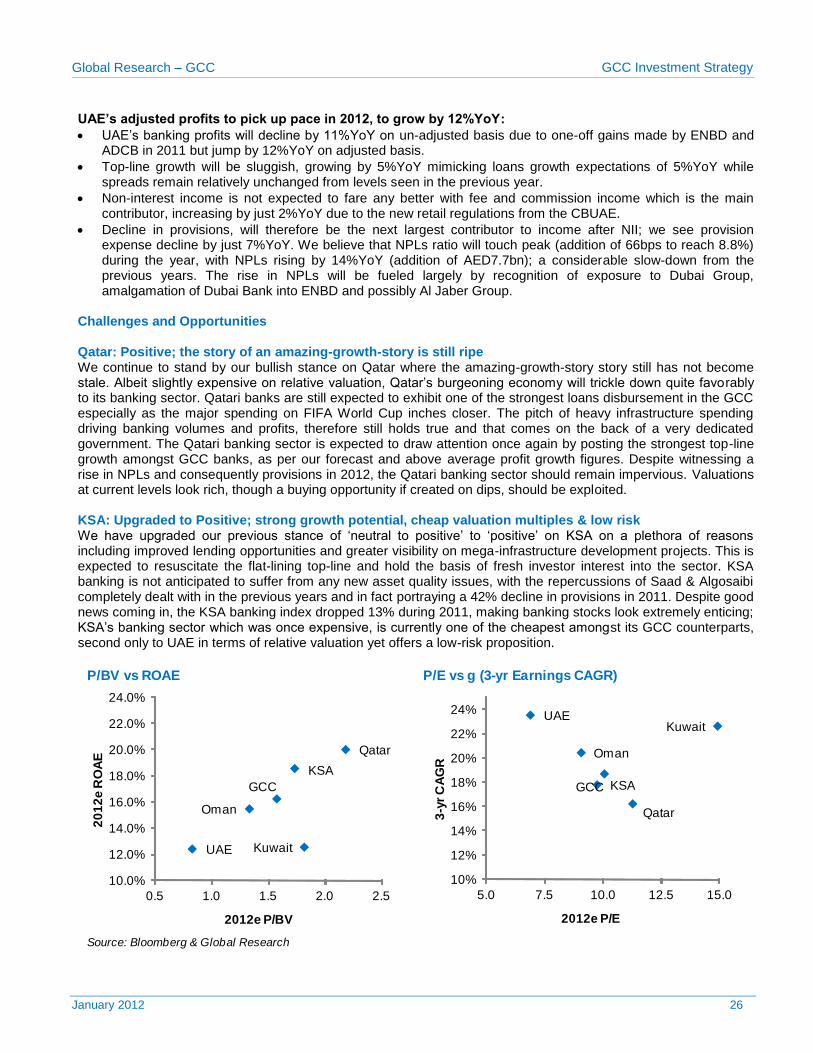
Challenges and Opportunities Qatar: Positive; the story of an amazing-growth-story is still ripe We continue to stand by our bullish stance on Qatar where the amazing-growth-story story still has not become stale. Albeit slightly expensive on relative valuation, Qatar’s burgeoning economy will trickle down quite favorably to its banking sector. Qatari banks are still expected to exhibit one of the strongest loans disbursement in the GCC especially as the major spending on FIFA World Cup inches closer. The pitch of heavy infrastructure spending driving banking volumes and profits, therefore still holds true and that comes on the back of a very dedicated government. The Qatari banking sector is expected to draw attention once again by posting the strongest top-line growth amongst GCC banks, as per our forecast and above average profit growth figures. Despite witnessing a rise in NPLs and consequently provisions in 2012, the Qatari banking sector should remain impervious. Valuations at current levels look rich, though a buying opportunity if created on dips, should be exploited. KSA: Upgraded to Positive; strong growth potential, cheap valuation multiples & low risk We have upgraded our previous stance of ‘neutral to positive’ to ‘positive’ on KSA on a plethora of reasons including improved lending opportunities and greater visibility on mega-infrastructure development projects. This is expected to resuscitate the flat-lining top-line and hold the basis of fresh investor interest into the sector. KSA banking is not anticipated to suffer from any new asset quality issues, with the repercussions of Saad & Algosaibi completely dealt with in the previous years and in fact portraying a 42% decline in provisions in 2011. Despite good news coming in, the KSA banking index dropped 13% during 2011, making banking stocks look extremely enticing; KSA’s banking sector which was once expensive, is currently one of the cheapest amongst its GCC counterparts, second only to UAE in terms of relative valuation yet offers a low-risk proposition.
P/BV vs ROAE P/E vs g (3-yr Earnings CAGR)
Source: Bloomberg & Global Research
KSA
Oman
UAE Kuwait
Qatar
GCC
10.0%
12.0%
14.0%
16.0%
18.0%
20.0%
22.0%
24.0%
0.5 1.0 1.5 2.0 2.5
20
12
e R
OA
E
2012e P/BV
KSA
Oman
UAEKuwait
Qatar
GCC
10%
12%
14%
16%
18%
20%
22%
24%
5.0 7.5 10.0 12.5 15.0
3-y
r C
AG
R
2012e P/E
Global Research – GCC GCC Investment Strategy
January 2012 27
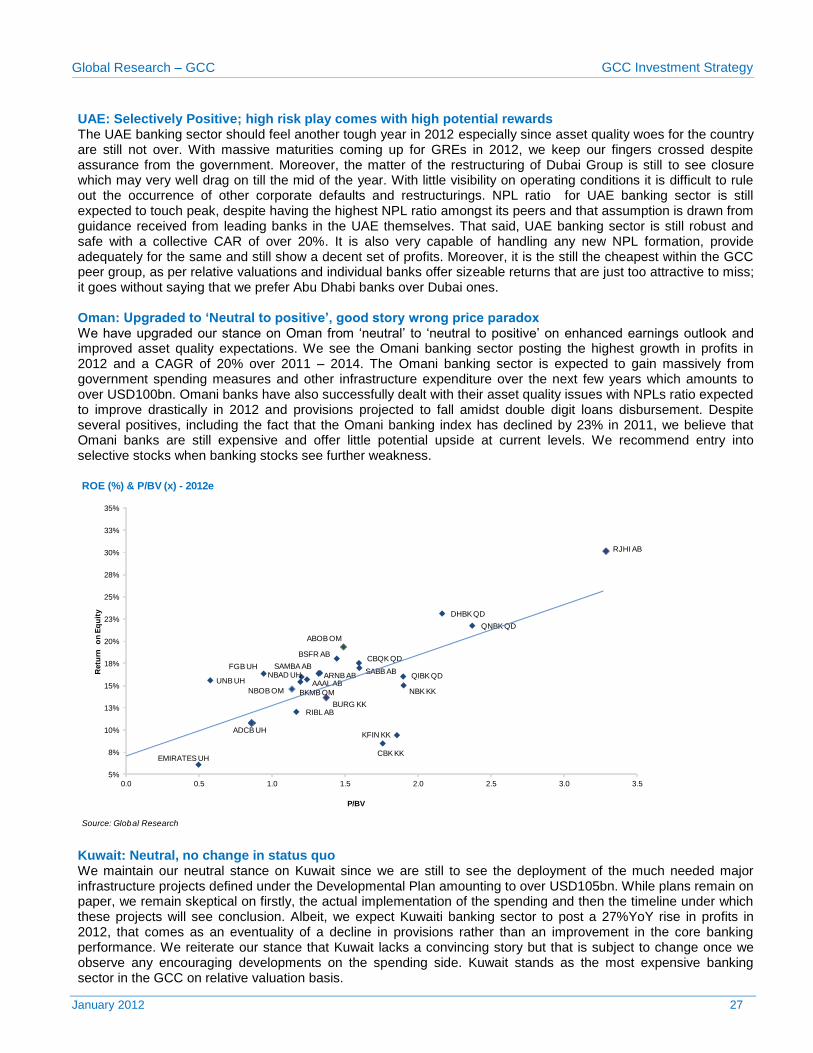
UAE: Selectively Positive; high risk play comes with high potential rewards The UAE banking sector should feel another tough year in 2012 especially since asset quality woes for the country are still not over. With massive maturities coming up for GREs in 2012, we keep our fingers crossed despite assurance from the government. Moreover, the matter of the restructuring of Dubai Group is still to see closure which may very well drag on till the mid of the year. With little visibility on operating conditions it is difficult to rule out the occurrence of other corporate defaults and restructurings. NPL ratio for UAE banking sector is still expected to touch peak, despite having the highest NPL ratio amongst its peers and that assumption is drawn from guidance received from leading banks in the UAE themselves. That said, UAE banking sector is still robust and safe with a collective CAR of over 20%. It is also very capable of handling any new NPL formation, provide adequately for the same and still show a decent set of profits. Moreover, it is the still the cheapest within the GCC peer group, as per relative valuations and individual banks offer sizeable returns that are just too attractive to miss; it goes without saying that we prefer Abu Dhabi banks over Dubai ones. Oman: Upgraded to ‘Neutral to positive’, good story wrong price paradox We have upgraded our stance on Oman from ‘neutral’ to ‘neutral to positive’ on enhanced earnings outlook and improved asset quality expectations. We see the Omani banking sector posting the highest growth in profits in 2012 and a CAGR of 20% over 2011 – 2014. The Omani banking sector is expected to gain massively from government spending measures and other infrastructure expenditure over the next few years which amounts to over USD100bn. Omani banks have also successfully dealt with their asset quality issues with NPLs ratio expected to improve drastically in 2012 and provisions projected to fall amidst double digit loans disbursement. Despite several positives, including the fact that the Omani banking index has declined by 23% in 2011, we believe that Omani banks are still expensive and offer little potential upside at current levels. We recommend entry into selective stocks when banking stocks see further weakness.
Kuwait: Neutral, no change in status quo We maintain our neutral stance on Kuwait since we are still to see the deployment of the much needed major infrastructure projects defined under the Developmental Plan amounting to over USD105bn. While plans remain on paper, we remain skeptical on firstly, the actual implementation of the spending and then the timeline under which these projects will see conclusion. Albeit, we expect Kuwaiti banking sector to post a 27%YoY rise in profits in 2012, that comes as an eventuality of a decline in provisions rather than an improvement in the core banking performance. We reiterate our stance that Kuwait lacks a convincing story but that is subject to change once we observe any encouraging developments on the spending side. Kuwait stands as the most expensive banking sector in the GCC on relative valuation basis.
ROE (%) & P/BV (x) - 2012e
Source: Global Research
ADCB UH
ABOB OM
RJHI AB
ARNB AB
BKMB OM
BSFR AB
BURG KK
CBK KK
DHBK QD
EMIRATES UH
FGB UH
KFIN KK
NBAD UH
NBK KKNBOB OM
QIBK QD
QNBK QD
RIBL AB
SAMBA AB
AAAL AB
CBQK QD
SABB AB
UNB UH
5%
8%
10%
13%
15%
18%
20%
23%
25%
28%
30%
33%
35%
0.0 0.5 1.0 1.5 2.0 2.5 3.0 3.5
Retu
rn
on
Eq
uit
y
P/BV
Global Research – GCC GCC Investment Strategy
January 2012 28
Cement Sector
Investment Thesis
Key Risks to Valuation
Over supply to remain in the picture.
Real estate activity fails to kick off.
Price war continues.
Lifting or imposing ban on import & export
Reconstruction activities in Afghanistan, Iraq & Libya kicks off at a high pace
Global economic slowdown forces countries to delay their mega projects.
M&A activity picking up in the sector
Disruption in fuel supplies.
Huge spending plans in countries to shrink over supply
Government exercising control on prices.
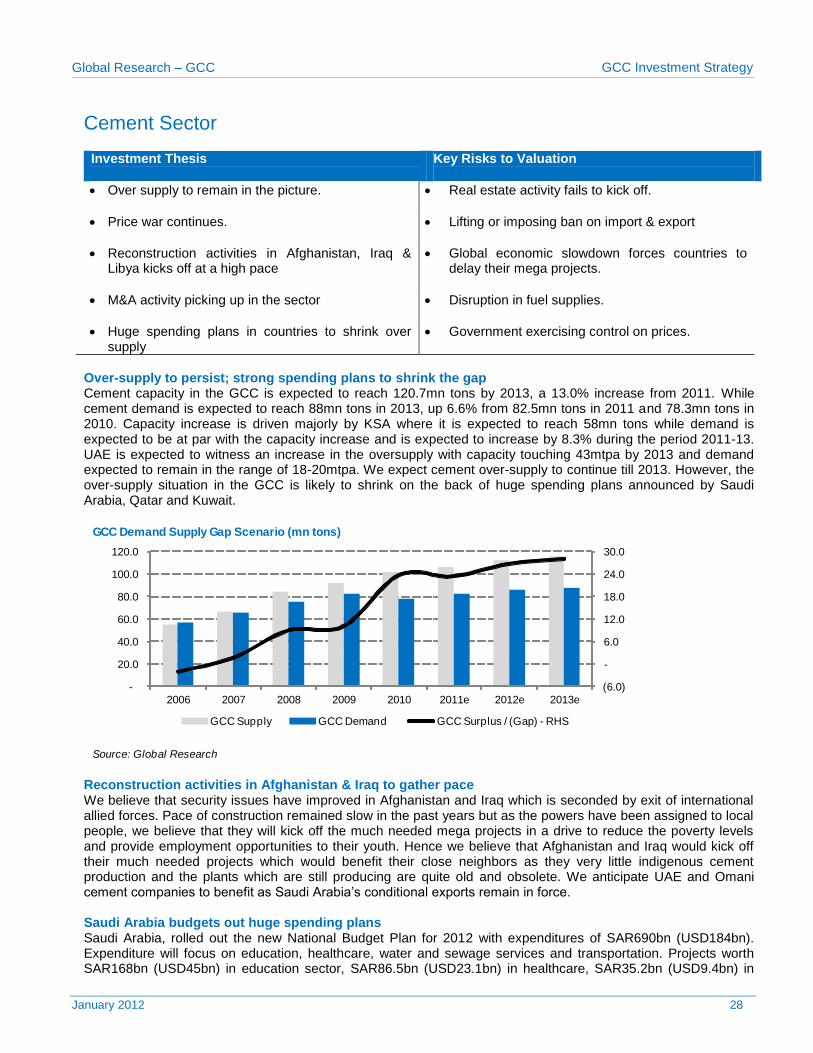
Over-supply to persist; strong spending plans to shrink the gap Cement capacity in the GCC is expected to reach 120.7mn tons by 2013, a 13.0% increase from 2011. While cement demand is expected to reach 88mn tons in 2013, up 6.6% from 82.5mn tons in 2011 and 78.3mn tons in 2010. Capacity increase is driven majorly by KSA where it is expected to reach 58mn tons while demand is expected to be at par with the capacity increase and is expected to increase by 8.3% during the period 2011-13. UAE is expected to witness an increase in the oversupply with capacity touching 43mtpa by 2013 and demand expected to remain in the range of 18-20mtpa. We expect cement over-supply to continue till 2013. However, the over-supply situation in the GCC is likely to shrink on the back of huge spending plans announced by Saudi Arabia, Qatar and Kuwait.
Reconstruction activities in Afghanistan & Iraq to gather pace We believe that security issues have improved in Afghanistan and Iraq which is seconded by exit of international allied forces. Pace of construction remained slow in the past years but as the powers have been assigned to local people, we believe that they will kick off the much needed mega projects in a drive to reduce the poverty levels and provide employment opportunities to their youth. Hence we believe that Afghanistan and Iraq would kick off their much needed projects which would benefit their close neighbors as they very little indigenous cement production and the plants which are still producing are quite old and obsolete. We anticipate UAE and Omani cement companies to benefit as Saudi Arabia’s conditional exports remain in force. Saudi Arabia budgets out huge spending plans Saudi Arabia, rolled out the new National Budget Plan for 2012 with expenditures of SAR690bn (USD184bn). Expenditure will focus on education, healthcare, water and sewage services and transportation. Projects worth SAR168bn (USD45bn) in education sector, SAR86.5bn (USD23.1bn) in healthcare, SAR35.2bn (USD9.4bn) in
GCC Demand Supply Gap Scenario (mn tons)
Source: Global Research
(6.0)
-
6.0
12.0
18.0
24.0
30.0
-
20.0
40.0
60.0
80.0
100.0
120.0
2006 2007 2008 2009 2010 2011e 2012e 2013e
GCC Supply GCC Demand GCC Surplus / (Gap) - RHS
Global Research – GCC GCC Investment Strategy
January 2012 29
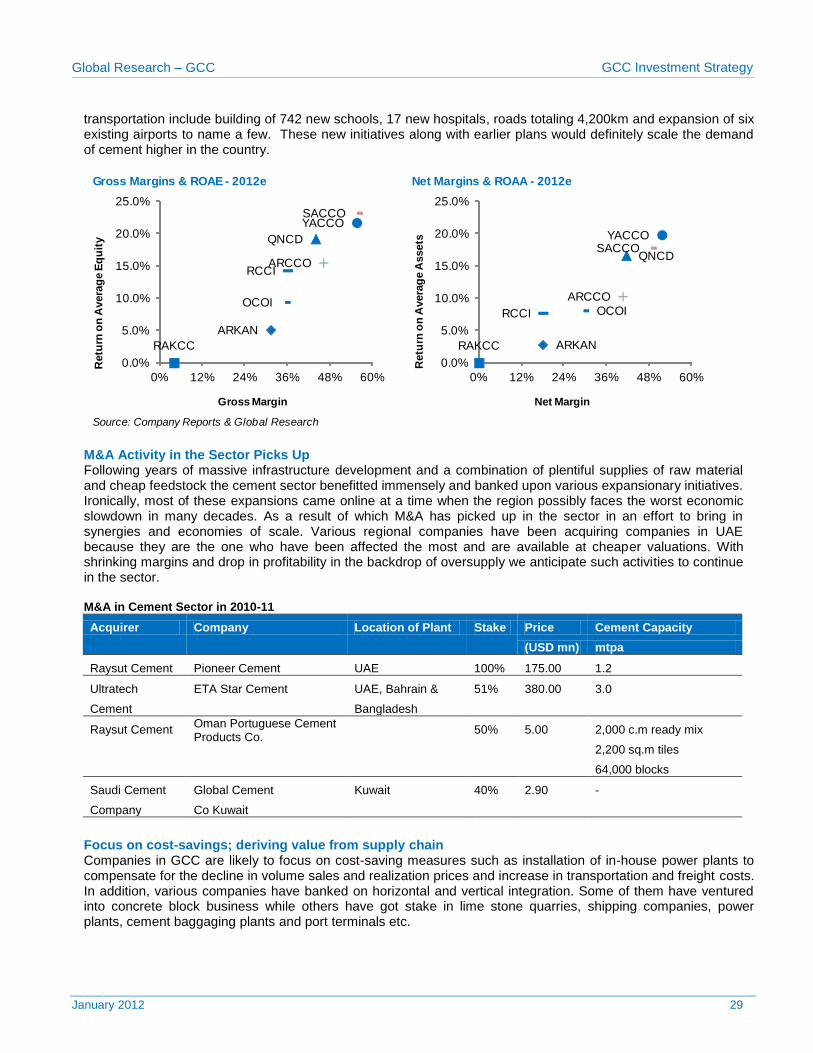
transportation include building of 742 new schools, 17 new hospitals, roads totaling 4,200km and expansion of six existing airports to name a few. These new initiatives along with earlier plans would definitely scale the demand of cement higher in the country.
M&A Activity in the Sector Picks Up Following years of massive infrastructure development and a combination of plentiful supplies of raw material and cheap feedstock the cement sector benefitted immensely and banked upon various expansionary initiatives. Ironically, most of these expansions came online at a time when the region possibly faces the worst economic slowdown in many decades. As a result of which M&A has picked up in the sector in an effort to bring in synergies and economies of scale. Various regional companies have been acquiring companies in UAE because they are the one who have been affected the most and are available at cheaper valuations. With shrinking margins and drop in profitability in the backdrop of oversupply we anticipate such activities to continue in the sector. M&A in Cement Sector in 2010-11
Acquirer Company Location of Plant Stake Price Cement Capacity
(USD mn) mtpa
Raysut Cement Pioneer Cement UAE 100% 175.00 1.2
Ultratech ETA Star Cement UAE, Bahrain & 51% 380.00 3.0
Cement
Bangladesh
Raysut Cement Oman Portuguese Cement Products Co.
50% 5.00 2,000 c.m ready mix
2,200 sq.m tiles
64,000 blocks
Saudi Cement Global Cement Kuwait 40% 2.90 -
Company Co Kuwait
Focus on cost-savings; deriving value from supply chain Companies in GCC are likely to focus on cost-saving measures such as installation of in-house power plants to compensate for the decline in volume sales and realization prices and increase in transportation and freight costs. In addition, various companies have banked on horizontal and vertical integration. Some of them have ventured into concrete block business while others have got stake in lime stone quarries, shipping companies, power plants, cement baggaging plants and port terminals etc.
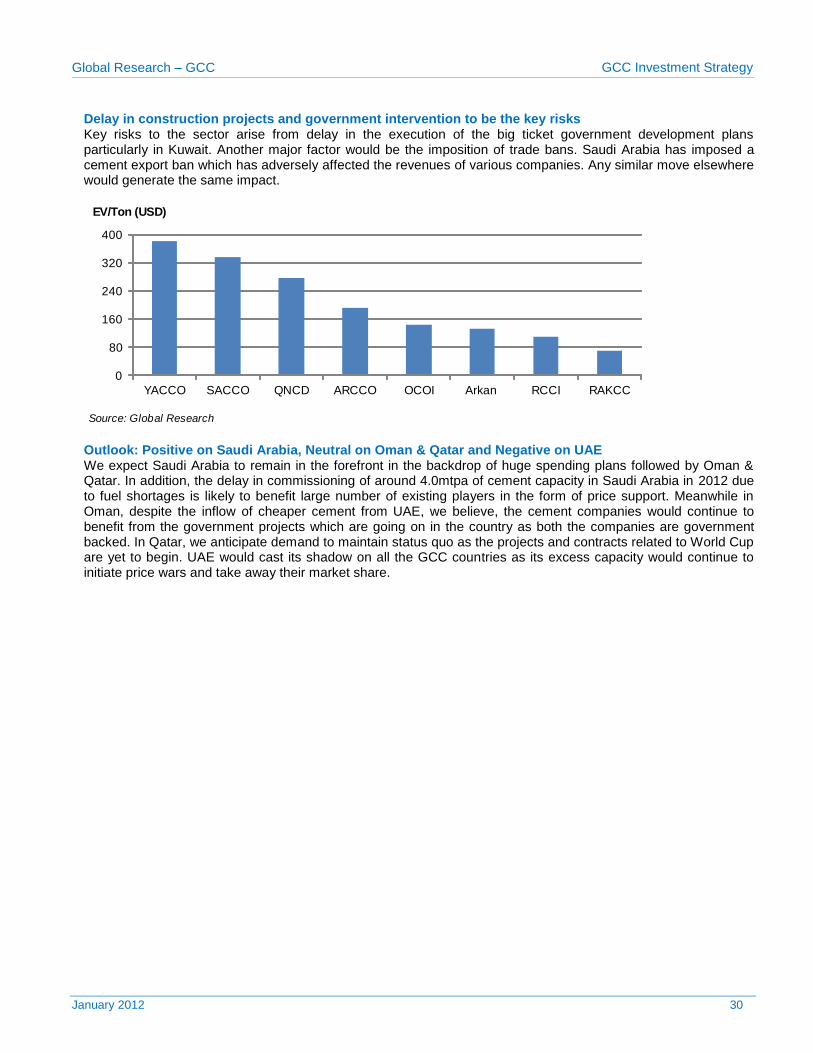
Delay in construction projects and government intervention to be the key risks Key risks to the sector arise from delay in the execution of the big ticket government development plans particularly in Kuwait. Another major factor would be the imposition of trade bans. Saudi Arabia has imposed a cement export ban which has adversely affected the revenues of various companies. Any similar move elsewhere would generate the same impact.
Outlook: Positive on Saudi Arabia, Neutral on Oman & Qatar and Negative on UAE We expect Saudi Arabia to remain in the forefront in the backdrop of huge spending plans followed by Oman & Qatar. In addition, the delay in commissioning of around 4.0mtpa of cement capacity in Saudi Arabia in 2012 due to fuel shortages is likely to benefit large number of existing players in the form of price support. Meanwhile in Oman, despite the inflow of cheaper cement from UAE, we believe, the cement companies would continue to benefit from the government projects which are going on in the country as both the companies are government backed. In Qatar, we anticipate demand to maintain status quo as the projects and contracts related to World Cup are yet to begin. UAE would cast its shadow on all the GCC countries as its excess capacity would continue to initiate price wars and take away their market share.
EV/Ton (USD)
Source: Global Research
0
80
160
240
320
400
YACCO SACCO QNCD ARCCO OCOI Arkan RCCI RAKCC
Global Research – GCC GCC Investment Strategy
January 2012 31
Construction Sector Investment Thesis
Key Risks to Valuation
Over USD1.4tn of active projects in MENA.
Huge amount budgeted for infrastructure & construction projects.
Saudi Arabia to be the front runner in the project pipeline.
Acquisitions, strategic alliances and joint ventures to continue.
Slower than expected recovery could lead to project cancellations.
Bargaining power of developers further shrinks the margins.
Receivables of the companies continue to rise.
Funding and project financing may be tough especially for foreign entrants.
Over USD1.8tn of projects underway in GCC; roughly 24% inactive The lingering global financial downturn and the political uncertainty caused by this years’ uprisings is reflected in the exit of several mega real estate projects from the list as developers exercise caution and put planned schemes on hold. Nevertheless there are USD1.4tn of active projects in GCC in hydrocarbons, public infrastructure projects, refineries, power plants, roads, hospitals and various other segments. Saudi Arabia continues to remain at the top with highest number of active projects followed by UAE more specifically Abu Dhabi as Dubai still reels with problems related to its debt maturities. UAE projects market continues to fall as more and more of Dubai based projects have either come online or have been completely shelved off.
We believe that they are various opportunities available for construction contracting companies in Saudi Arabia, Kuwait & Qatar and these market would continue to be sought by various companies. Backlog growth momentum to continue Backlog growth which is the key driver for the top line of contracting companies has started to pick up in recent quarters driven by new order wins in Saudi Arabia. As of 2011, we anticipate backlog roughly of companies within our coverage to touch USD13.3bn as compared to USD12.3bn at the end of 2010. Within our coverage we believe that the share of Saudi Arabia is set to touch 40% in 2011 from 29% in 2010 and 18% in 2009. Looking at the individual companies’ backlogs, we believe that the risk of further project cancellations is behind us. Going forward, growth in backlogs will largely be a function of the end sub-sector and geographical exposure of individual companies. Amongst our coverage, Saudi Arabian contractors are estimated to report stronger growth in backlog by 31% followed by DSI whose backlog is estimated to grow by 24%.
Within our coverage we anticipate DSI to fare better amongst all, since the company is geographically diversified and has established foothold in most of the GCC countries by acquiring already existing strong companies. Acquisitions and JV’s continued and expected to do so going forward Prior to the economic slowdown and Dubai debt issues, the ever-expanding pie of work in GCC coupled with attractive margins, encouraged significant capacity build up. In addition to organic growth, well-established contractors took the acquisition route to expand their scope of activity and expand their geographical reach. The sector witnessed 11 transactions (4 acquisitions and 7 joint ventures) in 2011 compared to 8 (4 acquisitions and 4 joint ventures) in 2010.
Given the companies’ current cash balances of over USD1.2bn and their strong fundamental outlook, we believe there will be continuation of such transactions in the coming years which would add to the backlog and respectively to the top-line of the Company. Orascom Construction to split OCI recently announced that it has decided to start the process of spinning off the construction business from the current conglomerate structure. The new proposed structure will result in OCI as the continuing company holding the fertilizer business while the construction business would be separately listed. Current shareholders would continue to hold one share of OCI fertilizer business while receiving free of charge one share in the new company. Both businesses of the Company are ranked amongst the top in their respective segments. Its contracting business being one of the biggest in MENA and its nitrogen fertilizer business being ranked third worldwide. We believe that the new companies which will result because of the split would have strong potential and can focus more in their areas of expertise and generate returns for the investors.
Company Backlog
Source: Company Reports
-
2.0
4.0
6.0
8.0
10.0
2008 2009 2010 2011e 2012e 2013e 2014e
(US
D b
n)
ARABTEC DSI OCI MMG ALKHODAR
Contractors Acquisitions and Joint Ventures in 2011
Company Quarter Country Share Company Name Business Acquisition / JV
DSI 1Q11 Saudi Arabia 100% ICCC * Construction Acquisition
OCI 1Q11 Italy 50% Maire Tecnimont Construction JV
2Q11 Egypt NA Arab Contractors Construction JV
2Q11 US 50% Pandora Methanol LLC Fertilizer Acquisition
Al Khodari 2Q11 South Korea 55% Lotte Engg & Construction Co Construction JV
2Q11 Saudi Arabia NA Al Yamama Co. / Al Kifah Group Construction JV
Mojil Group 1Q11 Oman 51% National Training Institute Construction JV
1Q11 Saudi Arabia 20% Saudi Masader Company Construction Acquisition
2Q11 Saudi Arabia 50% 3W Networks MMG Construction JV
2Q11 Saudi Arabia NA Gulf Elite Gen Contracting Co. Construction Acquisition
2Q11 Saudi Arabia 50% Al Rushaid Petroleum Inv. Co. Construction JV
Source: Company Reports & Zawya
Global Research – GCC GCC Investment Strategy
January 2012 33
Receivables management of UAE based contractors continues to remain a key issue At the end of 3Q11, combined receivables of UAE construction contractors stand at AED7.5bn, higher by 1.3% QoQ and 21.5% YoY. Overall receivables size as percentage of sector balance sheet size stands at 53.8% as of 3Q11. The receivables outstanding days of the sector stand at 354 days at the end of 3Q11 as compared to 345 days at the end of 2Q11 and 329 days in 3Q10. Amongst the two, company with highest receivables days is Arabtec at 381 days whereas DSI stands at 320 days. Although receivable days of Arabtec are higher but they have remained consistent and have not aggravated during the last 4-8 quarters but at the same time with increasing revenue and backlog of DSI, their receivable days have surged from 180 days in 3Q10 to 320 days in 3Q11. Margins to shrink in the long run MENA region contractors margins have remained significantly higher than the international peers. These were higher as during the construction boom, developers were awarded high margin contracts. However, lately that phase has passed and now competition has emerged which has forced contractors to shift their business mix. Nevertheless we believe that margins would remain under pressure in the long run as many international contractors have entered the market.
Long-term growth to remain firm Regardless of the collapse in regional real estate markets, we believe long-term outlook for construction contractors remains attractive. The region displays relatively unique characteristics: decent demographics, strong state budget surpluses fueled by high oil prices, muscular sovereign wealth funds and a drive to diversify economies. Hence we believe infrastructure and construction boom in MENA region would translate well in terms of profitability for regional contractors. In our view Dubai construction market will remain fundamentally weak in the coming years as the Emirate is facing issues related to oversupply and sliding real estate prices. However there are ample opportunities for contractors in Saudi Arabia, Abu Dhabi & Qatar.
Gross Margins & ROAE (2012e) Net Margins & ROAA (2012e)
Source: Global Research
ARABTEC
DSI
OCI (Cons Seg)
MMG
ALKHODAR
0.0%
5.0%
10.0%
15.0%
20.0%
25.0%
10.0% 13.0% 16.0% 19.0% 22.0% 25.0%
Retu
rn o
n A
vera
ge E
qu
ity
Gross Margin
ARABTEC
DSI
OCI (Cons Seg)
MMG
ALKHODAR
1.0%
3.0%
5.0%
7.0%
9.0%
11.0%
2.5% 5.0% 7.5% 10.0% 12.5% 15.0%
Retu
rn o
n A
vera
ge A
ssets
Net Margin
Global Research – GCC GCC Investment Strategy
January 2012 34
Petrochemical Sector Investment Thesis
Key Risks to Valuation
Additional output from new ventures and product diversification to support revenue streams.
Increase/decrease in oil and related product prices.
Over USD700bn petrochemical projects in Middle East; over USD350bn in GCC.
Increase in price of feedstock
Advantage of getting undisrupted feedstock at highly subsidized prices.
Delays in the initiation of new complexes.
Decline in oil prices to be compensated by increasing output.
Gas supply to new plants remains getting stricter.
Oil prices expected to remain at current levels After posting gains of over 25% in 2010, the same trend continued and the oil prices registered a further gain of 26.2% in 2011. For 2012, oil outlook is anything but clear, as macroeconomic, geopolitical and physical supply/demand factors all seem to point in different directions. Economic turbulence is shaking oil demand as the slowdown hits manufacturing activities worldwide. Slow oil demand, initiated in the OECD region, has moved to China and India, leading to a downward revision in next year’s oil demand growth forecast. Other regions are also expected to experience an economic slowdown, including countries like Brazil and several Latin American economies. Hence we assume volatility in oil prices and expect average prices in 2012 would maintain at the same level as they were in 2011. GCC countries continue to pump money into petrochemical projects High oil prices and steady production levels fueled economic growth in the region. Energy sector continued to dominate GCC countries’ revenues despite rigorous diversification efforts made by these economies to develop the non-oil sectors. In order to continue to benefit from previous high oil prices, GCC countries are focused on expanding their output by adding various new products to their offerings. As of today total value of planned projects in the regional petroleum sector is estimated at USD353bn. Despite this optimistic scenario, project postponement and cancellation trend continues to plague the market. Saudi Arabia to lead the market with USD215bn worth of new investment Saudi Arabia currently has approximately 147 projects upcoming in the petroleum sector, with an estimated cumulative value of USD215bn. These projects are focused heavily on the upstream oil and gas segment. One of the major upcoming projects is the Yanbu Integrated Refinery & Petrochemicals Complex that is currently in the study phase and has an estimated budget of USD20bn. Another major upcoming project is the Jizan Refinery Project that has an estimated budget of USD7bn. UAE follows with 116 projects with an estimated cumulative value of USD98bn UAE currently has roughly 116 projects upcoming in the petroleum sector, at an estimated cumulative value of USD98bn. These projects are focused heavily on the upstream oil and gas segment. One of the major upcoming projects is the Tacaamol – Al-Gharbia Chemicals Industrial City project that is currently in planned phase, and has an estimated budget of USD20bn. Another major upcoming project is the Zadco and has an estimated budget of USD10bn. Asian region to raise the demand; America to follow & Europe to remain weak Emerging markets are increasingly becoming the drivers of growth in the global economy as mature and developed markets struggle with slow or even negative growth. This is especially true for the petrochemicals industry, which is banking on emerging markets in Asia and elsewhere absorbing new capacity due to come on stream in the next few years. We believe a major chunk of future demand growth will come from this region and should enable the GCC petrochemicals industry to find a ready market for the output of the aggressive capacity expansion projects currently underway at various locations. While we believe that America has gradually come
Global Research – GCC GCC Investment Strategy
January 2012 35
out of recession as recent economic numbers were quite encouraging we believe that the demand from the region would be better than the previous years. While for Europe we believe that there are high chances of economic slowdown leading to recession which will cast shadow on the demand of petrochemical products. Developed markets not witnessing capacity additions Petrochemicals capacity expansion in the developed markets, especially the US, has been muted since the turn of the century. Natural gas prices which had averaged USD2/mmbtu throughout the 1990s have shot to highs of over USD13/mmbtu in 2008 and averaged around USD6/mmbtu in this decade. With oil prices staying above USD70 per barrel, naphtha prices have also risen in tandem. As a result, European and US petrochemicals crackers have increasingly found it difficult to compete with low-cost Middle Eastern players. As petrochemicals are commodity products, price is often the single most distinguishing factor. This fact enables low-cost producers to outmaneuver high-cost players. In consequence, we expect capacity shutdowns in developed markets such as the US and the EU as companies increasingly try to rationalize their capacity portfolio in order to compete more with the low-cost producers. Capacity to grow at a CAGR of 2.9% during 2011-13 We expect the total petrochemical regional capacity to increase at a CAGR of 2.9% during 2011-13 with most of the additional production capacity from KSA followed by Qatar. In terms of growth, the capacity expansion from Qatar is expected to increase at a CAGR of 13.4% during 20011-13. This will reflect positively on the improvement in the regional market share i.e. 14.2% in 2013 as compared to 10.3% in 2010.
Shift in feedstock The GCC is currently experiencing a shortage of ethane, historically the prime feedstock for its petrochemical plants, due to the increased domestic demand to fuel other industries, primarily power, steel, and aluminium. Moreover, the region is developing policies to give priority to domestic gas use over export, phase out price subsidies, and align domestic natural gas prices with export prices. As a result, some project owners such as ChemaWeyaat in the UAE, Saudi Kayan and owners of future downstream petrochemical clusters in Saudi Arabia are moving away from ethane-based, export orientated petrochemical production and are now developing plans to produce a wider slate of high-value specialty chemicals for the automotive, textile, electronic, construction, agricultural, and pharmaceutical industries. Regional fertilizer companies continue to grow We expect regional fertilizer capacity to increase at a CAGR of 16.4% during 2009-13 with most of the expansion of 13.3m tons expected from Saudi Arabia followed by Oman and Qatar. The major expansion in Saudi Arabia and Qatar is mainly due to:
Availability of undisrupted supply of feedstock gas at highly subsidized prices.
Ongoing demand-supply gap in Asian & Far East markets.
Expectations of average prices of fertilizer products to remain strong.
GCC Petrochemical Production Capacity
Source: Industry Sources
-
10
20
30
40
50
60
70
2006 2007 2008 2009 2010 2011e 2012e 2013e
mtp
a
Saudi Arabia Qatar UAE Bahrain Kuwait Oman
Global Research – GCC GCC Investment Strategy
January 2012 36
Consequently, these factors will lead the regional fertilizer sector to continue its growth with gross margins to remain at an average of 68% during 2011-13.
Outlook Demand for petrochemicals and their offshoots have historically trailed global economic trends due to the nature of their end uses. During the onset of the global economic crisis, demand and, therefore, prices of petrochemical products plummeted to historic lows. Although prices have since recovered, the long-term outlook for petrochemical products appears set to be challenged and shaped by the emerging trends affecting the global petrochemical sector value chain. Within the sector we remain Bullish on SABIC & YANSAB while SAFCO offers significant dividend yield.
2012 to further build on Dubai nascent signs of stabilization
Extended slowdown in global growth to hurt Dubai and Abu Dhabi
Abu Dhabi to continue its downward slide on new supply flooding the market
Financing for new projects in Saudi still a barrier for development acceleration
Saudi and Kuwait remain strong in the residential and retail markets
Upcoming quality retail supply in Kuwait to pressure yields
Maintain a negative outlook on the office segment across the board
Selectively expect property managers to outperform developers again
New office supply a key short-medium term risk
2011 harsh on UAE, but Dubai is showing early signs of stabilization In spite of the several project cancellations and delays that took place in the two major UAE markets, 2011 proved yet another tough year for the Dubai and Abu Dhabi property markets as expected earlier on the year. Average prices for residential units dropped 12% and 17% on average in both markets, respectively whereas apartment rents followed a similar pattern moving down 9% and 12%. The quarterly rate of decline, however, is starting to signal early signs of stabilization with Dubai villa rents increasing slightly in the third quarter while the pace of decline in apartment rents has decelerated significantly compared to the 2009 – 2010 period.
Office rents also followed suit down 10% on average in Dubai and 20% in Abu Dhabi reflecting the slowdown in business activity coupled with relentless new supply entering the two markets leaving them with an estimated vacancy of 45% in Dubai and 20% in Abu Dhabi up from 40% in the former and 10% in the latter at the end of 2010. Expect selective solidity in Dubai, More downward pressure in Abu Dhabi Digging into 2012, Dubai selling prices of residential units should bottom out by 1H12 but is still off from a general price appreciation as the market will remain overflowed with excess supply and significant new inorganic demand is not expected in 2012, in our view. We expect the same for the office market as new supply equivalent to 20% of existing capacity is expected to enter the market during 2012 and 2013. For the Dubai hospitality segment, we do not expect the improvements that took place during 2011 as a result of the Arab spring to be extended further in 2012 but see a more negative spell on leisure tourism and business travel from the overall negative global sentiment. For the retail segment, we see further stability as the absence of new future supply, the firmness of rental rates and moderate vacancy rates during 2011 act as positive indicators in the near future.
Dubai Residential Units Supply 2010 - 2013 Abu Dhabi Residential Units Supply 2010 - 2013
Source: Jones Land LaSalle Source: Jones Land LaSalle
315331 331
358
27
11
280
290
300
310
320
330
340
350
360
370
380
2010 2011e 2012e 2013e
Un
its (000')
Completed Supply New Supply
185 204 204224
20
22
0
50
100
150
200
250
300
2010 2011e 2012e 2013e
Un
its (o
oo')
Completed Supply New Supply
Global Research – GCC GCC Investment Strategy
January 2012 38
In Abu Dhabi, we expect 2012 to see a further 15% drop in selling prices of residential units and 10% drop in rents as new supply continues to enter the market. We also expect further deterioration in the office market as considerable new supply is currently in the pipeline pressuring both property prices and rental rates downwards. Our outlook on Abu Dhabi hospitality segment is also negative for 2012 given the new supply entering the market coupled with low demand for tourism and an already feeble performance in 2011. The retail segment was able to maintain stable performance in terms of rental rates on the absence of new quality supply but is expected to see further downward pressures going forward as several deliveries are scheduled in 2012 and 2013. Saudi maintained its upward drift, increasing vacancy rates in the office segment In Riyadh, the residential market comfortably absorbed the new supply of c.25,000 units delivered throughout 2011. Selling prices in the residential market maintained their upward trend supported by the rise of input commodity prices like steel and cement along with increasing land prices. Villa and apartment rents increased 9% and 10% YoY on average. Villa and apartment rents in Jeddah also reported a 12% and 15% annual increase as the market continued to suffer from a state of undersupply.
Vacancies in the office market increased in 2011 to around 15% in Riyadh up from 10% at the end of 2010 as the market fails to totally absorb the new 290,000 sqm of office space. Average rents have inched higher during the year despite the increasing vacancies as tenants became more willing to upgrade to higher quality premises at slightly higher rates passing the vacancies through to lower grade sites. In Jeddah, current vacancy rates also stand at around 10-15% but are expected to increase as new supply of 180,000sqm will enter the market in 2012 and 2013 whereas vacancies in the CBD are, already, much higher reaching up to 20%. Same upward trend is expected in 2012 We do not expect any significant trend changes in 2012 in Riyadh and Jeddah as the major market dynamics remain in place. In our view, affordability constraints, supply shortage of ready residential units and high activity on land speculation will continue to drive property prices and rentals higher in both markets. Funding developers will also remain a key issue in the Saudi market especially in the almost near absence of off plan sales in a market where financing is most needed to accelerate the pace of construction. In spite of the growing economy and business activity, we preserve our negative view on the office market on the back of the large amount of new supply entering the market over the coming two years. In the retail segment, the only major new addition in 2012 will be Dar Alarkan’s AlQasr Mall. We expect the market absorption of new supply to remain on the strong side given the lack of quality supply and the inherent importance of retail malls in Saudi as an entertainment destination. Kuwaiti land prices continued to push housing prices higher Land prices in Kuwait maintained their long term upward move in 2011 after slowing down in the period between 1Q08 and 2Q10 increasing by an average of 20%. The majority of transactions remained in the private housing segment, which meant that land price inflation was passed through to prices of houses with transactions in some areas witnessing increases of 25-30% over 2010 prices.
Riyadh Residential Units Supply 2010 - 2013 Jeddah Residential Units Supply 2010 - 2013
Source: Jones Land LaSalle Source: Jones Land LaSalle
858 882 882
911
29
30
800
820
840
860
880
900
920
940
960
2010 2011e 2012e 2013e
Un
its (000')
Completed Supply New Supply
703719 719
737
18
19
670
680
690
700
710
720
730
740
750
760
770
2010 2011e 2012e 2013e
Un
its (o
oo')
Completed Supply New Supply
Global Research – GCC GCC Investment Strategy
January 2012 39
The office market, on the other hand, is highly oversupplied with some alarming vacancy rates in the CBD that reached as high as 30% during 2011 with very low take up rate for new deliveries. The retail segment, however, maintained its strong posture and footfall growth during the year for the already operating well positioned malls while new market entrants are still struggling to attract shoppers, which could be an early sign of saturation, in our view. Current market dynamics to remain intact Based on our analysis of the current growth dynamics of the Kuwaiti real estate market, we expect the major trends to hang about the same fashion as in 2011. For the residential market, we expect trading volumes and values for the private housing segment to keep on increasing so long as organic demand remains intact and attractive capital gains are attainable. The same trend should materialize in the investment housing segment as yields remain on the attractive realm of 7-8% as opposed to sluggish stock market performance and very low returns on bank deposits. For the office market, vacancies are expected to increase as new supply enters the market during the year with major deliveries in 1H12. Elsewhere, the delivery of Mabanee’s Phase III of The Avenues Mall will be the major addition to the retail market during the year. Performance in the hospitality segment is expected to remain sluggish on the back of slow business activity and an inherent lack of tourism inflow. Property managers to remain on the forefront in 2012 We expect asset managers with strong visible recurring income profile to outperform in 2012, on a relative basis, as was the case in 2011. Our opinion is developed given our anbalysis of the eight real estate companies under our coverage where we do not see any significant deliveries for EEC or Dar Alarkan in Saudi as well as a sluggish 2012 Abu Dhabi market for the two Abu Dhabi based developers; Aldar and Sorouh. Emaar is our favorite story in terms of international developments deliveries although risks of delays and defaults could materialize if the political situation in the region worsens. In Kuwait, Phase III of Mabanee’s star project; The Avenues Mall will start operations, which should boost 2012 earnings before almost doubling it 2013. Salhia also has a decent recurring income profile but net earnings are squeezed by high debt service costs. Emaar’s very strong retail portfolio is expected to maintain its strong operational performance while the hospitality segment could face some obstacles in terms of sustaining its 2011 ADRs and vacancy rates. Akaria is another visible story providing stable revenue generation with potential risks to earnings forecasts mostly to the upside on unaccounted for land sales. For Aldar and Sorouh, the outlook remains bleak in the short term given market conditions and squeezed margins realized on recent deliveries. Specifically for Aldar, concerns linger over the need for more financing, and perhaps further dilution, in the near future in case new convertibles are issued. For Dar Alarkan, we maintain our view that the company will be able to meet its debt obligations on the 2012 Sukuk. This means that external financing is urgently needed to revamp the slowing down construction activity of the development projects. We believe securing this kind of financing will act as a major boost to the stock price.
Global Research – GCC GCC Investment Strategy
January 2012 40
Telecom Sector Investment Thesis Key Risks to Valuation
Diversification in other markets is the only way forward for further growth.
Core home markets for incumbent telecom operators are under pressure.
In GCC, the next phase of growth will be led by broadband services.
Implementation of Mobile Number Portability will change market dynamics.
Many GCC operators have strong balance sheet & sound operations in many of their portfolio countries.
Operators need to be more diligent in diversification strategy in other unfamiliar markets beyond GCC.
Sector growth immune to political instability, if any.
M&A likely to resume among operators.
Any change in operational dynamics, especially from the regulatory authority.
Forex volatility in diversified telcos.
Limited growth from traditional services Regional telecom operators overall continue to post revenue gains. However, the high penetration rates show that the region is likely approaching saturation levels, a trend underscored by high penetration rates, and therefore revenue growth is slowing. In GCC markets, operators are experiencing slowing or declining ARPU (average revenues per user) and face the need to prepare for limited growth from traditional services (voice and sms). In fiscal year 2011, incumbent operators in Saudi Arabia, the UAE, Qatar, and Bahrain began to experience flat or declining revenue growth. As a result, operators will need to rely on efficiency gains rather than scale alone to maintain their bottom lines.
Competition likely to get tougher The year 2011 witnessed aggressive competition among telco operators in GCC. We expect competition is likely to get tougher on the pricing front and therefore margins are likely to get impacted. Telecom companies in GCC will continue to increase capital expenditure, investing in network infrastructure to improve network quality and offer more value-added services to customers.
Source: Global Research
EBITDA Margins of Regional Telcos
-5.0%
5.0%
15.0%
25.0%
35.0%
45.0%
55.0%
Qte
l
Wa
tan
iya
Za
in
Om
an
tel
Etisa
lat
Ba
telc
o
ST
C
Mo
bily
Vo
da
fon
e Q
ata
r
2010 2011e 2012e
Global Research – GCC GCC Investment Strategy
January 2012 41
Broadband – high growth connection With the high competition GCC telecom market is becoming increasingly saturated, the GCC telecom operators are jostling for position. Central to all of their strategies is a greater focus on mobile data services. Data contribution to total revenue is at its early stage and therefore has huge growth potential. Revenue from data services and the Internet will continue to rise for local operators with a drop in the share of voice segment revenues to total revenues. M&A’s – did not materialize in 2011 Besides the organic and inorganic growth plans pursued by regional operators, consolidation will be another force shaping the regional telecom competitive landscape. We are of the opinion that in GCC, factors like maturing level of SIM penetration, stiff competition (leading to ARPU dilution) and further deregulation (issuance of further licenses, implementation of MNP) all these factors are likely to affect profitability margins. Therefore, we expect that M&As are likely to continue within the region as well as cash rich operators will continue to eye overseas acquisitions to offset the declining trend in core home markets. However, we have seen that 2011 was somewhat muted on this front. In string of "almost deals" but failure to strike an agreement were UAE-based telecom giant Etisalat scrapped its USD12bn offer to buy a controlling stake in Kuwait-based Zain, The deal would have made Etisalat the regional heavyweight, but it had been plagued by delays and disputes. Similarly Batelco and Kingdom Holding scrapped their plans to acquire a 25% stake in Zain KSA. Overseas expansion The theme for the incumbent operators in GCC is similar as they have invested in overseas markets to hedge against the decline in revenues and market share in the domestic markets. The performance of these companies are increasingly become dependent on overseas operations. We are of the opinion that going forward in home markets growth is likely to be limited and careful diversification in other markets is the only way forward for further growth. Outlook The large and transient expatriate populations in the Gulf countries are also a factor in encouraging competition, and thus growth and penetration rates - with a fluid population new operators (2nd & 3rd operators) had a better chance of gaining market share. However in GCC telecom space competition is likely to get more fierce going forward. Customers will eventually benefit from lower tariffs and bundled offers are likely to increase in the near future. Operators will continue to focus on cost optimization and driving efficiencies to manage their growth, margins and profitability expectations.
In GCC telecom sector each company in the region has different operational dynamics depending on its reach in the domestic market, its strategy for overseas expansions and funding strategy. Out of our coverage of 9 Telcos in GCC, Qtel (Qatar), Wataniya Telcom (Kuwait), and Mobily (KSA) remain our preferred picks.
Supply trails demand due to delay in implementation of power plants.
Growth outlook is promising as most of GCC economies will report GDP growth.
Downturn in GDP growth.
Delay in implementation of power projects.
Further entrants of new players will make the market more competitive.
Deceleration of private investments in the sector.
The GCC countries are witnessing burgeoning power demand and the sector is growing at the rate of 8%-10% annually. According to the World Energy Council, the GCC will require 100 GW of additional power over the next 10 years to meet demand. The GCC power sector will require about USD50bn of investments in new power generating capacity and USD20bn in desalination. The forecast for 2030 represents a compound annual growth rate of 7% per annum. This forecast compares to a global rate of 1.8% per annum, placing the GCC countries with one of the highest power demand growth rates in the world. Value of GCC Power and Water Projects
Number of projects Projects value (USD)
% of GCC projects by value
UAE 11 10 bn 31%
Saudi Arabia 11 8.6 bn 27%
Bahrain 3 4.1 bn 13%
Qatar 3 3.3 bn 10%
Kuwait 10 3.4 bn 11%
Oman 6 2.5 bn 8%
Total 44 31.9 bn 100%
Source: Zawya (Ventures Middle East)
GCC Power and Water sector ramping up capacity base As per the latest industry data there are 44 power and water projects in the GCC valued at USD31.9bn already underway or due to begin in 2012.
The UAE leads the way with 11 projects valued at USD10bn, including the USD800mn Hassyan 1 Independent Power Plant, on which construction is slated to begin in 2012.
Saudi Arabia also has 11 new projects underway or due to start in 2012, valued at USD8.6bn, including the USD2bn Al Qurrayah Independent Power Plant (IPP).
In Kuwait, ten projects are underway valued at USD3.4bn, seven of which will begin construction in 2012.
Bahrain has three projects valued at USD4.1bn, including the independent water and power plant in Al Dur, which has been ongoing since 2008.
Qatar has three projects valued at USD3.3bn, while Oman has six projects valued at USD2.5bn, all of which will begin construction in 2012.
This investment in power generation is essential to meet the demand emanating from the aggressive diversification attempts and infrastructure led developments in the GCC countries.
Global Research – GCC GCC Investment Strategy
January 2012 43
Thrust on IWPPs The IWPP model has helped GCC countries meet demand for electricity and water, which is rising rapidly on the back of growing populations and energy-intensive infrastructure and industrial projects. Private projects account for around 40,000MW of power capacity in the region. The year 2011 witnessed 3 IPPs being awarded in the GCC with 7,500MW of new capacity contracted. It is likely that 2012 will also follow the suit with almost same volume. Saudi Arabia, Oman and possibly Abu Dhabi are all planning to award more private capacity and are due to be joined by Kuwait and Dubai, the GCC’s last bastions of state generation. In GCC as such there is no shortage of power on an aggregate level in the region, at a granular level pockets of over-capacity currently exist. This is the case in Saudi Arabia and within parts of the UAE, such as Abu Dhabi and Dubai, while Sharjah suffers from electricity shortages. Kuwait, Oman, and Bahrain all experience power shortages at times of peak demand. Till now Kuwait was the only GCC country not to embrace private developers, however, it is planning to beef-up its capacity and is set to award its first privately developed power and water projects. In a short span of time Qatar has ramped up the capacity on a rapid pace. This made the Qatar the surplus state and during the summer of 2011, it has exported 200MW of surplus electricity to the GCC electricity grid (GCCIA).
Top 10 Power Projects in GCC
Country Projects Capacity (MW) Commission Date Cost (USD bn)
1 UAE Hassyan IWPP 9,000 2014 18.0
2 UAE Braka Nuclear Facility 5,600 2017 20.0
3 Saudi Arabia Shuaiba 3 Expansion 5,600 2013 3.0
4 Saudi Arabia Rabigh Plant Extension 2,800 2015 3.4
5 Saudi Arabia Ras Al Zour 2,800 2014 4.0
6 Saudi Arabia Yanbu I and II 2,500 2012 4.0
7 Saudi Arabia Jizan Economic City Power Plant 2,400 2013 2.5
GCC Grid Saudi Arabia, along with its GCC neighbors, planning to export electricity. In 2009 the GCC Interconnection Grid was established, which has already linked the utility networks of five GCC states, with Oman set to join soon. The joint project between Saudi Arabia, Bahrain, Qatar, man, Kuwait and the UAE will allow the nations to reduce the frequency of power outages by exchanging generation capacities across seasons and time zones. It is hoped that this regional grid will one day be linked to the Egyptian network, thereby connecting a major part of the Arab world's electricity through one grid. The Interconnection Grid has provided huge benefits to those states connected. Longer term, the GCC harbors ambitions to export electricity further afield, including to Europe. Focusing on nuclear energy Perhaps the biggest challenge facing utilities in the coming years will be how to secure the necessary feedstock to power the new capacity. With the exception of Qatar, all GCC states are facing increasingly tight gas markets leaving governments with little option but to pursue alternative energy production. In Saudi Arabia and Kuwait, liquid fuels, in the form of crude oil and diesel, have overtaken gas as the largest source of feedstock. However, this has come at a high price with Riyadh alone burning an estimated 800,000 b/d in its power plants. The increasingly high cost of burning liquid fuels and the environmental concerns over coal have left nuclear power as the favored option in much of the GCC. There is a growing acknowledgement in the GCC that nuclear power will have to play a significant role in future if the high power demand growth is to be met and electricity shortages are to be averted. Toward this end, Saudi Arabia has plan to spend more than USD100bn to build 16 nuclear energy plants over the next few years. The kingdom is keen to develop solar and other renewable energy technologies to reduce dependence on oil and gas. It has allocated USD3bn to produce solar energy panels in Jubail and Yanbu.
Global Research – GCC GCC Investment Strategy
January 2012 44
The UAE is currently discussing options for the supply of nuclear fuel with several countries including Australia and Russia, and expects to award the contract in the first quarter of 2012. Outlook Industry experts are of the opinion that the power sector in the GCC region has seen exponential growth, with demand for electrical power to triple over the next 25 years. Leaving aside the global recession, massive investments are being planned in the GCC especially in mega energy and industrial sectors. Expanding population and social developments are other major drivers for utilities demand to grow at such high rates. We have optimistic stance for the sector as a whole. We cover 3 utilities companies in GCC, Qatar Electricity & Water Co. (Qatar), Saudi Electricity Co. (KSA), and Abu Dhabi National Energy Co. – Taqa (UAE). Out of this, QEWC is our preferred pick as we consider it as a safe bet due to its cost-plus agreements with KAHRAMAA, its sole customer. Saudi Electricity though it is operating in a high demand growth country, its highly subsidized residential tariffs and huge capex requirements makes it not a preferred bet.
However, it has recently announced its restructuring plan to split it into six companies, the further details are still awaited. We believe that this restructuring exercise will have significant impact on the company's stock price as well as on our fair value. Taqa is not only a UAE-based utilities company but a global energy player. Its strong liquidity position, growing asset portfolio and strong performance makes TAQA a strong investment case.
The Commercial Bank of Qatar BUY CBQK QD COMB.QA QAR 85.5 1,10
The Saudi British Bank HOLD SABB AB 1060.SE SAR 40.8 1,10
Union National Bank STRONG BUY UNB UH UNB.AD AED 2.89 1,10
Vodafone Qatar HOLD VFQS QD VFQS.QA QAR 7.54 1,10
Yamama Saudi Cement Company HOLD YACCO AB 3020.SE SAR 70.75 1,10
Yanbu National Petrochem. Co. STRONG BUY YANSAB AB 2290.SE SAR 43.8 1,10
1. Global Investment House did not receive and will not receive any compensation from the company or anyone else for the
preparation of this report.
2. The company being researched holds more than 5% stake in Global Investment House.
3. Global Investment House makes a market in securities issued by this company.
4. Global Investment House acts as a corporate broker or sponsor to this company.
5. The author of or an individual who assisted in the preparation of this report (or a member of his/her household) has a direct
ownership position in securities issued by this company.
6. An employee of Global Investment House serves on the board of directors of this company.
7. Within the past year , Global Investment House has managed or co-managed a public offering for this company, for which it
received fees.
8. Global Investment House has received compensation from this company for the provision of investment banking or financial
advisory services within the past year.
9. Global Investment House expects to receive or intends to seek compensation for investment banking services from this
company in the next three months.
10. Please see special footnote below for other relevant disclosures.
Global Research: Equity Ratings Definitions
Global Rating Defination
STRONG BUY Fair value of the stock is >20% from the current market price
BUY Fair value of the stock is between +10% and +20% from the current market price
HOLD Fair value of the stock is between +10% and -10% from the current market price
SELL Fair value of the stock is < -10% from the current market price
Global Research – GCC GCC Investment Strategy
January 2012 130
Disclaimer This material was produced by Global Investment House KSCC (‘Global’),a firm regulated by the Central Bank of Kuwait. This document is not to be used or considered as an offer to sell or a solicitation of an offer to buy any securities. Global may, from time to time to the extent permitted by law, participate or invest in other financing transactions with the issuers of the securities (‘securities’), perform services for or solicit business from such issuer, and/or have a position or effect transactions in the securities or options thereof. Global may, to the extent permitted by applicable Kuwaiti law or other applicable laws or regulations, effect transactions in the securities before this material is published to recipients. Information and opinions contained herein have been compiled or arrived by Global from sources believed to be reliable, but Global has not independently verified the contents of this document. Accordingly, no representation or warranty, express or implied, is made as to and no reliance should be placed on the fairness, accuracy, completeness or correctness of the information and opinions contained in this document. Global accepts no liability for any loss arising from the use of this document or its contents or otherwise arising in connection therewith. This document is not to be relied upon or used in substitution for the exercise of independent judgment. Global shall have no responsibility or liability whatsoever in respect of any inaccuracy in or omission from this or any other document prepared by Global for, or sent by Global to any person and any such person shall be responsible for conducting his own investigation and analysis of the information contained or referred to in this document and of evaluating the merits and risks involved in the securities forming the subject matter of this or other such document. Opinions and estimates constitute our judgment and are subject to change without prior notice. Past performance is not indicative of future results. This document does not constitute an offer or invitation to subscribe for or purchase any securities, and neither this document nor anything contained herein shall form the basis of any contract or commitment whatsoever. It is being furnished to you solely for your information and may not be reproduced or redistributed to any other person. Neither this report nor any copy hereof may be distributed in any jurisdiction outside Kuwait where its distribution may be restricted by law. Persons who receive this report should make themselves aware of and adhere to any such restrictions. By accepting this report you agree to be bound by the foregoing limitations.
Global Research – GCC GCC Investment Strategy
January 2012 131
Global Research Team
Analyst Title Telephone Email
Faisal Hasan, CFA SVP - Head of Research Tel: (965) 2295-1270 [email protected]
Lamya Hayat Senior Financial Analyst Tel: (965) 2295-1203 [email protected]