February 19, 2014 Initiation COMPANY RESEARCH | SEE PAGE 23 FOR IMPORTANT DISCLOSURES AND ANALYST CERTIFICATIONS GCL-Poly Energy (3800 HK) Brighter and clearer; Initiate BUY Initiate at BUY with HKD3.60 TP, which is at high-end of the Street. After two years of industry consolidation, we believe GCL’s valuation is at the mid-point of the current up-cycle. We forecast GP margin to expand to 21% in 2014 and to 27% in 2015, vs the trough of 8% in 2012 on the back of cost reduction and ASP recovery. Positive on GCL acquiring Same Time (451 HK) on a conditional basis to enhance development of its solar projects. Increasing scale of GCL’s solar farm business could be another earnings driver. What’s New The PV grade polysilicon spot price climbed to ~USD21.15/kg, driven by the higher demand for solar power and the industry consolidation over the past two years. The price of polysilicon has rebounded by about 37% from the trough level of around USD15.4/kg at the end of 2012. What’s Our View We believe over the past two years, most of the negatives have been reflected in GCL’s share price. Although we estimate a loss for FY13, we expect a turnaround in FY14E and further improvement in FY15E. We expect global solar power demand will shift from the West to the East as we forecast China’s new installations in 2014 will contribute 31% of global demand. We expect the polysilicon price will have a continuous recovery to a conservative level of USD23/kg in 2015E. Apart from ASP recovery, GCL could also leverage its lower production costs to increase market share and to further improve profitability, in our view Going forward, the solar farm business could be the sweet spot for GCL given the attractive IRR in China. Initiate at BUY with TP of HKD3.60, based on 3x FY15E P/B. Key Data Share Price Performance Maybank vs Market Share Price: HKD2.63 MCap (USD): 5.3B Hong Kong Target Price: HKD3.60(+37%) ADTV (USD): 44M Energy (New) BUY 52w high/low (HKD) Free float (%) Issued shares (m) Market capitalization Major shareholders: -ZHU GONG SHAN FAMILY 32% -China Investment Corp. (Investment Mana 5% -The Vanguard Group, Inc. 2% 2.97/1.40 15,485 67.6 HKD40.7B 18,000 19,000 20,000 21,000 22,000 23,000 24,000 25,000 26,000 27,000 28,000 1.00 1.20 1.40 1.60 1.80 2.00 2.20 2.40 2.60 2.80 3.00 Feb-12 Jul-12 Dec-12 May-13 Oct-13 GCL-Poly Energy (L) Hang Seng Index (R) 1 Mth 3 Mth 12 Mth Absolute(%) (11.4) (1.5) 24.1 Relative to country (%) (9.3) 3.2 28.4 Positive Neutral Negative Market Recs 10 6 4 Maybank Consensus % +/- Target Price (HKD) 3.60 2.81 28.3 2013 PATMI(HKDm) -987 -968 1.9 2014 PATMI(HKDm) 1,481 1,522 (2.6) Source: FactSet; Maybank FYE Dec (HKD m) FY11A FY12A FY13E FY14E FY15E Revenue 25,505.6 22,348.0 24,622.3 27,629.9 29,385.6 EBITDA 9,302.0 3,322.0 4,417.1 8,079.4 10,120.0 Core net profit 4,274.9 (3,515.5) (986.8) 1,481.4 2,985.1 Core EPS (HKD) 0.28 (0.23) (0.06) 0.10 0.19 Core EPS growth (%) 6.2 nm nm nm 101.5 Net DPS (HKD) 0.06 0.00 0.00 0.02 0.04 Core P/E (x) 9.5 nm nm 27.5 13.6 P/BV (x) 2.0 2.5 2.7 2.5 2.2 Net dividend yield (%) 2.1 0.0 0.0 0.7 1.5 ROAE (%) 21.6 nm nm 7.7 14.0 ROAA (%) 7.9 nm nm 2.1 4.0 EV/EBITDA (x) 6.2 16.2 16.9 9.1 7.0 Net debt/equity (%) 108.9 172.9 201.0 175.9 138.4 Ricky WK Ng, CFA (852) 2268-0689 [email protected]
Transcript
February 19, 2014
Init
iati
on
CO
MPA
NY R
ESEA
RC
H |
SEE PAGE 23 FOR IMPORTANT DISCLOSURES AND ANALYST CERTIFICATIONS
GCL-Poly Energy (3800 HK)
Brighter and clearer; Initiate BUY Initiate at BUY with HKD3.60 TP, which is at high-end of the
Street. After two years of industry consolidation, we believeGCL’s valuation is at the mid-point of the current up-cycle.
We forecast GP margin to expand to 21% in 2014 and to 27% in 2015, vs the trough of 8% in 2012 on the back of costreduction and ASP recovery.
Positive on GCL acquiring Same Time (451 HK) on a conditional basis to enhance development of its solar projects. Increasing scale of GCL’s solar farm business couldbe another earnings driver.
What’s New The PV grade polysilicon spot price climbed to ~USD21.15/kg,driven by the higher demand for solar power and the industry consolidation over the past two years. The price of polysilicon hasrebounded by about 37% from the trough level of aroundUSD15.4/kg at the end of 2012.
What’s Our View We believe over the past two years, most of the negatives have been reflected in GCL’s share price. Although we estimate a loss for FY13, we expect a turnaround in FY14E and further improvement in FY15E. We expect global solar power demand willshift from the West to the East as we forecast China’s newinstallations in 2014 will contribute 31% of global demand. We expect the polysilicon price will have a continuous recovery to a conservative level of USD23/kg in 2015E. Apart from ASP recovery, GCL could also leverage its lower production costs to increase market share and to further improve profitability, in our view
Going forward, the solar farm business could be the sweet spot for GCL given the attractive IRR in China. Initiate at BUY with TP of HKD3.60, based on 3x FY15E P/B.
Key Data
Share Price Performance
Maybank vs Market
Share Price: HKD2.63 MCap (USD): 5.3B Hong Kong
Target Price: HKD3.60(+37%) ADTV (USD): 44M Energy (New)BUY
Figure 1: Utilization rate for Tier one polysilicon makers
Source: NPD Solarbuzz (historical), Maybank Kim Eng (forecast)
Figure 2: Polysilicon cash cost curve
Source: Company presentation, Maybank Kim Eng
Figure 3: We forecast GP margin to further rebound in 2015E
Figure 4: Our 2015E EPS estimate vs. changes in ASP & cost
Source: Maybank Kim Eng Source: Maybank Kim Eng
60%
65%
70%
75%
80%
85%
90%
95%
100%
1Q11
2Q11
3Q11
4Q11
1Q12
2Q12
3Q12
4Q12
1Q13
2Q13
3Q13
E
4Q13
E
2014
E
2015
E
-
5.0
10.0
15.0
20.0
25.0
30.0
0%
5%
10%
15%
20%
25%
30%
35%
40%
2010 2011 2012 2013E 2014E 2015E
(USD/kg)
Gross margin (LHS) Poly-si production cost (RHS)
0.08
0.11
0.15
0.23
0.28
0.320.290.26
0.23
0.19 0.160.12
0.09
0.00
0.05
0.10
0.15
0.20
0.25
0.30
0.35
-15% -10% -5% 0% +5% +10% +15%
(EPS,HKD)Poly-si ASP changes Wafer cost changes
We forecast the utilization rate of the Tier one polysilicon players will further improve to 82% in 2015E.
We believe the weak profitability of the industry in the last two years will not allow much capacity expansion in 2014E and 2015E. Thus, we forecast the new installation growth in 2015E could drive poly-si spot price to increase to HKD23/kg.
February 19, 2014 3
GCL-Poly Energy
Rise in ASP set to improve FY14F profitability The price of polysilicon has rebounded by about 37% from the trough level at the end of 2012. Polysilicon spot price reached USD21.15/kg on 12 Feb 2014, recovering from a low of USD15.4/kg at end-2012 (Figure 5). We forecast the polysilicon price will reach USD22/kg and USD23/kg in 2014E and 2015E.
In terms of wafer price, the 6-inch poly-wafer spot price has reached ~USD0.94/piece or USD0.25/W (assuming 3.8W/piece), an increase of ~16% compared with the trough level at end-2012 (Figures 6-7).
Figure 5: Polysilicon price trend and our forecast
Source: PVinsights, Bloomberg, Maybank Kim Eng Source: PVinsights, Bloomberg, Maybank Kim Eng, (assuming 3.8W/piece)
Upside potential from solar power demand According to Bloomberg New Energy Finance (BNEF), 39GW of new solar power were installed in 2013 globally, up 27% YoY, despite the lower installation in Germany and Italy. The main drivers were the installation growth from China and Japan. Specifically, in 2013 China installed 12.1GW of new solar power, up 232% from a mere 3.6GW added in 2012, while in Japan it rose by 173% YoY last year.
Forecast new global solar power installation in 2014 will reach 43GW, up 11% YoY & reach 46GW in 2015, up 7% YoY We expect China, Japan and the US will remain the growth drivers of solar power installation in the world. We forecast new installations in China and Japan will be 13.3GW and 8.1GW this year, representing 31% and 19% of the world’s new installations.
14
16
18
20
22
24
26
28
30
32
34
Feb 12 May 12 Aug 12 Nov 12 Feb 13 May 13 Aug 13 Nov 13 Feb 14
USD/kg
USD22/kg2014E Average
USD23/kg 2015E Average (base)
USD25/kg (Bull)
USD22/kg (Bear)
0.6
0.7
0.8
0.9
1.0
1.1
1.2
1.3
Feb 12 May 12 Aug 12 Nov 12 Feb 13 May 13 Aug 13 Nov 13
USD/piece
0.150.170.190.210.230.250.270.290.310.330.35
Feb 12 May 12 Aug 12 Nov 12 Feb 13 May 13 Aug 13 Nov 13
USD/W
February 19, 2014 4
GCL-Poly Energy
China In China, out of our forecast of 13GW of new installations in 2014, we estimate ~8.5GW will be from distributed PV (photovoltaic) and ~4.5GW from solar farms. In Nov 2013, China’s National Energy Administration (NEA) issued the Consultation Letter on PV Power Capacity Construction, which requires new PV installation to reach 12GW. In Jan 2014, China state television suggested the 2014 target has been revised up to 14GW. But during the same month, the NEA posted a document saying the target was just 10GW. We think 10GW should be the minimum target and we expect installations will be between 10GW and 14GW. Apart from the encouraging installations target set, we believe two government policies announced in 2013 could provide better visibility on solar power installations:
1) The NDRC announced three regional pricing variations for the feed-in tariff for PV generation: CNY0.90/kWh in Western China (such as Ningxia, parts of Gansu, Qinghai and Xinjiang), CNY0.95/kWh (such as in Beijing, Heilong Jiang and Hebei) and CNY1/kWh in Southern China (Figure 8). Distributed PV projects will also be eligible for a CNY0.42/kWh subsidy. The feed-in tariff cut from CNY1/kWh to a range of CNY0.9/kWh to CNY1/kWh is less than the market expected.
2) The government will permit a 50% VAT rebate for solar projects from 1 Oct 2013 to 31 Dec 2015.
Japan In Japan, we expect the feed-in tariff will decrease to JPY34/kWh in 2014 from around JPY40/kWh in 2012. Despite the potential tariff cut, we estimate the average IRR of solar projects in Japan could still reach between 17% and 20%.
Figure 8: Updated feed-in tariffs in China
Source: NDRC, Company presentation, Maybank Kim Eng
February 19, 2014 5
GCL-Poly Energy
Figure 9: Our forecast for new solar installations in 2014E by country
Source: Bloomberg, Maybank Kim Eng
Figure 10: Our forecast for new global installation growth
Source: Bloomberg, Maybank Kim Eng
Figure 11: New installations forecast for various countries
Source: Bloomberg, Maybank Kim Eng
Industrial consolidation since 2012 already squeezed out some capacity with high production cost Compared to the downstream, polysilicon and wafer supply is more concentrated and integrated. For polysilicon, the top-five players have an 80% market share (Figure 12). The top-four producers (GCL, Wacker, Hemlock and OCI) have around 200,000MT of capacity.
Germany7.4%
Italy3.5%
United States10.0%
Japan18.6%
China30.6%
Spain0.2%
France1.4%
UK2.8%
India2.7%
South Korea1.1%
Thailand1.0%
South Africa0.6%
Rest of the world20.1%
0%
20%
40%
60%
80%
100%
120%
140%
160%
0
5,000
10,000
15,000
20,000
25,000
30,000
35,000
40,000
45,000
50,000
2008 2009 2010 2011 2012 2013 2014E 2015E
MW Newly installation (LHS) YoY growth (RHS)
0
2,000
4,000
6,000
8,000
10,000
12,000
14,000
16,000
2008 2009 2010 2011 2012 2013 2014E 2015E
MVGermany Italy United States JapanChina India South Korea Thailand
February 19, 2014 6
GCL-Poly Energy
Figure 12: Market share of the world’s top-five producers of poly-si and wafers
Source: Solarbuzz, company presentation, Maybank Kim Eng
We expect the supply surplus will decrease As we forecast 43.3GW of new solar power installation globally in 2014E, we estimate the total demand for polysilicon and wafers will be 260 thousand MT and 43.4GW (after incorporating the yield and conversion losses and we assume 5.7g/W for polysilicon conversion to wafer and 10% will be other PV but non-crystalline). We also forecast the demand will reach 278 thousand MT in 2015 based on the 46GW forecast for new installations.
We estimate most polysilicon or wafer makers will not expand their capacity in 2014E and 2015E due to the weak profitability in the last two years. (Figures 13 and 14) We believe only eight polysilicon players were still producing during 1H13, as around 80% of the players had suspended production. However, the demand for solar power in 2013 appeared to be robust and we expect the momentum to continue in 2014E and 2015E.
Since we believe new capacity expansion will be limited in 2014 and 2015, we forecast Tier one players’ average utilization rate will continue to increase to a level of 82% in 2015E (Figure 16) on the back of the rising demand. We also forecast supply and demand will be more balanced in 2015E.
Figure 13: Profitability trend for Tier one poly-si makers Figure 14: Profitability trend for Tier one wafer makers
Source: Bloomberg, Maybank Kim Eng, Note: by simple average Source: Bloomberg, Maybank Kim Eng, Note: by simple average
Figure 15: Cumulative capacity of polysilicon producers (2014E)
Source: Maybank Kim Eng
Figure 16: Utilization rate for Tier one polysilicon makers
Source: NPD Solarbuzz (historical), Maybank Kim Eng (forecast)
We forecast polysilicon price of about USD22/kg in 2014 As mentioned, we forecast polysilicon demand to be 260 thousand MT in 2014E, given a 5.7g/W conversion rate assumption. We applied a low conversion rate for a more conservative polysilicon demand forecast. Based on the estimated cash cost curve analysis, we forecast the average polysilicon spot price in 2014E will be USD22/kg, up ~27% compared to the average in 2013. As we forecast the polysilicon demand will increase to 278 thousand MT in 2015E, we forecast the spot price will further increase to USD23/kg. (Figure 17)
If we assume the industry wafer processing cost to be USD0.13/W, we forecast the wafer price could reach USD0.26/W in 2014E, up 17%, compared to the average in 2012.
0
50,000
100,000
150,000
200,000
250,000
300,000
350,000
1 2 3 4 5 6 7 8 9 10 11 12 13 14 15
MT Cumulative capacity (from number 1 to 15, based on capacity)2014E demand forecast
60%
65%
70%
75%
80%
85%
90%
95%
100%
1Q11
2Q11
3Q11
4Q11
1Q12
2Q12
3Q12
4Q12
1Q13
2Q13
3Q13
E
4Q13
E
2014
E
2015
E
February 19, 2014 8
GCL-Poly Energy
Figure 17: Polysilicon cash cost curve
Source: Company presentation, Maybank Kim Eng
ASP upside potential for GCL We forecast the following: 1) ASP of GCL’s polysilicon in 2014E and 2015E will be USD22.5/kg and USD23.6/kg; 2) ASP of GCL’s wafers in 2014E and 2015E will be USD0.26/W and USD0.27/W.
Figure 18: Our polysilicon ASP forecast (USD/kg) Figure 19: Our wafer ASP forecast (USD/W)
Source: Maybank Kim Eng Source: Maybank Kim Eng
Cost reduction to help boost margins Lower production cost is GCL’s key competitive advantage, in our view. Figure 17 shows that GCL’s production cost is the lowest compared to other Siemens-based manufacturers in the world. We estimate GCL’s cash cost is only about USD15/kg for producing polysilicon. The reasons for the lower production cost are:
1) GCL produces all of its TCS (Tetrachlorosilane, raw material of polysilicon) in-house, which is significantly cheaper than buying it from suppliers.
2) GCL uses a modified Siemens process that allows a higher utilization of TCS, consuming less electricity. The self-development of CVD reactors. Energy consumption of the new CVD process is 40kWh/kg and the whole manufacturing process is about 65kWh/kg.
3) Apart from the ability to recycle STC (Silicon tetrachlorosilane, by-product) back to TCS by hydrochlorination at a lower temperature, GCL
47.7
20.816.6 17.2 17.4 19.0
22.0
0
10
20
30
40
50
60
FY11 FY12 1Q13 2Q13 3Q13 4Q13E 1Q14E
USD/kg
0.54
0.250.21 0.21 0.21
0.24 0.26
0.0
0.1
0.2
0.3
0.4
0.5
0.6
FY11 FY12 1Q13 2Q13 3Q13 4Q13E 1Q14E
USD/W
February 19, 2014 9
GCL-Poly Energy
successfully produced silane gas products with electronic grade in Sep 2012 and produced granular silicon through the silane method.
Room for cost reduction We expect there is room for further cost reduction for GCL’s products, driven by:
GCL developing silane gas and FBR (Fuildized Bed Reactor) granular silicon technology. We expect around 10% of polysilicon produced in 2014E could be from the FBR method. With the FBR method, polysilicon could be produced at a lower cost as this method could help lower energy consumption in polysilicon production by more than half.
GCL could develop its own power sources for polysilicon manufacturing to lower the electricity cost.
For wafer cost reduction, GCL could upgrade the ingot furnace from G5 (480kg-550kg) to G6 (880kg) and G7 (1200kg). GCL could also expand the use of online recycling technology in the slicing process and application of diamond wire technology.
Why FBR could provide room for cost reduction Owing to a larger total surface area of silicon crystals than rods
adopted in the Siemens process, it could produce more silicon per cubic metre of reactor space.
It is a continuous process rather than a batch process so there will be less downtime or set-up effort required.
It will not waste energy by placing heated gas and silicon in contact with cold surfaces.
FBR granular is harvested in a ready-to-use form and does not require the breaking of polysilicon rods.
FBR granular polysilicon could be more convenient for packaging, storage and logistics. The granular size of polysilicon could help maximize crucible load weight to increase productivity.
Figure 20: Total production cost breakdown estimate
Figure 23: FBR vs. Siemens’ method of producing polysilicon
Source: REC website, Maybank Kim Eng
ASP upside with production cost reduction; expect margin expansion in 2014E and 2015E Since we believe there is mild upside potential in the ASP and further room for cost reduction in the next two years, we forecast margin will further expand in 2015.
Figure 24: Our forecast for GCL’s gross margin
Source: Maybank Kim Eng
22.119.9 18.9
17.3 16.8 16.3
0
5
10
15
20
25
1H11 2H11 1H12 1H13 2H13E 1H14E
USD/kg
0.22
0.16
0.13
0.10 0.09 0.08
0.00
0.05
0.10
0.15
0.20
0.25
1H11 2H11 1H12 1H13 2H13E 1H14E
USD/W
-
5.0
10.0
15.0
20.0
25.0
30.0
0%
5%
10%
15%
20%
25%
30%
35%
40%
2010 2011 2012 2013E 2014E 2015E
(USD/kg)Gross margin (LHS) Poly-si production cost (RHS)
February 19, 2014 11
GCL-Poly Energy
Figure 25: Goss profit per kg (polysilicon)
Source: Maybank Kim Eng
Another spot could be solar farm development As of the end of 3Q13, 236MW of solar projects were expected to be connected to the grid in China by end-2013, taking the accumulated connections to 289MW. GCL targets 1GW of projects to be developed and connected to the grid in 2014, of which 100MW would be distributed PV projects.
Apart from the domestic solar power business, GCL also had an overseas solar project pipeline of over 1GW by end-1H13, of which 209MW are under development and sales, which would contribute revenues of around USD50m or ~HKD387.5m. GCL has signed letters of intent on cooperation with different enterprises to obtain project reserves of more than 2.5GW.
In 1H13, the revenue of the overseas solar power plants business was HKD432m, compared to HKD37m in 1H12. We believe the solar power plant business, not only overseas, but also in China, will grow rapidly from a low base.
With both domestic and overseas solar farm development experience, we expect GCL will take advantage of China’s supportive policy about distributed solar applications, especially the 18 test cities that were just announced for distributed solar applications, especially in Jiangsu province.
Figure 26: Revenue breakdown in 1H13
Source: Maybank Kim Eng
0
5
10
15
20
25
30
2011 2012 2013E 2014E 2015E
USD/kg
Solar business68%
Power business28%
Overseas solar power plants
business4%
February 19, 2014 12
GCL-Poly Energy
Attractive IRR Given the new feed-in tariff (ranging from CNY0.9/kWh to CNY1/kWh and CNY0.42/kWh), 50% VAT rebate and cheap PV panel, we expect the IRR to reach attractive levels that could help China achieve the robust solar power installation target in 2014. We believe the unlevered IRR could reach more than 10%.
In fact, being the largest polysilicon and wafer maker in the world, we expect GCL will have the cost advantage to source solar modules or panels from the downstream players. As some solar panel suppliers are also GCL’s customers in terms of wafer supply, we believe the good relationship with the downstream players will be an advantage for GCL in developing solar downstream projects.
Figure 27: Unlevered IRR of solar projects Figure 28: Solar projects distribution (>1MW)
Source: Solarbuzz, company presentation, Maybank Kim Eng; Note: calculation based on the average solar system cost of Rmb7.82/W for 3Q13 and Rmb7.64/W for 3Q14.
Source: Company presentation, Maybank Kim Eng, Note: (as end of 30 June 2013)
We expect more funding channels for developing solar farm business On 13 Feb 2014, GCL announced conditionally to acquire 360m new shares of Same Time (451 HK, NR) at a price of HKD4/share, representing around 68% of the enlarged issued share capital of Same Time. The total cash consideration will be HKD1.44b and we believe GCL’s cash balance had been strengthened for this acquisition after its issuance of USD200m (~HKD1,550m) of convertible bonds in 4Q13.
Same Time is principally engaged in the manufacturing and sale of printed circuit boards. After this subscription, GCL could leverage the separate listing platform to focus on the renewable energy sector and in particular, solar plants, solar projects and solar energy assets, in our view.
As the business nature of GCL’s solar farm business is different from component manufacturing, we think it is a good strategy to have a separate platform to develop the downstream solar project business. We also expect the strategy could help give GCL another source of funds, through Same Time, to develop solar projects, in our view. Going forward, we expect GCL’s solar farm projects may be injected into Same Time. Same Time could be the downstream business vehicle, in our view.
North West, 59%
North, 22%
East, 10%
Mid South, 5%
North East, 2%
South East, 2%
February 19, 2014 13
GCL-Poly Energy
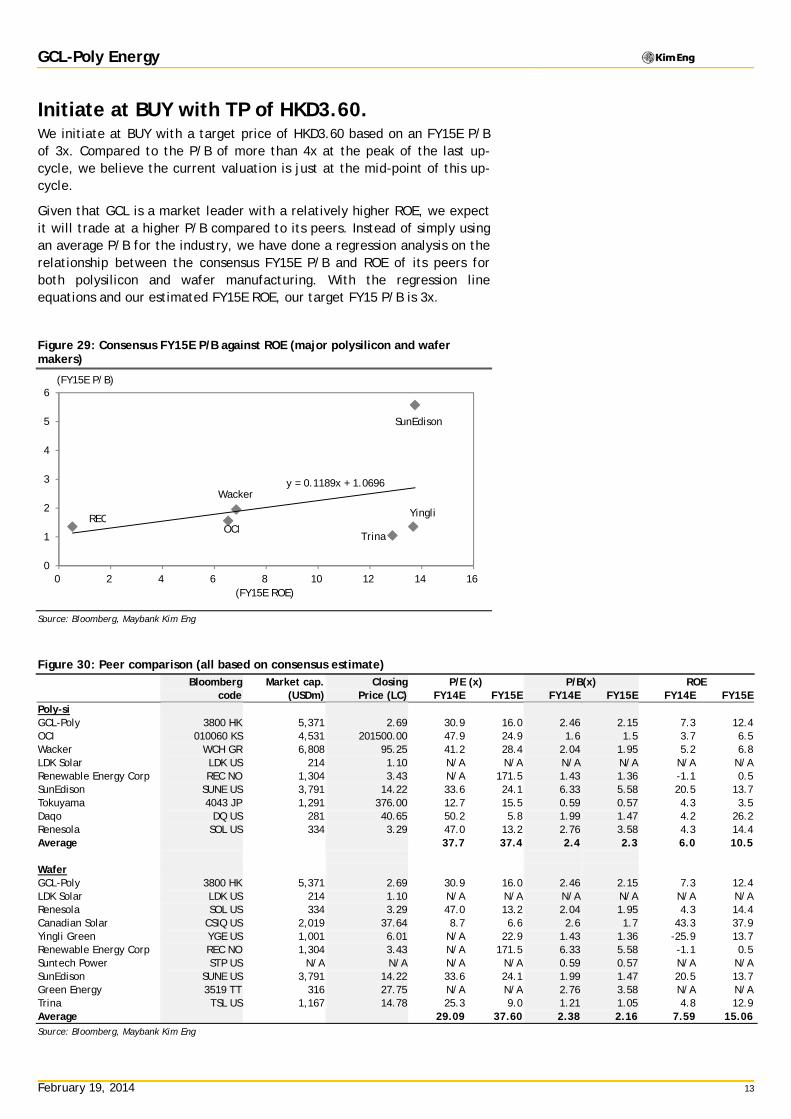
Initiate at BUY with TP of HKD3.60. We initiate at BUY with a target price of HKD3.60 based on an FY15E P/B of 3x. Compared to the P/B of more than 4x at the peak of the last up-cycle, we believe the current valuation is just at the mid-point of this up-cycle.
Given that GCL is a market leader with a relatively higher ROE, we expect it will trade at a higher P/B compared to its peers. Instead of simply using an average P/B for the industry, we have done a regression analysis on the relationship between the consensus FY15E P/B and ROE of its peers for both polysilicon and wafer manufacturing. With the regression line equations and our estimated FY15E ROE, our target FY15 P/B is 3x.
Figure 29: Consensus FY15E P/B against ROE (major polysilicon and wafer makers)
Source: Bloomberg, Maybank Kim Eng
Figure 30: Peer comparison (all based on consensus estimate) Bloomberg Market cap. Closing P/E (x) P/B(x) ROE code (USDm) Price (LC) FY14E FY15E FY14E FY15E FY14E FY15E Poly-si GCL-Poly 3800 HK 5,371 2.69 30.9 16.0 2.46 2.15 7.3 12.4 OCI 010060 KS 4,531 201500.00 47.9 24.9 1.6 1.5 3.7 6.5 Wacker WCH GR 6,808 95.25 41.2 28.4 2.04 1.95 5.2 6.8 LDK Solar LDK US 214 1.10 N/A N/A N/A N/A N/A N/A Renewable Energy Corp REC NO 1,304 3.43 N/A 171.5 1.43 1.36 -1.1 0.5 SunEdison SUNE US 3,791 14.22 33.6 24.1 6.33 5.58 20.5 13.7 Tokuyama 4043 JP 1,291 376.00 12.7 15.5 0.59 0.57 4.3 3.5 Daqo DQ US 281 40.65 50.2 5.8 1.99 1.47 4.2 26.2 Renesola SOL US 334 3.29 47.0 13.2 2.76 3.58 4.3 14.4 Average 37.7 37.4 2.4 2.3 6.0 10.5 Wafer GCL-Poly 3800 HK 5,371 2.69 30.9 16.0 2.46 2.15 7.3 12.4 LDK Solar LDK US 214 1.10 N/A N/A N/A N/A N/A N/A Renesola SOL US 334 3.29 47.0 13.2 2.04 1.95 4.3 14.4 Canadian Solar CSIQ US 2,019 37.64 8.7 6.6 2.6 1.7 43.3 37.9 Yingli Green YGE US 1,001 6.01 N/A 22.9 1.43 1.36 -25.9 13.7 Renewable Energy Corp REC NO 1,304 3.43 N/A 171.5 6.33 5.58 -1.1 0.5 Suntech Power STP US N/A N/A N/A N/A 0.59 0.57 N/A N/A SunEdison SUNE US 3,791 14.22 33.6 24.1 1.99 1.47 20.5 13.7 Green Energy 3519 TT 316 27.75 N/A N/A 2.76 3.58 N/A N/A Trina TSL US 1,167 14.78 25.3 9.0 1.21 1.05 4.8 12.9 Average 29.09 37.60 2.38 2.16 7.59 15.06 Source: Bloomberg, Maybank Kim Eng
y = 0.1189x + 1.0696
0
1
2
3
4
5
6
0 2 4 6 8 10 12 14 16
(FY15E P/B)
(FY15E ROE)
SunEdison
Trina
Wacker
OCI
YingliREC
February 19, 2014 14
GCL-Poly Energy
DCF valuation used as a reference Since the cash flow of the component manufacturing business is not very stable, we used DCF-methodology as a reference. We have used the 8-year DCF plus terminal growth afterwards. Assuming a WACC of 13.5% and target price of HKD3.60, the implied terminal growth rate will be around 5.4%, according to our estimate.
Figure 31: Our DCF valuation for reference
Terminal Value Terminal Growth Rate 5.4% Terminal WACC 13.5% Estimated Free Cash Flow in FY22 12,296.3 Terminal Value 152,935.8 NPV of Terminal Value 56,523.2 DCF Valuation NPV of Forecasts 29,584.7 53.1% NPV of Terminal Value 56,523.2 101.4% Enterprise Value 86,107.8 154.5% Less: Net Debt (30,363.8) -54.5% Equity Value 55,744.1 100.0%
No. Shares (millions) 15,484.6 Per Share Equity Value (HKD) HK$3.60 Source: Maybank Kim Eng
Our major assumptions Figure 32: Our major assumptions
Our major assumptions FY11 FY12 FY13E FY14E FY15E Wafer Production (MW) 4,488 5,622 7,871 7,871 7,871 ASP (USD/W) 0.54 0.25 0.23 0.26 0.27 Wafer production cost (USD/W) 0.43 0.25 0.23 0.22 0.21 Wafer production cost (HKD/W) 3.33 1.94 1.78 1.69 1.64 Polysilicon Production (MT) 29,414 37,055 40,761 44,837 53,804 ASP (USD/kg) 48 21 19 22 24 Polysilicon production cost (USD/kg) 21 20 17 16 16 Polysilicon production cost (HKD/kg) 161 153 133 125 121 Electricity Total installed capacity (MW) 1,136 1,151 1,151 1,151 1,151 Average utilization hours 5,540 6,132 5,825 5,825 5,825 Power sales (GWh) 4,793 5,370 5,102 5,102 5,102 Average on-grid tariff (HKD/MWh) 618 639 639 639 639 Source: Maybank Kim Eng
Figure 33: Rolling P/B band Figure 34: Rolling P/E band
Source: Maybank Kim Eng Source: Maybank Kim Eng,
0.0
1.0
2.0
3.0
4.0
5.0
6.0
Jan 10 Aug 10 Mar 11 Oct 11 May 12 Dec 12 Jul 13 Feb 14
(HKD)
3.0x
4.0x
1.0x
2.0x
0.0
1.0
2.0
3.0
4.0
5.0
6.0
Jan 10 Aug 10 Mar 11 Oct 11 May 12 Dec 12 Jul 13 Feb 14
(HKD)
12x
16x
4x
8x
20x
February 19, 2014 15
GCL-Poly Energy
Figure 35: Peer comparison table (comparing with other sub-sectors) (all based on consensus estimates) Bloomberg Market Cap. Closing P/E (x) P/B (x) DY ROE (%)
Company Name code (USDm) Price (LC) FY13E FY14E FY13E FY14E FY13E FY13E FY14E Power HK listed CLP 2 HK 19,416 59.60 16.6 15.1 1.6 1.6 4.4 9.9 10.1 Power Assets* 6 HK 17,145 62.30 13.0 13.4 2.0 1.9 4.2 15.6 14.9 HKE Trust 2638 HK 5,993 5.26 8.9 15.7 3.3 0.9 12.2 36.4 10.6 Average 12.8 14.7 2.3 1.5 6.9 20.6 11.9 Chinese IPPs Huaneng Power 902 HK 11,790 7.06 6.8 7.2 1.2 1.1 7.3 18.6 16.0 Datang Power 991 HK 7,868 3.10 7.2 6.8 0.7 0.7 4.6 10.3 10.3 China Resources Power 836 HK 11,814 19.12 8.5 8.6 1.4 1.3 3.7 17.6 15.4 Huadian Power 1071 HK 3,565 3.34 5.2 6.1 0.9 0.8 6.1 16.0 13.2 China Power International 2380 HK 2,184 2.63 5.4 6.0 0.7 0.7 6.6 13.7 11.6 Average 6.6 6.9 1.0 0.9 5.7 15.2 13.3 City gas distributors HK & China Gas 3 HK 19,920 16.16 21.7 20.1 3.1 2.9 2.2 14.5 14.4 ENN Energy 2688 HK 7,421 53.15 24.8 20.2 4.5 3.8 0.9 17.7 19.9 China Gas 384 HK 7,428 11.54 35.3 22.7 4.5 3.8 0.9 14.1 19.0 Beijing Enterprise 392 HK 11,587 70.65 22.2 17.5 1.9 1.8 1.2 8.8 10.6 China Resources Gas 1193 HK 7,313 25.50 25.8 20.8 4.2 3.6 0.7 16.9 17.8 Towngas China 1083 HK 3,221 9.56 23.5 19.6 2.0 1.9 0.8 9.0 9.7 Average 25.5 20.1 3.4 3.0 1.1 13.5 15.2 Solar Power GCL-Poly* 3800 HK 5,371 2.69 N/A 30.9 2.7 2.5 0.0 -6.3 7.3 Comtec Solar 712 HK 254 1.48 89.0 20.0 0.9 0.9 0.0 0.7 4.7 Solargiga 757 HK 159 0.39 N/A 9.4 1.0 0.3 0.4 N/A N/A United Photovoltaics 686 HK 703 1.38 N/A 28.2 1.8 1.3 N/A -105.2 1.9 Hanergy Solar 566 HK 3,910 1.06 9.6 9.6 1.9 1.6 N/A 21.4 17.2 Singyes Solar 750 HK 796 8.91 9.6 7.7 1.9 1.6 1.1 21.9 22.5 Average 36.1 17.6 1.7 1.3 0.4 13.5 10.7 Wind Power Longyuan Power 916 HK 9,821 9.41 19.7 15.1 1.8 1.7 1.0 9.6 11.5 Huaneng Renewables 958 HK 3,586 3.08 18.2 13.2 1.5 1.4 1.0 8.8 11.0 Datang Renewables 1798 HK 1,435 1.53 19.9 12.6 0.9 0.9 1.1 4.4 7.0 Huadian Fuxin 816 HK 3,972 3.86 14.7 12.5 1.9 1.6 1.4 13.4 14.5 Beijing Jineng Clean Energy 579 HK
3,934 4.71 17.5 12.2 2.2 1.9 1.2 13.1 16.7
China Wind Power 182 HK 738 0.71 47.3 16.9 1.1 1.1 N/A 2.7 8.2 China High Speed Transmission 658 HK
1,115 5.29 91.9 16.8 0.8 0.7 0.0 2.6 5.2
Goldwind 2208 HK 4,385 8.51 42.9 27.7 1.4 1.3 0.7 3.2 4.9 Average 34.0 15.9 1.5 1.3 0.9 7.2 9.9 Environmental Protection and water utilities China Everbright Int'l 257 HK 6,163 10.66 33.7 27.9 4.0 3.6 0.6 13.1 13.5 Beijing Water Enterprise 371 HK 5,178 4.76 34.5 26.3 3.2 3.0 0.9 10.5 11.9 Tianjin Capital Environment 1065 HK
1,851 4.03 15.9 15.0 1.1 1.1 1.7 6.7 9.0
CT Environmental 1363 HK 1,023 5.74 33.0 24.3 8.3 6.4 N/A 27.6 25.2 Guangdong Investment 270 HK 6,276 7.80 13.5 13.6 1.9 1.7 2.9 14.3 12.8 Guodian Science and Technology 1296 HK
1,978 2.53 17.7 12.2 1.2 1.1 0.5 6.7 9.0
Average 24.7 19.9 3.3 2.8 1.3 13.2 13.6 Power Equipments Shanghai Electric 2727 HK 7,124 2.48 9.3 9.2 0.8 0.7 3.4 8.3 8.0 Dongfang Electric 1072 HK 3,875 11.46 8.2 8.2 1.0 0.9 1.3 13.2 11.8 Harbin Electric 1133 HK 774 4.36 5.3 5.1 0.4 0.3 2.7 7.3 7.0 Average 7.6 7.5 0.7 0.7 2.5 9.6 9.0 Source: Bloomberg, Maybank Kim Eng, *Covered by Kim Eng
February 19, 2014 16
GCL-Poly Energy
Possible key catalysts We expect the polysilicon spot price will increase to USD22/kg in 2014E
and USD23/kg in 2015E, which could further boost GCL’s profitability.
The development of FBR with silane gas could lead to a further reduction in production costs.
New policies helping the execution of distributed PV in China could help boost this market.
More-than-expected solar power installations in China, or other emerging markets such as Thailand and South Africa, could boost demand for solar products and spot prices.
Potential cooperation with Same Time may give GCL another source of funding for developing the downstream solar farm business.
How are we different from consensus? We expect the demand growth in 2015E will further boost GCL’s
earnings as we forecast mild recovery of ASP and continuous reduction in production cost.
We forecast China will have 13GW of new solar installations this year, as opposed to its recently stated target of 10GW. We believe the target is a minimum only, and in the past, actual installations have exceeded the targets.
We adopt a conservative 5.7g/W ratio to estimate the total polysilicon demand in 2014.
The market may overlook the potential robust solar power demand in Thailand and South Korea.
The market may also overlook some other potential cost reduction factors. We expect GCL will develop its own power generation ability to reduce the power cost to manufacturing polysilicon. The potential improvement in conversion efficiency in multi- or quasi-mono wafers could further reduce production costs, in our view.
Sensitivity analysis
Figure 36: Our 2015E EPS estimates vs. changes in ASP & cost
Source: Maybank Kim Eng
0.08
0.11
0.15
0.23
0.28
0.320.290.26
0.23
0.19 0.16
0.12
0.09
0.00
0.05
0.10
0.15
0.20
0.25
0.30
0.35
-15% -10% -5% 0% +5% +10% +15%
(EPS,HKD) Poly-si ASP changes Wafer cost changes
February 19, 2014 17
GCL-Poly Energy
Key risks
Spot component price fluctuations may affect margins due to ASP changes.
Technology breakthroughs from peers may affect GCL’s status as low-cost producer.
Rise in interest rate may increase cost of borrowing and project financing.
If its customers face a poor operating environment, they may try to re-negotiate a lower ASP or even risk cancelling orders.
Changes to the government’s installation target will affect the end demand for solar power that will also impact the spot price of components and demand for polysilicon and wafers.
Possible policy changes in anti-dumping duties could impact the demand for component exports.
February 19, 2014 18
GCL-Poly Energy
Appendix:
Figure 37: Solar power value chain
Source: Mitsubishi, Maybank Kim Eng
Anti-dumping duties between countries
In order to protect domestic manufacturers, countries tend to impose anti-dumping and countervailing duties on solar-product imports. In China, we believe the aggressive installation target and attractive IRR have already helped the leading solar-component makers sell their products in the domestic market. We expect Chinese makers will rely less on exports in the long run.
Figure 38: US imposed anti-dumping and countervailing duties on Chinese solar cells in 4Q12
REGIONAL WONG Chew Hann, CA Regional Head of Institutional Research (603) 2297 8686 [email protected] ONG Seng Yeow Regional Head of Retail Research (65) 6432 1453 [email protected] Alexander GARTHOFF Institutional Product Manager (852) 2268 0638 [email protected] ECONOMICS Suhaimi ILIAS Chief Economist Singapore | Malaysia (603) 2297 8682 [email protected] Luz LORENZO Philippines (63) 2 849 8836 [email protected] Tim LEELAHAPHAN Thailand (662) 658 1420 [email protected] JUNIMAN Chief Economist, BII Indonesia (62) 21 29228888 ext 29682 [email protected] Josua PARDEDE Economist / Industry Analyst, BII Indonesia (62) 21 29228888 ext 29695 [email protected] MALAYSIA WONG Chew Hann, CA Head of Research (603) 2297 8686 [email protected] • Strategy • Construction & Infrastructure Desmond CH’NG, ACA (603) 2297 8680 [email protected] • Banking & Finance LIAW Thong Jung (603) 2297 8688 [email protected] • Oil & Gas - Regional • Shipping ONG Chee Ting, CA (603) 2297 8678 [email protected] • Plantations - Regional Mohshin AZIZ (603) 2297 8692 [email protected] • Aviation - Regional • Petrochem YIN Shao Yang, CPA (603) 2297 8916 [email protected] • Gaming – Regional • Media TAN Chi Wei, CFA (603) 2297 8690 [email protected] • Power • Telcos WONG Wei Sum, CFA (603) 2297 8679 [email protected] • Property & REITs LEE Yen Ling (603) 2297 8691 [email protected] • Building Materials • Glove Producers CHAI Li Shin (603) 2297 8684 [email protected] • Plantation • Construction & Infrastructure KANG Chun Ee (603) 2297 8675 [email protected] • Consumer Ivan YAP (603) 2297 8612 [email protected] • Automotive LEE Cheng Hooi Regional Chartist (603) 2297 8694 [email protected] Tee Sze Chiah Head of Retail Research (603) 2297 6858 [email protected]
HONG KONG / CHINA Howard WONG Head of Research (852) 2268 0648 [email protected] • Oil & Gas - Regional Alexander LATZER (852) 2268 0647 [email protected] • Metals & Mining - Regional Jacqueline KO, CFA (852) 2268 0633 [email protected] • Consumer Karen KWAN (852) 2268 0640 [email protected] • Property & REITs Osbert TK TANG, CFA (86) 21 5096 8370 [email protected] • Transport & Industrials Philip TSE, CFA FRM (852) 2268 0643 [email protected] • Property & REITs Ricky WK NG, CFA (852) 2268 0689 [email protected] • Utilities & Renewable Energy Simon QIAN, CFA (852) 2268 0634 [email protected] • Telecom & Internet Steven ST CHAN (852) 2268 0645 [email protected] • Banking & Financials Warren LAU (852) 2268 0644 [email protected] • Technology – Regional William YANG (852) 2268 0675 [email protected] • Technology – Regional INDIA Jigar SHAH Head of Research (91) 22 6623 2601 [email protected] • Oil & Gas • Automobile • Cement Anubhav GUPTA (91) 22 6623 2605 [email protected] • Metal & Mining • Capital Goods • Property Urmil SHAH (91) 22 6623 2606 [email protected] • Technology • Media SINGAPORE NG Wee Siang Head of Research (65) 6432 1467 [email protected] • Banking & Finance Gregory YAP (65) 6432 1450 [email protected] • SMID Caps – Regional • Technology & Manufacturing • Telcos Wilson LIEW (65) 6432 1454 [email protected] • Property Developers ONG Kian Lin (65) 6432 1470 [email protected] • S-REITs James KOH (65) 6432 1431 [email protected] • Consumer - Regional YEAK Chee Keong, CFA (65) 6432 1460 [email protected] • Offshore & Marine Derrick HENG (65) 6432 1446 [email protected] • Transport (Land, Shipping & Aviation) WEI Bin (65) 6432 1455 [email protected] • Commodity • Logistics • S-chips John CHEONG (65) 6432 1461 [email protected] • Small & Mid Caps • Healthcare
INDONESIA Wilianto IE Head of Research (62) 21 2557 1125 [email protected] • Strategy Rahmi MARINA (62) 21 2557 1128 [email protected] • Banking & Finance Aurellia SETIABUDI (62) 21 2953 0785 [email protected] • Property Anthony YUNUS (62) 21 2557 1136 [email protected] • Consumer • Poultry Isnaputra ISKANDAR (62) 21 2557 1129 [email protected] • Metals & Mining • Cement Pandu ANUGRAH (62) 21 2557 1137 [email protected] • Infrastructure • Construction • Transport Janni ASMAN (62) 21 2953 0784 [email protected] • Cigarette • Healthcare • Retail PHILIPPINES Luz LORENZO Head of Research (63) 2 849 8836 [email protected] • Strategy Laura DY-LIACCO (63) 2 849 8840 [email protected] • Utilities • Conglomerates • Telcos Lovell SARREAL (63) 2 849 8841 [email protected] • Consumer • Media • Cement Rommel RODRIGO (63) 2 849 8839 [email protected] • Conglomerates • Property • Gaming • Ports/ Logistics Katherine TAN (63) 2 849 8843 [email protected] • Banks • Construction Ramon ADVIENTO (63) 2 849 8845 [email protected] • Mining THAILAND Maria LAPIZ Head of Institutional Research Dir (66) 2257 0250 | (66) 2658 6300 ext 1399 [email protected] • Consumer / Materials Jesada TECHAHUSDIN, CFA (66) 2658 6300 ext 1394 [email protected] • Financial Services Kittisorn PRUITIPAT, CFA, FRM (66) 2658 6300 ext 1395 [email protected] • Real Estate Sittichai DUANGRATTANACHAYA (66) 2658 6300 ext 1393 [email protected] • Services Sector Sukit UDOMSIRIKUL Head of Retail Research (66) 2658 6300 ext 5090 [email protected] Mayuree CHOWVIKRAN (66) 2658 6300 ext 1440 [email protected] • Strategy Padon VANNARAT (66) 2658 6300 ext 1450 [email protected] • Strategy
Surachai PRAMUALCHAROENKIT (66) 2658 6300 ext 1470 [email protected] • Auto • Conmat • Contractor • Steel Suttatip PEERASUB (66) 2658 6300 ext 1430 [email protected] • Media • Commerce Sutthichai KUMWORACHAI (66) 2658 6300 ext 1400 [email protected] • Energy • Petrochem Termporn TANTIVIVAT (66) 2658 6300 ext 1520 [email protected] • Property Woraphon WIROONSRI (66) 2658 6300 ext 1560 [email protected] • Banking & Finance Jaroonpan WATTANAWONG (66) 2658 6300 ext 1404 [email protected] • Transportation • Small cap Chatchai JINDARAT (66) 2658 6300 ext 1401 [email protected] • Electronics VIETNAM LE Hong Lien, ACCA Head of Institutional Research (84) 844 55 58 88 x 8181 [email protected] • Strategy • Consumer • Diversified • Utilities THAI Quang Trung, CFA, Deputy Manager, Institutional Research (84) 844 55 58 88 x 8180 [email protected] • Real Estate • Construction • Materials TRUONG Thanh Hang (84) 844 55 58 88 x 8085 [email protected] • Consumer Le Nguyen Nhat Chuyen (84) 844 55 58 88 x 8082 [email protected] • Oil & Gas NGUYEN Thi Ngan Tuyen, Head of Retail Research(84) 8 44 555 888 x 8081 [email protected] • Food & Beverage • Oil&Gas • Banking NGUYEN Trung Hoa, Dy Head of Retail Research (84) 8 44 555 888 x 8088 [email protected] • Macro • Steel • Real estate TRINH Thi Ngoc Diep (84) 4 44 555 888 x 8208 [email protected] • Technology • Utilities • Construction TRUONG Quang Binh (84) 4 44 555 888 x 8087 [email protected] • Rubber plantation • Tyres and Tubes • Oil&Gas PHAM Nhat Bich (84) 8 44 555 888 x 8083 [email protected] • Consumer • Manufacturing • Fishery NGUYEN Thi Sony Tra Mi (84) 8 44 555 888 x 8084 [email protected] • Port operation • Pharmaceutical • Food & Beverage
February 19, 2014 23
GCL-Poly Energy
APPENDIX I: TERMS FOR PROVISION OF REPORT, DISCLAIMERS AND DISCLOSURES
DISCLAIMERS
This research report is prepared for general circulation and for information purposes only and under no circumstances should it be considered or intended as an offer to sell or a solicitation of an offer to buy the securities referred to herein. Investors should note that values of such securities, if any, may fluctuate and that each security’s price or value may rise or fall. Opinions or recommendations contained herein are in form of technical ratings and fundamental ratings. Technical ratings may differ from fundamental ratings as technical valuations apply different methodologies and are purely based on price andvolume-related information extracted from the relevant jurisdiction’s stock exchange in the equity analysis. Accordingly, investors’ returns may be less than the original sum invested. Past performance is not necessarily a guide to future performance. This report is not intended to provide personal investment advice and does not take into account the specific investment objectives, the financial situation and the particular needs of persons who may receive or read this report. Investors should therefore seek financial, legal and other advice regarding the appropriateness of investing in any securities or the investment strategies discussed or recommended in this report.
The information contained herein has been obtained from sources believed to be reliable but such sources have not been independently verified by Maybank Investment Bank Berhad, its subsidiary and affiliates (collectively, “MKE”) and consequently no representation is made as to the accuracy or completeness ofthis report by MKE and it should not be relied upon as such. Accordingly, MKE and its officers, directors, associates, connected parties and/or employees (collectively, “Representatives”) shall not be liable for any direct, indirect or consequential losses or damages that may arise from the use or reliance of this report. Any information, opinions or recommendations contained herein are subject to change at any time, without prior notice.
This report may contain forward looking statements which are often but not always identified by the use of words such as “anticipate”, “believe”, “estimate”, “intend”, “plan”, “expect”, “forecast”, “predict” and “project” and statements that an event or result “may”, “will”, “can”, “should”, “could” or “might” occur or be achieved and other similar expressions. Such forward looking statements are based on assumptions made and information currently available to us and are subject to certain risks and uncertainties that could cause the actual results to differ materially from those expressed in any forward lookingstatements. Readers are cautioned not to place undue relevance on these forward-looking statements. MKE expressly disclaims any obligation to update or revise any such forward looking statements to reflect new information, events or circumstances after the date of this publication or to reflect the occurrence of unanticipated events.
MKE and its officers, directors and employees, including persons involved in the preparation or issuance of this report, may, to the extent permitted by law,from time to time participate or invest in financing transactions with the issuer(s) of the securities mentioned in this report, perform services for or solicit business from such issuers, and/or have a position or holding, or other material interest, or effect transactions, in such securities or options thereon, or other investments related thereto. In addition, it may make markets in the securities mentioned in the material presented in this report. MKE may, to the extent permitted by law, act upon or use the information presented herein, or the research or analysis on which they are based, before the material is published. One or more directors, officers and/or employees of MKE may be a director of the issuers of the securities mentioned in this report.
This report is prepared for the use of MKE’s clients and may not be reproduced, altered in any way, transmitted to, copied or distributed to any other party in whole or in part in any form or manner without the prior express written consent of MKE and MKE and its Representatives accepts no liability whatsoever for the actions of third parties in this respect.
This report is not directed to or intended for distribution to or use by any person or entity who is a citizen or resident of or located in any locality, state,country or other jurisdiction where such distribution, publication, availability or use would be contrary to law or regulation. This report is for distribution only under such circumstances as may be permitted by applicable law. The securities described herein may not be eligible for sale in all jurisdictions or to certain categories of investors. Without prejudice to the foregoing, the reader is to note that additional disclaimers, warnings or qualifications may apply based ongeographical location of the person or entity receiving this report.
Malaysia
Opinions or recommendations contained herein are in the form of technical ratings and fundamental ratings. Technical ratings may differ from fundamental ratings as technical valuations apply different methodologies and are purely based on price and volume-related information extracted from Bursa Malaysia Securities Berhad in the equity analysis.
Singapore
This report has been produced as of the date hereof and the information herein may be subject to change. Maybank Kim Eng Research Pte. Ltd. (“MaybankKERPL”) in Singapore has no obligation to update such information for any recipient. For distribution in Singapore, recipients of this report are to contact Maybank KERPL in Singapore in respect of any matters arising from, or in connection with, this report. If the recipient of this report is not an accredited investor, expert investor or institutional investor (as defined under Section 4A of the Singapore Securities and Futures Act), Maybank KERPL shall be legally liable for the contents of this report, with such liability being limited to the extent (if any) as permitted by law.
Thailand
The disclosure of the survey result of the Thai Institute of Directors Association (“IOD”) regarding corporate governance is made pursuant to the policy of the Office of the Securities and Exchange Commission. The survey of the IOD is based on the information of a company listed on the Stock Exchange of Thailand and the market for Alternative Investment disclosed to the public and able to be accessed by a general public investor. The result, therefore, is from the perspective of a third party. It is not an evaluation of operation and is not based on inside information. The survey result is as of the date appearing in the Corporate Governance Report of Thai Listed Companies. As a result, the survey may be changed after that date. Maybank Kim Eng Securities (Thailand) PublicCompany Limited (“MBKET”) does not confirm nor certify the accuracy of such survey result.
Except as specifically permitted, no part of this presentation may be reproduced or distributed in any manner without the prior written permission of MBKET.MBKET accepts no liability whatsoever for the actions of third parties in this respect.
US
This research report prepared by MKE is distributed in the United States (“US”) to Major US Institutional Investors (as defined in Rule 15a-6 under the Securities Exchange Act of 1934, as amended) only by Maybank Kim Eng Securities USA Inc (“Maybank KESUSA”), a broker-dealer registered in the US (registered under Section 15 of the Securities Exchange Act of 1934, as amended). All responsibility for the distribution of this report by Maybank KESUSA in the US shall be borne by Maybank KESUSA. All resulting transactions by a US person or entity should be effected through a registered broker-dealer in the US. This report is not directed at you if MKE is prohibited or restricted by any legislation or regulation in any jurisdiction from making it available to you. You should satisfy yourself before reading it that Maybank KESUSA is permitted to provide research material concerning investments to you under relevantlegislation and regulations.
UK
This document is being distributed by Maybank Kim Eng Securities (London) Ltd (“Maybank KESL”) which is authorized and regulated, by the Financial Services Authority and is for Informational Purposes only. This document is not intended for distribution to anyone defined as a Retail Client under the Financial Services and Markets Act 2000 within the UK. Any inclusion of a third party link is for the recipients convenience only, and that the firm does not take anyresponsibility for its comments or accuracy, and that access to such links is at the individuals own risk. Nothing in this report should be considered as constituting legal, accounting or tax advice, and that for accurate guidance recipients should consult with their own independent tax advisers.
February 19, 2014 24
GCL-Poly Energy
Disclosure of Interest Malaysia: MKE and its Representatives may from time to time have positions or be materially interested in the securities referred to herein and may further act as market maker or may have assumed an underwriting commitment or deal with such securities and may also perform or seek to perform investment banking services, advisory and other services for or relating to those companies.
Singapore: As of 20 February 2014, Maybank KERPL and the covering analyst do not have any interest in any companies recommended in this research report.
Thailand: MBKET may have a business relationship with or may possibly be an issuer of derivative warrants on the securities /companies mentioned in the research report. Therefore, Investors should exercise their own judgment before making any investment decisions. MBKET, its associates, directors, connected parties and/or employees may from time to time have interests and/or underwriting commitments in the securities mentioned in this report.
Hong Kong: KESHK may have financial interests in relation to an issuer or a new listing applicant referred to as defined by the requirements under Paragraph 16.5(a) of the Hong Kong Code of Conduct for Persons Licensed by or Registered with the Securities and Futures Commission.
As of 20 February 2014, KESHK and the authoring analyst do not have any interest in any companies recommended in this research report.
MKE may have, within the last three years, served as manager or co-manager of a public offering of securities for, or currently may make a primary market in issues of, any or all of the entities mentioned in this report or may be providing, or have provided within the previous 12 months, significant advice or investment services in relation to the investment concerned or a related investment and may receive compensation for the services provided from the companies covered in this report.
OTHERS Analyst Certification of Independence
The views expressed in this research report accurately reflect the analyst’s personal views about any and all of the subject securities or issuers; and no part of the research analyst’s compensation was, is or will be, directly or indirectly, related to the specific recommendations or views expressed in the report.
Reminder
Structured securities are complex instruments, typically involve a high degree of risk and are intended for sale only to sophisticated investors who are capable of understanding and assuming the risks involved. The market value of any structured security may be affected by changes in economic, financial and political factors (including, but not limited to, spot and forward interest and exchange rates), time to maturity, market conditions and volatility and the credit quality of any issuer or reference issuer. Any investor interested in purchasing a structured product should conduct its own analysis of the product and consult with its own professional advisers as to the risks involved in making such a purchase.
No part of this material may be copied, photocopied or duplicated in any form by any means or redistributed without the prior consent of MKE.
Definition of Ratings
Maybank Kim Eng Research uses the following rating system BUY Return is expected to be above 10% in the next 12 months (excluding dividends) HOLD Return is expected to be between - 10% to +10% in the next 12 months (excluding dividends) SELL Return is expected to be below -10% in the next 12 months (excluding dividends)
Applicability of Ratings
The respective analyst maintains a coverage universe of stocks, the list of which may be adjusted according to needs. Investment ratings are only applicable to the stocks which form part of the coverage universe. Reports on companies which are not part of the coverage do not carry investment ratings as we do not actively follow developments in these companies.
DISCLOSURES Legal Entities Disclosures
Malaysia: This report is issued and distributed in Malaysia by Maybank Investment Bank Berhad (15938-H) which is a Participating Organization of Bursa Malaysia Berhad and a holder of Capital Markets and Services License issued by the Securities Commission in Malaysia. Singapore: This material is issued and distributed in Singapore by Maybank KERPL (Co. Reg No 197201256N) which is regulated by the Monetary Authority of Singapore. Indonesia: PT Kim Eng Securities (“PTKES”) (Reg. No. KEP-251/PM/1992) is a member of the Indonesia Stock Exchange and is regulated by the BAPEPAM LK. Thailand: MBKET (Reg. No.0107545000314) is a member of the Stock Exchange of Thailand and is regulated by the Ministry of Finance and the Securities and Exchange Commission. Philippines: Maybank ATRKES (Reg. No.01-2004-00019) is a member of the Philippines Stock Exchange and is regulated by the Securities and Exchange Commission. Vietnam: Maybank Kim Eng Securities JSC (License Number: 71/UBCK-GP) is licensed under the State Securities Commission of Vietnam.Hong Kong: KESHK (Central Entity No AAD284) is regulated by the Securities and Futures Commission. India: Kim Eng Securities India Private Limited (“KESI”) is a participant of the National Stock Exchange of India Limited (Reg No: INF/INB 231452435) and the Bombay Stock Exchange (Reg. No. INF/INB 011452431) and is regulated by Securities and Exchange Board of India. KESI is also registered with SEBI as Category 1 Merchant Banker (Reg. No. INM 000011708) US: Maybank KESUSA is a member of/ and is authorized and regulated by the FINRA – Broker ID 27861. UK: Maybank KESL (Reg No 2377538) is authorized and regulated bythe Financial Services Authority.
February 19, 2014 25
GCL-Poly Energy
Malaysia Maybank Investment Bank Berhad (A Participating Organisation of Bursa Malaysia Securities Berhad) 33rd Floor, Menara Maybank, 100 Jalan Tun Perak, 50050 Kuala Lumpur Tel: (603) 2059 1888; Fax: (603) 2078 4194
Singapore Maybank Kim Eng Securities Pte Ltd Maybank Kim Eng Research Pte Ltd 9 Temasek Boulevard #39-00 Suntec Tower 2 Singapore 038989 Tel: (65) 6336 9090 Fax: (65) 6339 6003
London Maybank Kim Eng Securities (London) Ltd 6/F, 20 St. Dunstan’s Hill London EC3R 8HY, UK Tel: (44) 20 7621 9298 Dealers’ Tel: (44) 20 7626 2828 Fax: (44) 20 7283 6674
New York Maybank Kim Eng Securities USA Inc 777 Third Avenue, 21st Floor New York, NY 10017, U.S.A. Tel: (212) 688 8886 Fax: (212) 688 3500
Stockbroking Business: Level 8, Tower C, Dataran Maybank, No.1, Jalan Maarof 59000 Kuala Lumpur Tel: (603) 2297 8888 Fax: (603) 2282 5136
Hong Kong Kim Eng Securities (HK) Ltd Level 30, Three Pacific Place, 1 Queen’s Road East, Hong Kong Tel: (852) 2268 0800 Fax: (852) 2877 0104
Indonesia PT Maybank Kim Eng Securities Plaza Bapindo Citibank Tower 17th Floor Jl Jend. Sudirman Kav. 54-55 Jakarta 12190, Indonesia Tel: (62) 21 2557 1188 Fax: (62) 21 2557 1189
India Kim Eng Securities India Pvt Ltd 2nd Floor, The International 16, Maharishi Karve Road, Churchgate Station, Mumbai City - 400 020, India Tel: (91).22.6623.2600 Fax: (91).22.6623.2604
Philippines Maybank ATR Kim Eng Securities Inc. 17/F, Tower One & Exchange Plaza Ayala Triangle, Ayala Avenue Makati City, Philippines 1200 Tel: (63) 2 849 8888 Fax: (63) 2 848 5738
Thailand Maybank Kim Eng Securities (Thailand) Public Company Limited 999/9 The Offices at Central World, 20th - 21st Floor, Rama 1 Road Pathumwan, Bangkok 10330, Thailand Tel: (66) 2 658 6817 (sales) Tel: (66) 2 658 6801 (research)
Vietnam Maybank Kim Eng Securities Limited 4A-15+16 Floor Vincom Center Dong Khoi, 72 Le Thanh Ton St. District 1 Ho Chi Minh City, Vietnam Tel : (84) 844 555 888 Fax : (84) 8 38 271 030
Saudi Arabia In association with Anfaal Capital Villa 47, Tujjar Jeddah Prince Mohammed bin Abdulaziz Street P.O. Box 126575 Jeddah 21352 Tel: (966) 2 6068686 Fax: (966) 26068787
South Asia Sales Trading Kevin FOY [email protected] Tel: (65) 6336-5157 US Toll Free: 1-866-406-7447
North Asia Sales Trading Alex TSUN [email protected] Tel: (852) 2268 0228 US Toll Free: 1 877 837 7635