27
SAS Visual Analytics at GDF SUEZ Electrabel Presentation for SAS FORUM, October, 9 2014

SAS Visual Analytics at GDF SUEZ Electrabel
Presentation for SAS FORUM, October, 9 2014

■ GDF SUEZ Electrabel
■ Main drivers for SAS Visual Analytics
■ Evolution of Reporting Architecture
■ Roadmap
■ Exploring WEB data
■ Partners
■ Retail Sales Channels Report
- The old version
- SAS Visual Analytics demo
■ Lessons learned/Conclusion
■ Q&A
Index
2

3
Electrabel, part of GDF SUEZ Group
ENERGY INTERNATIONAL
GLOBAL GAS & LNG
INFRA-STRUCTURES
ENERGY SERVICES
ENERGY EUROPE
Belgium – Luxembourg

GDF SUEZ Key figures 2013
• €81,3 billion in 2013 revenues.
• €27 to €30 billion of investment per year over 2014-2016.
• A presence in close to 70 countries.
• 147,200 employees throughout the world
• Inc. 59,700 in power and natural gas
• and 87,500 in energy services.
• 800 researchers and experts in 7 R&D centers.
• 113.7 GW generating capacity
• 17 GW renewable energy
4
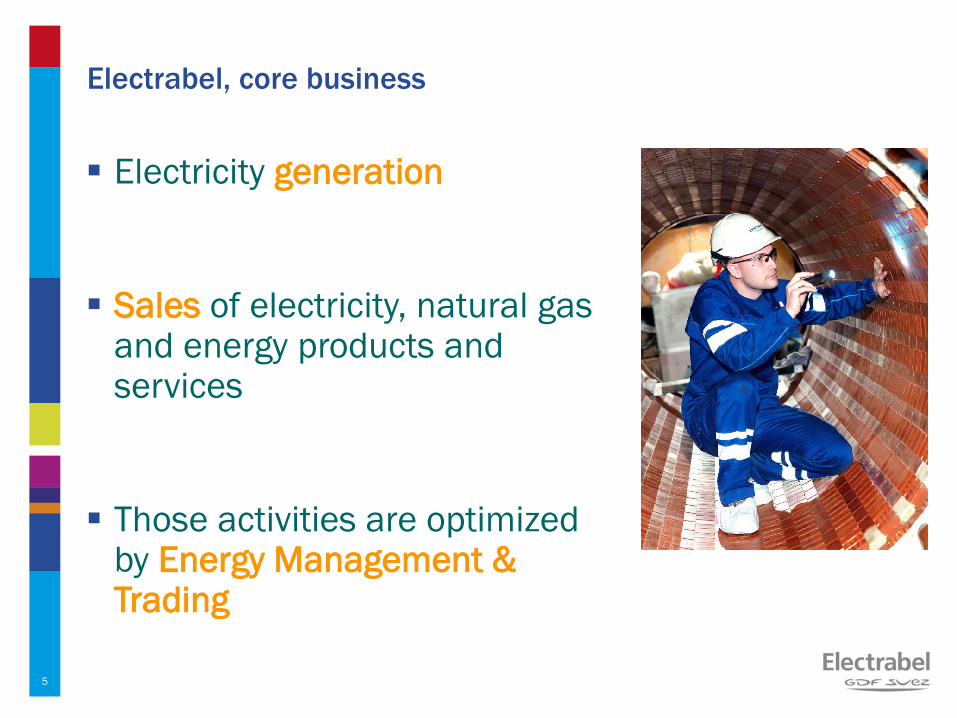
Electrabel, core business
Electricity generation
Sales of electricity, natural gas and energy products and services
Those activities are optimized by Energy Management & Trading
5
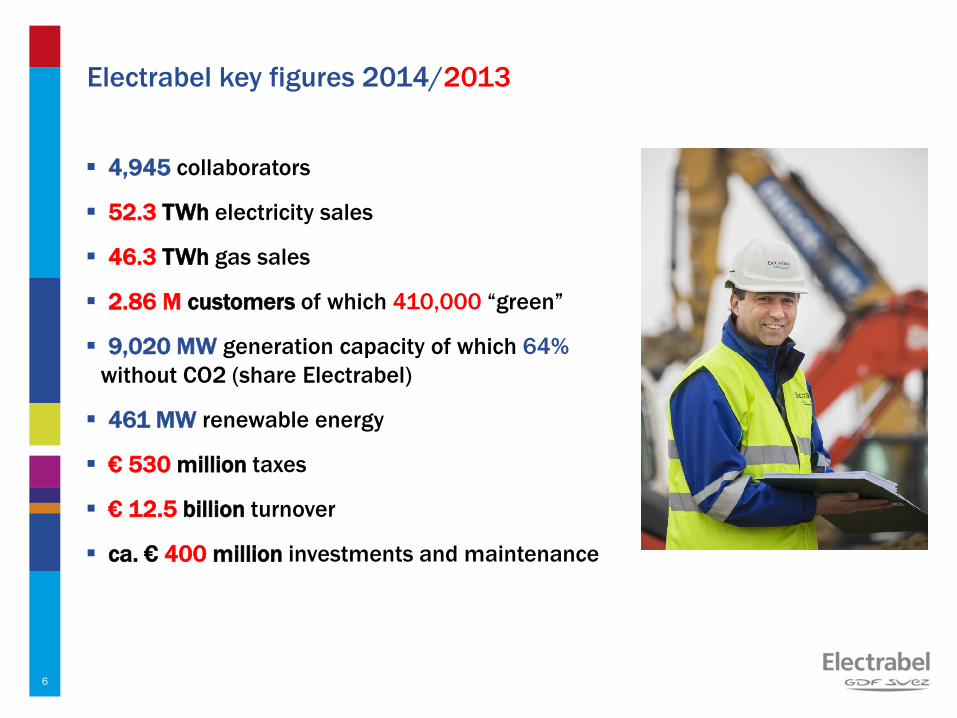
Electrabel key figures 2014/2013
4,945 collaborators
52.3 TWh electricity sales
46.3 TWh gas sales
2.86 M customers of which 410,000 “green”
9,020 MW generation capacity of which 64%
without CO2 (share Electrabel)
461 MW renewable energy
€ 530 million taxes
€ 12.5 billion turnover
ca. € 400 million investments and maintenance
6

7
Generating facilities (July 2014)9 020 MW, share EBL
Combined cycle gas turbine (CCGT)
Cogeneration
Conventional
Conventional with biomass
Nuclear
Pumped storageWindHydroPhotovoltaic
■ GDF SUEZ Electrabel
■ Main drivers for SAS Visual Analytics
■ Evolution of Reporting Architecture
■ Roadmap
■ Exploring WEB data
■ Partners
■ Retail Sales Channels Report
- The old version
- SAS Visual Analytics demo
■ Lessons learned/Conclusion
■ Q&A
Index
8

Main Drivers for SAS Visual Analytics
9
Setting up a dynamic and multi-channel presentation layer for internal reporting purposes.
Automation of report presentation, replacing semi-automatic and manual MS-Office based solutions.
Enhance Data Analysis capabilities of M&S Reporting, allowing analysis of large (huge) amounts of data.
Maximize flexibility in reporting, due to autonomy of M&S Reporting department.
Leverage on in-house SAS knowledge.
Maximize combination of data out of different source systems (internal & external)

■ GDF SUEZ Electrabel
■ Main drivers for SAS Visual Analytics
■ Evolution of Reporting Architecture
■ Roadmap
■ Exploring WEB data
■ Partners
■ Retail Sales Channels Report
- The old version
- SAS Visual Analytics demo
■ Lessons learned/Conclusion
■ Q&A
Index
10

Evolution of Reporting Archtecture
11
11
SASBASE
BW (cubes)
E4U
Pricing
tools
IRIS
DataWareHouse
SourceData
ETL
Publication &
Analytics
SASBASEBW
(cubes)
SAS VA
BW -ODS
Excel, Access, Powerpoint, etc.
BW -ODS
OtherM&S Appl.
External data
(DGO, etc.)
E4U
Pricing
tools
IRIS
OtherM&S Appl.
External data
(DGO, etc.)
AS IS TO BE
STARSTAR
Excel, Access, Powerpoint,
etc.

Leveraging SAS Base data management capabilities
12

■ GDF SUEZ Electrabel
■ Main drivers for SAS Visual Analytics
■ Evolution of Reporting Architecture
■ Roadmap
■ Exploring WEB data
■ Partners
■ Retail Sales Channels Report
- The old version
- SAS Visual Analytics demo
■ Lessons learned/Conclusion
■ Q&A
Index
13

Deployment Roadmap
14
About 50 reports (management & operational) will be developed in 2014.
13/Q4 14/Q1 14/Q2 14/Q3 14/Q4
InfrastructureTechnical
Implementation
Training
PilotB2C
SalesReporting
Contract
Performance & Workload Management
B2BVisual Management
M&S Dashboard
B2CVisual
Management
B2BSales Reporting
WEB Statistics
New Developments
DIANASTAR
ITProject
■ GDF SUEZ Electrabel
■ Main drivers for SAS Visual Analytics
■ Evolution of Reporting Architecture
■ Roadmap
■ Exploring WEB data
■ Partners
■ Retail Sales Channels Report
- The old version
- SAS Visual Analytics demo
■ Lessons learned/Conclusion
■ Q&A
Index
15

Exploring WEB Data
16
A combination of WEB usage statistics with Customer information will allow to combine Customer Profiles with Web Usage trends, in order to better target customer groups and enhance capabilities of the E-channel.
■ GDF SUEZ Electrabel
■ Main drivers for SAS Visual Analytics
■ Evolution of Reporting Architecture
■ Roadmap
■ Exploring WEB data
■ Partners
■ Retail Sales Channels Report
- The old version
- SAS Visual Analytics demo
■ Lessons learned/Conclusion
■ Q&A
Index
17

Partners
18
Intense collaboration with partners has brought instant success :
Installation of Software
Implementation of initial set-up
Implementation of data transfer principles between SAS environments
Implementation of Pilot Report (See Demo)
Documentation of working principles and governance rules.
Technical support for Electrabel specifics.

■ GDF SUEZ Electrabel
■ Main drivers for SAS Visual Analytics
■ Evolution of Reporting Architecture
■ Roadmap
■ Exploring WEB data
■ Partners
■ Retail Sales Channels Report
- The old version
- SAS Visual Analytics demo
■ Lessons learned/Conclusion
■ Q&A
Index
19

The Old Version
Retail Sales Channels Report
20
Weekly Manual production of 25
PDF pages, based on MS-Office
reports. (1 day effort)

Live DEMO
Retail Sales Channels Report
21
Weekly automatic refresh
of SAS VA Report.

■ GDF SUEZ Electrabel
■ Main drivers for SAS Visual Analytics
■ Evolution of Reporting Architecture
■ Roadmap
■ Exploring WEB data
■ Partners
■ Retail Sales Channels Report
- The old version
- SAS Visual Analytics demo
■ Lessons learned/Conclusion
■ Q&A
Index
22

Lessons learned
23
Organisation
Sufficient effort needs to be invested in change management for report consumers.
Strict control on usage of ‘in-memory’ data structures is necessary
Data preparation is key in order to allow for fast deployment of reports.
Fast start with implementation partner proves to be worthwhile.
Dedicated VA development team needs to be put in place in the early stages.
Solution
Print functionality needs to be provided.
Version 6.3 struggles with STAR Schemes from a performance point of view.
Differences of version and supporting OS for SAS BASE and SAS VA leads to additional data manipulations.

■ GDF SUEZ Electrabel
■ Main drivers for SAS Visual Analytics
■ Evolution of Reporting Architecture
■ Roadmap
■ Exploring WEB data
■ Partners
■ Retail Sales Channels Report
- The old version
- SAS Visual Analytics demo
■ Lessons learned/Conclusion
■ Q&A
Index
24

Q & A
25
Copyr i g ht © 2013, SAS Ins t i tu t e Inc . A l l r ights reser ve d .
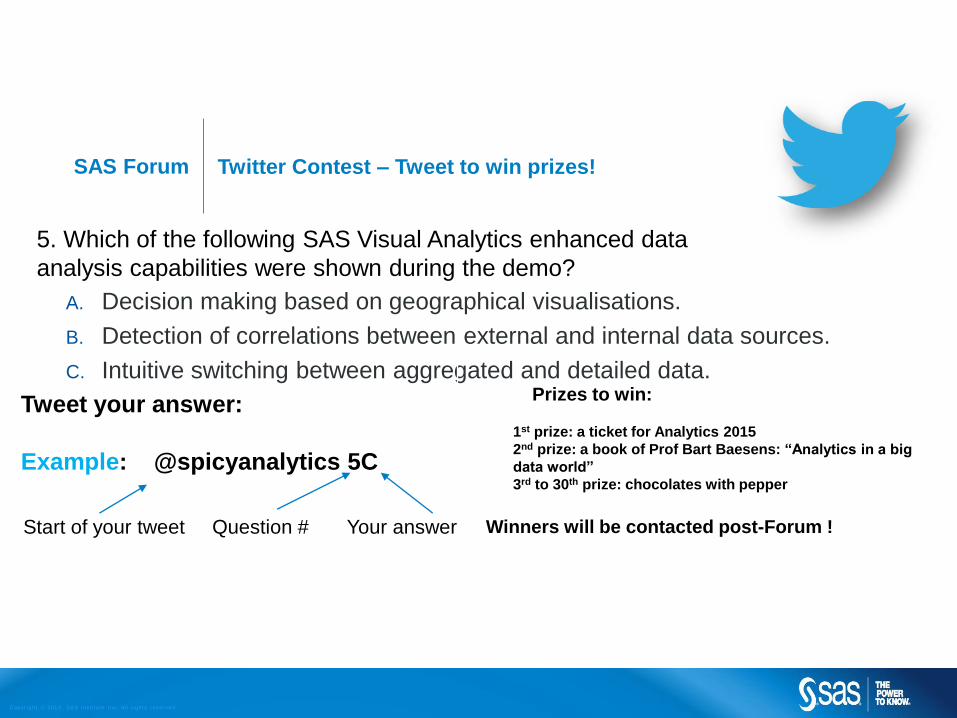
Twitter Contest – Tweet to win prizes!SAS Forum
A. Decision making based on geographical visualisations.
B. Detection of correlations between external and internal data sources.
C. Intuitive switching between aggregated and detailed data.
5. Which of the following SAS Visual Analytics enhanced data
analysis capabilities were shown during the demo?
Tweet your answer:
Example: @spicyanalytics 5C
Prizes to win:
1st prize: a ticket for Analytics 2015
2nd prize: a book of Prof Bart Baesens: “Analytics in a big
data world”
3rd to 30th prize: chocolates with pepper
Winners will be contacted post-Forum !Start of your tweet Question # Your answer


