130
i Technical Paper – Calculating Deferred Revenue Status – Confidential
| Date post: | 13-Sep-2014 |
| Category: |
Business |
| View: | 605 times |
| Download: | 5 times |

i
Technical Paper –
Calculating Deferred
Revenue
Status – Confidential

ii
Table of contents
List of figures ............................................................................................................... iv
List of tables.................................................................................................................. v
Glossary ......................................................................................................................vii
List of acronyms .......................................................................................................... ix
List of reserved symbols .......................................................................................... xiii
1. Introduction .......................................................................................................... 1
1.1 Literature ........................................................................................................ 3
1.2 The role of ELECTRE ................................................................................... 7
1.3 Thesis layout .................................................................................................. 8
2. Industry background ......................................................................................... 10
2.1 Network products ......................................................................................... 10
2.2 Network systems .......................................................................................... 11
2.3 Revenue........................................................................................................ 15
2.4 Revenue reporting and deferred revenue ..................................................... 15 2.4.1 Credit applied ................................................................................................................. 16 2.4.2 Debit applied................................................................................................................... 17
2.5 Deferred revenue .......................................................................................... 17 2.5.1 Unused airtime ................................................................................................................ 17
3. A new BSS ........................................................................................................... 24
3.1 BSS functionality ......................................................................................... 24 3.1.1 POS module .................................................................................................................... 25 3.1.2 VMS module................................................................................................................... 27
3.2 Proposed method for the calculation of deferred revenue ........................... 30 3.2.1 Sales credit (including bonuses allocated on the sales channel) ..................................... 30 3.2.2 Airtime usage (including expiry and deactivation credit) ............................................... 30
4 The model ........................................................................................................... 36

iii
4.1 Assumptions ................................................................................................. 36
4.2 Criteria ......................................................................................................... 37 4.2.1 Serviceability .................................................................................................................. 41 4.2.2 Profitability ..................................................................................................................... 42 4.2.3 Marketability .................................................................................................................. 44 4.2.4 Network optimisation ..................................................................................................... 45
4.3 Obtaining synthesis values for criteria ......................................................... 46
4.4 Checking for consistency ............................................................................. 50
4.5 Finding the score of an alternative for a criteria .......................................... 52
4.6 Departmental dependency and consistency ................................................. 54 4.6.1 Commercial department (serviceability) weighting ........................................................ 54 4.6.2 Finance department (profitability) weighting ................................................................. 55 4.6.3 Marketing department (marketability) weighting ........................................................... 56 4.6.4 IS department (network optimisation) weighting ........................................................... 57
4.7 Analysing the final scores ............................................................................ 58
4.8 Using ELECTRE as an outranking method ................................................. 59 4.8.1 Indices of concordance and discordance......................................................................... 60 4.8.2 Building an outranking relation ...................................................................................... 62
4.9 Sensitivity and robustness analyses ............................................................. 65
5. Conclusion .......................................................................................................... 69
5.1 Thesis summary ........................................................................................... 69
5.2 Solution results............................................................................................. 70
5.3 Suggestions and recommendations .............................................................. 70
5.4 Possible future work .................................................................................... 71
6. References ........................................................................................................... 74
A. Compact disc content ......................................................................................... 78
B. Complete sub criteria (KPI) list........................................................................ 80
C. Sub criteria that impact on deferred revenue and that applies to both
methods for the calculation of deferred revenue .................................................... 92
D. Sub criteria not duplicated through the involvement with other sub criteria
99
E. Commercial department (serviceability) weighting ..................................... 101
F. Finance department (profitability) weighting ............................................... 105
G. Marketing department (marketability) weighting ........................................ 109
H. IS department (network optimisation) weighting ......................................... 113
iv
List of figures
Figure 2.1: Systems interacting with the airtime purchase transaction. ...................... 12 Figure 2.2: Systems interacting with the credit applied transaction. .......................... 13 Figure 2.3: Systems interacting with the debit applied transaction. ............................ 14 Figure 2.4: Graphical depiction of the calculation of deferred revenue using the
formula based on the IN method. ................................................................................. 23 Figure 3.1: Sample CDR output data after decryption. ............................................... 29 Figure 3.2: Deferred revenue calculated for a typical mobile phone network using the
proposed method for calculation. ................................................................................ 33 Figure 3.3: Graphical depiction of the IN method and proposed method for the
calculating of deferred revenue. .................................................................................. 35 Figure 4.1: Building an outranking relation graphically. ............................................ 64
v
List of tables
Table 2.1: IN performance evaluation of loading and unloading airtime (in seconds)
into the voucher table during peak times (typically between 8AM and 8PM). ............ 19 Table 2.2: Table showing the variables in use for determining deferred revenue using
the IN method of calculation. ....................................................................................... 21 Table 3.1: Client history as reported on a POS over a selected period of time. ......... 26 Table 3.2: Table showing the variables in use for determining deferred revenue using
the proposed method of calculation. ............................................................................ 32 Table 3.3: The relationship between deferred revenue (financial liability), airtime
liability and deferred airtime. ...................................................................................... 34 Table 4.1: Main and sub criteria, network business units, key personnel and
designation at MNO for collaboration and identification of criteria and eventual
weights assigned to criteria. ........................................................................................ 39 Table 4.2: Interpretation of entries in a pairwise comparison matrix [17]. .............. 47 Table 4.3: Pairwise comparison matrix A for serviceability sub criteria.................... 47 Table 4.4: Pairwise comparison matrix B for profitability sub criteria. ..................... 47 Table 4.5: Pairwise comparison matrix C for marketability sub criteria.................... 48 Table 4.6: Pairwise comparison matrix D for network optimisation sub criteria. ...... 48 Table 4.7: Pairwise comparison matrix E for main criteria. ....................................... 48 Table 4.8: Weights assigned to main and sub criteria for calculation of the sub
criteria synthesis values. .............................................................................................. 50 Table 4.9: Aw
T and AwT/w
T for each of the criteria matrices A through to E.......... 51
Table 4.10: Random Index (RI) values for various values of n [17]. .......................... 51 Table 4.11: CI/RI for each matrix in the model. .......................................................... 52 Table 4.12: Results obtained from multiplying criteria synthesis values with
normalised criteria matrix averages and final scores obtained for System 1 (historical
or IN method) and System 2 (proposed method) for the calculation of deferred
revenue. ........................................................................................................................ 53 Table 4.13: System scores obtained from applying the model with departmental
weighting of all sub criteria. ........................................................................................ 59 Table 4.14: Decision matrix for ranking of the methods used for calculation of
deferred revenue. ......................................................................................................... 60 Table 4.15: Concordance and discordance indices for both methods being evaluated
to determine rank compared to the other. .................................................................... 62 Table B.1: Complete sub criteria representing 361 KPI used by MNO Group and
their subsidiary mobile phone networks. ..................................................................... 91 Table C.1: Sub criteria that impact on deferred revenue and applies to both methods
for the calculation thereof. ........................................................................................... 98 Table D.1: Sub criteria not duplicated through the involvement with other sub
criteria........................................................................................................................ 100 Table E.1: Commercial department pairwise comparison matrix for all sub criteria
used. ........................................................................................................................... 101 Table E.2: Normalised matrix for commercial department pairwise comparison
matrix. ........................................................................................................................ 102 Table E.3: Weights and synthesis values obtained for commercial department
weighting of sub criteria. ........................................................................................... 103
Table E.4: Results obtained from the commercial department by multiplying criteria
synthesis values with normalised criteria matrix averages and final scores obtained
for System 1 (historical or IN method) and System 2 (proposed method) for the
calculation of deferred revenue. ................................................................................ 104 Table F.1: Finance department pairwise comparison matrix for all sub criteria used.
.................................................................................................................................... 106 Table F.2: Normalised matrix for finance department pairwise comparison matrix.106 Table F.3: Weights and synthesis values obtained for finance department weighting of
sub criteria. ................................................................................................................ 107 Table F.4: Results obtained from the finance department by multiplying criteria
synthesis values with normalised criteria matrix averages and final scores obtained
for System 1 (historical or IN method) and System 2 (proposed method) for the
calculation of deferred revenue. ................................................................................ 108 Table G.1: Marketing department pairwise comparison matrix for all sub criteria
used. ........................................................................................................................... 110 Table G.2: Normalised matrix for marketing department pairwise comparison matrix.
.................................................................................................................................... 110 Table G.3: Weights and synthesis values obtained for marketing department
weighting of sub criteria. ........................................................................................... 111 Table G.4: Results obtained from the marketing department by multiplying criteria
synthesis values with normalised criteria matrix averages and final scores obtained
for System 1 (historical or IN method) and System 2 (proposed method) for the
calculation of deferred revenue. ................................................................................ 112 Table H.1: IS department pairwise comparison matrix for all sub criteria used. ..... 114 Table H.2: Normalised matrix for IS department pairwise comparison matrix. ....... 114 Table H.3: Weights and synthesis values obtained for IS department weighting of sub
criteria........................................................................................................................ 115 Table H.4: Results obtained from the IS department by multiplying criteria synthesis
values with normalised criteria matrix averages and final scores obtained for System
1 (historical or IN method) and System 2 (proposed method) for the calculation of
deferred revenue. ....................................................................................................... 116

vii
Glossary
airtime The amount of time a person spends talking on their mobile handset
Arobase Arobase Telecom SA
Bharti Airtel Bharti Airtel Limited
bonus The amount of airtime that is given to the client for no additional cost and
used as an incentive for the purchase of airtime bearing products
base station Also referred to as a Base Transceiver Station (BTS), it is the
equipment which facilitates the wireless communication between user
equipment and the network
cellular network A radio network made up of a number of radio cells each served
by a fixed transmitter
Citelcom Cote d’Ivoire Telecom SA
credit applied The process of loading airtime onto a client’s account
debit applied The process of consuming airtime which is on a client’s account
deferred revenue Income generated through the sale of pre paid recharge
mechanisms (airtime), but the product (airtime) must still be consumed by the
client to whom it was granted.
erlang A unit of traffic intensity in a telephony system
Investcom Investcom LLC
Itemate Itemate Solutions (Pty) Ltd
kits Subscriber Identity Modules (SIM) cards containing airtime
Koz Comium Ivory Coast Inc
Microsoft Microsoft Corporation
mobile handset A mobile phone device used for communication on a Global
Systems Mobile (GSM) network
mobile phone network Also referred to as a mobile phone operating unit, it is a
company that provides pre and post paid mobile telecommunication services to
viii
their clients in a resident country. A mobile phone network is most often part of
a group company structure, but can also function as a company in isolation.
Moov Moov Cote d’Ivoire
Oracle Oracle Corporation
Orange Orange Cote d’Ivoire
physical vouchers A tangible card or piece of paper containing a token for
dispensing in exchange of airtime
post paid A payment mechanism used for services, whereby a service is granted
before payment for the service takes place.
pre paid A payment mechanism used for services, whereby payment is received for
a service, before the service is granted.
revenue Income generated through the sale of pre paid recharge mechanisms
(airtime).
revenue assurance A term used for the assurance of revenue as generated within an
organisation through it’s involvement with day to day business
Sage SAGE Group plc
sales credit The amount of airtime granted to a client on a sale
SAP SAP AG
Sync Lab Sync Lab S.r.l.
TABS Post paid billing system
TIM Telecom Italia Mobile
usage The consumption of airtime, also referred to as debit applied
Vodacom Vodacom (Pty) Ltd
Vodafone Vodafone Group Plc
voucher table A database table which contains and manages the statuses of PIN
numbers used on vouchers for the redemption by clients
wireless network Any type of computer network that is wireless, commonly
associated with a telecommunications network whose interconnection between
nodes is implemented without the use of wires

ix
List of acronyms
AHP Analytical Hierarchy Process
ARPU Average Revenue per User
ASR Answer Seizure Ration
BSS Business Automation and Support System
BTS Base Transceiver Station
CAPEX Capital Expenses
CDR Call Data Record
CI Consistency Index
CIO Chief Information Office
CEO Chief Executive Officer
CHT Call Hold Time
COS Cost of Sale
CSI Customer Satisfaction Index
CSR Customer Service Representative
CRM Customer Relationship Manager
CTIO Chief Technical and Information Officer
DSS Decision Support Systems
EBIDTA Earnings Before Interest, Depreciation, Tax and Amortisation
ELECTRE Elimination and Choice Expressing Reality
ERM Enterprise Resource Management
ERP Enterprise Resource Planning
FCFA French CFA

x
FTE Fixed Term Employee
EU Expected Utility
EVD Electronic Distribution Mechanism
GAAP Generally Accepted Accounting Practise
GPRS General Packet Radio Service
GSM Global Systems Mobile
HC Head Count
HLR Home Location Register
HR Human Resource
HT Hors Taxes (excluding VAT)
IFRS International Financial Reporting Standard
IN Intelligent Network
IP Internet Protocol
IS Information Systems
ISP Internet Service Provider
IT Information Technology
IVR Interactive Voice Response
KPI Key Performance Indicator
MAUT Multiple Attribute Utility Theory
MCDA Multiple Criteria Decision Analysis
MOU Mobile Operating Usage
MS Management Science
MSC Mobile Switching Centre
NGN New Generation Network
OPEX Operational Expenses

xi
ODSS Organizational Decision Support Systems
OR Operations Research
ORSSA Operations Research Society of South Africa
PIN Personal Identification Number
POS Point of Sale
PROMETHEE Preference Ranking Organization Method for Enrichment
Evaluations
QOS Quality of Service
RA Revenue Assurance
RGS Revenue Generating Subscriber
RI Random Index
SCP Service Control Point
SDP Service Data Point
SEU Subjective Expected Utility
SIM Subscriber Identity Module
SMS Short Message Service
TCH Transmission Channel
TCO Total Cost of Ownership
TRXS GSM Transceivers
TTC Toutes Taxes Comprises (including VAT)
USD United States Dollar
USSD Unstructured Supplementary Service Data
VAS Value Added Service
VAT Value Added Tax
VLR Visitor Location Register

xii
VMS Voucher Management System
VTU Virtual Top Up
WASPA Wireless Application Service Providers’ Association
WECA West and Central Africa
WiMAX Worldwide Interoperability for Microwave Access

xiii
List of reserved symbols
a An alternative
A The pairwise comparison matrix for serviceability sub criteria, with
general elements aij
Anorm The normalised comparison matrix for serviceability sub criteria
Au Airtime usage (including expiry and deactivation credit)
AwT
The multiplication result of matrix A with an n-dimensional column
vector of weights
AwT /wT
The division result of AwT by w
T
b An alternative
B The pairwise comparison matrix for profitability sub criteria
Bnorm The normalised comparison matrix for profitability sub criteria
C The pairwise comparison matrix for marketability sub criteria
C(a,b) The concordance index of alternative a to alternative b
Cnorm The normalised comparison matrix for marketability sub criteria
C* The concordance threshold
D The pairwise comparison matrix for network optimisation sub criteria
D(a,b) The discordance index of alternative a to alternative b
Dnorm The normalised comparison matrix for network optimisation sub
criteria
D* The discordance threshold
E The pairwise comparison matrix for main criteria
Enorm The normalised comparison matrix for main criteria
F The set of all alternatives

xiv
i The row of a matrix
j The column of a matrix
n The number of criteria
R(a,b) The set of criteria for which b is strictly preferred to a
Rdb
Deferred revenue closing balance
Rdo
Deferred revenue opening balance
Rdp
Deferred revenue for the period
Sc Sales credit for the period (including bonuses allocated on the sales
channel)
Q(a,b) The set of criteria for which a is equal or preferred to b
w The estimate of a decision-maker’s weight, with general elements wi
wT
The n-dimensional column vector of weights
wTwi The multiplication result of wT with wi
x The variable or parameter used in the calculation of the historic
method for the calculation of deferred revenue
y The variable or parameter used in the calculation of the proposed
method for the calculation of deferred revenue
z Performance represented by an alternative with general elements zi
1
Chapter 1
1. Introduction
Emerging market mobile phone networks experience significant revenue losses due
to the lack of effective management of the pre paid value channel [29]. A number of
reasons contribute to the losses experienced on a day-to-day basis. These range from
logical product delivery to business and operational process management. The
complexity and diversity of the business and software and hardware systems that
interact with the pre paid value channel further complicates matters. The reasons for
this complexity may be summarized into the following categories:
The increased complexity of the network software and hardware systems that
interact with the pre paid value channel
Mobile phone networks, being a part of the telecommunications industry, have been
plagued by a multitude of different technologies. Cellular network technologies or
more specifically Global Systems Mobile (GSM) technologies was originally
managed by using existing fixed line technological infrastructure, because it was the
only telecommunications infrastructure available at the time GSM became
commercially available. Since inception, technology providing companies have
caught on to the demand mobile phone networks have for more flexible and easier to
deploy, low Total Cost of Ownership (TCO) software and hardware systems, to
manage their mobile phone network operations.
It is a never-ending spiral of supply and demand. Technology suppliers constantly
entice the mobile phone networks with newer and better systems and the networks
constantly look for more compatible systems able to manage new and conceptualized
products that will give them a competitive edge in the challenging market
environment. The lack of understanding and increased complexity due to the constant
change in management systems interacting with the pre paid value channel causes
lost and misinterpreted information, skewing pre paid reported revenues.
Lack of proper controls and processes with regards to the management and
distribution of the pre paid product used by the mobile phone network
The suppliers of technology are greatly to blame for the lack of proper controls and
processes with regards to logical pre paid product delivery [26]. Most often
technology suppliers implement solutions that would maximise their profits, rather
than to focus on the specific need of the mobile phone network. Typically the systems
that maximise the supplier’s profits are the most complex in nature. Suppliers
therefore focus on the sales and implementation of these systems, rather than to focus
on network product delivery. The mobile phone networks, find themselves allocating
2
their most skilled employees to the management of the systems in which the largest
capital investments are made, increasing the allocation of resources to these systems
even further.
One of the most important channels within the network environment is the pre paid
distribution channel. This is the channel through which the pre paid product is
delivered to the market. The pre paid product in emerging market mobile phone
networks is the largest revenue generating product within the network environment,
due to its wide market accessibility and the possibility for low income earners to load
small amounts of credit onto their mobile phone accounts at a time [2]. Because the
largest amount of investment capital is spent on the most complex problems, the pre
paid delivery channel is most often neglected, as it is perceived to be quite a mundane
and easily managed part of the business, however this is not the case.
Inexperienced and under paid staff is normally allocated to pre paid product delivery
and insufficient time and energy is spent on the processes responsible for getting the
pre paid product into the market environment. It is due to the delivery of these
products, not being securely managed by responsible and competent employees that
the mobile phone networks experience a lot of fraud and product losses on this
channel, contributing to lost revenues at the end of the day.
Lack of proper software systems that monitor, manage and control human-
driven operations processes
The combination of complex systems involvement and incompetent management of
pre paid product delivery is further aggravated by the lack of audit ability with
regards to the human driven processes within the pre paid value channel. The
following are all direct results of lacking control features on the pre paid value
channel, causing inaccurately reported revenues, affecting the mobile phone
network’s profitability negatively:
Inaccurate and untimely reporting, due to the lack of trustworthy data sources
and the complexity involved with data manipulation which causes data
discrepancies
System failures and bad configurations
Billed traffic discrepancies
The lack of proper integration methods between existing and newly
implemented software and hardware systems
Rapid pace of emerging market mobile penetration
It is worth mentioning that one of the root causes for mobile phone networks
experiencing such large revenue losses is due to the fact that they are making so
much revenue. There is a significant focus of resources and capital on market
penetration and the launch of new services, to acquire the competitors’ subscribers
through bettered and cheaper service delivery. Due to resources, time and energy
being spent on realising increased growth and market capitalisation, the sustainability
3
and security of the existing market and distribution processes of products to that
market are most often neglected. Mobile phone networks eventually realise that they
are busy losing revenue at almost the same pace as what they are gaining new
revenue [32].
1.1 Literature
The foundations of decision analysis can be traced back at least as far as Bernoulli
(1738) and Bayes (1763). Bernoulli was concerned with the fact that people generally
do not follow the expected value model when choosing among gambles, in particular
when buying insurance. He proposed the expected utility model with a logarithmic
utility function to explain these deviations from the expected value model. Bayes was
interested in the revision of probability based on observations and proposed an
updating procedure that is now known as Bayes theorem [38]. The publication of the
Theory of Games and Economic Behaviour by von Neumann and Morgenstern (1944)
was a major milestone in the history of decision analysis and economics. The book
established the foundation for decision analysis. In the second edition of the book
(1947) von Neumann and Morgenstern provided an axiomatization of the expected
utility (EU) model, showing that a cardinal utility function could be created from
preferences among gambles. Their analysis took the probabilities in the decision
problem as given and their axioms led to the conclusion that decision-makers should
make decisions to maximize their expected utility [38]. In The Foundation of
Statistics (1964), Savage extended von Neumann and Morgenstern’s expected utility
model to consider cases in which the probabilities are not given. Savage proposed a
set of axioms about preferences among gambles that enabled him to simultaneously
derive the existence of subjective probabilities for events and utilities for outcomes,
combining the ideas of utility theory from economics and subjective probability from
statistics into what is now referred to as the subjective expected utility (SEU) model
[38]. Edwards and Phillips followed this model, but also studying Bayesian inference
they found that people tend to revise their opinion less strongly than prescribed by
Byes Theorem [30].
One of the foundations of decision analysis is the use of personal or subjective
probabilities. This approach is Bayesian in that probabilities are interpreted as
measures of an individual’s beliefs rather than long-run frequencies to be estimated
from data. One of the central challenges of decision analysis is reliably assessing
probabilities from experts, taking into account the psychological heuristics that
experts use in forming these judgments and the potential for biases. In many
applications of decision analysis, the stakes are sufficiently large that a decision-
maker will seek the opinions of several experts rather than rely solely on the
judgment of a single expert or on his or her own expertise. This then raises the
question of how to combine or aggregate these expert opinions to form a consensus
distribution to be used in the decision model. While it is easy to say that the Bayesian
modelling approach represents the solution to the expert combination problem in
principle, in practice there remain many complex modelling challenges and questions
about the effectiveness of different combination mechanisms. Clemen and Winkler
(1990) illustrated the importance of capturing dependence among the expert forecasts
4
when combining forecasts [30].
Weber et al. (1988) studied how weights in multiattribute utility assessments change
depending on the level of detail in a hierarchical mulitattribute utility function. For
example when a single attribute is treated as a single objective, but could just as
easily be broken up into two component elements. They found that the level of detail
used in the specification greatly impacted the weight assigned to the attribute.
Attributes that are decomposed in more detail receive more weight than the same
attribute with a less detailed decomposition. These results suggest that analysts need
to take great care in defining a value hierarchy for utility functions. One of the more
acrimonious debates in management sciences has concerned the Analytical Hierarchy
Process (AHP), the method used for measuring effectiveness in this thesis. The AHP
is a decision-making procedure originally developed by Thomas Saaty in the 1970s.
Decision analysts have been critical of the AHP saying that it lacks a strong
normative foundation and that the questions the decision-maker must answer are
ambiguous [30].
Decision analysis has clearly been recognized as an important tool for the evaluation
of major decisions in the public sector. Decision analysis methods are not yet
widespread in corporations. To have a greater impact on corporate decision-making,
decision analysis researchers must build on and pay more attention to the principles
of corporate finance and the theory of financial markets [30]. The idea of using the
computer to help decision-makers was published as early as 1963 [5]. It was in the
early 1970s that many suggested a wide range of terms to describe the system that
help decision-makers in the process of making varying degrees of decision structures.
Scott Morton is considered one of the first groups of researchers who coined the term
decision support systems. Since then, there has been a growing amount of research in
the area of Decision Support Systems (DSS) [37]. Eom and Kim note that a focus on
the customer is the cornerstone of modern management philosophy. Managing
aggregate customer demand triggers the operations management process they say
[37]. DSS has been implemented across various market sectors and to support our use
of this technique I quote but a few successful implementations that have been done in
the telecommunications and financial arena. Some minor applications include agent-
enabled DSS design, information system project portfolio planning and business
process optimization [18]. Many DSS are developed to effectively design fibre-optic
networks and to plan regional telecommunication networks [10]. Kim’s survey also
shows that an increasing number of multi-functional DSS have been implemented in
various industries, with specific focus to telecommunications [20]. The majority of
DSS applications in the finance area are developed to support credit evaluation and
management [11], selection of financial audit portfolios, credit risk management of
home mortgage portfolios and to optimize investment policy strategy [27].
Eom and Kim further notes that the dominant application area of DSS is still
production and operations, followed by marketing and logistics and management
information systems field. The other corporate functional areas remain steady except
accounting and international business. Those areas were not explored in the time
period. It was further noted that Management Science (MS) and Operations Research
(OR) models have been essential elements of DSS tools. Many commercial software
packages now include visual interactive sensitivity analysis capabilities. Other
5
emerging tools embedded in DSS are the AHP or methods for outranking relations
such as Elimination and Choice Expressing Reality (ELECTRE) and Preference
Ranking Organization Method for Enrichment Evaluations (PROMETHEE). The
ELECTRE method was first introduced in 1968 for outranking relations for
modelling the decision-maker’s preferences in Multi-Criteria Decision-Making
(MCDM) problems. Compared to this, the AHP is based on Multiple Attribute Utility
Theory (MAUT) that represents preferences by means of utility function. These
methods are different in multi-criteria aggregation procedure. PROMETHEE defines
global ranking, which means that it provides the decision-maker with a ranking of all
potential actions. ELECTRE methods incorporate some criteria as rejection points
that block the outranking relationship between two potential actions. Owing to these
differences, in Eom and Kim’s survey, PROMETHEE methods were more widely
used in group decision-making or MCDM [37]. Detailed comparison of the AHP,
ELECTRE and PROMETHEE and preference desegregation methods can be found in
Zopounidis and Doumpos’s paper where they applied these techniques to the
financial decision-making domain [44].
Strategic decision support encompasses a wide range of different strategies such as
functional strategy, business strategy and global corporate strategy. Rapid
advancement in telecommunications technologies triggered a revolution in the
structure and operations of many firms in the internet-driven global economy. The
result of web-based DSS being that optimization results are easy to communicate
among multiple users in an organization such as functional managers, management
scientists, top managers, etc. During the 1990s, the focus of DSS research shifted
from the optimization of functional decisions in an organizational unit to the
optimization of an organizational decision that affects several organizational units.
The best example of Organizational Decision Support Systems (ODSS) is Enterprise
Resource Management (ERM) systems and Enterprise Resourcing Planning (ERP)
systems. ERP systems integrate and optimize the entire organization’s multiple
functional units (marketing, human resource, production, etc.) [37].
Over the past decade, many firms invested in their core information technology
infrastructures including the business intelligence system. The infrastructure includes
data warehousing, business intelligence software tools, pre-packaged analytical
applications and telecommunications and internet technologies. Thanks to the
information technology infrastructure, many organizations are undergoing a
fundamental shift in making their decisions [37]. When it comes to advanced data
systems in use within the mobile phone network environment, most organizations
choose to develop, implement and manage these themselves in order to retain control,
guarantee the security of data and reduce their costs [7]. This is not a new trend. In
technology companies servicing different aspect of the market, whether that is first
world or emerging markets, such as the Internet Service Provider (ISP) environment
we find the same behaviour. When adopting new technologies, such as Worldwide
Interoperability for Microwave Access (WiMAX), organizations implement this with
great cause, in order not to upset existing revenue streams [4]. The adoption of this
approach is not necessarily wrong. Resources are scares to get hold off,
understanding of the exact nature of the business is rare and when developed outside
of the mobile phone network, a supplier relationship needs to be maintained and this
normally means expensive license fees and support retainers.
6
According to Rob Bamforth, practice leader for wireless and mobile networks at
Bloor Research, companies should overcome the risks, such as security and
management concerns, involved with outsourcing specific technological business
functions by the use of appropriate policies and procedures. And this he says can be
accomplished in a cost effective manner if the right tools, products and services
directly support the implementation of those policies and procedures [1]. Time and
again we read articles highlighting risks associated with the implementation of new
systems within an organisation, even more so when it comes to mobile phone
networks. But, as we prove in this thesis, it is not necessarily a bad approach to
implement specific modular functions that control specific aspects of the mobile
phone network’s operations if it is a controlled implementation. By using the correct
tools, such as some of the techniques mentioned here, the most effective
implementation can be guaranteed.
Another very common trend in the telecommunications market is that of acquisitions
and mergers. All too often we see larger and more established telecommunication
groups either acquiring other organizations in their entirety or investing large
amounts of capital for acquisition of shares in that company. This is due to large
profits and even more optimistic future growth potential being shown in the
companies being acquired. Bharti Airtel Limited (Bharti Airtel), one of the world’s
largest mobile phone networks, having profits tripling year on year lead to Vodafone
Group Plc (Vodafone) purchasing a 10% share in the company for United States
Dollar (USD) 1.5 billion [39]. One important aspect all too often neglected by media
when these acquisitions are done, is that the investing group companies effectively
acquire years of management skills, obtained within the market sector that the
acquired technology company applies its offering. This is not a new trend, especially
not in the mobile telecommunications arena. MNO Group Limited (MNO Group) has
been known to offer services to numerous companies offering value added services to
MNO Group’s subsidiary companies and when the service is launched successfully,
MNO Group either executes an acquisition of that company, or if not able to do this,
simply terminates the service offering in order to internalize the value added service
offering for personal gain [24]. Another example of this trend can be seen in the
Bharti Airtel scenario, where current profits being shown are large, but profitability
has only been realized since 2003 and this after their launch in 1995 [39]. The two
ends of the scale mentioned above are shown here. That of outsourcing a function,
unless or even until it is managed correctly, in which case it becomes more attractive
to internalize the function whether through acquisition as we see Vodafone investing
in Bharti Airtel, or MNO Group internalizing the value added service offering.
Amongst other things, a large mobile phone network like Bharti Airtel has been able
to effectively capitalize on opportunities within the Indian market by outsourcing
services. This enables a reduction in capital expenditure requirements, providing
more time for Bharti Airtel’s management to focus on other key issues, such as
strategy, marketing and customer orientation. As their chairman and managing
director Sanil Bharti Mittal puts it, it allows them to place a lot more emphasis on
building a company with world class processes [39]. Large organizations should not
only look locally to outsource services as it has become ever more important to look
at your organization from a global perspective. Globalization has extended the
7
geographic scope of business. The ability to source globally, for example, provides a
much wider choice. More and more often we see local suppliers competing in
national and international markets for local business. It is vital for organizations to
adopt strategies that will help them manage globally, at home or abroad.
Globalization and outsourcing help raise awareness of conditions in other parts of the
world, and thus it can help raise standards. For an organization to have a global
mindset, managers must think internationally even if they are operating a local
department in a local company [19].
In recent years, growing attention is being paid in the industry to developing efficient
techniques and tools for monitoring business processes accurately and in a timely
fashion on a local and international scale. Dependable monitoring is a key aspect of
business process management, since it provides information that is crucial for
determining the actual Quality of Service (QOS) delivered to individual parties and
for promptly handling off plan deviations. With most commercial products, vendors
do not provide details about internal mechanisms, implementation choices and field
performance. Two examples where matters were handled differently are worth
making mentioned of here. The first is that of MNO Group which has been working
closely with the University of Pretoria in South Africa for a number of years. The
university developed, at MNO Group’s request, an algorithm for the generation of
uniquely identifiable sequences of numbers for use when recharging a mobile
subscriber’s account with a preconfigured amount of airtime. The second was a
research activity conducted cooperatively by an academic and an industrial party. The
Dipartimento per le Technologie of the University of Naples Parthenope and Sync
Lab S.r.l. (Sync Lab) redesigned a general purpose business process monitor to meet
the performance requirements imposed by Telecom Italia Mobile (TIM) mobile
phone recharging system [8].
The recharging system monitor was redesigned architecturally to collect and filter a
sustained rate of 4000 recharge events per second. In order to demonstrate the
effectiveness of the newly designed proposed approach an experimental campaign
was carried out for comparing the original (buffered) architecture to the new
(streamed) architecture. The experimental campaign was fundamentally aimed at
evaluating the impact of the architectural choices made in the streamed solution and
all underlying components were left unchanged in the two systems. The execution
times of the original and stream-based solution was compared through defining a set
of points of observation that was used as reference for timing measurements. The two
systems were then tested at their maximum capability by means of a flow generator
that fed them with a continuous event flow. Results showed that the parsing
performance of the stream-based architecture is more than 33 times higher than the
one of the buffered architecture. Again it is concluded that monitoring is a crucial
aspect of business process management, since it provides information that is key for
determining the actual QOS delivered to individual parties, and for promptly
handling off-plan deviations [8].
1.2 The role of ELECTRE
8
Besides using value measurement approaches to Multiple Criteria Decision Analysis
(MCDA), such as the AHP and MAUT, ELECTRE is introduced as an outranking
method and used for estimating effectiveness also. The outranking approaches differ
from the value function approaches in that there is no underlying aggregative value
function [3]. The output of an analysis is not a value for each alternative, but an
outranking relation on the set of alternatives.
The way in which an outranking relation is exploited by a method depends on the
particular problem. Roy identified four different broad typologies or categories of
problems, for which MCDA may be useful [33]. These are:
The choice problematique: To make a simple choice from a set of
alternatives.
The sorting problematique: To sort actions into classes or categories, such as
definitely acceptable, positively acceptable but needing more information and
definitely unacceptable.
The ranking problematique: To place actions in some form of preference
ordering which might not necessarily be complete.
The description problematique: To describe actions and their consequences
in a formalised and systematic manner, so that decision-makers can evaluate
these actions. Our understanding of this problematique is that it is essentially
a learning problematique, in which the decision-maker seeks simply to gain
greater understanding of what may or may not be achievable.
Much of the literature on outranking methods done in English is that of Roy and
Vincke. Roy, who must be credited for the initial and much subsequent work on
outranking methods, was critical of the utility function and value function methods on
the grounds that they require all options to be comparable. He developed the
ELECTRE methods which he describes as providing weaker, poorer models that a
value function, built with less effort and fewer hypotheses, but not always allowing a
conclusion to be drawn [3].
1.3 Thesis layout
In Chapter 2 some industry background is provided to form a solid understanding of
the mobile phone network environment. We explore the reasons giving rise to the pre
paid value channel contributing so greatly to the generation of revenue in emerging
markets. We then identify the causes for revenue losses. We identify deferred
revenue as the main determinant in the pre paid revenue generating stream and look
at the different methods for calculating deferred revenue. Historical methods for the
calculation of deferred revenue and accompanying indicators are described. In
Chapter 3 we show how a new method for determining deferred revenue and
accompanying indicators is arrived at through the implementation of a Business
Automation and Support System (BSS). In Chapter 4 we conclude by using the AHP

9
algorithm for determining the effectiveness of the deferred revenue calculated
through the method made possible by using a BSS and ELECTRE is presented as an
outranking method to do the same.
In Chapter 5 we conclude with a resulting argument for the furthered use of a BSS in
calculating deferred revenue and close of this thesis with a section on possible future
work with regards to the subject matter.
10
Chapter 2
2. Industry background
In order to understand how mobile phone networks generate revenue and what
significant impact the concept of deferred revenue, that we define in quite a lot of
detail, plays in the generation of revenue, it is necessary to understand (1) the
network products and (2) the software and hardware architecture of a typical mobile
phone network.
By understanding the network products, we can determine how the sales channel
generates revenue, but in understanding the systems architecture we are able to
isolate shortcomings that are addressed while implementing a BSS. It is through
addressing these shortcomings that we can successfully derive at better revenue
reporting mechanisms that have not been previously possible without a thorough
understanding of the network environment.
Thorough understanding of the network product and the network environment are not
the only factors that influence the revenue reporting process. Other factors include
logical constraints, such as restricted access to complex information sources, the bulk
of data to be processed and the distributed nature of the data at these sources. Finding
work around solutions and eventually resolving logical constraints, don’t necessarily
better the revenue reporting results, rather it speeds up the problem resolution time
while using the same calculation methods. Therefore the only real constraint to
bettering revenue reporting is a thorough understanding of the network environment
enabling the use of better formulae. Pockets of retained intellectual property exist
within the network environment, but they seldom overlap to form a macro image of
the systems architecture in use, effectively providing the in depth understanding
required to better revenue reporting results.
2.1 Network products
A mobile phone network, like most companies in the service industry, is reliant on
selling their services to maintain an existence. A mobile phone network maintains a
great amount of cellular network infrastructure used in the realisation of its service.
The cellular network infrastructure collectively forms a wireless network that spans
the network coverage area. The wireless network uses electromagnetic waves to
transmit data between mobile handsets. Data that can be wirelessly transmitted
between handsets is the product that mobile phone networks sell to their clients.
Although the data product can be used in many different ways (such as voice and
pure data) and can be transmitted using many available protocols (such as General
Packed Radio Service (GPRS), Short Message Service (SMS) and Unstructured
Supplementary Service Data (USSD) to mention but a few) we focus our attention on
11
the methods identified to date which are used to distribute data to clients in the form
of a marketable product. We refer to the data product from here onwards as airtime.
The following airtime bearing products exist in a typical mobile phone network.
Physical vouchers
Physical vouchers are tangible cards or pieces of paper containing a Personal
Identification Number (PIN). The PIN can be dispensed in exchange for a
representative amount of airtime.
Electronic voucher distribution (EVD)
EVD is an electronic representation of a physical voucher. The electronic PIN can be
dispensed in exchange for a representative amount of airtime.
Virtual top up (VTU)
VTU is a term used for airtime that is purchased for a nominal value in any specified
denomination. The denomination is exchanged for a corresponding amount of airtime
that is loaded directly onto a client’s account.
Subscriber Identity Module (SIM) cards
A SIM card is an identity module that is inserted into a mobile handset. The SIM card
identifies a client on the network. SIM cards normally have airtime loaded on them
and the airtime becomes active on the client’s account when the card is activated by
the client (normally when the card is inserted into a mobile handset and the handset
containing the SIM card is switched on for the first time).
2.2 Network systems
It is important to understand the different systems that interact with pre paid revenue
in the making. This section shows the software and hardware systems and human-
driven operations processes that interact with the flow of revenue within a mobile
phone network’s pre paid value channel. A brief description of the functionality
provided by each system which impacts on revenue within the pre paid value channel
follows below.
12
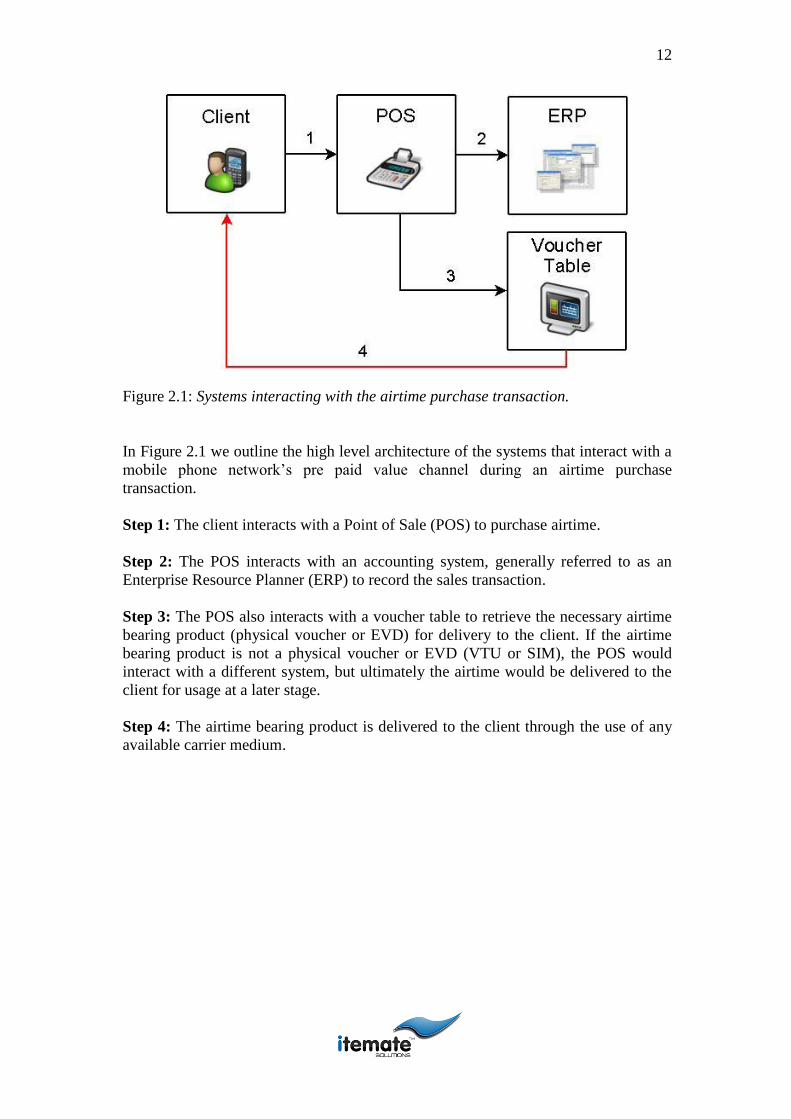
Figure 2.1: Systems interacting with the airtime purchase transaction.
In Figure 2.1 we outline the high level architecture of the systems that interact with a
mobile phone network’s pre paid value channel during an airtime purchase
transaction.
Step 1: The client interacts with a Point of Sale (POS) to purchase airtime.
Step 2: The POS interacts with an accounting system, generally referred to as an
Enterprise Resource Planner (ERP) to record the sales transaction.
Step 3: The POS also interacts with a voucher table to retrieve the necessary airtime
bearing product (physical voucher or EVD) for delivery to the client. If the airtime
bearing product is not a physical voucher or EVD (VTU or SIM), the POS would
interact with a different system, but ultimately the airtime would be delivered to the
client for usage at a later stage.
Step 4: The airtime bearing product is delivered to the client through the use of any
available carrier medium.
13
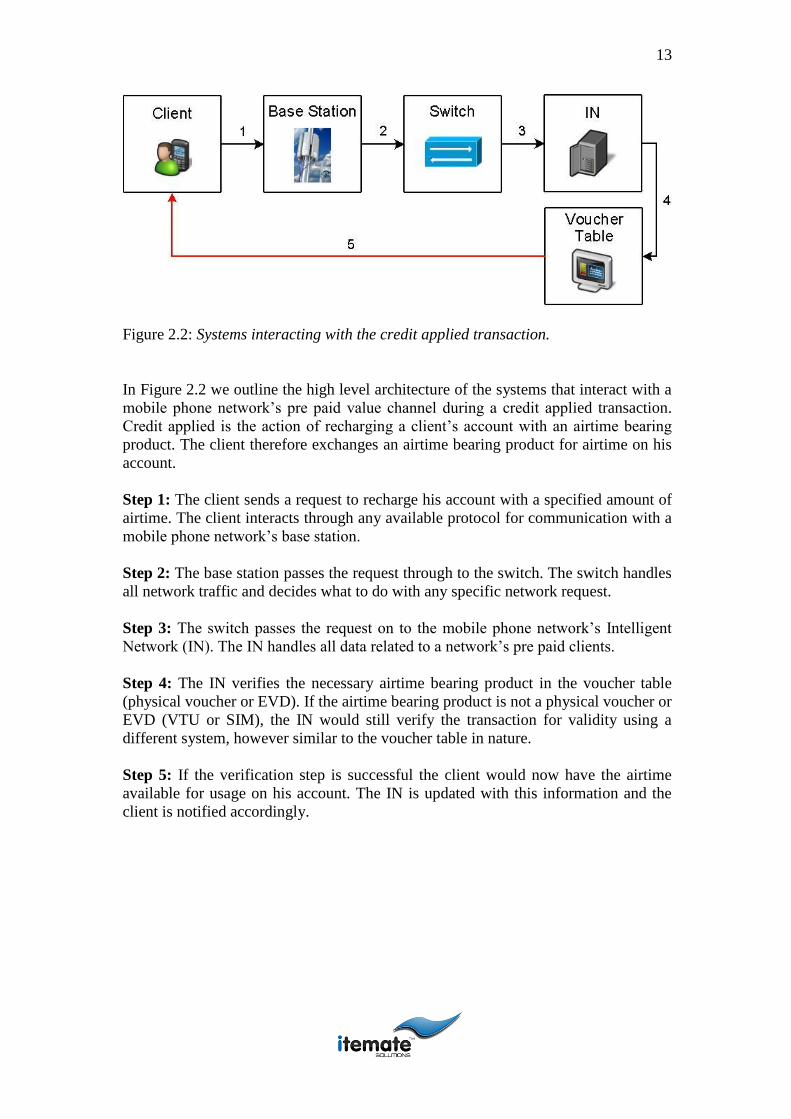
Figure 2.2: Systems interacting with the credit applied transaction.
In Figure 2.2 we outline the high level architecture of the systems that interact with a
mobile phone network’s pre paid value channel during a credit applied transaction.
Credit applied is the action of recharging a client’s account with an airtime bearing
product. The client therefore exchanges an airtime bearing product for airtime on his
account.
Step 1: The client sends a request to recharge his account with a specified amount of
airtime. The client interacts through any available protocol for communication with a
mobile phone network’s base station.
Step 2: The base station passes the request through to the switch. The switch handles
all network traffic and decides what to do with any specific network request.
Step 3: The switch passes the request on to the mobile phone network’s Intelligent
Network (IN). The IN handles all data related to a network’s pre paid clients.
Step 4: The IN verifies the necessary airtime bearing product in the voucher table
(physical voucher or EVD). If the airtime bearing product is not a physical voucher or
EVD (VTU or SIM), the IN would still verify the transaction for validity using a
different system, however similar to the voucher table in nature.
Step 5: If the verification step is successful the client would now have the airtime
available for usage on his account. The IN is updated with this information and the
client is notified accordingly.
14
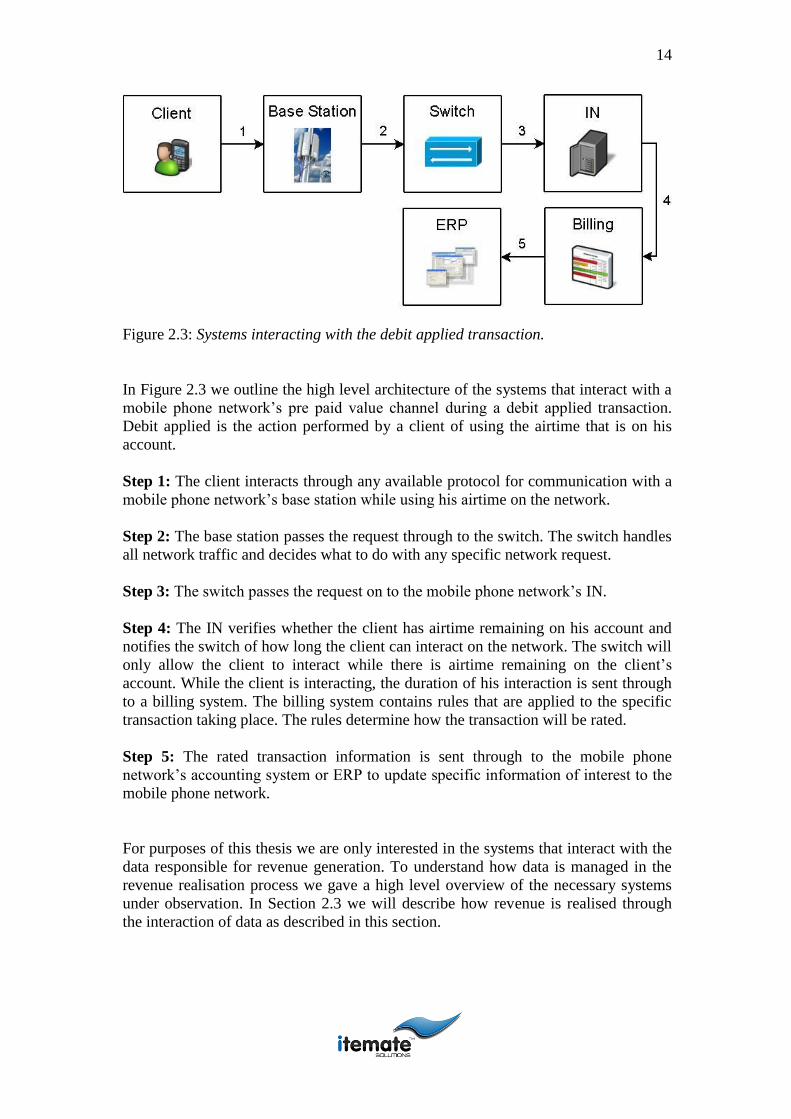
Figure 2.3: Systems interacting with the debit applied transaction.
In Figure 2.3 we outline the high level architecture of the systems that interact with a
mobile phone network’s pre paid value channel during a debit applied transaction.
Debit applied is the action performed by a client of using the airtime that is on his
account.
Step 1: The client interacts through any available protocol for communication with a
mobile phone network’s base station while using his airtime on the network.
Step 2: The base station passes the request through to the switch. The switch handles
all network traffic and decides what to do with any specific network request.
Step 3: The switch passes the request on to the mobile phone network’s IN.
Step 4: The IN verifies whether the client has airtime remaining on his account and
notifies the switch of how long the client can interact on the network. The switch will
only allow the client to interact while there is airtime remaining on the client’s
account. While the client is interacting, the duration of his interaction is sent through
to a billing system. The billing system contains rules that are applied to the specific
transaction taking place. The rules determine how the transaction will be rated.
Step 5: The rated transaction information is sent through to the mobile phone
network’s accounting system or ERP to update specific information of interest to the
mobile phone network.
For purposes of this thesis we are only interested in the systems that interact with the
data responsible for revenue generation. To understand how data is managed in the
revenue realisation process we gave a high level overview of the necessary systems
under observation. In Section 2.3 we will describe how revenue is realised through
the interaction of data as described in this section.
15
2.3 Revenue
All mobile phone network operators have at least two channels through which
revenue is generated. The first is the post paid value channel, where traffic is
generated on the mobile phone network and bills are typically settled at month end or
whenever the contractual agreement entered into with the client stipulates that he is
obliged to do so.
The second and according to reports by far the most popular is the pre paid value
channel [21]. Emerging markets, especially in Africa, lack proper financial control
mechanisms [9]. A sales channel through which the client purchases a product, before
it is consumed is therefore beneficial in monetary terms, but also in the value
associated with the limited liability (or diminished credit risk) on the part of the
mobile phone network. Typically, a client purchases a fixed amount of airtime and
then would eventually load that airtime onto his handset for use at some future point
in time. We refer to this use of airtime, as the consumption or usage of airtime.
The concept of the pre paid airtime mechanism came about through the lack of proper
financial control mechanisms in emerging telecommunication markets [15]. This
forced the mobile phone networks to look for alternative technologies that could
manage a risk free product that would eventually put a mobile handset in the hands of
even the poorest households in Africa. There are many reasons why the mobile phone
networks grow at the increased rates they do in emerging markets. The main
attributing factor being the lack of physical infrastructure, but the only reason for
increases in pre paid products as opposed to post paid products are because of the low
risk from a network perspective and the low cost to entry from a client perspective
[28]. The pre paid market share in emerging markets is between 99 and 100 percent
and the revenue they contribute as a percentage of total revenue is well above 95
percent in most cases [36].
Having shown that at least 95 percent of the revenue generated in emerging market
mobile phone networks is attributed to the use of the pre paid product, it should be
noted that we from here onwards place our focus on this value channel.
In Section 2.4 we describe revenue reporting mechanisms, specifically focusing on
pre paid revenue reporting and we show what function deferred revenue plays with
regards to the generation of revenue on the pre paid value channel.
2.4 Revenue reporting and deferred revenue
Historically, revenue has been reported on using standard accounting software, such
as enterprise software provided by solutions companies SAGE Group plc (Sage) and
SAP AG (SAP) and customised versions of systems databases provided by
companies such as Oracle Corporation (Oracle) and Microsoft Corporation
(Microsoft). These accounting system or ERP tools, record sales and use Generally
Accepted Accounting Practise (GAAP) techniques adhering to International Financial
16
Reporting Standards (IFRS) to prepare financial statements, calculate statutory
financial obligations and generate reports used for auditing purposes.
Since the inception of mobile phone networks, little has been required to change
regarding revenue reporting standards imposed by auditing firms. The first big
change in revenue reporting came about with the introduction of the pre paid product
to the network environment and consumer market. The pre paid product, launched
with the invent of the first mobile phone network in Africa, (Vodacom (Pty) Ltd
(Vodacom) was launched in South Africa during 1994) posed very specific
challenges to the network’s existing systems and architecture which up to that point
had focussed on post paid payment mechanisms for remuneration of network services
[16]. A further challenge to managing revenues and the pre paid product was imposed
by the reporting requirements needing to be adhered to as indicated by IFRS.
IFRS stipulates that revenue must be measured at the fair value of the consideration
received and represents the amounts receivable for goods and services provided in the
normal course of business, net of discounts and sales taxes [2]. Deferred revenue
cannot be reported as straight revenue, as there is a risk associated with the realisation
thereof. Although the money has been received, the service has not been delivered yet
and there is always a risk factor to consider when delivering any service. IFRS
furthermore stipulates that deferred revenue must be recognised over a period of one
to three years [2]. So if revenue is recognised over a period of one to three years after
deferred revenue has been recorded, the difference will be seen as a defect the mobile
phone operator experienced in delivery of its service.
Therefore the importance of accurate deferred revenue. Not only does it create
expectations with the mobile phone network’s shareholders, but it is also used for
budget planning and other executive decision-making processes. Mobile phone
networks report on deferred revenue by using a formula that can deliver a snapshot
view of deferred revenue at any given point in time. This formula is referred to as the
IN method of deferred revenue calculation. The IN method relies solely on real time
calculations performed by the IN on a 24 hour basis. By querying the IN for relevant
information at a specific point in time, it is possible to determine the deferred revenue
for a network at that point in time.
The next section contains a description of 2 terms used throughout the document
from here onwards, namely that of credit and debit applied.
2.4.1 Credit applied
When a mobile phone network sells airtime and the client loads the airtime onto his
handset, we refer to the action of loading the airtime on the handset as credit applied.
The amount of credit that is applied during this action is equal to the airtime value
associated with the sale of the airtime that is being loaded onto the client handset.
Just as we can define credit applied for a specific client or handset, we can collect the
collective amount of credit applied for the mobile phone network pre paid subscriber
base over any given period of time. This information can be retrieved from the IN.
The IN records airtime on a client’s account when it receives an instruction to do so,
17
it does not remember what gave it that instruction, nor does it attempt to retain
information related to the monetary cause of the value in airtime.
2.4.2 Debit applied
There are certain rules that determine the value of credit that is applied for a
corresponding monetary value exchanging hands. Similarly there is a corresponding
predetermined set of rules that determine the amount of airtime that is consumed
when a client utilizes services offered by a mobile phone network. The action of
consumption of airtime through the utilisation of services, such as voice calls, SMS
or data access is referred to as debit applied. These rules may also change from time
to time. The part of the IN that performs this task is referred to as a rating engine, but
as with credit applied the rating engine only knows what rules apply at any given
moment. It is not designed to maintain a historic record of which rules were applied
at the time the airtime was generated on a client's account. Rather the IN can give you
time series data of what the total amount of debit applied was over a specific period
of time for the entire mobile phone network pre paid subscriber base.
2.5 Deferred revenue
Consider an example of how deferred revenue is calculated using the formula based
on the IN method. Typically, the IN will be queried for the necessary information at
midnight on the last day of every month. The deferred revenue is calculated from the
information retrieved and this is used in determining the mobile phone network's
revenue at month end. The IN method consists of the following variables all queried
from the IN at any specific time interval:
Unused airtime
Physical voucher airtime
EVD airtime
VTU airtime
Unused SIM card airtime
Airtime remaining IN
2.5.1 Unused airtime
Unused airtime is the sum amount of total airtime available in distribution after being
sold by the network operator, but that has not been loaded onto client mobile handsets
yet. This value is determined by performing multiple queries on the IN, one for each
type of airtime bearing item as was previously discussed. After each query, some data
manipulation is necessary to estimate the exact value of airtime in circulation for the
specific product type. The data manipulation typically involves subtracting the
airtime still in distribution, because this airtime still has to be sold before it can be in
circulation. One might ask, why the airtime is available on the IN if it has not been
sold yet, implicating a security threat? The answer lies in a specific constraint
18
imposed by the IN leaving the mobile phone network with no alternative but to
continue with this process of premature loading of airtime. Tests performed by
Itemate Solutions (Pty) Ltd (Itemate Solutions) have shown that any IN in use during
peak times (typically between 8AM and 8PM) is too busy to perform effective
loading of airtime as and when it is sold at the network outlets [40]. A workaround
solution for poor loading performance of the IN, is to load airtime during low peak
hours, typically at night when most people are asleep and not making use of their
mobile handsets which places the IN under heavy load. The result of any query
executed on the IN for airtime associated with products of any nature, therefore has to
be decreased with the airtime still in distribution to be acceptable for use in the
calculation of deferred revenue.
Batch
number
PIN
quantity
PIN
activation PIN deactivation
Activation rate
(PINs/sec)
Deactivation rate
(PINs/sec)
Single sequences
1.1 1 000 18 14 56 72
1.2 10 000 178 133 56 75
1.3 50 000 783 943 64 53
1.4 100 000 1 637 1 302 61 77
1.5 200 000 3 412 2 584 59 77
1.6 1 000 000 13 664 19 122 73 52
10 Concurrent batches of 10 000 each = 100 000
2.1 10 000 342 271 29 37
2.2 10 000 353 267 28 37
2.3 10 000 349 271 29 37
2.4 10 000 361 269 28 37
2.5 10 000 358 274 28 36
2.6 10 000 364 275 27 36
2.7 10 000 361 274 28 36
2.8 10 000 363 277 28 36
2.9 10 000 360 277 28 36
2.10 10 000 351 276 28 36
16 Concurrent batches of 100 000 each = 1 600 000
3.1 100 000 7 438 Data not available 13 Data not available
3.2 100 000 7 460 Data not available 13 Data not available
3.3 100 000 7 470 Data not available 13 Data not available
3.4 100 000 7 471 Data not available 13 Data not available
3.5 100 000 7 479 Data not available 13 Data not available
3.6 100 000 7 479 Data not available 13 Data not available
3.7 100 000 7 480 Data not available 13 Data not available
3.8 100 000 7 482 Data not available 13 Data not available
3.9 100 000 7 488 Data not available 13 Data not available
3.10 100 000 7 496 Data not available 13 Data not available
3.11 100 000 7 501 Data not available 13 Data not available
3.12 100 000 7 506 Data not available 13 Data not available
3.13 100 000 7 590 Data not available 13 Data not available
3.14 100 000 7 591 Data not available 13 Data not available
3.15 100 000 7 544 Data not available 13 Data not available
3.16 100 000 7 593 Data not available 13 Data not available
19
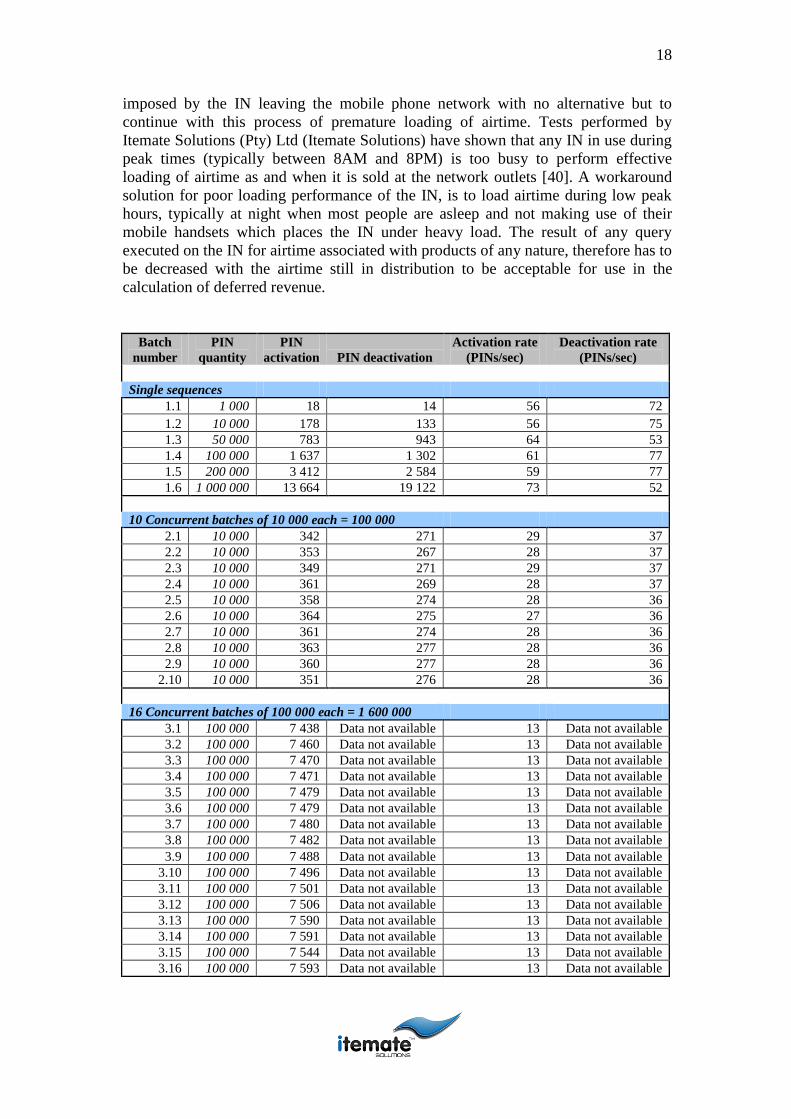
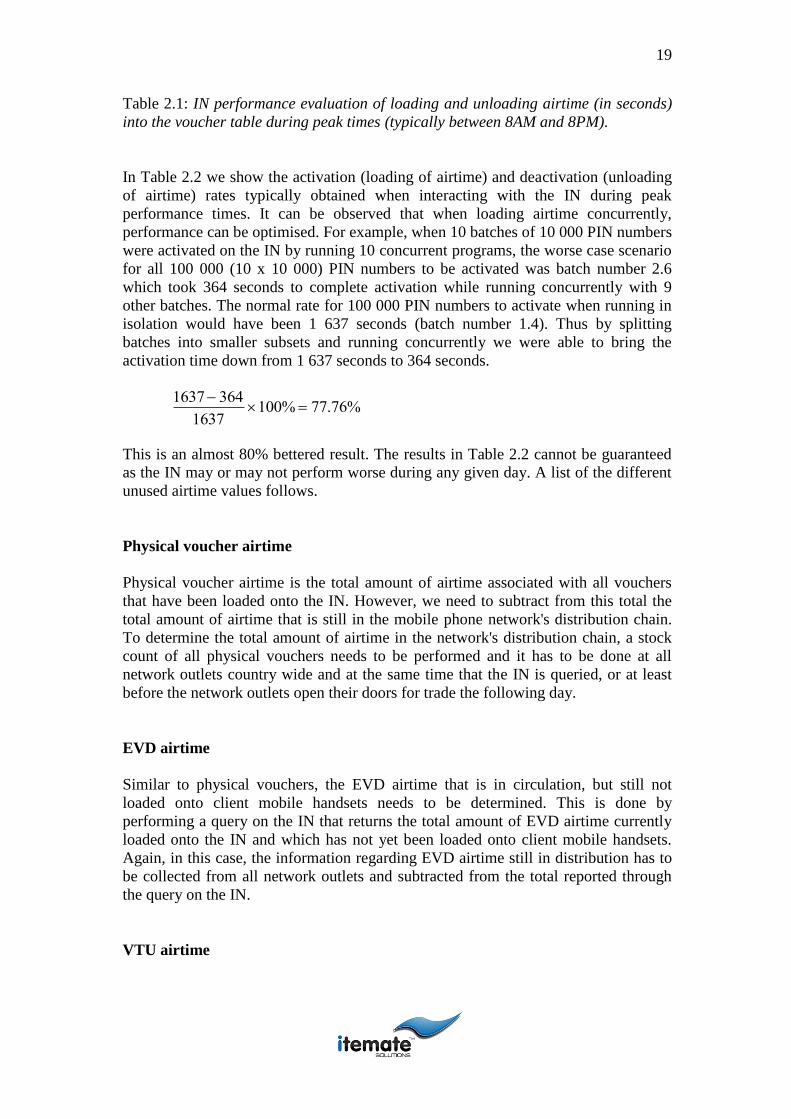
Table 2.1: IN performance evaluation of loading and unloading airtime (in seconds)
into the voucher table during peak times (typically between 8AM and 8PM).
In Table 2.2 we show the activation (loading of airtime) and deactivation (unloading
of airtime) rates typically obtained when interacting with the IN during peak
performance times. It can be observed that when loading airtime concurrently,
performance can be optimised. For example, when 10 batches of 10 000 PIN numbers
were activated on the IN by running 10 concurrent programs, the worse case scenario
for all 100 000 (10 x 10 000) PIN numbers to be activated was batch number 2.6
which took 364 seconds to complete activation while running concurrently with 9
other batches. The normal rate for 100 000 PIN numbers to activate when running in
isolation would have been 1 637 seconds (batch number 1.4). Thus by splitting
batches into smaller subsets and running concurrently we were able to bring the
activation time down from 1 637 seconds to 364 seconds.
1637 364
1637100% 77.76%
This is an almost 80% bettered result. The results in Table 2.2 cannot be guaranteed
as the IN may or may not perform worse during any given day. A list of the different
unused airtime values follows.
Physical voucher airtime
Physical voucher airtime is the total amount of airtime associated with all vouchers
that have been loaded onto the IN. However, we need to subtract from this total the
total amount of airtime that is still in the mobile phone network's distribution chain.
To determine the total amount of airtime in the network's distribution chain, a stock
count of all physical vouchers needs to be performed and it has to be done at all
network outlets country wide and at the same time that the IN is queried, or at least
before the network outlets open their doors for trade the following day.
EVD airtime
Similar to physical vouchers, the EVD airtime that is in circulation, but still not
loaded onto client mobile handsets needs to be determined. This is done by
performing a query on the IN that returns the total amount of EVD airtime currently
loaded onto the IN and which has not yet been loaded onto client mobile handsets.
Again, in this case, the information regarding EVD airtime still in distribution has to
be collected from all network outlets and subtracted from the total reported through
the query on the IN.
VTU airtime
20
VTU airtime is queried from the IN as airtime on specialized SIM cards obtained
from the mobile phone network by dealers responsible for the resale of the VTU
airtime. The value consists of airtime purchased directly from the network and
airtime allocated to dealer VTU accounts, earned as commissions due to the resale of
VTU airtime. Unlike physical voucher and EVD airtime, we do not have to adjust
anything and can use the exact value as reported by the IN.
Unused SIM card airtime
Unused SIM card airtime is the total amount of airtime associated with all SIM cards
that have been loaded onto the IN. However, we need to subtract from this total the
total amount of airtime that is still in the mobile phone network's distribution chain.
To determine the total amount of airtime in the network's distribution chain, a stock
count of all SIM cards needs to be performed and it has to be done at all network
outlets country wide and at the same time that the IN is queried, or at least before the
network outlets open their doors for trade the following day.
Besides unused airtime, we also have to consider airtime which has already been sold
and loaded onto the clients’ mobile handsets, but which has yet to be consumed.
Airtime remaining IN
Airtime remaining IN is simply the total amount of airtime remaining on all clients’
accounts as represented by the IN. It may be queried from the IN at any given point
in time, but for the value to be effective in its use for calculating deferred revenue it
has to be queried from the IN at the same point in time as unused airtime. If queried
later or earlier, there would be duplication of airtime accounted for twice and
recorded on both ends of the scale.
21
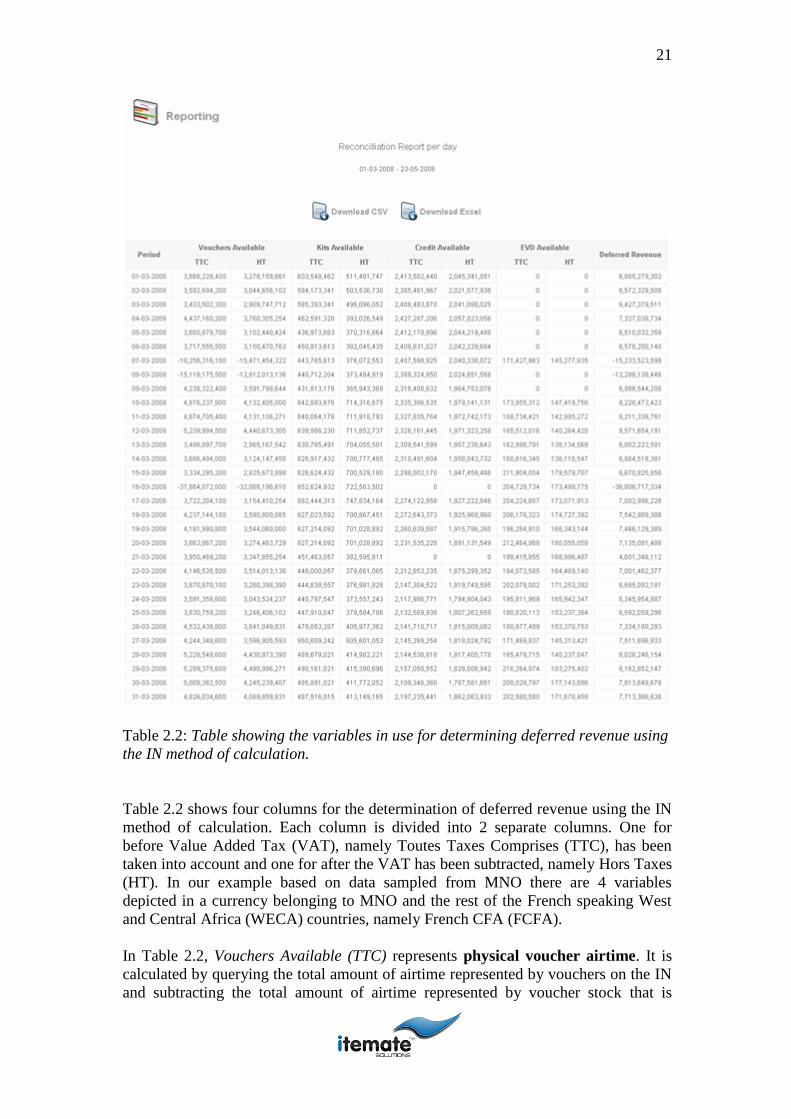
Table 2.2: Table showing the variables in use for determining deferred revenue using
the IN method of calculation.
Table 2.2 shows four columns for the determination of deferred revenue using the IN
method of calculation. Each column is divided into 2 separate columns. One for
before Value Added Tax (VAT), namely Toutes Taxes Comprises (TTC), has been
taken into account and one for after the VAT has been subtracted, namely Hors Taxes
(HT). In our example based on data sampled from MNO there are 4 variables
depicted in a currency belonging to MNO and the rest of the French speaking West
and Central Africa (WECA) countries, namely French CFA (FCFA).
In Table 2.2, Vouchers Available (TTC) represents physical voucher airtime. It is
calculated by querying the total amount of airtime represented by vouchers on the IN
and subtracting the total amount of airtime represented by voucher stock that is
22
retained in MNO warehouses. Therefore rendering the resulting answer, the total
amount of airtime that is currently in distribution, represented by physical vouchers
sold by MNO, but still not loaded onto clients’ accounts. The HT value for the same
variable, namely Vouchers Available, is calculated as follows.
HT TTCTTC18%
With 18% being the effective VAT rate in Cote d’Ivoire at the time of writing this
thesis.
Similarly Kits Available (TTC) represents unused SIM card airtime. It is calculated
by querying the total amount of airtime represented by SIM cards on the IN and
subtracting the total amount of airtime represented by SIM card stock that is retained
in MNO warehouses. Therefore rendering the resulting answer, the total amount of
airtime that is currently in distribution and loaded onto SIM cards, sold by MNO, but
still not activated onto clients’ accounts. The HT value for the same variable, namely
Kits Available, is the same as above.
HT TTCTTC18%
EVD Available (TTC) represents the total amount of EVD airtime and VTU airtime
that has been sent into distribution, but not loaded onto any client’s account and again
we have to subtract whatever EVD airtime is still in MNO possession.
HT TTCTTC18%
Credit Available or airtime remaining IN is however a relatively easy value to get
hold of and this is simply all of the airtime that is currently loaded onto clients’
accounts, but that has still not been consumed by the total subscriber market
belonging to MNO .
The Deferred Revenue row totals in Table 2.2 reflects deferred revenue per day and
contained in the last column of Table 2.2 is the summed result of the four variables
during each period made mention of above. The deferred revenue is representative of
the TTC value and VAT still has to be taken into account, before this value can be
compared with the value obtained from any other method for the calculation of
deferred revenue.
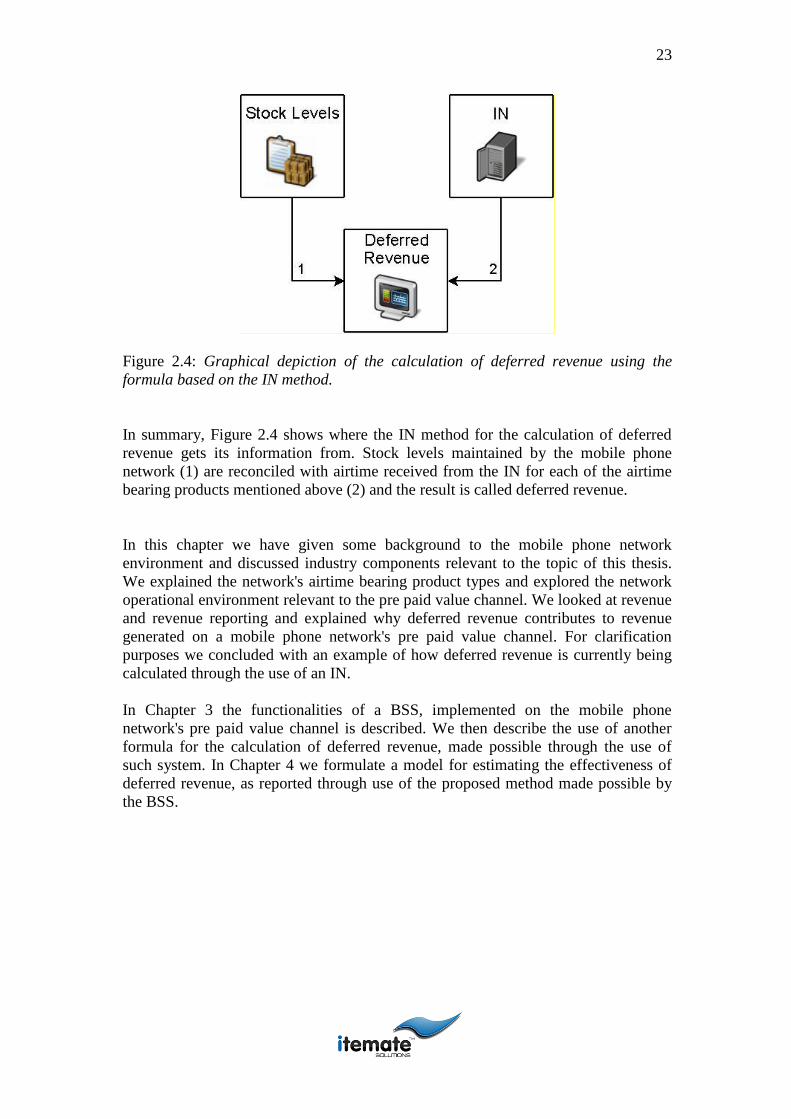
23
Figure 2.4: Graphical depiction of the calculation of deferred revenue using the
formula based on the IN method.
In summary, Figure 2.4 shows where the IN method for the calculation of deferred
revenue gets its information from. Stock levels maintained by the mobile phone
network (1) are reconciled with airtime received from the IN for each of the airtime
bearing products mentioned above (2) and the result is called deferred revenue.
In this chapter we have given some background to the mobile phone network
environment and discussed industry components relevant to the topic of this thesis.
We explained the network's airtime bearing product types and explored the network
operational environment relevant to the pre paid value channel. We looked at revenue
and revenue reporting and explained why deferred revenue contributes to revenue
generated on a mobile phone network's pre paid value channel. For clarification
purposes we concluded with an example of how deferred revenue is currently being
calculated through the use of an IN.
In Chapter 3 the functionalities of a BSS, implemented on the mobile phone
network's pre paid value channel is described. We then describe the use of another
formula for the calculation of deferred revenue, made possible through the use of
such system. In Chapter 4 we formulate a model for estimating the effectiveness of
deferred revenue, as reported through use of the proposed method made possible by
the BSS.
24
Chapter 3
3. A new BSS
Before introducing the proposed method for the calculation of deferred revenue, an
explanation of the BSS used for the calculation of this new method is justified. We
are only able to derive at the proposed method through the implementation of the
BSS. The system is particularly modularized and it automates most of the processes
involved in the calculation of deferred revenue. Specific focus is placed on the
automated delivery of key variables used in the new formula and human and manual
process interventions are minimised, to keep the report generation process as clean
and simple as possible.
Once each of the modules contained within the BSS have been explained, a
breakdown of the components for deferred revenue is revisited, but with specific
reference to the proposed method for the calculation thereof. In Chapter 4 we will
proceed with an estimation of the effectiveness of both methods available for the
calculation of deferred revenue.
3.1 BSS functionality
BSS have been known for their capabilities to outperform all human driven
operational processes where the following functional requirements are present [14]:
High volume data processing
High speed transacting
Accuracy of information
Repetitive transactions similar in nature
The following features make BSS an attractive alternative to human driven
operational processes [14]:
Increased availability: Data is available on any hardware and readily so.
Reduced cost: The cost of providing data per user is greatly lowered.
Reduced danger: BSS can be used in environments that are potentially
hazardous for a human.
Permanence: The information is permanent. Unlike human information and
expertise, BSS information will last indefinitely.
Multiple expertise: The knowledge and data of multiple human experts can
be made available to work simultaneously and continuously at any time of
day or night.
Increased reliability: The BSS increase confidence that the correct
calculation was made by providing a second opinion to a human calculation.
25
Explanation: The BSS can explicitly explain in detail the reason that led to a
conclusion. A human may be too tired, unwilling, or unable to do this all the
time. This increases the confidence that the correct decision is made.
Fast response: Depending on the software and hardware used, a BSS may
respond faster and be more available than a human.
Steady, unemotional, and complete response at all times: This may be very
important in real-time and emergency situations, when a human expert may
not operate at peak efficiency because of stress or fatigue.
Intelligent database: BSS can be used to access databases in an intelligent
manner.
The two specific modules contained in the BSS that are of interest to us, is a Point of
Sale (POS) module and a warehouse management and order processing module or
Voucher Management System (VMS). These modules are strategically placed within
the mobile phone network's pre paid environment to perform specific, previously
human-driven, functions. Here they collect information from the software and
hardware systems controlling the flow of data throughout. Raw data is collected
directly from the source and data manipulation is done by a set of software
algorithms specifically designed and tested for their accurate computational abilities,
rendering the possibility for error insignificant.
3.1.1 POS module
Through implementation of a POS module, an accurate measure for the sale of
airtime bearing products can be established. For physical products such as airtime
vouchers and EVD, this is done through the unique identification tag (serial number
represented by a bar code) that is attached to the product. For virtual products, such
as VTU, the airtime associated with the sale is derived from the financial value
stipulated on the invoice or credit note, depending on whether airtime is granted to a
client or returned by the client. A POS also records the airtime being returned to the
mobile phone network due to product failure. Other than the normal sale and credit
note functions provided by the POS, it signals the BSS for every transaction that
takes place. The BSS, on receipt of a signal from the POS module, records the airtime
value associated with the specific transaction being signalled. It then adjusts the total
amount of airtime allocated to the market up until that point in time.
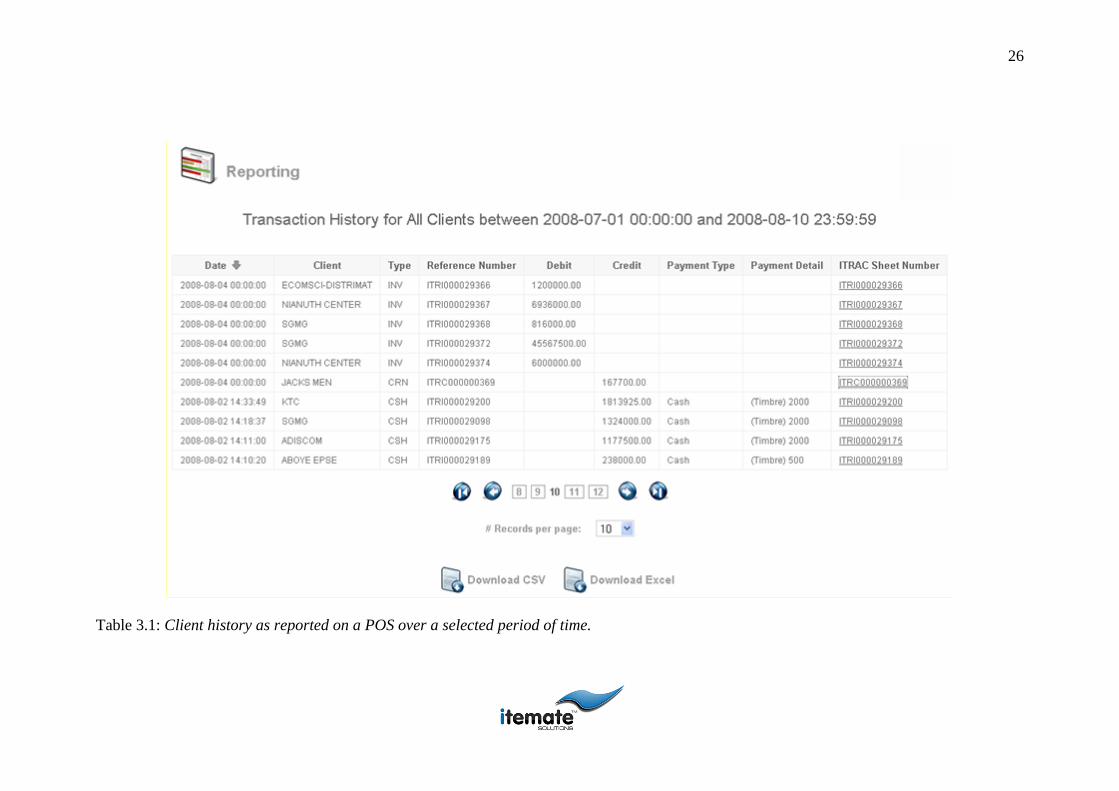
26
Table 3.1: Client history as reported on a POS over a selected period of time.
27
In Table 3.1 it can be seen that the sale associated with invoice ITRI000029374 which
constituted a sale to a client by the name of Nianuth Centre on 04-08-2008 would
have increased the airtime allocated for this day with 6 000 000 FCFA for MNO.
Similarly the stock returned in association with credit note ITRC000000369 would
have decreased the airtime allocated for this day by 167 700 FCFA for MNO .
The POS therefore provides us with an accurate measure of the exact amount of
airtime that has entered the market over a period of time. For the information
recorded at the POS to be relevant for use in the calculation of deferred revenue using
the proposed method a number of factors need to be present:
The POS needs to report on the airtime value associated with a sale and/or
stock returned (credit note), taking into account bonus airtime associated with
a product, but excluding commissions associated with the transaction.
For accuracy of the transaction, it is advised to make use of a serialized sales
model, whereby every item contains a bar code, linking it to a product record
containing the necessary airtime and bonus information.
The airtime value and bonus airtime associated with a specific product needs
to be kept up to date with the selling price of that product.
Besides the factors mentioned above, it would be helpful if the POS module (but this
would also be the case with the VMS, or any other module) is in direct
communication with the BSS processing kernel so that the flow of information is
automated. This speeds up the delivery of final reports and prevents manual
intervention with the potential of causing data discrepancies.
3.1.2 VMS module
Similar to the serialized tracking of vouchers at the POS, the VMS has specific
functions that make it the ideal system to retrieve information for the automated
reporting of deferred revenue using the proposed method for the calculation thereof.
The functions we are most interested in are mainly focussed on interaction the VMS
has with the IN. We address two functional areas of the VMS that are necessary for
the calculation of deferred revenue using the proposed method.
IN updates performed by the VMS
The VMS controls the manipulation of airtime bearing products on the IN. If those
products are physical (i.e. have serial numbers) the VMS would simply perform the
activation or deactivation of the products on the IN, based on whether stock is being
invoiced or credit noted. It also allocates the correct bonus airtime to the IN based on
a product sale, or minimises the IN airtime value if a product is being returned to the
mobile phone network.
28
If the product being transacted on is not physical by nature (i.e. VTU), the VMS
updates the client's account directly when a sale occurs, or decreases the client's
account when a credit note occurs, always to the exact airtime value associated with
the transaction taking place at the POS. The reason for us expressing such keen
interest in the quantification of airtime on the IN is relevant for one reason only. In
the next step, we rely on the VMS to calculate the airtime usage on its own account
and it would not do our approach good if airtime allocation takes place on the IN and
is not accounted for by the VMS, otherwise we would collect usage information and
not know what to allocate it towards. Similarly, if more airtime is provisioned on the
IN than what is actually transacted over the POS, there would be less usage recorded
than anticipated, skewing the calculations related to the eventual calculation of
deferred revenue.
IN data processed by the VMS
In the second instance we are interested in the VMS's capabilities to parse IN Call
Data Record (CDR) files. The IN produces CDR files at a fixed rate determined by
the initial configuration thereof. The CDR files contain information related to every
single transaction that took place on the IN. Every single time a call is made, or a
SMS is sent, or a voucher is recharged onto a client's account, or any other
transactions that influences the IN in any manner takes place a new entry is recorded
in the CDR files generated by the IN. It can be seen as a continuous output log that
records the details of every transaction that takes place on the IN.
The VMS uses the generated CDR files to calculate the airtime usage that has taken
place for a specific period in time. It reads the CDR file content into a rating engine
and performs rating of specifically identified CDR tags to calculate the total amount
of airtime used by clients for a completed CDR file.
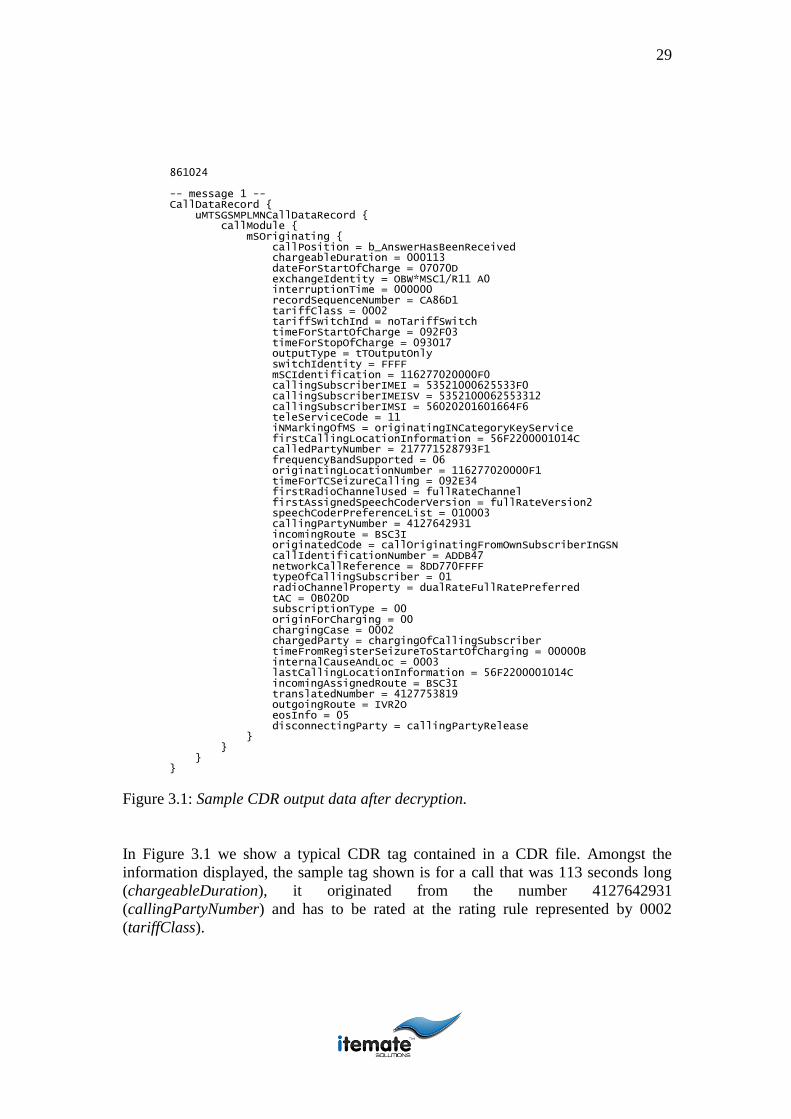
29
861024 -- message 1 -- CallDataRecord { uMTSGSMPLMNCallDataRecord { callModule { mSOriginating { callPosition = b_AnswerHasBeenReceived chargeableDuration = 000113 dateForStartOfCharge = 07070D exchangeIdentity = OBW*MSC1/R11 A0 interruptionTime = 000000 recordSequenceNumber = CA86D1 tariffClass = 0002 tariffSwitchInd = noTariffSwitch timeForStartOfCharge = 092F03 timeForStopOfCharge = 093017 outputType = tTOutputOnly switchIdentity = FFFF mSCIdentification = 116277020000F0 callingSubscriberIMEI = 53521000625533F0 callingSubscriberIMEISV = 5352100062553312 callingSubscriberIMSI = 56020201601664F6 teleServiceCode = 11 iNMarkingOfMS = originatingINCategoryKeyService firstCallingLocationInformation = 56F2200001014C calledPartyNumber = 217771528793F1 frequencyBandSupported = 06 originatingLocationNumber = 116277020000F1 timeForTCSeizureCalling = 092E34 firstRadioChannelUsed = fullRateChannel firstAssignedSpeechCoderVersion = fullRateVersion2 speechCoderPreferenceList = 010003 callingPartyNumber = 4127642931 incomingRoute = BSC3I originatedCode = callOriginatingFromOwnSubscriberInGSN callIdentificationNumber = ADDB47 networkCallReference = 8DD770FFFF typeOfCallingSubscriber = 01 radioChannelProperty = dualRateFullRatePreferred tAC = 0B020D subscriptionType = 00 originForCharging = 00 chargingCase = 0002 chargedParty = chargingOfCallingSubscriber timeFromRegisterSeizureToStartOfCharging = 00000B internalCauseAndLoc = 0003 lastCallingLocationInformation = 56F2200001014C incomingAssignedRoute = BSC3I translatedNumber = 4127753819 outgoingRoute = IVR2O eosInfo = 05 disconnectingParty = callingPartyRelease } } } }
Figure 3.1: Sample CDR output data after decryption.
In Figure 3.1 we show a typical CDR tag contained in a CDR file. Amongst the
information displayed, the sample tag shown is for a call that was 113 seconds long
(chargeableDuration), it originated from the number 4127642931
(callingPartyNumber) and has to be rated at the rating rule represented by 0002
(tariffClass).
30
Collectively the information obtained from the POS and VMS is processed by the
BSS to report on deferred revenue using the proposed method as explained in Section
3.2. which follows.
3.2 Proposed method for the calculation of deferred
revenue
Through the implementation of the BSS modules (POS and VMS) we are able to
collect sufficient information to formulate a new formula for the calculation of
deferred revenue. The modules described in Section 3.1 record information from
specific sources along the pre paid value channel. The proposed method uses the
following variables to calculate deferred revenue:
3.2.1 Sales credit (including bonuses allocated on the sales channel)
Sales credit, as described in Section 3.1.1 is collected by the BSS through the use of a
POS. Movement of the following products affect the sales credit variable:
Physical vouchers
EVD
VTU
SIM cards
Bonuses allocated to clients based on the specific denomination sold
A sale will increase the sales credit variable equal to the amount of airtime being
granted on the sale. A return of products, such as when a credit note is issued, will
decrease the sales credit variable with an amount equal to the airtime associated with
the products being returned. Positive sales credit will increase the deferred revenue
total using this method of calculation. Airtime usage has the opposite effect and
decreases deferred airtime once applied to the proposed method.
3.2.2 Airtime usage (including expiry and deactivation credit)
Airtime usage, as described in Section 3.1.2 is collected by the BSS through the use
of a VMS. Expiry and deactivation credit are both also collected from the IN CDR
files through the use of a VMS, but the information is collected once a month as and
when the checks and balances are performed. Once a month a script will execute on
the IN determining the statuses of clients' accounts. If there has been no activity
(incoming or outgoing traffic to or from a client's mobile handset) for some period of
time (normally determined by the telecommunications regulatory body) a client
account is identified as inactive. The airtime remaining on that account is then
included in the usage variable so that it can decrease the deferred revenue
accordingly, as the airtime is not in circulation any more.

31
Sometimes airtime bearing items, already sold into the market, surpass their validity
date and the products end up expiring before it could be used (loaded onto an
account) by a client. Airtime associated with such occurrence is referred to as expiry
credit. Expiry credit is also included in the airtime usage variable, as it decreases the
deferred revenue (current airtime in circulation).
We now turn our focus to the formula used for calculation of deferred revenue using
the proposed method.
Rdp Sc Au
To determine the deferred revenue closing balance at a specific point in time the
formula needs to be expanded to include a deferred revenue opening balance. Typical
at the start of a mobile phone network life cycle the opening balance is zero.
However, when implementing the formula for the first time within an existing mobile
phone network, an acceptable opening balance needs to be determined. This balance
is typically obtained at the end of a fiscal year as determined by the company external
auditors. Thus we have the following.
Rdb Rd
o Rdp
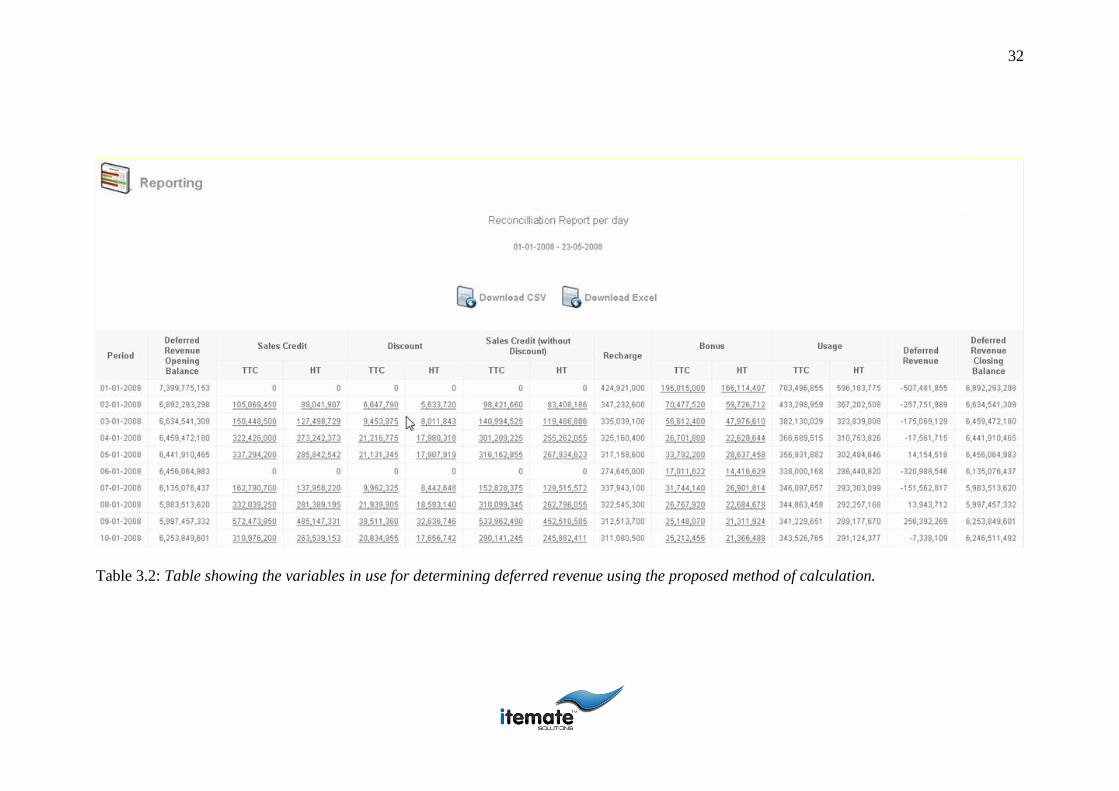
32
Table 3.2: Table showing the variables in use for determining deferred revenue using the proposed method of calculation.
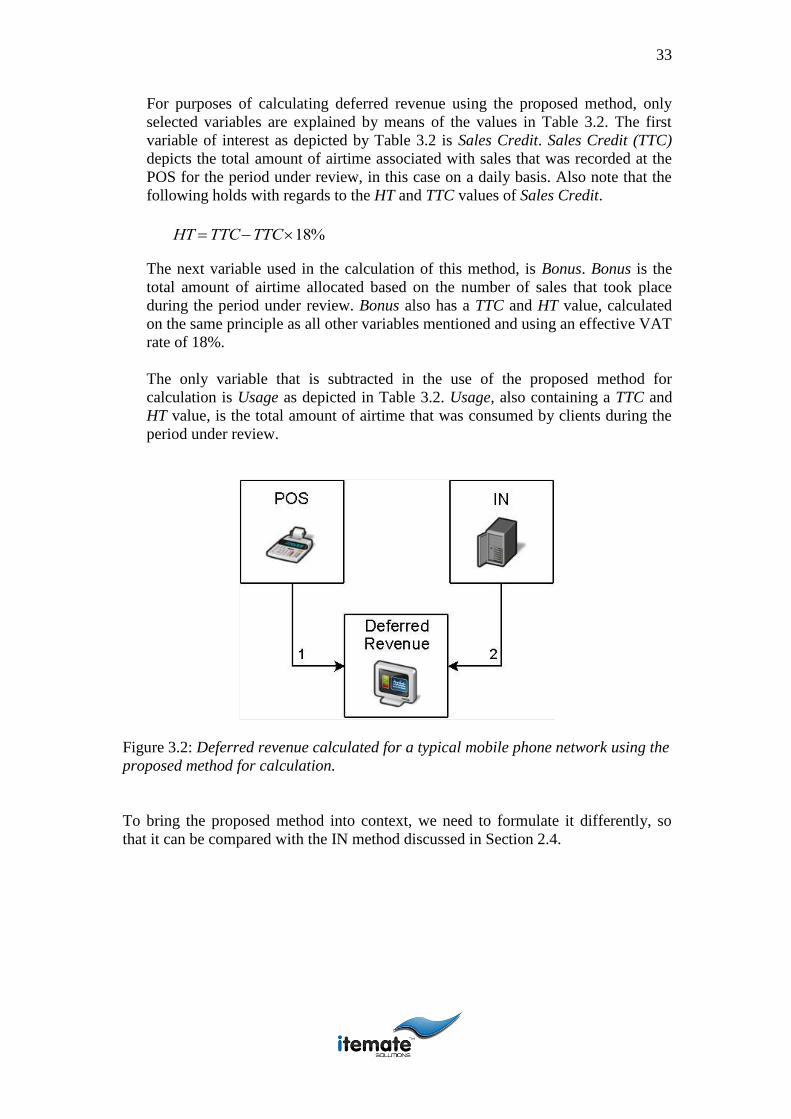
33
For purposes of calculating deferred revenue using the proposed method, only
selected variables are explained by means of the values in Table 3.2. The first
variable of interest as depicted by Table 3.2 is Sales Credit. Sales Credit (TTC)
depicts the total amount of airtime associated with sales that was recorded at the
POS for the period under review, in this case on a daily basis. Also note that the
following holds with regards to the HT and TTC values of Sales Credit.
HT TTCTTC18%
The next variable used in the calculation of this method, is Bonus. Bonus is the
total amount of airtime allocated based on the number of sales that took place
during the period under review. Bonus also has a TTC and HT value, calculated
on the same principle as all other variables mentioned and using an effective VAT
rate of 18%.
The only variable that is subtracted in the use of the proposed method for
calculation is Usage as depicted in Table 3.2. Usage, also containing a TTC and
HT value, is the total amount of airtime that was consumed by clients during the
period under review.
Figure 3.2: Deferred revenue calculated for a typical mobile phone network using the
proposed method for calculation.
To bring the proposed method into context, we need to formulate it differently, so
that it can be compared with the IN method discussed in Section 2.4.
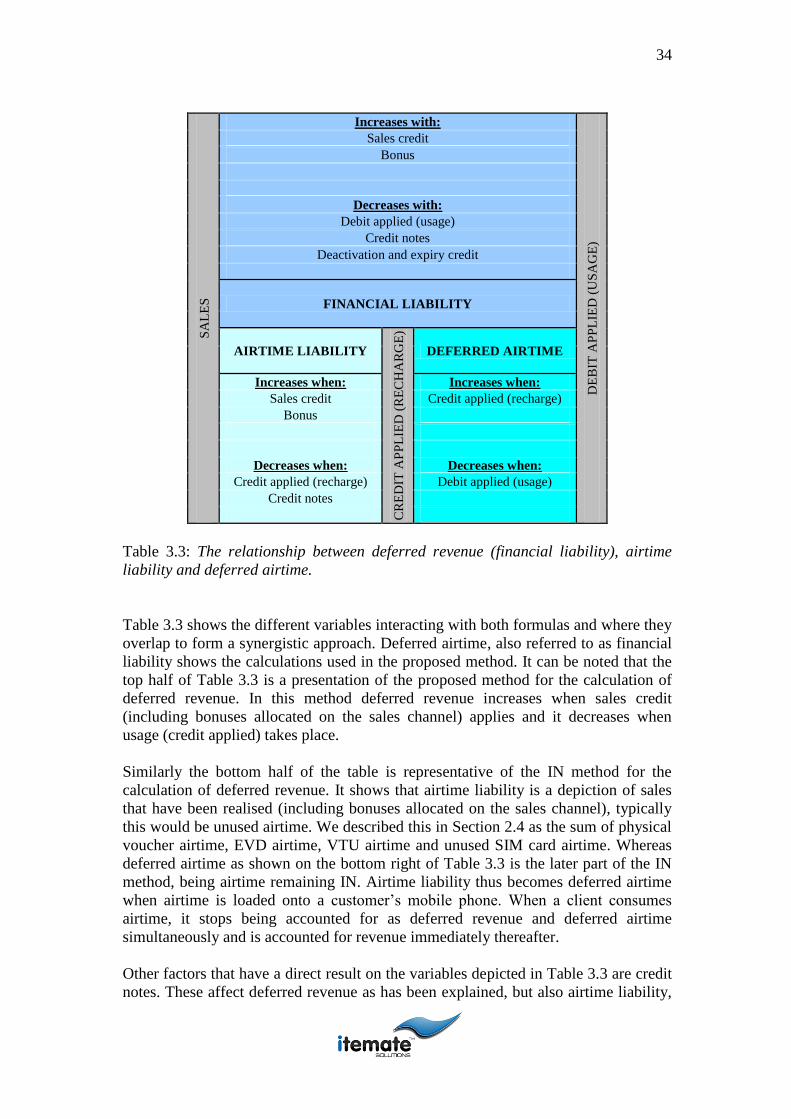
34
SA
LE
S
Increases with:
DE
BIT
AP
PL
IED
(U
SA
GE
)
Sales credit
Bonus
Decreases with:
Debit applied (usage)
Credit notes
Deactivation and expiry credit
FINANCIAL LIABILITY
AIRTIME LIABILITY
CR
ED
IT A
PP
LIE
D (
RE
CH
AR
GE
)
DEFERRED AIRTIME
Increases when: Increases when:
Sales credit Credit applied (recharge)
Bonus
Decreases when: Decreases when:
Credit applied (recharge) Debit applied (usage)
Credit notes
Table 3.3: The relationship between deferred revenue (financial liability), airtime
liability and deferred airtime.
Table 3.3 shows the different variables interacting with both formulas and where they
overlap to form a synergistic approach. Deferred airtime, also referred to as financial
liability shows the calculations used in the proposed method. It can be noted that the
top half of Table 3.3 is a presentation of the proposed method for the calculation of
deferred revenue. In this method deferred revenue increases when sales credit
(including bonuses allocated on the sales channel) applies and it decreases when
usage (credit applied) takes place.
Similarly the bottom half of the table is representative of the IN method for the
calculation of deferred revenue. It shows that airtime liability is a depiction of sales
that have been realised (including bonuses allocated on the sales channel), typically
this would be unused airtime. We described this in Section 2.4 as the sum of physical
voucher airtime, EVD airtime, VTU airtime and unused SIM card airtime. Whereas
deferred airtime as shown on the bottom right of Table 3.3 is the later part of the IN
method, being airtime remaining IN. Airtime liability thus becomes deferred airtime
when airtime is loaded onto a customer’s mobile phone. When a client consumes
airtime, it stops being accounted for as deferred revenue and deferred airtime
simultaneously and is accounted for revenue immediately thereafter.
Other factors that have a direct result on the variables depicted in Table 3.3 are credit
notes. These affect deferred revenue as has been explained, but also airtime liability,
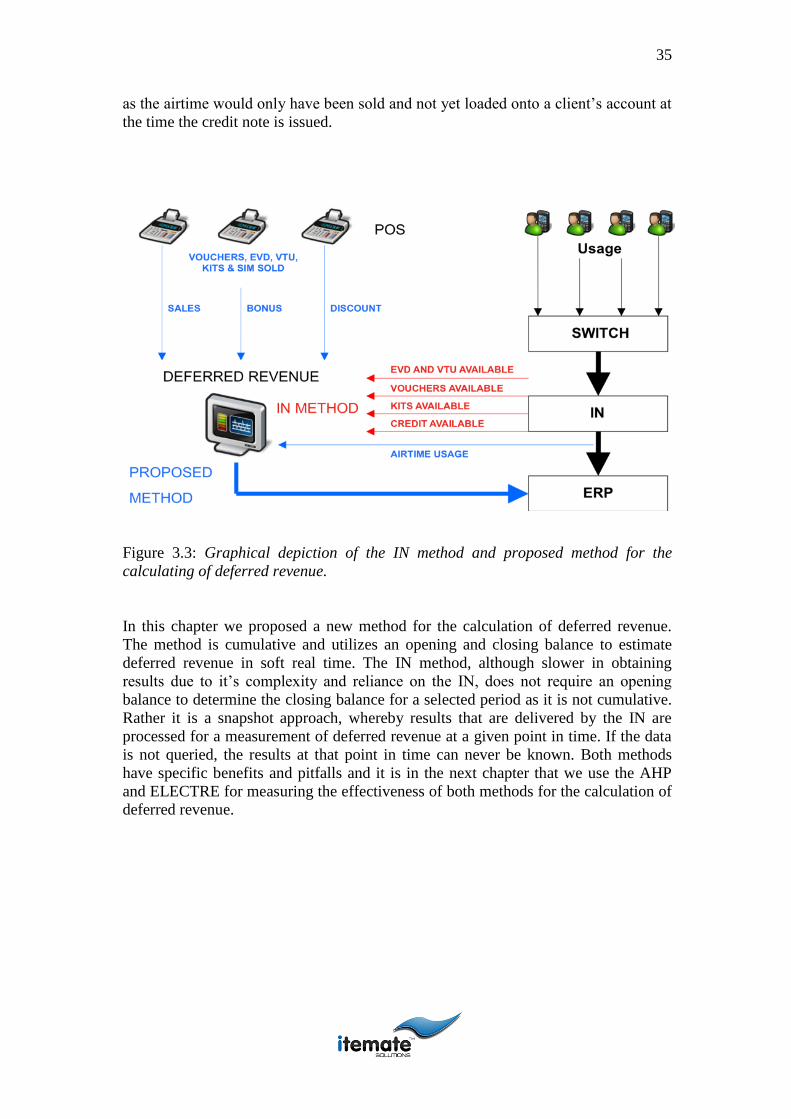
35
as the airtime would only have been sold and not yet loaded onto a client’s account at
the time the credit note is issued.
Figure 3.3: Graphical depiction of the IN method and proposed method for the
calculating of deferred revenue.
In this chapter we proposed a new method for the calculation of deferred revenue.
The method is cumulative and utilizes an opening and closing balance to estimate
deferred revenue in soft real time. The IN method, although slower in obtaining
results due to it’s complexity and reliance on the IN, does not require an opening
balance to determine the closing balance for a selected period as it is not cumulative.
Rather it is a snapshot approach, whereby results that are delivered by the IN are
processed for a measurement of deferred revenue at a given point in time. If the data
is not queried, the results at that point in time can never be known. Both methods
have specific benefits and pitfalls and it is in the next chapter that we use the AHP
and ELECTRE for measuring the effectiveness of both methods for the calculation of
deferred revenue.
36
Chapter 4
4 The model
The AHP is a method for decision formulation and analysis [34]. Developed by
Thomas L. Saaty in the 1970s, it has been extensively studied and refined since then
[42]. The AHP is designed to handle the decision atmosphere in which subjective
judgments are inherent to this decision-making process. Furthermore, the AHP
provides a systematic method for evaluating the importance of each criterion in
relation to the other criteria in a hierarchical manner [35]. The model consists of
using the AHP method to evaluate two methods for the calculation of deferred
revenue. The IN method being the historical method that has been used by mobile
phone networks for the calculation of deferred revenue to date and the proposed
method being the one made possible by the use of a BSS.
We start by making some key assumptions regarding the use of the AHP for
evaluation of the two methods in Section 4.1. The variables and parameters used for
evaluation of the main criteria of our model are identified in Section 4.2. These
criteria are weighted using a pairwise comparison matrix in Section 4.3. In Section
4.4 consistency checking of criteria used in each network department is performed
before we determine the scores of the alternative criteria in Section 4.5. Section 4.6
outlines our findings for determining departmental dependency and consistency with
regards to choosing the criteria. The final scores when using the AHP is analyzed and
our findings, with regards to using this approach, are documented in Section 4.7.
Finally, we introduce ELECTRE as an outranking alternative to AHP in Section 4.8
and then perform sensitivity and robustness analysis on both methods used for the
measurement of effectiveness in the final section of this chapter, namely Section 4.9.
4.1 Assumptions
Before the model for evaluation is discussed a few assumptions have to be made.
These general assumptions enable firstly, the calculation of deferred revenue using
the IN method and proposed method and secondly, the construction of a model which
utilises the AHP for evaluating the two methods.
Pre paid value channel
It is assumed that the mobile phone network has a pre paid value channel through
which the sales of pre paid products are sold into a market for use by the end client. It
is also assumed that the pre paid value channel constitutes a large enough portion of
the mobile phone network subscriber population so that it can contribute significantly
to the generation of revenue. This is the case in all emerging market economies [32]
as was explained in Chapter 1. If the pre paid value channel does not contribute
37
significantly to the generation of revenue, it would not be viable to focus our
attention on this subject matter.
The existence of an IN
It is assumed that an IN exists within the mobile phone network’s systems
architecture which would enable the network to determine deferred revenue using the
IN method as discussed in Section 2.4.
The existence of a POS
It is assumed that a POS delivers accurate sales figures based on actual transactions at
the POS for use in the calculation of deferred revenue using the proposed method.
The existence of a VMS
It is assumed that there exists a VMS that performs IN airtime updates and IN data
processing and that delivers the data that is transacted on to a BSS from where it can
be used for the determination of deferred revenue using the proposed method of
calculation.
Consistency of variables and parameters
There exists a variable or parameter x used in one method for the calculation of
deferred revenue that has an associative variable or parameter y that affects the other
method for the calculation of deferred revenue to a less or more extent than what x
affects the first method of calculation for every incremental or decremented unit of
change in x. It is assumed that if such variable or parameter as x undergoes change
by being assigned a new value, there is an immediate resulting change effect applied
to y such that isolated change of x does not occur, as it would skew the results of one
method for the calculation of deferred revenue as apposed to the other.
4.2 Criteria
For selecting appropriate criteria for evaluation of the two methods used for the
calculation of deferred revenue, MNO Group based in Johannesburg, South Africa
was approached to share their Key Performance Indicators (KPI). These KPI are used
for the evaluation of the subsidiary mobile phone networks in which MNO Group has
a significant stake. Each of these networks is in a different country, but all are within
emerging markets [23]. Of the 361 KPI in use by MNO Group, all are grouped
according to network business units or department, which make them more
manageable when reported on by networks, as key personnel from each department
within a single MNO network only has to report on the KPI assigned to their business
38
unit. Of the 361, also only a few are affected by the results posted after the
calculation of deferred revenue.
We selected one of MNO Group’s subsidiary companies, namely MNO as a target
network for extracting specific quantitative and qualitative variables used in
evaluation of the model criteria. MNO as a subsidiary company of MNO Group was
selected for being the most influential (other than MNO Group’s Nigerian based
operation) network in the WECA region [31]. Furthermore and according to MNO
Group Chief Technical and Information Officer (CTIO), the WECA region is an
important business hub for the rest of Africa. This is due to the fact that the region is
culturally quite diverse, has relatively large populations per representative country
and within the countries MNO Group has operational mobile phone networks, these
networks experience good growth, effectively contributing to a significant portion of
the profits retained through dividend payouts to MNO Group every year [31].
MNO ’s departments are evaluated on a monthly basis and appraised by MNO Group
according to their overall performance based on the KPI submitted by MNO Group
[22]. Within MNO , key personnel from each department were invited to identify KPI
that are affected by deferred revenue. Typically sessions were held with the business
unit owners or department heads, but in certain instances rather with the senior
manager of a specific department, who has more insight into the operational
environment when it comes to system interactions and reported results. The variables
summarized in Table 4.1 were selected to determine the eventual weights assigned to
each criterion used in the evaluation method.
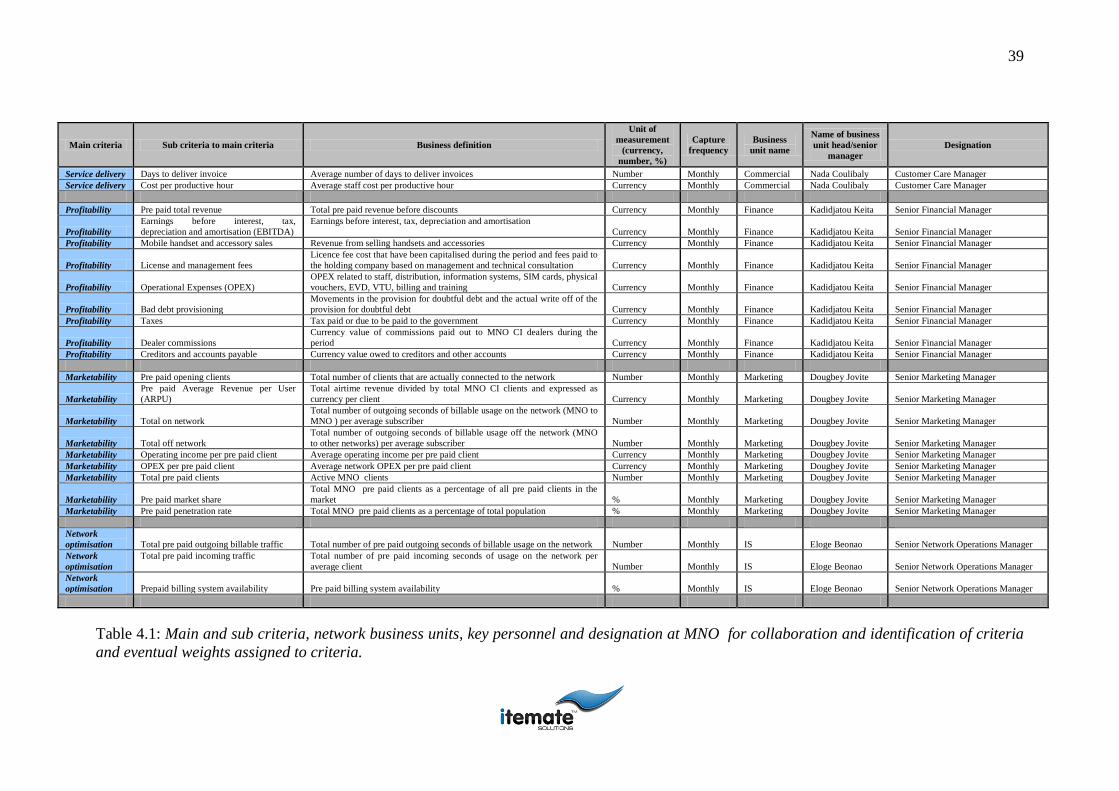
39
Main criteria Sub criteria to main criteria Business definition
Unit of
measurement
(currency,
number, %)
Capture
frequency
Business
unit name
Name of business
unit head/senior
manager
Designation
Service delivery Days to deliver invoice Average number of days to deliver invoices Number Monthly Commercial Nada Coulibaly Customer Care Manager
Service delivery Cost per productive hour Average staff cost per productive hour Currency Monthly Commercial Nada Coulibaly Customer Care Manager
Profitability Pre paid total revenue Total pre paid revenue before discounts Currency Monthly Finance Kadidjatou Keita Senior Financial Manager
Profitability
Earnings before interest, tax,
depreciation and amortisation (EBITDA)
Earnings before interest, tax, depreciation and amortisation
Currency Monthly Finance Kadidjatou Keita Senior Financial Manager
Profitability Mobile handset and accessory sales Revenue from selling handsets and accessories Currency Monthly Finance Kadidjatou Keita Senior Financial Manager
Profitability License and management fees
Licence fee cost that have been capitalised during the period and fees paid to
the holding company based on management and technical consultation Currency Monthly Finance Kadidjatou Keita Senior Financial Manager
Profitability Operational Expenses (OPEX)
OPEX related to staff, distribution, information systems, SIM cards, physical
vouchers, EVD, VTU, billing and training Currency Monthly Finance Kadidjatou Keita Senior Financial Manager
Profitability Bad debt provisioning
Movements in the provision for doubtful debt and the actual write off of the
provision for doubtful debt Currency Monthly Finance Kadidjatou Keita Senior Financial Manager
Profitability Taxes Tax paid or due to be paid to the government Currency Monthly Finance Kadidjatou Keita Senior Financial Manager
Profitability Dealer commissions
Currency value of commissions paid out to MNO CI dealers during the
period Currency Monthly Finance Kadidjatou Keita Senior Financial Manager
Profitability Creditors and accounts payable Currency value owed to creditors and other accounts Currency Monthly Finance Kadidjatou Keita Senior Financial Manager
Marketability Pre paid opening clients Total number of clients that are actually connected to the network Number Monthly Marketing Dougbey Jovite Senior Marketing Manager
Marketability
Pre paid Average Revenue per User
(ARPU)
Total airtime revenue divided by total MNO CI clients and expressed as
currency per client Currency Monthly Marketing Dougbey Jovite Senior Marketing Manager
Marketability Total on network
Total number of outgoing seconds of billable usage on the network (MNO to
MNO ) per average subscriber Number Monthly Marketing Dougbey Jovite Senior Marketing Manager
Marketability Total off network
Total number of outgoing seconds of billable usage off the network (MNO
to other networks) per average subscriber Number Monthly Marketing Dougbey Jovite Senior Marketing Manager
Marketability Operating income per pre paid client Average operating income per pre paid client Currency Monthly Marketing Dougbey Jovite Senior Marketing Manager
Marketability OPEX per pre paid client Average network OPEX per pre paid client Currency Monthly Marketing Dougbey Jovite Senior Marketing Manager
Marketability Total pre paid clients Active MNO clients Number Monthly Marketing Dougbey Jovite Senior Marketing Manager
Marketability Pre paid market share
Total MNO pre paid clients as a percentage of all pre paid clients in the
market % Monthly Marketing Dougbey Jovite Senior Marketing Manager
Marketability Pre paid penetration rate Total MNO pre paid clients as a percentage of total population % Monthly Marketing Dougbey Jovite Senior Marketing Manager
Network
optimisation Total pre paid outgoing billable traffic Total number of pre paid outgoing seconds of billable usage on the network Number Monthly IS Eloge Beonao Senior Network Operations Manager
Network
optimisation
Total pre paid incoming traffic
Total number of pre paid incoming seconds of usage on the network per
average client Number Monthly IS Eloge Beonao Senior Network Operations Manager
Network
optimisation Prepaid billing system availability Pre paid billing system availability % Monthly IS Eloge Beonao Senior Network Operations Manager
Table 4.1: Main and sub criteria, network business units, key personnel and designation at MNO for collaboration and identification of criteria
and eventual weights assigned to criteria.

40
Table 4.1 shows the main objectives and variables used in the model. The overall
result of each department identified within MNO is seen as a main objective and we
refer to these as the main criteria for our model. There exists within each of the main
criterion, variables referred to as sub criteria represented by the variable KPI’s
identified by the key personnel in that business unit. Each criterion, whether a main
criterion or a sub criterion to a main criterion has to be carefully considered for its
use in the model to determine (1) whether it is impacted on by deferred revenue, (2) if
that impact is relevant to the method used for calculation purposes and (3) to avoid
duplication with other criteria in the same set, which can lead to double counting and
skewing of the results [41].
Since mobile phone networks structure their organizations around the four core
departments, namely that of commercial, finance, marketing and Information
Systems (IS), this should suffice as enough reason to use these business units as
representative of the four main criteria. However, below we give an explanation of
how the specific sub criteria represented in the final selection for each main criterion
was selected for its’ absolute involvement by the department heads representing each
of the main criteria. This was done with the help of an expert, so that each of the sub
criteria is representative of a consistent decision-making process within that
department and contributes to the consistency of the main criteria without failure.
Therefore, we establish that all sub criteria were chosen so that (1) they impact on
deferred revenue, (2) the impact is relevant to the method used for calculation
purposes and (3) duplication with other sub criteria in the same set is avoided.
In Appendix B the complete list of sub criteria available for each department is given.
In applying the three rules we’ve applied for the main criteria, we first filter through
the complete list of available sub criteria for each department to determine if a direct
or indirect effect on deferred revenue is realised. The results are displayed in
Appendix C.
Secondly, we review if the impact of change in the relevant sub criteria is relevant to
the method used for the calculation of deferred revenue. This is done by analysing
changes in deferred revenue, using each method independently of the other, with
changes in each of the specific and remaining sub criteria. Thus, if an impactful
positive change in deferred revenue, always corresponds with a positive change in the
measured sub criteria and this applies for both methods used for the calculation of
deferred revenue, then it is assumed the sub criteria is significant enough to select.
The results of this exercise are exactly the same as the previous step of refinement.
The reason for this is that both methods provide you with a mechanism for measuring
a single variable, namely deferred revenue. Therefore, because all remaining sub
criteria, after removing the sub criteria that do not have a direct or indirect effect on
deferred revenue, automatically applies to both methods for calculation, as both
methods calculate the same thing. We simply want to determine which one is more
effective. The results of this step are also represented in Appendix C.
Lastly, we analyse each of the remaining sub criteria shown in Appendix C to
determine if duplication could be present. If duplication exists with other remaining
sub criteria, it is removed from the list. In this exercise it is particularly interesting to
look at the impact of sub criteria that, as identified in the first step above, has an
41
indirect effect on deferred revenue. As an indirect effect so often affects another sub
criterion that has a direct effect. The results are once again shown in the appendices,
this time Appendix E, but this is also the final list as obtained and shown in Table
4.1. We now turn our attention to the outcome of our selection process by motivating
why the specific sub criteria were chosen to represent the main criteria in each
instance. In summary, we included criteria that are affected by the two methods used
in the evaluation process. This could either be a direct influence, and the influence of
using one method for the calculation of deferred revenue as opposed to the other can
be measured. Or the influence could be indirect, where the method used for
calculation of deferred revenue impacts on the KPI/sub criteria under review through
another KPI or through a process of KPI and/or other measurements. In all cases the
sub criteria under review, will have some sort of impact being caused by the method
used for calculation of deferred revenue.
4.2.1 Serviceability
The serviceability main criterion is representative of the commercial department
within MNO . Networks find themselves in the service industry and servicing their
clients’ needs should come first. Lack of proper client services will see clients turn to
competitors offering better service delivery. This is not only in the way that networks
handle their clients’ concerns, but also through the delivery of network coverage, call
quality, availability of Value Added Services (VAS) and all other factors related to
the delivery of the network product. The following sub criteria were selected to
represent this main criterion and for the reasons given.
Days to deliver invoice
There exists a direct relationship between the paper trail, representing the efficiency
of the sales process, and sales dealer payments made. This has a direct effect on
deferred revenue, as sales made to sales dealers put large amounts of airtime in the
field and the money for that airtime needs to be received, before it can be effectively
included in the calculation process. Sometimes, money is still not received and the
airtime sold is already being used. This skews deferred revenue tremendously. In
reality it is not deferred revenue until the money for the service has been received.
Furthermore, the method used for the calculation of deferred revenue has a direct
impact on the speed and efficiency of the paper trail in place, which is most often
presented in the form of a KPI as the number of days to deliver an invoice.
Cost per productive hour
The network cost for each productive hour delivered is representative of all the
factors contributing to service delivery. By including this single sub criterion all other
financial KPI, handled as sub criteria, has to be excluded for the serviceability main
criterion as it will lead to double counting. The cost per productive hour is directly
influenced by the method used for the calculation of deferred revenue.
42
4.2.2 Profitability
The profitability criterion is representative of the finance department within MNO CI.
Without profit there would be no company. It is understandable that all new
companies take some time before delivering a return on initial investment, but with a
well established network, shareholders will only invest if profit and in turn healthy
dividends are realised. The following sub criteria were selected to represent this main
criterion and for the reasons given.
Pre paid total revenue
Pre paid total revenue is representative of the sales made of airtime within the pre
paid market sector. Sales have a direct impact on deferred revenue, but only sales
made within the pre paid environment. As explained earlier, revenues from post paid
products do not have an effect on deferred revenue at all. Pre paid total revenue is
affected by the systems in place to realise the revenue, so it is an important sub
criterion for evaluation of the method used for calculation of deferred revenue.
Earnings Before Interest, Depreciation, Tax and Amortisation (EBIDTA)
Good EBIDTA, rather than being a determinant to positive deferred revenue, is the
result thereof. EBIDTA is realised from deferred revenue. As previously explained,
deferred revenue, becomes revenue and EBIDTA after the airtime contained in
deferred revenue has been consumed. We have to be careful of a double count when
considering EBIDTA and pre paid total revenue, but both have been included, as it is
possible to have low EBIDTA, but still high pre paid total revenue, the two are not
directly correlated.
Mobile handset and accessory sales
The sale of handsets and accessories has a double impact on deferred revenue.
Handset sales normally contain a small portion of airtime, but the pre paid total
revenue sub criterion takes care of this direct contributing factor. Rather we include
handset and accessory sales under the profitability list for its indirect impact on
deferred revenue. It is representative of how well the network is performing within
the pre paid environment, as post paid packages normally include mobile handsets
and accessories. A well performing pre paid market will have a positive effect on
deferred revenue.
License and management fees
These fees are a reflection of the amount of energy, in monetary terms, spent on the
promotion of systems and processes that better overall performance within the
network. Bettered performance contributes positively to deferred revenue and the
43
calculation thereof. Furthermore, different methods used also contribute different
amounts of license and management fees to the grand total.
Operational Expenses (OPEX)
Other than license and management fees, OPEX represents expenditure on products
used in the generation of income/revenue. Positive OPEX is a good sign that it is
going well with the network and that more positive deferred revenue is to be realised.
On the other side of the coin is whether overall OPEX increases or decreases due to
the impact the method for calculation of deferred revenue has on operational stock
items.
Bad debt provisioning
Provisions for bad debt is never a good thing. Bad debt provisioning has a very
negative impact on deferred revenue and if more bad debt is being provisioned, it
means sales dealers have problems paying and that it is not going well with the
control of processes impacting on deferred revenue. An effective system for the
calculation of deferred revenue should also control bad debts and minimise bad debt
write-offs.
Taxes
Deferred revenue and the calculation thereof have a critical impact on taxes. Taxes is
therefore an extremely good measurement tool to determine if the system calculating
deferred revenue is doing a good job at it. Income tax for example is only charged on
the realisation of revenue. While money for services has been received, but that
service has not yet been rendered, the income is seen as deferred revenue and non
taxable. It becomes taxable once the service has been rendered and deferred revenue
becomes revenue. Taxes are also representative of deferred tax, it is realised more or
less the same way that deferred revenue is realised.
Dealer commissions
Low dealer commissions and increased sales is a determinant of how good the
product is. A bettered product is the result of a bettered organisation and the
efficiency of the processes within that organisation, such as the systems impacting the
calculation of deferred revenue.
Creditors and accounts payable
Large creditors’ accounts are money that still needs to be received. This is a direct
result of payment processes not being managed efficiently. More efficient
management of the internal payment processes will result in acceptable creditor
44
balances. As mentioned before, money needs to be received before it can be seen as
deferred revenue.
4.2.3 Marketability
The marketing department is fundamental to the success of any network. Without
products being properly marketed, a mobile phone network will not succeed in the
highly competitive telecommunications industry. A network has to be marketable to
attain market share. Therefore to retain clientele as well as gain new clients through
continuous growth, effective marketing strategies need to be implemented. Marketing
is one of the most difficult criterion to benchmark, as it is difficult to quantify
marketing expenditure. Through marketability we refer to the network’s capability to
effectively launch new services and pricing strategies into an ever changing
telecommunications environment. The following sub criteria were selected to
represent this main criterion and for the reasons given.
Pre paid opening clients
Well performing networks have a large number of clients and in emerging markets
that means a large number of pre paid clients. We are also only concerned with the
pre paid market sector as has already been explained.
Average Revenue Per User (ARPU)
A high ARPU means clients are showing increased spending patterns. This is a result
of satisfied clients and bettered economic conditions. A high ARPU also results in
high deferred revenues, leading to high revenues.
Total on network
This represents the total amount of network traffic generated on MNO ’s network and
their network only. Again here we find that successful systems and processes leads to
positive on network traffic, a result that things are working out for the mobile phone
network.
Total off network
This represents the total amount of network traffic generated from MNO ’s network,
elsewhere. This could be international calls, calls to fixed line operators or calls made
to other mobile phone networks. Traffic is either on net or off net. Both are directly
affected by bettered systems processes, but at different sides of the spectrum.
Operating income per pre paid client
45
This is a reflection of income received from operations that affect the pre paid
subscribers/clients. Therefore an indication of how well marketing is performing and
how good the tools, that allow them to accomplish this, are.
OPEX per pre paid client
We’ve already discussed OPEX under the profitability main criterion. OPEX per pre
paid client, is an indication of how marketable the mobile phone network is.
Total pre paid clients
A collective indication of where the mobile phone network is going and how efficient
they are in what they do within the pre paid market environment.
Pre paid market share
Pre paid market share gives the mobile phone network an indication of how well he is
performing in comparison to his competitors in country. Sometimes competitors are
also doing well. This is normally due to positive environmental factors contributing
to good growth. Other times mobile phone networks outgrow their competitors, this
is normally an indication of a mobile phone network being more effective and
efficient than its competitors and vice versa.
Pre paid penetration rate
A country’s penetration rate is an indication of how much further a network can
grow. If the penetration rate is high, there is not much more growth opportunity left
in that country and mobile phone networks should start focussing on acquiring
additional subscribers/clients from their competitors. Subscribers moving from one
network to another are normally referred to as churning. When a lot of churning is
taking place as a result of a high penetration rate, this means the network is doing
something wrong with regards to its service delivery.
4.2.4 Network optimisation
Last, but not least, of the four criteria is network optimisation. The network
optimisation criterion is represented within MNO , by the business intelligence
department, networking department, infrastructure department and one or two other
smaller business units, all within the department collectively known as the IS
department. It is required that networks manage their infrastructure in such a way as
to optimise the use thereof. It would be senseless and a waste of good resources and
money if a network does not grow with its clientele. Just as the network should not be
46
over geared, it should not be under geared either. The following sub criteria were
selected to represent this main criterion and for the reasons given.
Total outgoing billable traffic pre paid
Although traffic volumes have already been discussed to great length with regards to
the previous main criterion, that of marketability, we specifically look at billable
traffic in this instance. Billable traffic is a result of positive mobile phone network
management and the use of tools that help the network in obtaining it.
Total pre paid incoming traffic
Incoming traffic is a result of calls originating somewhere else. Mobile phone
networks charge each other a fee for terminating the other’s calls on its network. The
more incoming traffic a mobile phone network has, the better it is for revenues and
the wellbeing of the organisation. Calls can also only be terminated, if a positive
network environment exists.
Billing system availability (retail pre paid)
The availability of the billing system is probably one of the most impactful sub
criteria mentioned here. So many factors depend on a healthy billing system. Rating,
charging and payments to mention but a few. The billing system is the heart of any
mobile phone network’s environment without which the mobile phone network
cannot make money. The availability of the pre paid billing system is also respected
and a lighter load is imposed on an efficient system used for the calculation of
deferred revenue.
There exist a causal relationship between each main criterion and the remaining other
three. Without marketability, there can be no profitability. Without network
optimization, there can be no serviceability and so forth.
4.3 Obtaining synthesis values for criteria
Now that we’ve defined and given the criteria for use in the model, we have to assign
weights to each of the criteria. As there are sub criteria involved which influences the
main criteria, we will first do the weighting of the sub criteria, then the main criteria
then determine the synthesis value of the sub criteria, before continuing with
consistency checking and eventual scoring of available methods.
47
Suppose that there exists n criteria. The key personnel members of each department
started by assigning weights to criteria by constructing an n x n pairwise comparison
matrix. To construct such a matrix we need to first identify a weight scale to use as
interpretation for the comparison of matrix elements. The eventual matrix will be an
indication of how much more important one criterion is to another. For example the
entry in row i and column j of a pairwise comparison matrix A(aij) indicates how
much more important criterion i is than criterion j.
Value of aij Interpretation
1 Criteria i and j are of equal importance
3 Criteria i is weakly more important than criteria j
5 Experience and judgement indicate that criteria i is strongly more
important than criteria j
7 Criteria i is very strongly or demonstrably more important than criteria j
9 Criteria i is absolutely more important than criteria j
2,4,6,8 Intermediate values for the above criteria interpretations
Table 4.2: Interpretation of entries in a pairwise comparison matrix [17].
Weights are assigned to each of the sub criteria in a specific business unit, eventually
listing the sub criteria in each department in order of importance. A key personnel
member, normally a senior manager of the department, of each business unit at MNO
CI did this under the guidance of an expert and the results follow.
CRITERIA MATRIX (A) A1 A2
Days to deliver invoice (A1) 1.0000 3.0000
Cost per productive hour (A2) 0.3333 1.0000
Table 4.3: Pairwise comparison matrix A for serviceability sub criteria.
CRITERIA MATRIX (B) B1 B2 B3 B4 B5 B6 B7 B8 B9
Pre paid total revenue (B1) 1.0000 1.0000 5.0000 7.0000 6.0000 4.0000 7.0000 4.0000 3.0000
EBITDA (B2) 1.0000 1.0000 4.0000 6.0000 5.0000 3.0000 6.0000 3.0000 2.0000
Mobile handset and accessory sales (B3) 0.2000 0.2500 1.0000 2.0000 4.0000 2.0000 4.0000 3.0000 2.0000
License and management fees (B4) 0.1429 0.1667 0.5000 1.0000 1.0000 1.0000 0.5000 3.0000 3.0000
OPEX (B5) 2.0000 1.0000 0.2000 1.0000 1.0000 1.0000 1.0000 1.0000 1.0000
Bad debt provisioning (B6) 0.2500 0.3333 0.5000 1.0000 1.0000 1.0000 1.0000 1.0000 1.0000
Taxes (B7) 0.1429 0.1667 0.2500 2.0000 1.0000 1.0000 1.0000 1.0000 1.0000
Dealer commissions (B8) 0.2500 0.3333 0.3333 0.3333 1.0000 1.0000 1.0000 1.0000 1.0000
Creditors and accounts payable (B9) 0.3333 0.5000 0.5000 0.3333 1.0000 1.0000 1.0000 1.0000 1.0000
Table 4.4: Pairwise comparison matrix B for profitability sub criteria.
CRITERIA MATRIX (C) C1 C2 C3 C4 C5 C6 C7 C8 C9
Pre paid opening clients (C1) 1.0000 0.5000 7.0000 6.0000 0.5000 7.0000 1.0000 1.0000 4.0000
ARPU (C2) 2.0000 1.0000 5.0000 4.0000 1.0000 8.0000 1.0000 4.0000 6.0000
Total on network (C3) 0.1429 0.2000 1.0000 0.2500 5.0000 0.6667 0.3333 0.2500 0.5000
Total off network (C4) 0.1667 0.2500 4.0000 1.0000 0.2000 3.0000 3.0000 3.0000 3.0000
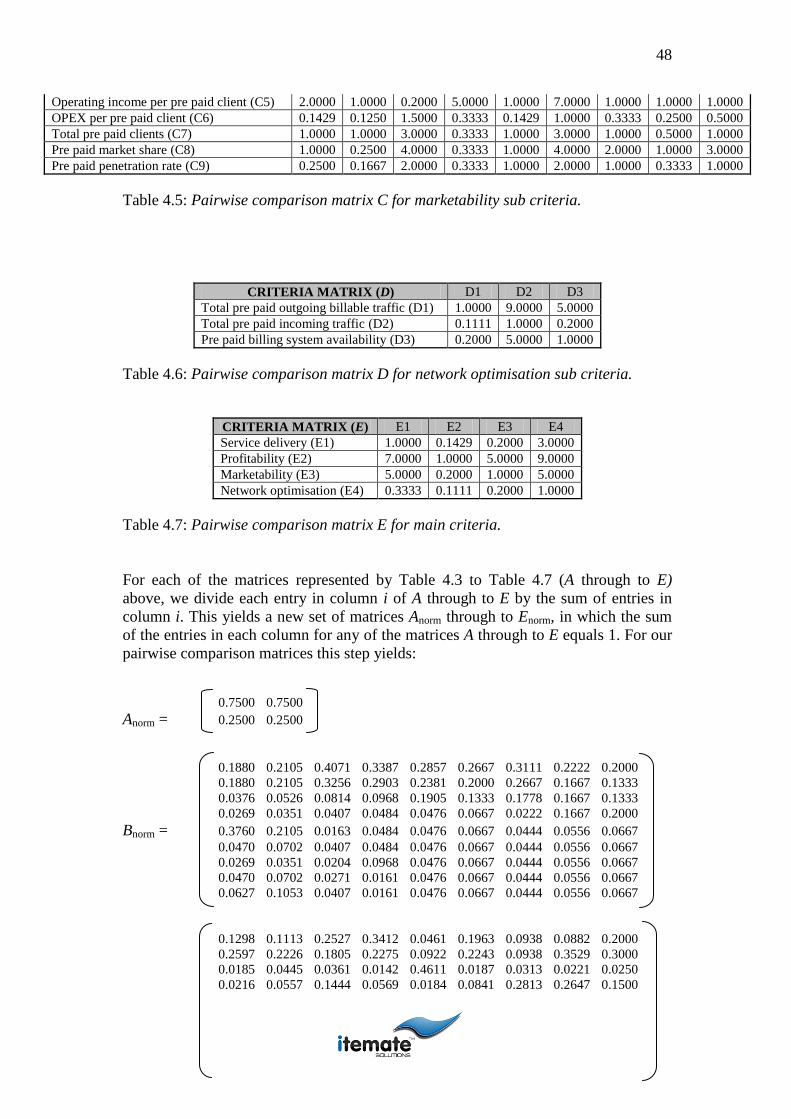
48
Operating income per pre paid client (C5) 2.0000 1.0000 0.2000 5.0000 1.0000 7.0000 1.0000 1.0000 1.0000
OPEX per pre paid client (C6) 0.1429 0.1250 1.5000 0.3333 0.1429 1.0000 0.3333 0.2500 0.5000
Total pre paid clients (C7) 1.0000 1.0000 3.0000 0.3333 1.0000 3.0000 1.0000 0.5000 1.0000
Pre paid market share (C8) 1.0000 0.2500 4.0000 0.3333 1.0000 4.0000 2.0000 1.0000 3.0000
Pre paid penetration rate (C9) 0.2500 0.1667 2.0000 0.3333 1.0000 2.0000 1.0000 0.3333 1.0000
Table 4.5: Pairwise comparison matrix C for marketability sub criteria.
CRITERIA MATRIX (D) D1 D2 D3
Total pre paid outgoing billable traffic (D1) 1.0000 9.0000 5.0000
Total pre paid incoming traffic (D2) 0.1111 1.0000 0.2000
Pre paid billing system availability (D3) 0.2000 5.0000 1.0000
Table 4.6: Pairwise comparison matrix D for network optimisation sub criteria.
CRITERIA MATRIX (E) E1 E2 E3 E4
Service delivery (E1) 1.0000 0.1429 0.2000 3.0000
Profitability (E2) 7.0000 1.0000 5.0000 9.0000
Marketability (E3) 5.0000 0.2000 1.0000 5.0000
Network optimisation (E4) 0.3333 0.1111 0.2000 1.0000
Table 4.7: Pairwise comparison matrix E for main criteria.
For each of the matrices represented by Table 4.3 to Table 4.7 (A through to E)
above, we divide each entry in column i of A through to E by the sum of entries in
column i. This yields a new set of matrices Anorm through to Enorm, in which the sum
of the entries in each column for any of the matrices A through to E equals 1. For our
pairwise comparison matrices this step yields:
0.7500 0.7500
Anorm = 0.2500 0.2500
0.1880 0.2105 0.4071 0.3387 0.2857 0.2667 0.3111 0.2222 0.2000
0.1880 0.2105 0.3256 0.2903 0.2381 0.2000 0.2667 0.1667 0.1333
0.0376 0.0526 0.0814 0.0968 0.1905 0.1333 0.1778 0.1667 0.1333
0.0269 0.0351 0.0407 0.0484 0.0476 0.0667 0.0222 0.1667 0.2000
Bnorm = 0.3760 0.2105 0.0163 0.0484 0.0476 0.0667 0.0444 0.0556 0.0667
0.0470 0.0702 0.0407 0.0484 0.0476 0.0667 0.0444 0.0556 0.0667
0.0269 0.0351 0.0204 0.0968 0.0476 0.0667 0.0444 0.0556 0.0667
0.0470 0.0702 0.0271 0.0161 0.0476 0.0667 0.0444 0.0556 0.0667
0.0627 0.1053 0.0407 0.0161 0.0476 0.0667 0.0444 0.0556 0.0667
0.1298 0.1113 0.2527 0.3412 0.0461 0.1963 0.0938 0.0882 0.2000
0.2597 0.2226 0.1805 0.2275 0.0922 0.2243 0.0938 0.3529 0.3000
0.0185 0.0445 0.0361 0.0142 0.4611 0.0187 0.0313 0.0221 0.0250
0.0216 0.0557 0.1444 0.0569 0.0184 0.0841 0.2813 0.2647 0.1500
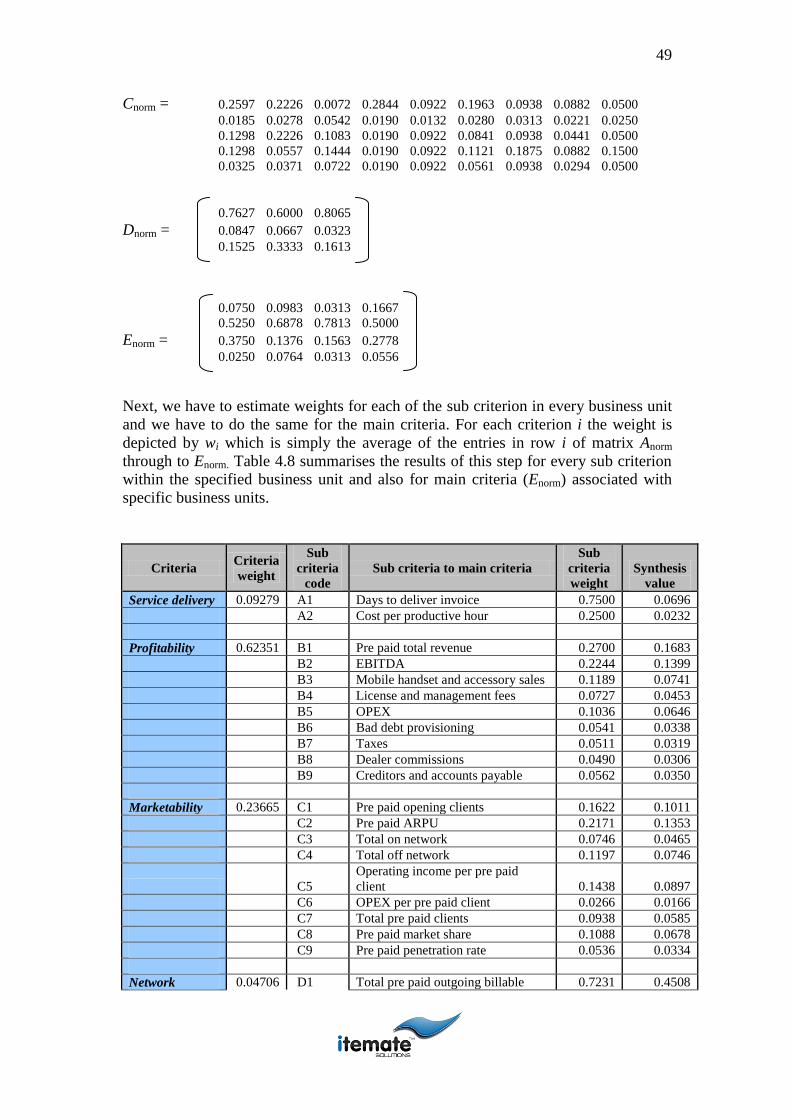
49
Cnorm = 0.2597 0.2226 0.0072 0.2844 0.0922 0.1963 0.0938 0.0882 0.0500
0.0185 0.0278 0.0542 0.0190 0.0132 0.0280 0.0313 0.0221 0.0250
0.1298 0.2226 0.1083 0.0190 0.0922 0.0841 0.0938 0.0441 0.0500
0.1298 0.0557 0.1444 0.0190 0.0922 0.1121 0.1875 0.0882 0.1500
0.0325 0.0371 0.0722 0.0190 0.0922 0.0561 0.0938 0.0294 0.0500
0.7627 0.6000 0.8065
Dnorm = 0.0847 0.0667 0.0323
0.1525 0.3333 0.1613
0.0750 0.0983 0.0313 0.1667
0.5250 0.6878 0.7813 0.5000
Enorm = 0.3750 0.1376 0.1563 0.2778
0.0250 0.0764 0.0313 0.0556
Next, we have to estimate weights for each of the sub criterion in every business unit
and we have to do the same for the main criteria. For each criterion i the weight is
depicted by wi which is simply the average of the entries in row i of matrix Anorm
through to Enorm. Table 4.8 summarises the results of this step for every sub criterion
within the specified business unit and also for main criteria (Enorm) associated with
specific business units.
Criteria Criteria
weight
Sub
criteria
code
Sub criteria to main criteria
Sub
criteria
weight
Synthesis
value
Service delivery 0.09279 A1 Days to deliver invoice 0.7500 0.0696
A2 Cost per productive hour 0.2500 0.0232
Profitability 0.62351 B1 Pre paid total revenue 0.2700 0.1683
B2 EBITDA 0.2244 0.1399
B3 Mobile handset and accessory sales 0.1189 0.0741
B4 License and management fees 0.0727 0.0453
B5 OPEX 0.1036 0.0646
B6 Bad debt provisioning 0.0541 0.0338
B7 Taxes 0.0511 0.0319
B8 Dealer commissions 0.0490 0.0306
B9 Creditors and accounts payable 0.0562 0.0350
Marketability 0.23665 C1 Pre paid opening clients 0.1622 0.1011
C2 Pre paid ARPU 0.2171 0.1353
C3 Total on network 0.0746 0.0465
C4 Total off network 0.1197 0.0746
C5
Operating income per pre paid
client 0.1438 0.0897
C6 OPEX per pre paid client 0.0266 0.0166
C7 Total pre paid clients 0.0938 0.0585
C8 Pre paid market share 0.1088 0.0678
C9 Pre paid penetration rate 0.0536 0.0334
Network 0.04706 D1 Total pre paid outgoing billable 0.7231 0.4508

50
optimisation traffic
D2 Total pre paid incoming traffic 0.0612 0.0382
D3 Pre paid billing system availability 0.2157 0.1345
Table 4.8: Weights assigned to main and sub criteria for calculation of the sub
criteria synthesis values.
4.4 Checking for consistency
Each of the criteria weights has to be checked for consistency to determine if the
various mobile phone operator departments were consistent in their assignment of sub
criteria weights measuring the individual weights up against all other sub criteria in
the same business unit. Finally, the decision-maker’s assignment of weights amongst
the main criteria is checked for consistency by applying the same procedure as
applied for the sub criteria. We check for consistency by using the following four-
step procedure for validation of the decision-maker’s comparisons.
For each matrix A through to E we do the following.
Step 1: Compute AwT where the vector w denotes our estimate of the decision-
maker’s weight as identified in Section 4.3 and wT
is an n-dimensional column vector
of weights.
Matrix Criteria
AwT Aw
T/w
T
A Days to deliver invoice 1.5000 2.0000
A Cost per productive hour 0.5000 2.0000
DwT Dw
T/w
T
B Pre paid total revenue 2.5663 9.5049
B EBITDA 2.1593 9.6243
B Mobile handset and accessory sales 0.9663 8.1280
B License and management fees 0.6084 8.3702
B Operational expenses (OPEX) 1.0762 10.3912
B Bad debt provisioning 0.4898 9.0484
B Taxes 0.4665 9.1264
B Dealer commissions 0.4216 8.5956
B Creditors and accounts payable 0.5013 8.9209
CwT Cw
T/w
T
C Pre paid opening clients 2.1204 13.0760
C Pre paid ARPU 2.4692 11.3758
C Total on network 0.3404 4.5618
C Total off network 1.3501 11.2813
C Operating income per pre paid client 1.6100 11.1945
C OPEX per pre paid client 0.3158 11.8917
C Total pre paid clients 0.9376 9.9991
C Pre paid market share 1.1313 10.4006
C Pre paid penetration rate 0.5158 9.6277

51
DwT Dw
T/w
T
D
Total pre paid outgoing billable
traffic 2.3527 3.2538
D Total pre paid incoming traffic 0.1847 3.0169
D Pre paid billing system availability 0.6665 3.0894
EwT Ew
T/w
T
E Service delivery 0.3704 3.9913
E Profitability 2.8798 4.6187
E Marketability 1.0606 4.4818
E Network optimisation 0.1946 4.1354
Table 4.9: AwT and Aw
T/w
T for each of the criteria matrices A through to E.
Step 2: For each matrix A through to E compute the following:
1
n (ith entry in Aw
T/ith entry in w
T)
Computing for A = 2.0000
Computing for B = 9.0789
Computing for C = 10.3783
Computing for D = 3.1200
Computing for E = 4.3068
Step 3: Compute the consistency index (CI) for each matrix A through to E as
follows:
CI n
n 1
Computing CI for A = 0.0000
Computing CI for B = 0.0099
Computing CI for C = 0.1723
Computing CI for D = 0.0600
Computing CI for E = 0.1023
Criteria (n) Random Index (RI)
2 0.0000
3 0.5800
4 0.9000
5 1.1200
6 1.2400
7 1.3200
8 1.4100
9 1.4500
Table 4.10: Random Index (RI) values for various values of n [17].

52
Step 4: Using Table 4.10, we compare CI to the random index (RI) for the
appropriate value of n.
For a perfectly consistent decision-maker, the ith
entry in AwT = n (i
th entry of w
T).
This implies that a perfectly consistent decision-maker has CI = 0. The values of RI
give the average value of CI if the entries in A through to E were chosen at random
[43]. If CI is sufficiently small, the business units’ decision-makers made
comparisons that are probably consistency enough to give useful estimates of the
weights for his or her objective function. If
CI /RI 0.1 the degree of consistency is
satisfactory, but if
CI /RI 0.1 serious inconsistency may exist, and the AHP may
not yield meaningful results [43].
Matrix CI/RI
A -
B 0.0068
C 0.1189
D 0.1035
E 0.1136
Table 4.11: CI/RI for each matrix in the model.
To give useful estimates of the weights for the decision-maker’s indicator functions it
is necessary we review the following conditions also:
For all i in matrix A through to E, it is necessary that aii = 1. We see that this
is indeed the case.
Furthermore, if aij = k, then for consistency it is necessary that aji = 1/k.
Analysis of A through to E reveals that this condition is satisfied for all
matrices.
Table 4.11 shows CI/RI for each main criterion in the model and by observing the
results we are able to conclude that all above three conditions for consistency are met.
Having all three conditions satisfied, we can progress to Section 4.5 where we find
the score of an alternative for each of the criteria.
4.5 Finding the score of an alternative for a criteria
We need to derive at a score for all criteria used. This section analyses each of the
criteria for the two different methods identified for the calculation of deferred
revenue. We continue by constructing a pairwise comparison matrix for each
criterion in which the rows i and columns j are the two identified methods available
for use in the calculation of deferred revenue. For ease of explanation we will refer to
these here as System 1 (historical or IN method for the calculation of deferred
revenue) and System 2 (proposed method for the calculation of deferred revenue).
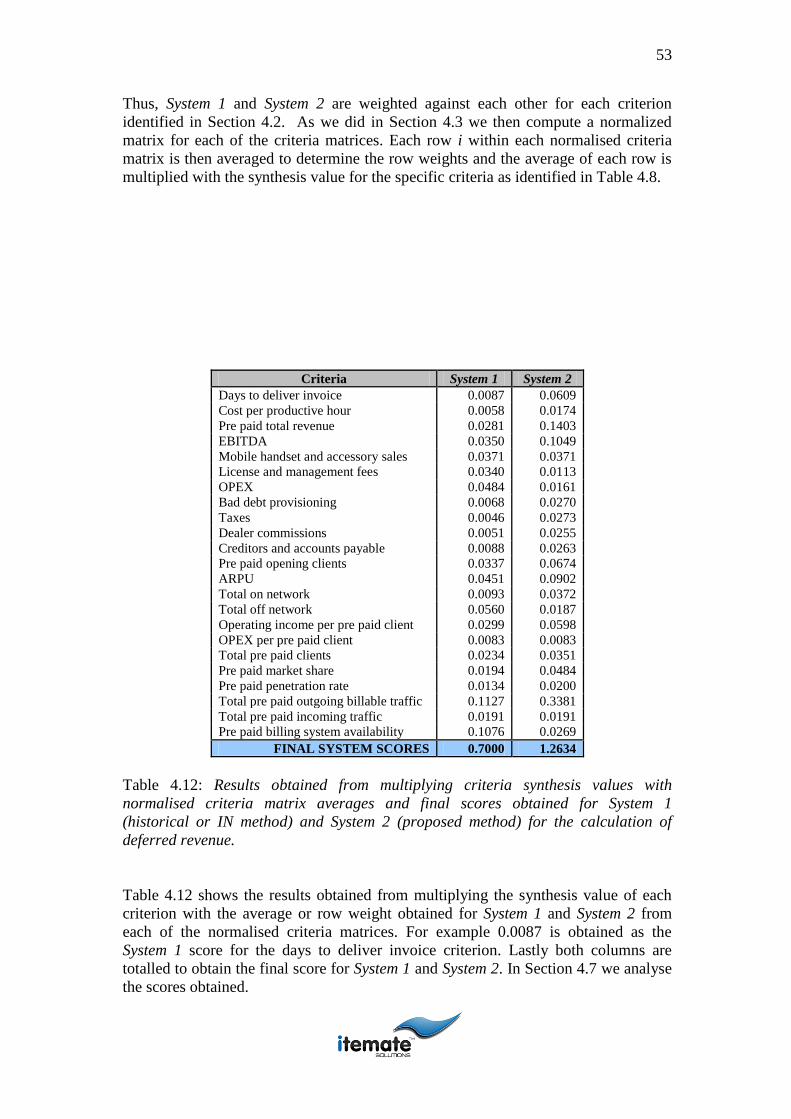
53
Thus, System 1 and System 2 are weighted against each other for each criterion
identified in Section 4.2. As we did in Section 4.3 we then compute a normalized
matrix for each of the criteria matrices. Each row i within each normalised criteria
matrix is then averaged to determine the row weights and the average of each row is
multiplied with the synthesis value for the specific criteria as identified in Table 4.8.
Criteria System 1 System 2
Days to deliver invoice 0.0087 0.0609
Cost per productive hour 0.0058 0.0174
Pre paid total revenue 0.0281 0.1403
EBITDA 0.0350 0.1049
Mobile handset and accessory sales 0.0371 0.0371
License and management fees 0.0340 0.0113
OPEX 0.0484 0.0161
Bad debt provisioning 0.0068 0.0270
Taxes 0.0046 0.0273
Dealer commissions 0.0051 0.0255
Creditors and accounts payable 0.0088 0.0263
Pre paid opening clients 0.0337 0.0674
ARPU 0.0451 0.0902
Total on network 0.0093 0.0372
Total off network 0.0560 0.0187
Operating income per pre paid client 0.0299 0.0598
OPEX per pre paid client 0.0083 0.0083
Total pre paid clients 0.0234 0.0351
Pre paid market share 0.0194 0.0484
Pre paid penetration rate 0.0134 0.0200
Total pre paid outgoing billable traffic 0.1127 0.3381
Total pre paid incoming traffic 0.0191 0.0191
Pre paid billing system availability 0.1076 0.0269
FINAL SYSTEM SCORES 0.7000 1.2634
Table 4.12: Results obtained from multiplying criteria synthesis values with
normalised criteria matrix averages and final scores obtained for System 1
(historical or IN method) and System 2 (proposed method) for the calculation of
deferred revenue.
Table 4.12 shows the results obtained from multiplying the synthesis value of each
criterion with the average or row weight obtained for System 1 and System 2 from
each of the normalised criteria matrices. For example 0.0087 is obtained as the
System 1 score for the days to deliver invoice criterion. Lastly both columns are
totalled to obtain the final score for System 1 and System 2. In Section 4.7 we analyse
the scores obtained.
54
4.6 Departmental dependency and consistency
As opposed to each department under review only weighting the criteria that applies
to its department, to prove the consistency of the model as discussed in this chapter,
each department under review was asked to weight all of the criteria in use. Having
shown that all sub criteria were carefully selected from the list of available KPI used,
to avoid double counting and other issues related to inconsistent input, allowing the
model to be easily skewed, we now turn our focus to an expanded evaluation of the
model. By having each department weight all criteria in use, we substantiate
consistency with regards to the selection process. The next steps portray the obtained
results. For an elaborative data presentation, refer to the digital contents of the
compact disk as explained in Appendix A or reference Appendix E through to
Appendix H for relevant data sets and results obtained.
All sub criteria are loaded into the table and each department is asked to evaluate the
entire set of available sub criteria regardless of what department he/she represents.
Each department weights sub criteria separately, but to find final system scores
representative of the relevant departments doing the reviews, we use the same
weights obtained for the main criteria in order to obtain the synthesis values for each
of the sub criteria. We can do this, because the main criteria were weighted by a
management committee of MNO representatives from each department and their
respective figureheads at MNO Group who represent the wellbeing of MNO Group
stakeholders.
4.6.1 Commercial department (serviceability) weighting
Appendix E shows the pairwise comparison matrix drawn up by the commercial
department at MNO for all 23 sub criteria under review. Also shown in Appendix E
is the normalised matrix of the pairwise comparison matrix for all sub criteria that
were weighted by the commercial department. The normalised matrix entries are
obtained by dividing each entry in column i of the pairwise comparison matrix
obtained from the commercial department by the sum of entries in each column i. The
normalised matrix is validated by assuring that the sum of entries in each column = 1.
The next table in Appendix E shows weights and synthesis values obtained for each
of the sub criteria. Weights are obtained by averaging each row, representing a single
sub criterion, in the normalised matrix. A synthesis value for each sub criteria is
obtained by multiplying the sub criteria weight obtained in the last step with the main
criteria weight previously obtained by averaging each row of Enorm as shown in
Section 4.3. The main criterion weight specific to the sub criteria grouping is used.
The set of sub criteria weights has to be checked for consistency to determine if the
commercial department was consistent in its assignment of sub criteria weights,
measuring the individual weights up against all other sub criteria. Consistency
checking was done according to the steps described in Section 4.4 and CI was
55
calculated as 0.2606. Because of the amount of sub criteria used, it is not possible to
calculate CI/RI, as there does not exist a value for RI when more than 9 elements are
used for calculating CI. To determine consistency we therefore only look to see if CI
is sufficiently small, which it is and whether the following conditions are met:
For all i in the commercial department’s pairwise comparison matrix, it is
necessary that aii = 1. We see that this is indeed the case.
Furthermore, if aij = k, then for consistency it is necessary that aji = 1/k.
Analysis of the pairwise comparison matrix reveals that this condition is also
satisfied.
Being able to conclude that all above three conditions for consistency are satisfied,
we determined a score for each system under review. A pairwise comparison matrix
for each sub criterion in use was drawn up where rows i and columns j are the two
identified methods available for use in the calculation of deferred revenue. For ease
of explanation we will refer to these here as System 1 (historical or IN method for the
calculation of deferred revenue) and System 2 (proposed method for the calculation of
deferred revenue). Thus, System 1 and System 2 are weighted against each other for
each sub criterion. We then compute a normalised matrix for each of the criteria
matrices. Each row i within each normalised criteria matrix is then averaged to
determine the row weights and the average of each row is multiplied with the
synthesis value for the specific criteria as previously calculated. Lastly the rows for
each system under review are summed and the final scores represented accordingly.
The scores obtained are also shown in Appendix E. According to the weighting done
by the commercial department, System 1 scored 0.2186 and System 2 scored 0.3368.
4.6.2 Finance department (profitability) weighting
Appendix F shows the pairwise comparison matrix drawn up by the finance
department at MNO for all 23 sub criteria under review. Also shown in Appendix F
is the normalised matrix of the pairwise comparison matrix for all sub criteria that
were weighted by the finance department. The normalised matrix entries are obtained
by dividing each entry in column i of the pairwise comparison matrix obtained from
the finance department by the sum of entries in each column i. The normalised matrix
is validated by assuring that the sum of entries in each column = 1.
The next table in Appendix F shows weights and synthesis values obtained for each
of the sub criteria. Weights are obtained by averaging each row, representing a single
sub criterion, in the normalised matrix. A synthesis value for each sub criteria is
obtained by multiplying the sub criteria weight obtained in the last step with the main
criteria weight previously obtained by averaging each row of Enorm as shown in
Section 4.3. The main criterion weight specific to the sub criteria grouping is used.
The set of sub criteria weights has to be checked for consistency to determine if the
finance department was consistent in its assignment of sub criteria weights,
measuring the individual weights up against all other sub criteria. Consistency
checking was done according to the steps described in Section 4.4 and CI was
56
calculated as 0.2835. Because of the amount of sub criteria used, it is not possible to
calculate CI/RI, as there does not exist a value for RI when more than 9 elements are
used for calculating CI. To determine consistency we therefore only look to see if CI
is sufficiently small, which it is and whether the following conditions are met:
For all i in the finance department’s pairwise comparison matrix, it is
necessary that aii = 1. We see that this is indeed the case.
Furthermore, if aij = k, then for consistency it is necessary that aji = 1/k.
Analysis of the pairwise comparison matrix reveals that this condition is also
satisfied.
Being able to conclude that all above three conditions for consistency are satisfied,
we determined a score for each system under review. A pairwise comparison matrix
for each sub criterion in use was drawn up where rows i and columns j are the two
identified methods available for use in the calculation of deferred revenue. System 1
and System 2 are weighted against each other for each sub criterion. We then compute
a normalised matrix for each of the criteria matrices. Each row i within each
normalised criteria matrix is then averaged to determine the row weights and the
average of each row is multiplied with the synthesis value for the specific criteria as
previously calculated. Lastly the rows for each system under review are summed and
the final scores represented accordingly. The scores obtained are also shown in
Appendix E. According to the weighting done by the commercial department, System
1 scored 0.2142 and System 2 scored 0.3422.
4.6.3 Marketing department (marketability) weighting
Appendix G shows the pairwise comparison matrix drawn up by the marketing
department at MNO for all 23 sub criteria under review. Also shown in Appendix G
is the normalised matrix of the pairwise comparison matrix for all sub criteria that
were weighted by the marketing department. The normalised matrix entries are
obtained by dividing each entry in column i of the pairwise comparison matrix
obtained from the marketing department by the sum of entries in each column i. The
normalised matrix is validated by assuring that the sum of entries in each column = 1.
The next table in Appendix G shows weights and synthesis values obtained for each
of the sub criteria. Weights are obtained by averaging each row, representing a single
sub criterion, in the normalised matrix. A synthesis value for each sub criteria is
obtained by multiplying the sub criteria weight obtained in the last step with the main
criteria weight previously obtained by averaging each row of Enorm as shown in
Section 4.3. The main criterion weight specific to the sub criteria grouping is used.
The set of sub criteria weights has to be checked for consistency to determine if the
marketing department was consistent in its assignment of sub criteria weights,
measuring the individual weights up against all other sub criteria. Consistency
checking was done according to the steps described in Section 4.4 and CI was
calculated as 0.2768. Because of the amount of sub criteria used, it is not possible to
calculate CI/RI, as there does not exist a value for RI when more than 9 elements are
57
used for calculating CI. To determine consistency we therefore only look to see if CI
is sufficiently small, which it is and whether the following conditions are met:
For all i in the marketing department’s pairwise comparison matrix, it is
necessary that aii = 1. We see that this is indeed the case.
Furthermore, if aij = k, then for consistency it is necessary that aji = 1/k.
Analysis of the pairwise comparison matrix reveals that this condition is also
satisfied.
Being able to conclude that all above three conditions for consistency are satisfied,
we determined a score for each system under review. A pairwise comparison matrix
for each sub criterion in use was drawn up where rows i and columns j are the two
identified methods available for use in the calculation of deferred revenue. System 1
and System 2 are weighted against each other for each sub criterion. We then compute
a normalised matrix for each of the criteria matrices. Each row i within each
normalised criteria matrix is then averaged to determine the row weights and the
average of each row is multiplied with the synthesis value for the specific criteria as
previously calculated. Lastly the rows for each system under review are summed and
the final scores represented accordingly. The scores obtained are also shown in
Appendix E. According to the weighting done by the marketing department, System 1
scored 0.2217 and System 2 scored 0.3411.
4.6.4 IS department (network optimisation) weighting
Appendix H shows the pairwise comparison matrix drawn up by the IS department at
MNO for all 23 sub criteria under review. Also shown in Appendix H is the
normalised matrix of the pairwise comparison matrix for all sub criteria that were
weighted by the IS department. The normalised matrix entries are obtained by
dividing each entry in column i of the pairwise comparison matrix obtained from the
IS department by the sum of entries in each column i. The normalised matrix is
validated by assuring that the sum of entries in each column = 1.
The next table in Appendix H shows weights and synthesis values obtained for each
of the sub criteria. Weights are obtained by averaging each row, representing a single
sub criterion, in the normalised matrix. A synthesis value for each sub criteria is
obtained by multiplying the sub criteria weight obtained in the last step with the main
criteria weight previously obtained by averaging each row of Enorm as shown in
Section 4.3. The main criterion weight specific to the sub criteria grouping is used.
The set of sub criteria weights has to be checked for consistency to determine if the
IS department was consistent in its assignment of sub criteria weights, measuring the
individual weights up against all other sub criteria. Consistency checking was done
according to the steps described in Section 4.4 and CI was calculated as 0.2662.
Because of the amount of sub criteria used, it is not possible to calculate CI/RI, as
there does not exist a value for RI when more than 9 elements are used for calculating
CI. To determine consistency we therefore only look to see if CI is sufficiently small,
which it is and whether the following conditions are met:
58
For all i in the IS department’s pairwise comparison matrix, it is necessary
that aii = 1. We see that this is indeed the case.
Furthermore, if aij = k, then for consistency it is necessary that aji = 1/k.
Analysis of the pairwise comparison matrix reveals that this condition is also
satisfied.
Being able to conclude that all above three conditions for consistency are satisfied,
we determined a score for each system under review. A pairwise comparison matrix
for each sub criterion in use was drawn up where rows i and columns j are the two
identified methods available for use in the calculation of deferred revenue. System 1
and System 2 are weighted against each other for each sub criterion. We then compute
a normalised matrix for each of the criteria matrices. Each row i within each
normalised criteria matrix is then averaged to determine the row weights and the
average of each row is multiplied with the synthesis value for the specific criteria as
previously calculated. Lastly the rows for each system under review are summed and
the final scores represented accordingly. The scores obtained are also shown in
Appendix E. According to the weighting done by the IS department, System 1 scored
0.2168 and System 2 scored 0.3383.
4.7 Analysing the final scores
The following results summarises the scores obtained from implementation of our
model in each weighting instance. In the first instance each department only
weighting the sub criteria applying to its department independently did criteria
weighting. We derived at a final score of 0.7 for the method as implemented by
System 1 and at 1.2634 for the method as implemented by System 2. This indicates
that there is a tremendous amount of trust placed in the deferred revenue calculated
through the use of a BSS than when calculated not using a BSS at all. The specific
sub criteria within each main criterion (business unit/department) were selected from
the complete list of KPIs provided since quantifiable changes can be noticed in these
sub criteria when switching from one method for calculation of deferred revenue to
the other [12]. It is not that deferred revenue so much impacts on the criteria; it is
rather that the BSS implemented impacts on the criteria that in turn impacts on
deferred revenue and the effectiveness thereof.
Business unit/department senior managers assigned the weighs that apply to sub
criteria and synthesis values were calculated once the main criteria were weighted.
The weighting of the main criteria were done in conjunction with MNO department
heads and/or senior managers under the guidance of an expert. The Revenue
Assurance (RA) department at MNO also contributed greatly to this part of the
project by providing valuable input relating to the calculation of deferred revenue.
The field of RA and the effect RA departments of organisations have, are relatively
new to mobile phone networks, but they perform critical tasks within the
organisational framework without which no mobile phone network can operate
efficiently [25]. Thus having secured the sources of information that are impacted on
through the implementation of a BSS and identifying the positive results that this has
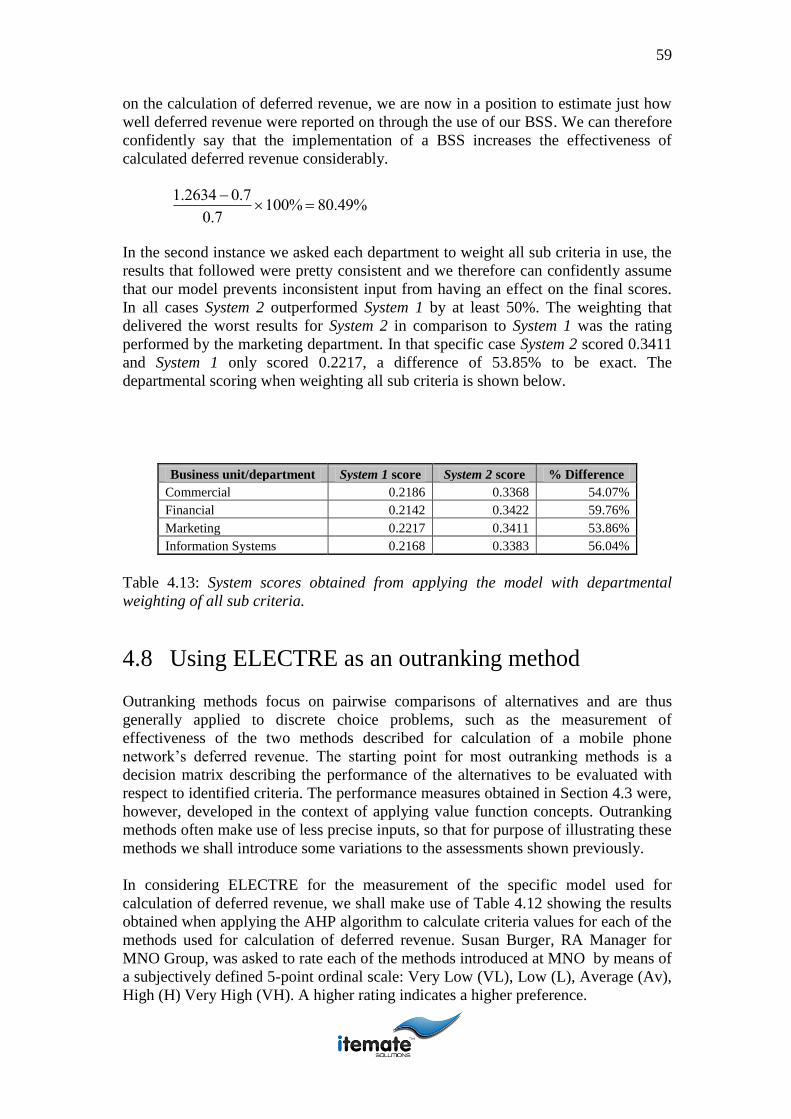
59
on the calculation of deferred revenue, we are now in a position to estimate just how
well deferred revenue were reported on through the use of our BSS. We can therefore
confidently say that the implementation of a BSS increases the effectiveness of
calculated deferred revenue considerably.
1.2634 0.7
0.7100% 80.49%
In the second instance we asked each department to weight all sub criteria in use, the
results that followed were pretty consistent and we therefore can confidently assume
that our model prevents inconsistent input from having an effect on the final scores.
In all cases System 2 outperformed System 1 by at least 50%. The weighting that
delivered the worst results for System 2 in comparison to System 1 was the rating
performed by the marketing department. In that specific case System 2 scored 0.3411
and System 1 only scored 0.2217, a difference of 53.85% to be exact. The
departmental scoring when weighting all sub criteria is shown below.
Business unit/department System 1 score System 2 score % Difference
Commercial 0.2186 0.3368 54.07%
Financial 0.2142 0.3422 59.76%
Marketing 0.2217 0.3411 53.86%
Information Systems 0.2168 0.3383 56.04%
Table 4.13: System scores obtained from applying the model with departmental
weighting of all sub criteria.
4.8 Using ELECTRE as an outranking method
Outranking methods focus on pairwise comparisons of alternatives and are thus
generally applied to discrete choice problems, such as the measurement of
effectiveness of the two methods described for calculation of a mobile phone
network’s deferred revenue. The starting point for most outranking methods is a
decision matrix describing the performance of the alternatives to be evaluated with
respect to identified criteria. The performance measures obtained in Section 4.3 were,
however, developed in the context of applying value function concepts. Outranking
methods often make use of less precise inputs, so that for purpose of illustrating these
methods we shall introduce some variations to the assessments shown previously.
In considering ELECTRE for the measurement of the specific model used for
calculation of deferred revenue, we shall make use of Table 4.12 showing the results
obtained when applying the AHP algorithm to calculate criteria values for each of the
methods used for calculation of deferred revenue. Susan Burger, RA Manager for
MNO Group, was asked to rate each of the methods introduced at MNO by means of
a subjectively defined 5-point ordinal scale: Very Low (VL), Low (L), Average (Av),
High (H) Very High (VH). A higher rating indicates a higher preference.
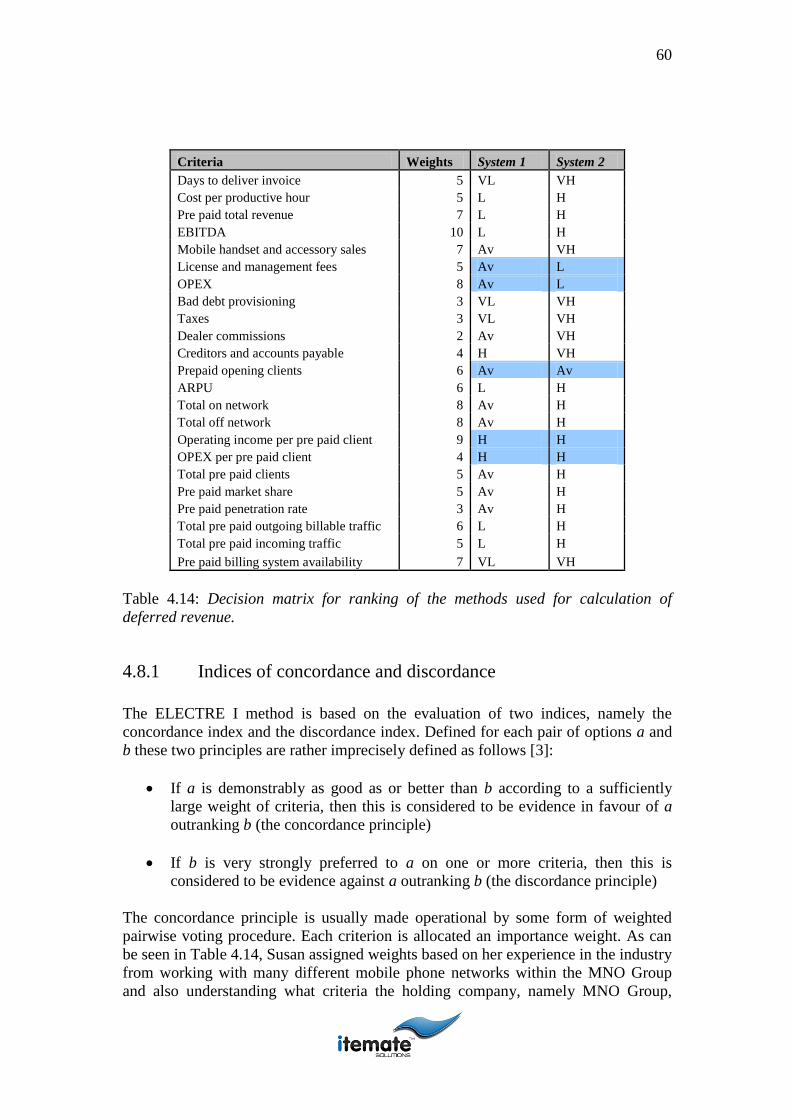
60
Criteria Weights System 1 System 2
Days to deliver invoice 5 VL VH
Cost per productive hour 5 L H
Pre paid total revenue 7 L H
EBITDA 10 L H
Mobile handset and accessory sales 7 Av VH
License and management fees 5 Av L
OPEX 8 Av L
Bad debt provisioning 3 VL VH
Taxes 3 VL VH
Dealer commissions 2 Av VH
Creditors and accounts payable 4 H VH
Prepaid opening clients 6 Av Av
ARPU 6 L H
Total on network 8 Av H
Total off network 8 Av H
Operating income per pre paid client 9 H H
OPEX per pre paid client 4 H H
Total pre paid clients 5 Av H
Pre paid market share 5 Av H
Pre paid penetration rate 3 Av H
Total pre paid outgoing billable traffic 6 L H
Total pre paid incoming traffic 5 L H
Pre paid billing system availability 7 VL VH
Table 4.14: Decision matrix for ranking of the methods used for calculation of
deferred revenue.
4.8.1 Indices of concordance and discordance
The ELECTRE I method is based on the evaluation of two indices, namely the
concordance index and the discordance index. Defined for each pair of options a and
b these two principles are rather imprecisely defined as follows [3]:
If a is demonstrably as good as or better than b according to a sufficiently
large weight of criteria, then this is considered to be evidence in favour of a
outranking b (the concordance principle)
If b is very strongly preferred to a on one or more criteria, then this is
considered to be evidence against a outranking b (the discordance principle)
The concordance principle is usually made operational by some form of weighted
pairwise voting procedure. Each criterion is allocated an importance weight. As can
be seen in Table 4.14, Susan assigned weights based on her experience in the industry
from working with many different mobile phone networks within the MNO Group
and also understanding what criteria the holding company, namely MNO Group,
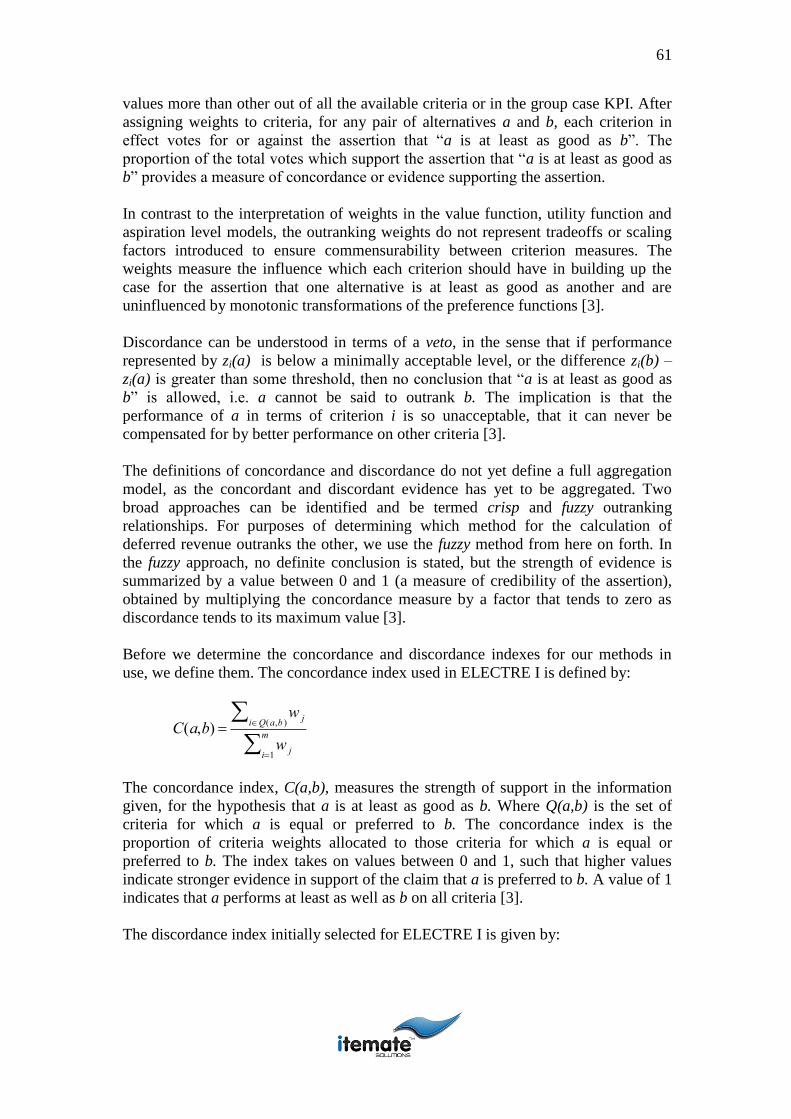
61
values more than other out of all the available criteria or in the group case KPI. After
assigning weights to criteria, for any pair of alternatives a and b, each criterion in
effect votes for or against the assertion that “a is at least as good as b”. The
proportion of the total votes which support the assertion that “a is at least as good as
b” provides a measure of concordance or evidence supporting the assertion.
In contrast to the interpretation of weights in the value function, utility function and
aspiration level models, the outranking weights do not represent tradeoffs or scaling
factors introduced to ensure commensurability between criterion measures. The
weights measure the influence which each criterion should have in building up the
case for the assertion that one alternative is at least as good as another and are
uninfluenced by monotonic transformations of the preference functions [3].
Discordance can be understood in terms of a veto, in the sense that if performance
represented by zi(a) is below a minimally acceptable level, or the difference zi(b) –
zi(a) is greater than some threshold, then no conclusion that “a is at least as good as
b” is allowed, i.e. a cannot be said to outrank b. The implication is that the
performance of a in terms of criterion i is so unacceptable, that it can never be
compensated for by better performance on other criteria [3].
The definitions of concordance and discordance do not yet define a full aggregation
model, as the concordant and discordant evidence has yet to be aggregated. Two
broad approaches can be identified and be termed crisp and fuzzy outranking
relationships. For purposes of determining which method for the calculation of
deferred revenue outranks the other, we use the fuzzy method from here on forth. In
the fuzzy approach, no definite conclusion is stated, but the strength of evidence is
summarized by a value between 0 and 1 (a measure of credibility of the assertion),
obtained by multiplying the concordance measure by a factor that tends to zero as
discordance tends to its maximum value [3].
Before we determine the concordance and discordance indexes for our methods in
use, we define them. The concordance index used in ELECTRE I is defined by:
C(a,b) w j
iQ(a,b )
w ji1
m
The concordance index, C(a,b), measures the strength of support in the information
given, for the hypothesis that a is at least as good as b. Where Q(a,b) is the set of
criteria for which a is equal or preferred to b. The concordance index is the
proportion of criteria weights allocated to those criteria for which a is equal or
preferred to b. The index takes on values between 0 and 1, such that higher values
indicate stronger evidence in support of the claim that a is preferred to b. A value of 1
indicates that a performs at least as well as b on all criteria [3].
The discordance index initially selected for ELECTRE I is given by:
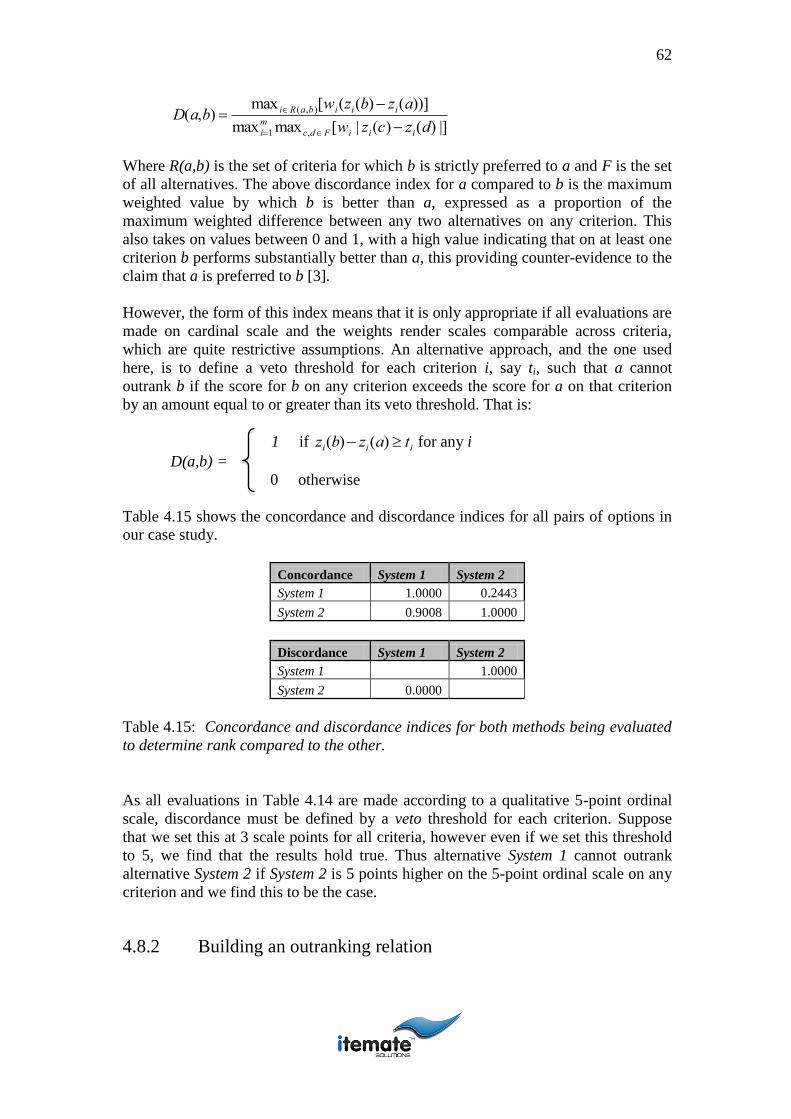
62
D(a,b) max iR(a,b )[wi(zi(b) zi(a))]
max i1
m max c,dF[wi | zi(c) zi(d) |]
Where R(a,b) is the set of criteria for which b is strictly preferred to a and F is the set
of all alternatives. The above discordance index for a compared to b is the maximum
weighted value by which b is better than a, expressed as a proportion of the
maximum weighted difference between any two alternatives on any criterion. This
also takes on values between 0 and 1, with a high value indicating that on at least one
criterion b performs substantially better than a, this providing counter-evidence to the
claim that a is preferred to b [3].
However, the form of this index means that it is only appropriate if all evaluations are
made on cardinal scale and the weights render scales comparable across criteria,
which are quite restrictive assumptions. An alternative approach, and the one used
here, is to define a veto threshold for each criterion i, say ti, such that a cannot
outrank b if the score for b on any criterion exceeds the score for a on that criterion
by an amount equal to or greater than its veto threshold. That is:
1 if
zi(b) zi(a) ti for any i
D(a,b) =
0 otherwise
Table 4.15 shows the concordance and discordance indices for all pairs of options in
our case study.
Concordance System 1 System 2
System 1 1.0000 0.2443
System 2 0.9008 1.0000
Discordance System 1 System 2
System 1 1.0000
System 2 0.0000
Table 4.15: Concordance and discordance indices for both methods being evaluated
to determine rank compared to the other.
As all evaluations in Table 4.14 are made according to a qualitative 5-point ordinal
scale, discordance must be defined by a veto threshold for each criterion. Suppose
that we set this at 3 scale points for all criteria, however even if we set this threshold
to 5, we find that the results hold true. Thus alternative System 1 cannot outrank
alternative System 2 if System 2 is 5 points higher on the 5-point ordinal scale on any
criterion and we find this to be the case.
4.8.2 Building an outranking relation

63
The concordance and discordance indices for each pair of options can be used to
build an outranking relation. We start by specifying concordance and discordance
thresholds, C* and D* respectively. Alternative a is defined as outranking alternative
b if the concordance coefficient C(a,b) is greater than or equal to the threshold C*
and the discordance coefficient D(a,b) is less than or equal to D*. The values of C*
and D* are specified for a particular outranking relation and they may be varied to
give more or less severe outranking relations. The higher the value of C* and the
lower the value of D*, the more severe the outranking relation, that is, the more
difficult it is for one alternative to outrank another. It is a matter of experimentation
to find a C* large enough (but not too large) and a D* small enough (but not too
small) in order to define an informative and useful outranking relation. If the
outranking relation is made too severe, then almost all pairs of alternatives will be
deemed to be incomparable, while if the outranking relation is not severe enough then
too many alternatives will outrank too many others and neither of these outcomes are
particularly useful [3].
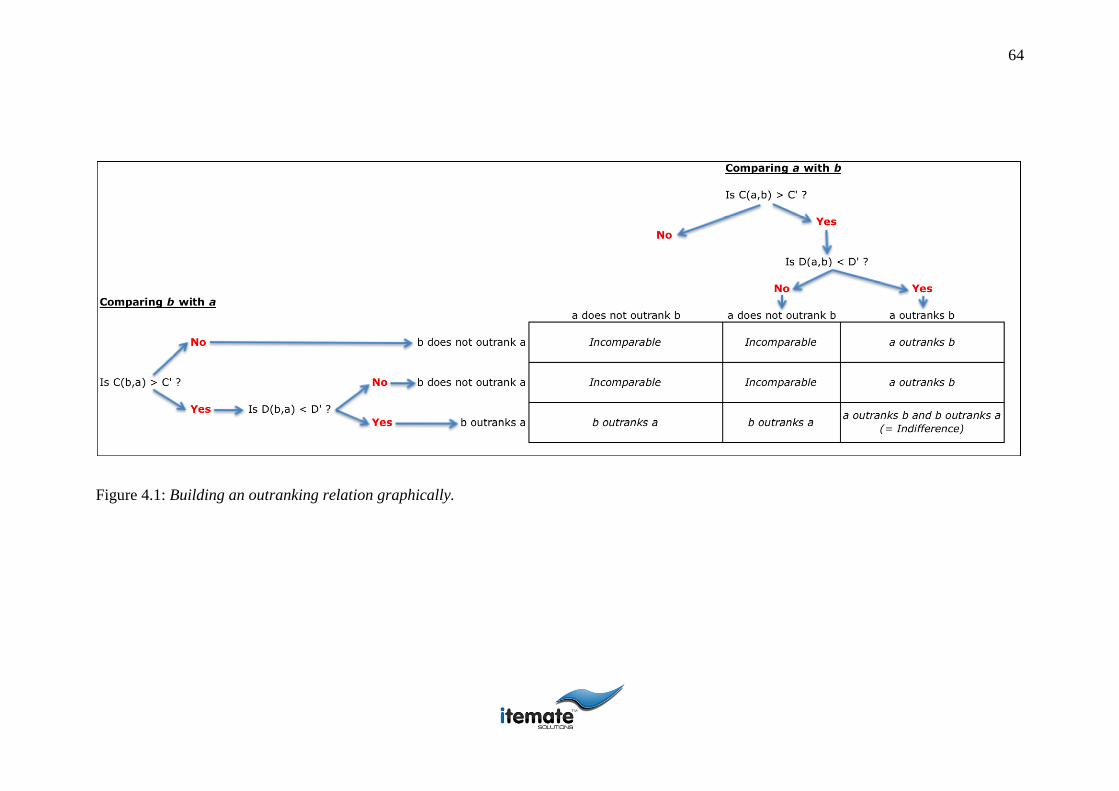
64
Figure 4.1: Building an outranking relation graphically.
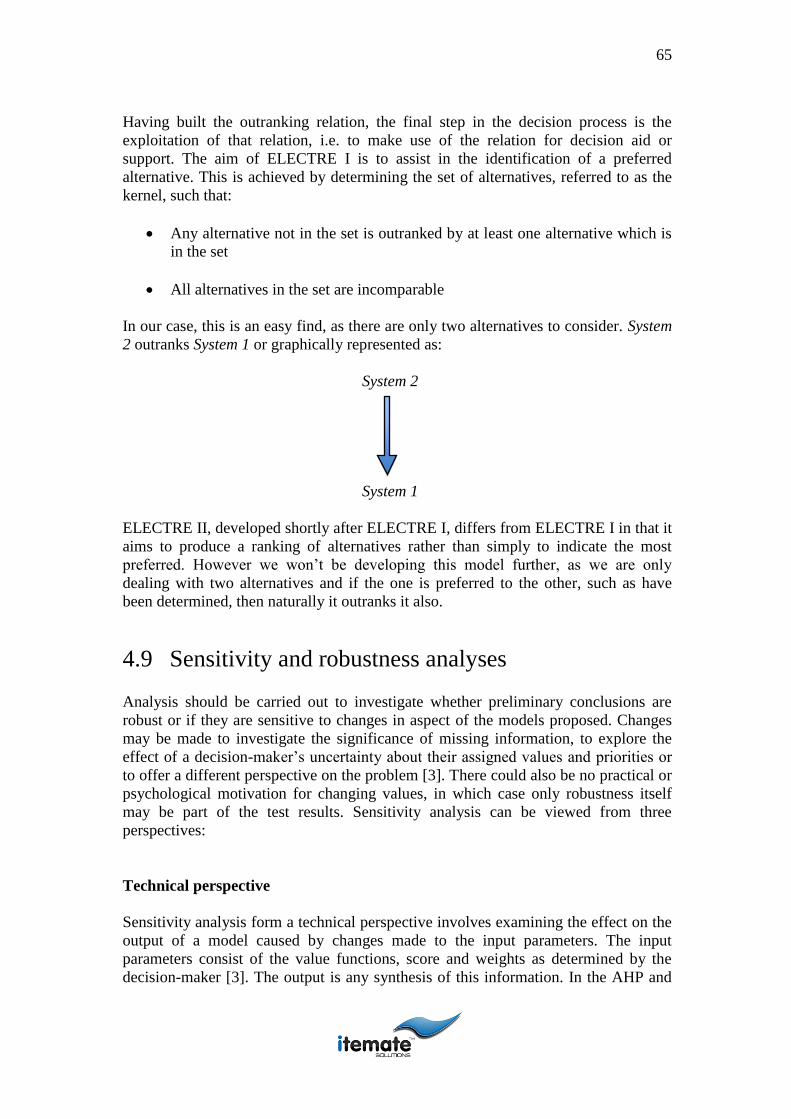
65
Having built the outranking relation, the final step in the decision process is the
exploitation of that relation, i.e. to make use of the relation for decision aid or
support. The aim of ELECTRE I is to assist in the identification of a preferred
alternative. This is achieved by determining the set of alternatives, referred to as the
kernel, such that:
Any alternative not in the set is outranked by at least one alternative which is
in the set
All alternatives in the set are incomparable
In our case, this is an easy find, as there are only two alternatives to consider. System
2 outranks System 1 or graphically represented as:
System 2
System 1
ELECTRE II, developed shortly after ELECTRE I, differs from ELECTRE I in that it
aims to produce a ranking of alternatives rather than simply to indicate the most
preferred. However we won’t be developing this model further, as we are only
dealing with two alternatives and if the one is preferred to the other, such as have
been determined, then naturally it outranks it also.
4.9 Sensitivity and robustness analyses
Analysis should be carried out to investigate whether preliminary conclusions are
robust or if they are sensitive to changes in aspect of the models proposed. Changes
may be made to investigate the significance of missing information, to explore the
effect of a decision-maker’s uncertainty about their assigned values and priorities or
to offer a different perspective on the problem [3]. There could also be no practical or
psychological motivation for changing values, in which case only robustness itself
may be part of the test results. Sensitivity analysis can be viewed from three
perspectives:
Technical perspective
Sensitivity analysis form a technical perspective involves examining the effect on the
output of a model caused by changes made to the input parameters. The input
parameters consist of the value functions, score and weights as determined by the
decision-maker [3]. The output is any synthesis of this information. In the AHP and
66
ELECTRE instances, choosing the one system for measurement of deferred revenue
above the other. When doing a technical sensitivity analysis we attempt to determine
whether changes in specific input parameters have a critical influence on the overall
evaluation.
Individual perspective
Sensitivity analysis from an individual’s perspective is to provide a sounding board
against which they can test their intuition and understanding of the problem [3]. This
is clearly illustrated by having the MNO department heads weight only the criteria
pertaining to their departments.
Group perspective
Sensitivity analysis within the group context is to allow the exploration of alternative
perspectives on the problem. In our case, we explore this while having all department
heads from MNO weight all the available criteria and not only the criteria pertaining
to their departments.
Sensitivity analysis from an individual and group perspective received a lot of
attention throughout this document. However, let’s consider the technical perspective
for a moment. It can be easily viewed as impractical, because of the number of
judgements involved, but also as a consequence of the use of the eigenvector method
to derive normalized comparison matrices for comparative purposes of the criteria in
use. When considering sensitivity analysis of the AHP there has been extensive
practical and theoretical concerns, these include:
The interpretation of criteria weights
In using the AHP and because it is an additive model, the weight parameters wi define
the desirable levels of tradeoffs between performances of the different criteria. Two
alternatives can easily be equally preferred to one another if two alternatives a and b
differ only on criteria i and k for example and vi(a) > vi(b) but vk(b) > vk(a). The
reason for this is because of the scaling of the partial scores to sum to 1 [3]. Therefore
one alternative does not enjoy a preference or swing on the other because of its
absolute preference in specific criteria. Because it is an additive model and not an
outranking model a total or average score determines it’s position based on all the
different criteria used together. It is not always evident that when decision-makers
express relative weight ratios, they have this interpretation in mind. However, in
following the purist approach, we accept this sensitivity concern here and while using
the AHP, but also bring in ELECTRE as an outranking method to prove consistency
with regards to interpretation of results.
The assumption of a ratio scale of preference
67
The AHP assumes that all comparisons can be made on a ratio scale [3]. This means
that if comparing a to b we could state our preference for one over the other as a
ratio. In doing so the distance of a and b from a natural reference point, such as zero,
is determined and used as basis for comparison. The argument is that for variables
such as length, area, weight, etc. it makes sense, but not for considerations such as
comfort, image or quality of life, for which no clear reference level exists.
Numerical interpretation of the semantic scale
Concern has been expressed about the appropriateness of the conversion from the
semantic to the numeric scale used by Saaty as a measure of strength of preference
[3]. The general view, supported by experimental work and also shown when using
ELECTRE as opposed to the AHP, is that the extreme point of the scale defined
semantically as absolute preference is more consistent with a numeric ratio of 1:3 or
even 1:5 than the 1:9 used in the AHP.
In the first two instances mentioned above, the concerned debate is about rank
reversal. Rank reversal refers to the fact that in certain situations, the introduction of
a new alternative which do not change the range of outcomes on any criterion may
lead to a change in the ranking of the other alternatives as determined by the AHP. It
is generally accepted that most of this debate is irrelevant when considering that the
interpretation of criteria is of relative importance as operationalised when using the
AHP [3]. With regards to the latter point mentioned, that of numerical interpretation
of the semantic scale, it seems that most decision-makers do not see any reason to
change their weight assessments in the light of a new alternative which does not
introduce new levels of performance [3].
Clearly sensitivity and robustness analysis is an important part of the decision
process. Unfortunately, it is not possible to do this in any automated or interactive
way. Always bear in mind that decision-makers using the models proposed are helped
to make sense of an issue, to better understand the organisational context, to explore
their own values and priorities and to appreciate the perspectives of other parties to
the decision.
In this chapter we made some assumptions for specification of our model. We
identified the criteria used for evaluation of the two methods used in the
determination of deferred revenue. The four main criteria have been identified by
MNO Group for evaluation of their subsidiary mobile phone networks. These criteria
are representative of each of the main business units within the group’s subsidiary
mobile phone networks. Mobile phone industry experts did weighting and synthesis
values were determined. We then evaluated the assigned weights for consistency and
on acceptance thereof obtained scores for each system being measured by finding
each alternative’s criteria weight. An exercise was done whereby each department
representative weighted all of the criteria chosen, even those from other departments,
and this was modelled to prove that departmental dependency and consistency is

68
maintained by the AHP represented in this chapter. Hereafter we analysed the scores
obtained for each method under review by using the AHP. We end this chapter off
with an introduction to ELECTRE for contested deferred revenue method ranking
and then perform sensitivity and robustness analysis to substantiate the evidence
obtained in Chapter 4.
The analysis of the scores yields positive campaigning towards the measurement of
deferred revenue through the use of a BSS. We conclude this thesis in Chapter 5 by
summarising the results obtained throughout and addressing specific areas for future
research.
69
Chapter 5
5. Conclusion
This chapter summarizes the results obtained by introduction of the method in
Chapter 3 and the models presented in Chapter 4. Some recommendations are made
and we conclude the chapter with ideas for future studies.
5.1 Thesis summary
The problem area is introduced in Chapter 1 and the significance of doing a study in
the effectiveness of deferred revenue motivated. We identified that various external
and internal factors contribute to the complexity of the network environment and that
these factors impact on the day-to-day operation of a mobile phone network. Not only
does it affect the network operations, but it also has a direct effect on the shareholder
value of the organisation. The shareholder value is affected by the delivery of the pre
paid product and resulting inefficiencies that have a negative effect on profits,
eventually reflecting in share price. This alone is more than enough reason for a
holding company with 23 subsidiaries (such as MNO Group has at date of writing
this thesis) to implement strong performance guidelines and to assure that KPIs are
met to the best of the industry’s capability.
In Chapter 2 we provided insightful knowledge into the industry. The airtime bearing
products were identified and discussed, as these products and their distribution
pattern impact on deferred revenue. We also explained the network environment or
systems that interact with the pre paid channel of an emerging market mobile phone
network. Revenue was addressed and the importance of revenue reporting, in
particular deferred revenue, was highlighted. The specific focus was on the historic
method for the calculation of deferred revenue.
In Chapter 3 we identified the functionalities of a BSS and then suggested a proposed
method for the calculation of deferred revenue using the functionalities provided by a
BSS. We also elaborated on the components of deferred revenue using the new
method and did a functional comparison with the historic method, showing where
sources of information overlap.
We furthered knowledge obtained in the industry by introducing a model for the
measurement of effectiveness using the two methods for the calculation of deferred
revenue in Chapter 4. Using the AHP algorithm proposed by Saaty we identified
70
main and sub criteria after collaboration with industry experts. These criteria were
checked for consistency using proposed methodologies and then a scoring was done
by finding weights for the two alternatives for the calculation of deferred revenue
using the criteria identified in earlier sections of the fourth chapter. Consistency
checking of criteria used was performed and we evaluated the scores obtained
through implementation of our model. Departmental dependency was also guaranteed
and final scores were analyzed. To motivate the findings of previous section, we gave
an explanation of using ELECTRE as an outranking method to prove the same. The
ELECTRE method realised similar results and this we substantiated by performing
sensitivity and robustness analysis on both methods used.
5.2 Solution results
The reasoning behind the effectiveness of deferred revenue as reported through the
use of a BSS is greatly due to bettered processes. A BSS has a way of stream lining
and automating so many of the processes that are involved with or impact on deferred
revenue in some way or another. These processes are mostly human driven process or
if machine driven, not fully automated due to the mass and complexity of information
that has to be managed. Once a BSS is fully operational within the pre paid channel
of a mobile phone network, the BSS is able to identify systems and inter departmental
shortcomings. This is due to the fact that a BSS is pre programmed to expect
specified data from specified sources and checks and balances are programmed to
reconcile the input data instantaneously. If preconditions are not met, administrators
of the BSS can be alerted immediately, allowing them to react in real time.
Reacting in real time motivates the later part of the argument. Now that it has been
identified, the weakness can be addressed so that it is not exploited again. This
continuous process of evaluating data, people, departments and processes results in
efficient progress with regards to the effectiveness of the reported deferred revenue
over time. The scores for both system alternatives were assigned from criteria used in
the model of Chapter 4, seven months after the first implementation date of a BSS.
The BSS was first implemented on 1 December 2007 and scores were determined at
the end of June 2008. During the 7 months since the first implementation date,
various process shortcomings were identified and addressed.
5.3 Suggestions and recommendations
A few of the most significant issues identified during analysis of the mobile phone
network environment and specifically issues that impacted on deferred revenue are
listed below. These issues, when addressed will have a noticeable positive effect on
the effectiveness of deferred revenue. In a lot of cases a BSS is maybe not required to
address the issue, but a BSS definitely helps in the identification of key areas of
concern.
71
Process shortcomings identified through the use of a BSS and after having been
addressed, increased the effectiveness of deferred revenue as having been reported by
MNO :
IN deficiencies that were identified include:
o There is little control on the IN regarding the regulation of airtime
bearing products and their activation and deactivation.
o When queries are performed on the IN to retrieve crucial
information to be used in the calculation of deferred revenue, these
queries are time consuming in their execution, skewing the results
when used in time series data analysis.
o It is possible to do manual adjustments on the IN, for which there
exist no traceable audit trail. This leaves the network vulnerable to
fraudulent activity.
o There exists specific account balances on the IN that can be used to
make unbilled calls. Managing these accounts incorrectly will not
only deprive the network of billable traffic, but could also increase
the total payment due to partner networks for terminating calls on
their infrastructure.
Ineffective utilisation of the POS due to:
o The ineffective utilisation of the POS can take place due to
shortcomings in the design and logical implementation of the POS,
again leaving room for fraudulent activities.
o Transactions are not done at arms length, due to relationships that
exist between mobile phone network employees and sales dealers.
This skews sales reports by special benefits being granted to selected
dealers who don’t necessarily qualify for those benefits.
Ineffective utilisation of the ERP due to:
o Manual entries are done on the general ledger of the ERP. Again,
these entries are not traceable and auditable and reconciliation of the
data retrieved from the ERP is near impossible to reconcile.
Department shortcomings included:
o Marketing department does not perform product updates on all
systems simultaneously, skewing resulting time series data sets
when queried from the various systems in use.
5.4 Possible future work
It would be interesting to repeat the effectiveness measurement exercise now and
after process shortcomings have been addressed, just to see whether the newly
proposed method for the calculation of deferred revenue outperforms the historical
method even more. I am sure this will be the case. Furthermore, I would like to
compare the newly proposed methods to any other methods that are born into
existence, as this will allow me to continuously better the service offering to mobile
72
network operators through the use of researched and documented models as outlined
in this thesis.
As we’ve seen with the implementation of a BSS and the impact it had on the
effectiveness of deferred revenue, the implementation of any other system can either
have a positive or negative effect on any one of various available organisational
variables. Just as we’ve compared one method for calculation of deferred revenue
against another, we can use the proposed models from Chapter 4 to compare any
system within a mobile phone network against any other. Even more challenging
would be the estimation or measurement of the effectiveness of any system within a
mobile phone network at the hand of specific KPI. An even more challenging field of
research would be to look at the onset of new technologies within the
telecommunications sector and not specifically mobile phone networks. An example
of this would be that of WiMAX and the various systems that interact with this
technology for it to be commercially successfully implemented.
The goal we set out to achieve in writing of this thesis was primarily to demonstrate
the effectiveness of a newly proposed method for the calculation of deferred revenue,
but more specifically in the emerging markets. Since deferred revenue only exists
because of the presence of a pre paid value channel, this was an obvious assumption
and necessity in achieving the goal. The results obtained in this thesis were shared
with industry experts, both from an academic and industry perspective. Papers were
filed and is being published in the academic journal Management Dynamics, covering
a very specific aspect of the OR field with regards to the effect this research had on
the management personnel and style of mobile phone networks. A presentation was
also done at the Operations Research Society of South Africa (ORSSA) during
September 2009 and valuable feedback was pertained as to the methodologies used
here and what the scope could be for implementing the same processes in other
technological spheres. From an industry perspective, the results obtained were shared
with specific key personnel members of MNO Group. The outcomes obtained from
this implementation at a single subsidiary of MNO Group during 2007, has served as
motivation for 4 other implementations across the groups subsidiary networks to date.
This clearly substantiates the outcome of the thesis and success of the models
represented here.
There exist feasible solutions to most of the problems posed by mobile phone
networks today. However there are a few challenges that keep solutions to future
problems out of the reach of quite a few networks. In my experience, the largest of
these are the pace at which development in this specific industry is taking place.
Worsened by the fact that there is no first world scenario that can provide exact case
studies of where the emerging market mobile phone networks can find solutions to
their own specific problems. The technology and growth factors can be detrimental to
some networks and even suppliers of services and technologies if their planning is not
done diligently.
There exists a wide realm of research that can be done in African and other emerging
markets globally to identify trends that can be used to react on problem areas, such as
the deferred revenue dilemma as explained in this thesis, in a proactive manner. As
all too often emerging markets are seen to be trend followers, rather than trend

73
setters, but I for one can confess that this is one industry and one market that you
have to be very careful in your approach if you want to achieve ultimate success in
what you do. It will be interesting to see how the mobile phone networks react to
challenges that are being imposed by the Internet Protocol (IP) threat, effectively
putting low cost communications in the hands of every individual worldwide. One
thing we can be sure of however is that whatever the case, it will continue to be
driven and owned by multi-million dollar organisations with one aim only, to make
more revenue and declare larger profits.
74
6. References
[1] ARIF M, 2005, Choosing the right software infrastructure to support your
operation’s mobile needs, Computer Weekly (May 2005), pp.24-26, [Online],
[Cited 1 July 2009], Available from
http://search.ebscohost.com.ez.sun.ac.za/login.aspx?direct=true&db=buh&A
N=17454882&site=ehost-live
[2] AUTONOMY, 2008, Autonomy IFRS Accounting Policies, [Online], [Cited
10 July 2008], Available from
http://www.autonomy.cpm/content/Investors/accounting_policies.en.html
[3] BELTON V and STEWART T.J, 2002, Multi Criteria Decision Analysis An
Integrated Approach, Kluwer Academic Publishers
[4] BLACKWELL G, 2009, WiMAX Has a Future in Middle East and Africa,
WiMAX around the globe, Fourth Edition, pp. 1-4
[5] BONINI C.P, 1963, Simulation of Information and Decision Systems in the
Firm, Prentice Hall: Englewood Cliffs
[6] BURGER S, 2009, Personal communication, Revenue Assurance Manager of
MNO Group
[7] BUSINESS SOURCE PREMIER, 2009, Networks, Total Telecom Magazine
(June 2009), pp. 5, [Online], [Cited 1 July 2009], Available from
http://search.ebscohost.com.ez.sun.ac.za/login.aspx?direct=true&db=buh&A
N=41874333&site=ehost-live
[8] CAMPANILLE F, COPPOLINO L, GIORDANO S, ROMANO L, 2008, A
business process monitor for a mobile phone recharging system, Journal of
Systems Architecture 54 (2008), pp. 843-848
[9] COMPTROLLER’S HANDBOOK, 1998, Emerging Market Country
Products and Trading Activities, Administrator of National Banks, pp.4
[10] COSARES S, DEUTSCH D.N, SANIEE I and WESEM O.J, 1995, Sonet
toolkit: a decision support system for the design of robust and cost-effective
fiber-optic networks, Interfaces 25, pp.20-40
[11] CURNOW G et al, 1997, Automating credit and collections decisions at
AT&T capital corporation, Interfaces 27, pp. 29-52
[12] DIOP D, 2008, Personal communication, CIO of MNO Cote d’Ivoire
75
[13] EOM S and KIM E, 2005, A survey of decision support system applications
(1995–2001), Journal of the Operations Research Society (2005) 0, pp. 1-15
[14] GIARRATANO J.C and RILEY G, 1998, Expert Systems - Principles and
Programming, Third Edition, pp. 4-5, 8-10
[15] GREENE R, Managing Emerging Telecommunications Technologies for
Competitive Advantage, Versant Corp, pp. 3
[16] GSM MOU ASSOCIATION, 2006, History and Timeline of GSM, [Online],
[Cited 6 September 2007], Available from
http://www.emory.edu/BUSINESS/et/P98/gsm/history.html
[17] HO W, 2006, Integrated analytic hierarchy process and its applications - A
literature review, European Journal of Operational Research 186 (2008), pp.
211-228
[18] HESS T.J, REES L.P and RAKES T.R, 2000, Using autonomous software
agents to create the next generation of decision support systems, Decis Sci 31,
pp. 1-31
[19] KANTER R.M, 2009, Managing at a global level, Gulf News (12 July 2009),
pp.32
[20] KIM Y.G, KIM H.W, YOON J.W and RHU H.S, 1997, Building an
organizational decision support system for korea telecom: a process redesign
approach, Decis Support Sys 19, pp. 255-269
[21] KOKKO J, 2000, Mobile Internet charging: prepaid vs. postpaid, Networking
Laboratory, HUT, pp. 2
[22] MPORE A, 2007, Personal communication, CEO of MNO Cote d’Ivoire
[23] MNO GROUP, 2007, MNO Group Footprint - Overview, [Online], [Cited 23
August 2008], Available from
http://www.MNO.com/MNO.group.web/footprint/overview.asp
[24] NAIDOO S AND MCLEOD D, 2008, The Mobile High Rollers - The MNO
Billionaire Club, Financial Mail (March 2008), pp. 33-35
[25] NINDJIN A.D, 2008, Personal communication, Revenue Assurance Senior
Manager of MNO Cote d’Ivoire
[26] O’BRIEN G, 1991, Auditing the Control Environment, Cellular Business
(July 1991), Volume 8(7), pp. 64
[27] PALMA-DOS-REIS A and ZAHEDI F.M, 1999, Designing personalized
intelligent financial decision support systems, Decis Support Syst 26, pp.31-
47

76
[28] PERLMAN L, 2007, Personal communication, Chairman of Wireless
Application Service Providers’ Association (WASPA)
[29] PERLMAN L, 2007, Revenue Assurance Forum Africa, CTICC, Cape Town,
South Africa
[30] PHILLIPS L.D and EDWARDS W, 1966, Conservatism in a simple
probability inference task, J. Experiment, Psychology (1966), Volume 72, pp.
346-357
[31] PIENAAR K, 2007, Personal communication, CTIO of MNO Group Limited
[32] ROGERS D, 2007, Mobile Handset Security: Securing Open Devices and
Enabling Trust, OMTP Limited, pp. 17
[33] ROY B, 1996, Multicriteria Methodology for Decision Aiding, Kluwer
Academic Publishers, Dordrecht
[34] SAATY T.L, 2007, Decision Making Methodology Discussion Forum,
[Online], [Cited 3 November 2007], Available from
http://blog.decisionlens.com/2007/03/magic-number-seven-plus-or-minus-
two.html
[35] SAHIN S and SENER O, 2002, Assessment of Foreign Direct Investment
Attractiveness: an AHP Approach, [Online], [Cited 16 August 2008],
Available from
http://www.issm.cnr.it/asp/seminari/IntWrk/abstract/Sahin%20Sener.pdf
[36] SCANLON M, 2007, The African Prepaid Scratchcard Market - Market
Assessment & Growth Prospects, pp. 4
[37] SCOTT MORTON M.S, 1971, Management decision systems: computer -
based support for decision making, Division of Research, Harvard University,
Cambridge, MA.
[38] SMITH J.E and VON WINTERFELDT, 2004, Decision Analysis in
Management Science, Management Science (May 2004), Volume 50(5), pp.
561-574
[39] THE ECONOMIST INTELLIGENCE UNIT, 2006, Business India
Intelligence, The Economist (January 2006), Volume XIII, pp. 1-2
[40] VAN DER VYVER J, 2008, Personal communication, Technical Director of
Itemate Solutions
[41] VISAGIE S, 2008, Personal communication, Professor at Logistics
Department of Stellenbosch University

77
[42] WIKIPEDIA, 2008, Analytical Hierarchy Process, [Online], [Cited 16 August
2008], Available from
http://en.wikipedia.org/wiki/Analytic_Hierarchy_Process
[43] WINSTON W.L, 1994, Operations Research - Applications and Algorithms,
pp. 798-806
[44] ZOPOUNIDIS C and DOUMPOS M, 2002, Multi-criteria decision aid in
financial decision making: Methodologies and literature review, J
Multicriteria Decis Anal 11, pp. 167-186

78
Appendix A
A. Compact disc content
<AHP – Excel1.xls>
<AHP – Excel1.xls> is a program that represents the base model for calculation of
the AHP fundamentals as discussed in this thesis. The departmental managers
weighted the sub criteria represented within each department and results were
obtained accordingly. The last sheet in the Excel document, namely “CRITERIA-
Summary” represents a summary of the program being used repetitively for each of
the main criteria used.
<AHP – Excel1.xls> contains the following sheets.
CRITERIA SPECIFICATION-Step1: User selection of the specific sub criteria to
use for each of the main criteria required in this step.
CRITERIA MATRIX-Step2: Criteria weighting by departmental managers for
criteria selected for each department in the previous sheet required.
CRITERIA SPEC MATRIC-Step3: Weighting of two systems against one another
for each of the criteria selected in the first step.
CRITERIA RESULTS-Step4: Shows AwT and Aw
T/w
T and final results based on
calculations performed on “CRITERIA-Summary” sheet.
CRITERIA-Summary: Summarizes all the calculations used in this thesis for the
implementation of the model using the AHP.
<AHP – Excel2.xls> through to <AHP – Excel5.xls>
<AHP – Excel2.xls> through to <AHP – Excel5.xls> are a series of Excel documents
that represents the base model for calculation of the AHP fundamentals as discussed
in this thesis. Each departmental manager weighted all sub criteria represented and
these are shown in files <AHP – Excel2.xls> through to <AHP – Excel5.xls>. The
last sheet in each of the Excel documents, namely “CRITERIA-Summary” represents
a summary of the program being used for weighting all of the sub criteria and
obtaining the relevant scores.
<AHP – Excel2.xls> through to <AHP – Excel5.xls> contains the following sheets.
CRITERIA SPECIFICATION-Step1: User selection of the specific sub criteria to
use for each of the main criteria required in this step.

79
CRITERIA MATRIX-Step2: Criteria weighting for criteria selected in the previous
sheet required.
CRITERIA SPEC MATRIC-Step3: Weighting of two systems against one another
for each of the criteria selected in the first step.
CRITERIA RESULTS-Step4: Shows AwT and Aw
T/w
T and final results based on
calculations performed on “CRITERIA-Summary” sheet.
CRITERIA-Summary: Summarizes all the calculations used in this thesis for the
implementation of the model using the AHP.
<AHP – Excel2.xls> was done by the commercial department at MNO
<AHP – Excel3.xls> was done by the finance department at MNO
<AHP – Excel4.xls> was done by the marketing department at MNO
<AHP – Excel5.xls> was done by the IS department at MNT
<ELECTRE – Excel1.xls>
<ELECTRE – Excel1.xls> contains two sheets. The first shows the decision matrix
for ranking of the methods used for calculation of deferred revenue using ELECTRE.
It also shows the concordance and discordance indices for both methods being
evaluated to determine rank compared to the other. Susan Burger, RA Manager for
MNO Group, completed the necessary weighting in this sheet. The second sheet
contains a graphical representation of how to build an outranking relation graphically.
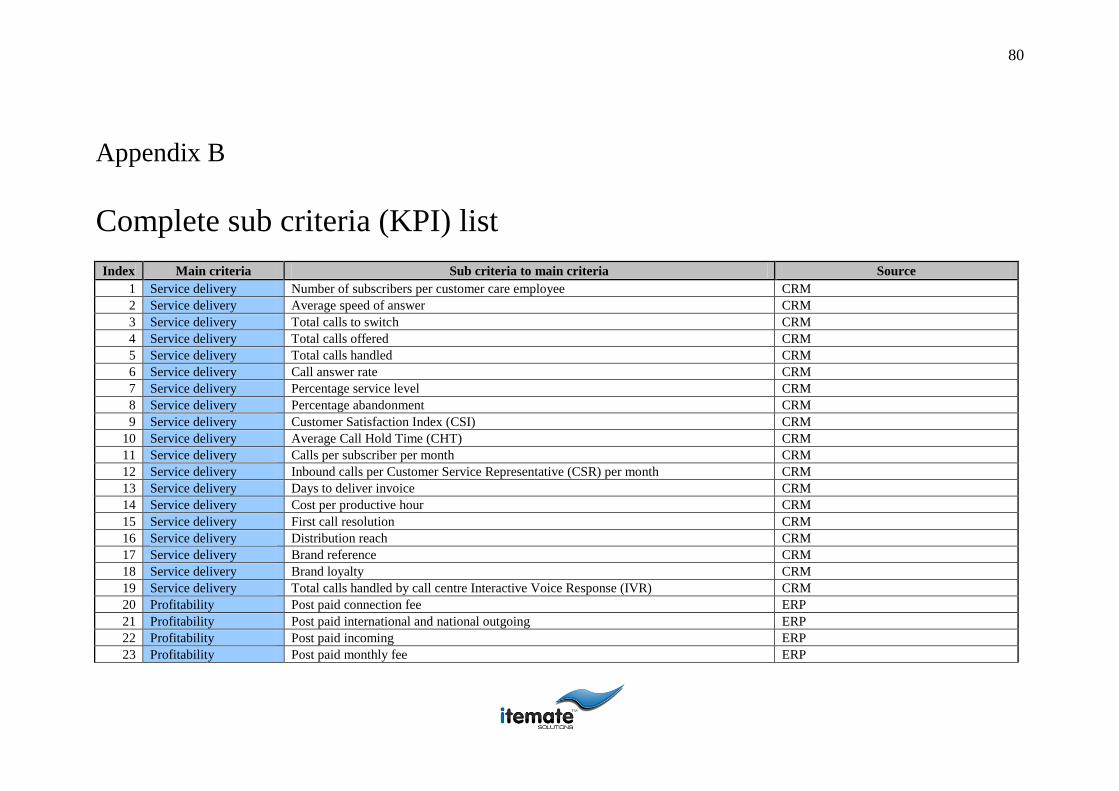
80
Appendix B
B. Complete sub criteria (KPI) list
Index Main criteria Sub criteria to main criteria Source
1 Service delivery Number of subscribers per customer care employee CRM
2 Service delivery Average speed of answer CRM
3 Service delivery Total calls to switch CRM
4 Service delivery Total calls offered CRM
5 Service delivery Total calls handled CRM
6 Service delivery Call answer rate CRM
7 Service delivery Percentage service level CRM
8 Service delivery Percentage abandonment CRM
9 Service delivery Customer Satisfaction Index (CSI) CRM
10 Service delivery Average Call Hold Time (CHT) CRM
11 Service delivery Calls per subscriber per month CRM
12 Service delivery Inbound calls per Customer Service Representative (CSR) per month CRM
13 Service delivery Days to deliver invoice CRM
14 Service delivery Cost per productive hour CRM
15 Service delivery First call resolution CRM
16 Service delivery Distribution reach CRM
17 Service delivery Brand reference CRM
18 Service delivery Brand loyalty CRM
19 Service delivery Total calls handled by call centre Interactive Voice Response (IVR) CRM
20 Profitability Post paid connection fee ERP
21 Profitability Post paid international and national outgoing ERP
22 Profitability Post paid incoming ERP
23 Profitability Post paid monthly fee ERP
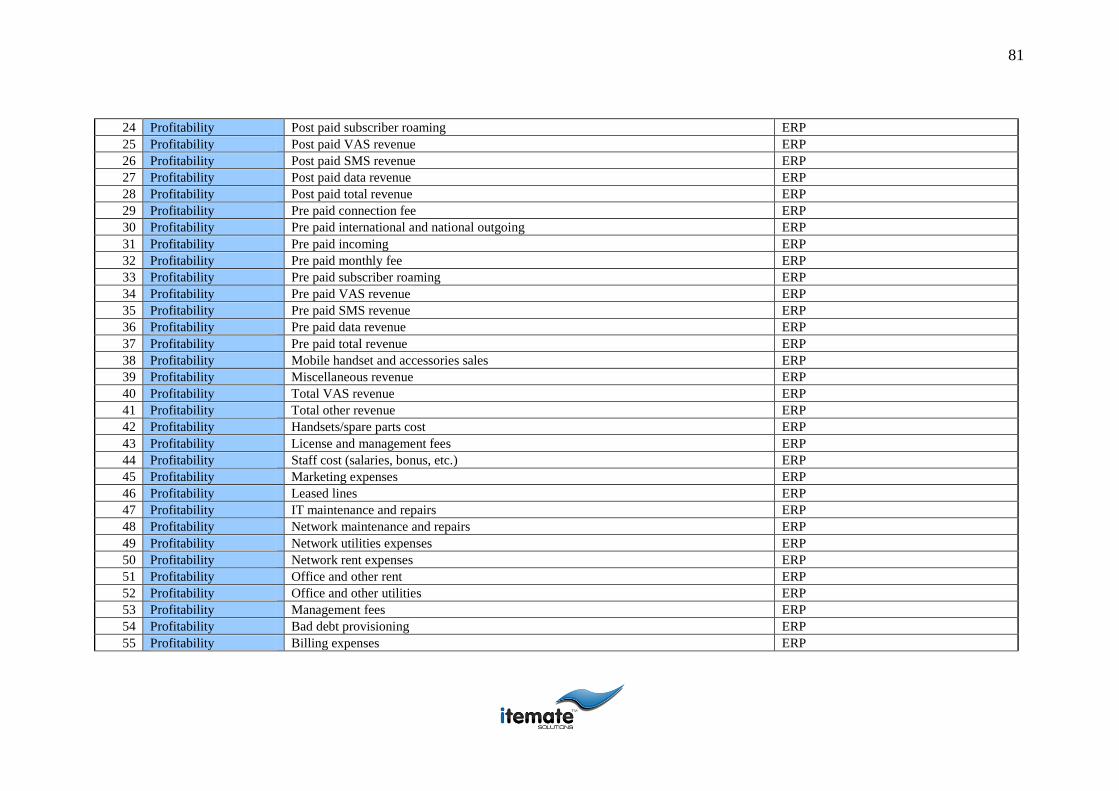
81
24 Profitability Post paid subscriber roaming ERP
25 Profitability Post paid VAS revenue ERP
26 Profitability Post paid SMS revenue ERP
27 Profitability Post paid data revenue ERP
28 Profitability Post paid total revenue ERP
29 Profitability Pre paid connection fee ERP
30 Profitability Pre paid international and national outgoing ERP
31 Profitability Pre paid incoming ERP
32 Profitability Pre paid monthly fee ERP
33 Profitability Pre paid subscriber roaming ERP
34 Profitability Pre paid VAS revenue ERP
35 Profitability Pre paid SMS revenue ERP
36 Profitability Pre paid data revenue ERP
37 Profitability Pre paid total revenue ERP
38 Profitability Mobile handset and accessories sales ERP
39 Profitability Miscellaneous revenue ERP
40 Profitability Total VAS revenue ERP
41 Profitability Total other revenue ERP
42 Profitability Handsets/spare parts cost ERP
43 Profitability License and management fees ERP
44 Profitability Staff cost (salaries, bonus, etc.) ERP
45 Profitability Marketing expenses ERP
46 Profitability Leased lines ERP
47 Profitability IT maintenance and repairs ERP
48 Profitability Network maintenance and repairs ERP
49 Profitability Network utilities expenses ERP
50 Profitability Network rent expenses ERP
51 Profitability Office and other rent ERP
52 Profitability Office and other utilities ERP
53 Profitability Management fees ERP
54 Profitability Bad debt provisioning ERP
55 Profitability Billing expenses ERP

82
56 Profitability Training expenses ERP
57 Profitability Consulting expenses ERP
58 Profitability Insurance expenses ERP
59 Profitability Business travel expenses ERP
60 Profitability All other OPEX items ERP
61 Profitability Maintenance ERP
62 Profitability Rent and utilities ERP
63 Profitability Connection incentive ERP
64 Profitability MNO Foundation ERP
65 Profitability Regulatory fees ERP
66 Profitability Service provider discounts ERP
67 Profitability Dealer commissions ERP
68 Profitability SIM cards cost ERP
69 Profitability Scratch card cost ERP
70 Profitability Total operating expenses (OPEX) ERP
71 Profitability OPEX percentage of revenue ERP
72 Profitability Earnings before interest, tax, depreciation and amortisation (EBITDA) ERP
73 Profitability EBIDTA percentage ERP
74 Profitability Operating margin ERP
75 Profitability Foreign exchange gain/(loss) ERP
76 Profitability Financing costs (interest, fees, etc.) ERP
77 Profitability Interest received ERP
78 Profitability Other non operating items ERP
79 Profitability Taxes ERP
80 Profitability Net profit/(loss) ERP
81 Profitability Return on sales (Net profit/total revenue) ERP
82 Profitability Effective tax rate ERP
83 Profitability Dividends paid ERP
84 Profitability Finance department ERP
85 Profitability Commercial department ERP
86 Profitability Admin department ERP
87 Profitability IS department ERP
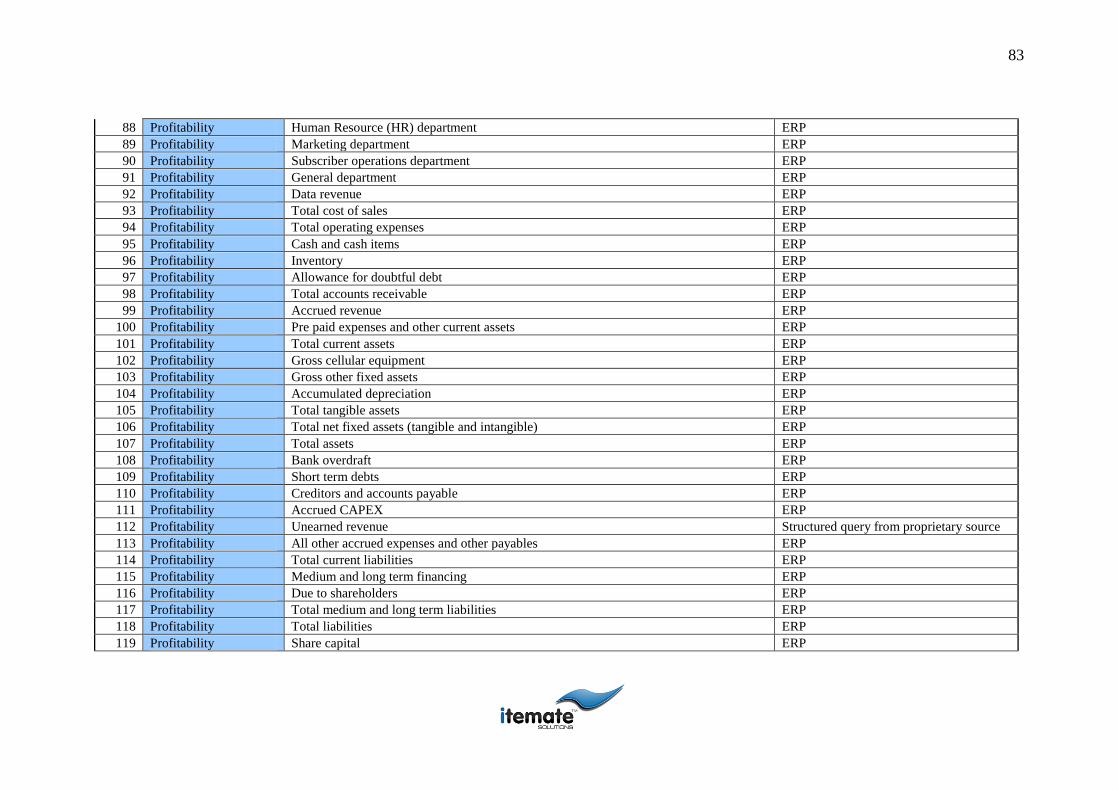
83
88 Profitability Human Resource (HR) department ERP
89 Profitability Marketing department ERP
90 Profitability Subscriber operations department ERP
91 Profitability General department ERP
92 Profitability Data revenue ERP
93 Profitability Total cost of sales ERP
94 Profitability Total operating expenses ERP
95 Profitability Cash and cash items ERP
96 Profitability Inventory ERP
97 Profitability Allowance for doubtful debt ERP
98 Profitability Total accounts receivable ERP
99 Profitability Accrued revenue ERP
100 Profitability Pre paid expenses and other current assets ERP
101 Profitability Total current assets ERP
102 Profitability Gross cellular equipment ERP
103 Profitability Gross other fixed assets ERP
104 Profitability Accumulated depreciation ERP
105 Profitability Total tangible assets ERP
106 Profitability Total net fixed assets (tangible and intangible) ERP
107 Profitability Total assets ERP
108 Profitability Bank overdraft ERP
109 Profitability Short term debts ERP
110 Profitability Creditors and accounts payable ERP
111 Profitability Accrued CAPEX ERP
112 Profitability Unearned revenue Structured query from proprietary source
113 Profitability All other accrued expenses and other payables ERP
114 Profitability Total current liabilities ERP
115 Profitability Medium and long term financing ERP
116 Profitability Due to shareholders ERP
117 Profitability Total medium and long term liabilities ERP
118 Profitability Total liabilities ERP
119 Profitability Share capital ERP
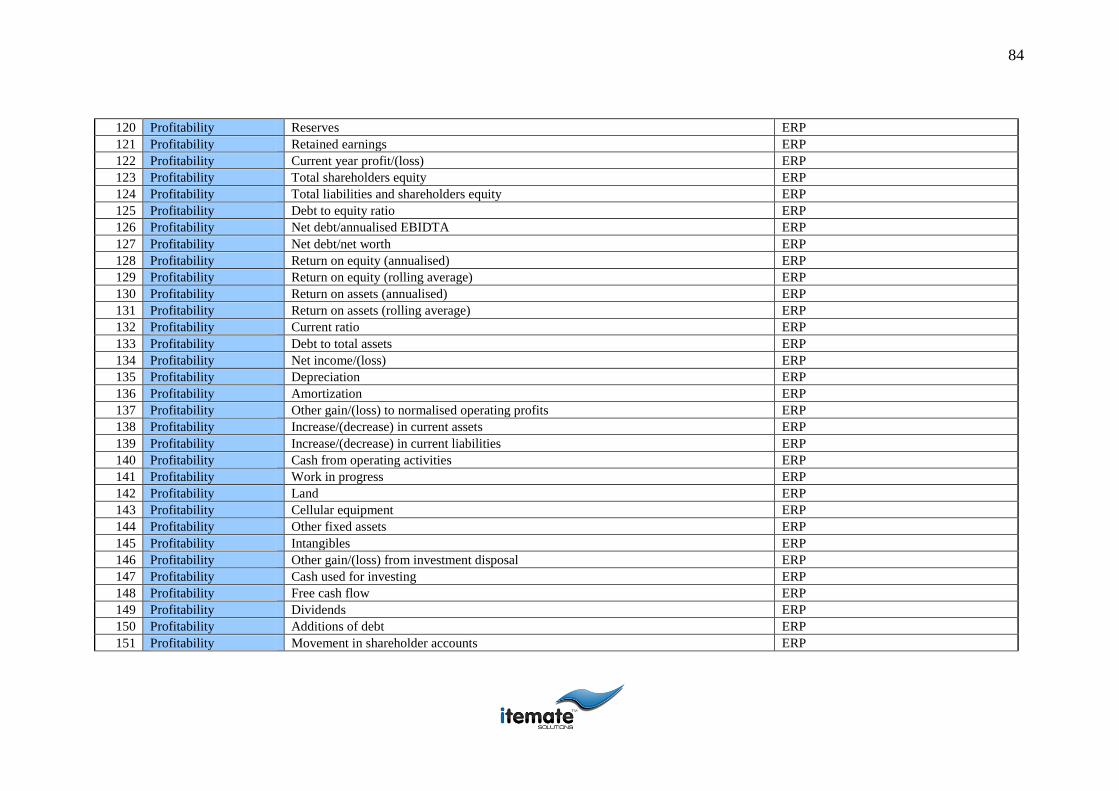
84
120 Profitability Reserves ERP
121 Profitability Retained earnings ERP
122 Profitability Current year profit/(loss) ERP
123 Profitability Total shareholders equity ERP
124 Profitability Total liabilities and shareholders equity ERP
125 Profitability Debt to equity ratio ERP
126 Profitability Net debt/annualised EBIDTA ERP
127 Profitability Net debt/net worth ERP
128 Profitability Return on equity (annualised) ERP
129 Profitability Return on equity (rolling average) ERP
130 Profitability Return on assets (annualised) ERP
131 Profitability Return on assets (rolling average) ERP
132 Profitability Current ratio ERP
133 Profitability Debt to total assets ERP
134 Profitability Net income/(loss) ERP
135 Profitability Depreciation ERP
136 Profitability Amortization ERP
137 Profitability Other gain/(loss) to normalised operating profits ERP
138 Profitability Increase/(decrease) in current assets ERP
139 Profitability Increase/(decrease) in current liabilities ERP
140 Profitability Cash from operating activities ERP
141 Profitability Work in progress ERP
142 Profitability Land ERP
143 Profitability Cellular equipment ERP
144 Profitability Other fixed assets ERP
145 Profitability Intangibles ERP
146 Profitability Other gain/(loss) from investment disposal ERP
147 Profitability Cash used for investing ERP
148 Profitability Free cash flow ERP
149 Profitability Dividends ERP
150 Profitability Additions of debt ERP
151 Profitability Movement in shareholder accounts ERP
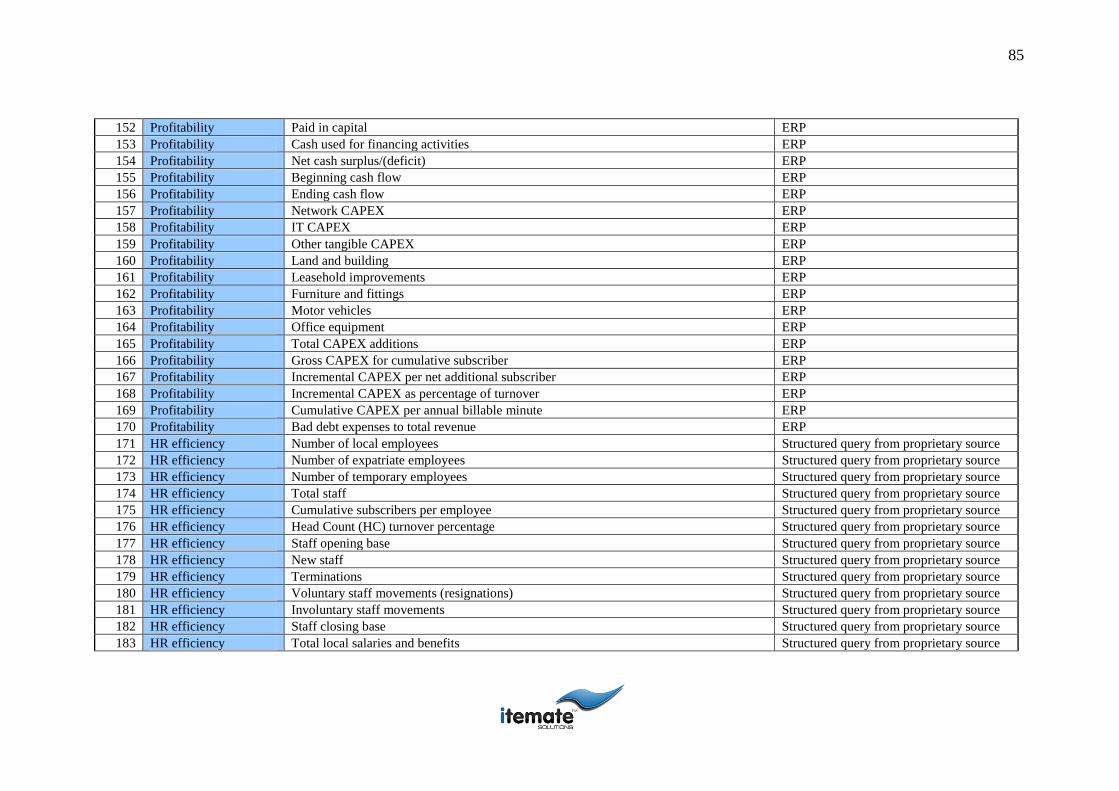
85
152 Profitability Paid in capital ERP
153 Profitability Cash used for financing activities ERP
154 Profitability Net cash surplus/(deficit) ERP
155 Profitability Beginning cash flow ERP
156 Profitability Ending cash flow ERP
157 Profitability Network CAPEX ERP
158 Profitability IT CAPEX ERP
159 Profitability Other tangible CAPEX ERP
160 Profitability Land and building ERP
161 Profitability Leasehold improvements ERP
162 Profitability Furniture and fittings ERP
163 Profitability Motor vehicles ERP
164 Profitability Office equipment ERP
165 Profitability Total CAPEX additions ERP
166 Profitability Gross CAPEX for cumulative subscriber ERP
167 Profitability Incremental CAPEX per net additional subscriber ERP
168 Profitability Incremental CAPEX as percentage of turnover ERP
169 Profitability Cumulative CAPEX per annual billable minute ERP
170 Profitability Bad debt expenses to total revenue ERP
171 HR efficiency Number of local employees Structured query from proprietary source
172 HR efficiency Number of expatriate employees Structured query from proprietary source
173 HR efficiency Number of temporary employees Structured query from proprietary source
174 HR efficiency Total staff Structured query from proprietary source
175 HR efficiency Cumulative subscribers per employee Structured query from proprietary source
176 HR efficiency Head Count (HC) turnover percentage Structured query from proprietary source
177 HR efficiency Staff opening base Structured query from proprietary source
178 HR efficiency New staff Structured query from proprietary source
179 HR efficiency Terminations Structured query from proprietary source
180 HR efficiency Voluntary staff movements (resignations) Structured query from proprietary source
181 HR efficiency Involuntary staff movements Structured query from proprietary source
182 HR efficiency Staff closing base Structured query from proprietary source
183 HR efficiency Total local salaries and benefits Structured query from proprietary source
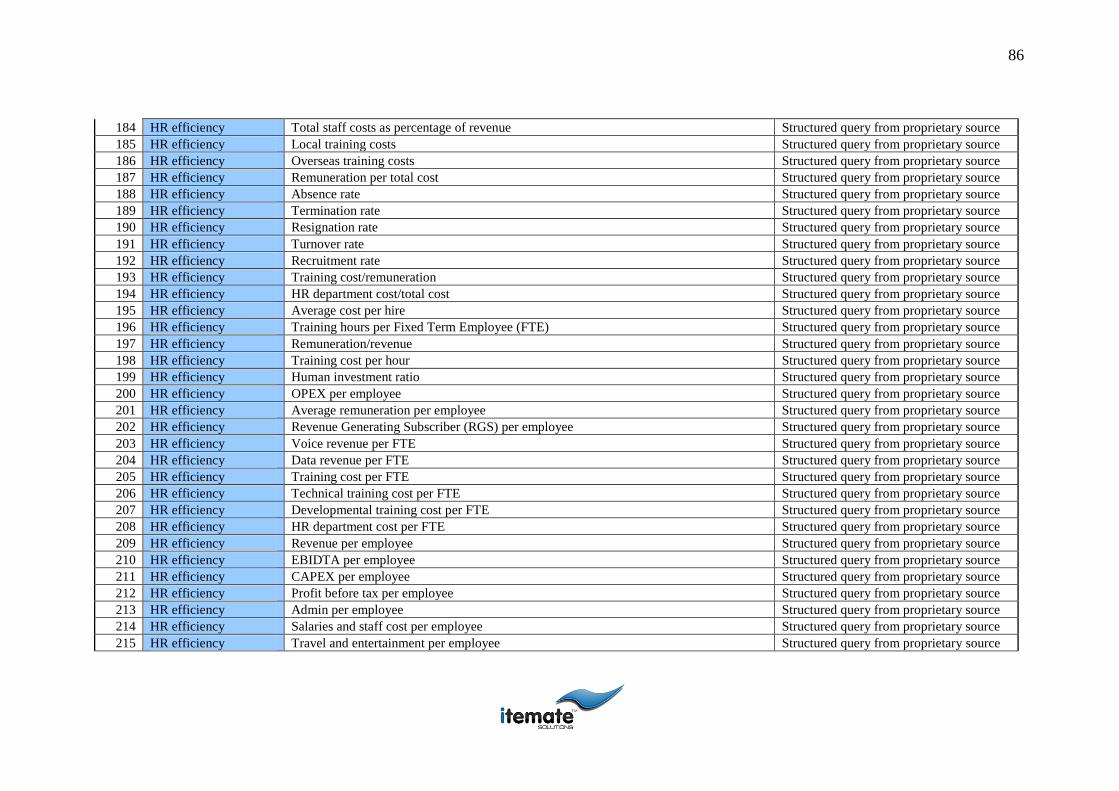
86
184 HR efficiency Total staff costs as percentage of revenue Structured query from proprietary source
185 HR efficiency Local training costs Structured query from proprietary source
186 HR efficiency Overseas training costs Structured query from proprietary source
187 HR efficiency Remuneration per total cost Structured query from proprietary source
188 HR efficiency Absence rate Structured query from proprietary source
189 HR efficiency Termination rate Structured query from proprietary source
190 HR efficiency Resignation rate Structured query from proprietary source
191 HR efficiency Turnover rate Structured query from proprietary source
192 HR efficiency Recruitment rate Structured query from proprietary source
193 HR efficiency Training cost/remuneration Structured query from proprietary source
194 HR efficiency HR department cost/total cost Structured query from proprietary source
195 HR efficiency Average cost per hire Structured query from proprietary source
196 HR efficiency Training hours per Fixed Term Employee (FTE) Structured query from proprietary source
197 HR efficiency Remuneration/revenue Structured query from proprietary source
198 HR efficiency Training cost per hour Structured query from proprietary source
199 HR efficiency Human investment ratio Structured query from proprietary source
200 HR efficiency OPEX per employee Structured query from proprietary source
201 HR efficiency Average remuneration per employee Structured query from proprietary source
202 HR efficiency Revenue Generating Subscriber (RGS) per employee Structured query from proprietary source
203 HR efficiency Voice revenue per FTE Structured query from proprietary source
204 HR efficiency Data revenue per FTE Structured query from proprietary source
205 HR efficiency Training cost per FTE Structured query from proprietary source
206 HR efficiency Technical training cost per FTE Structured query from proprietary source
207 HR efficiency Developmental training cost per FTE Structured query from proprietary source
208 HR efficiency HR department cost per FTE Structured query from proprietary source
209 HR efficiency Revenue per employee Structured query from proprietary source
210 HR efficiency EBIDTA per employee Structured query from proprietary source
211 HR efficiency CAPEX per employee Structured query from proprietary source
212 HR efficiency Profit before tax per employee Structured query from proprietary source
213 HR efficiency Admin per employee Structured query from proprietary source
214 HR efficiency Salaries and staff cost per employee Structured query from proprietary source
215 HR efficiency Travel and entertainment per employee Structured query from proprietary source
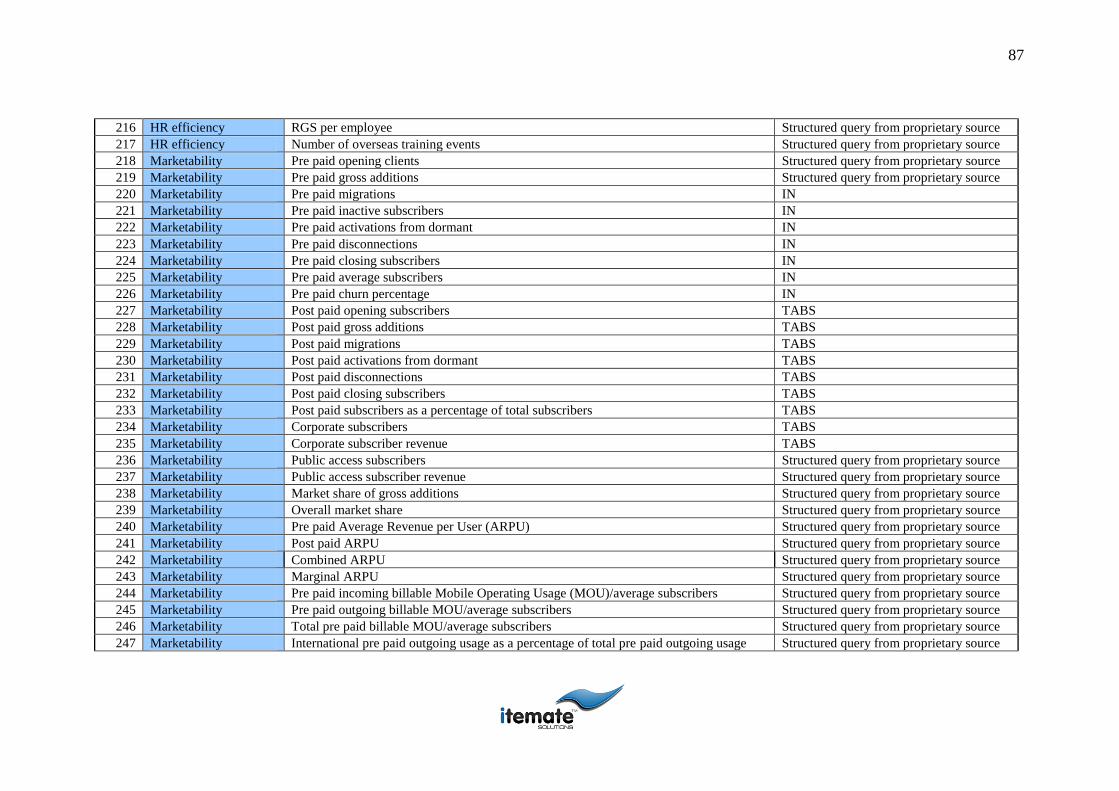
87
216 HR efficiency RGS per employee Structured query from proprietary source
217 HR efficiency Number of overseas training events Structured query from proprietary source
218 Marketability Pre paid opening clients Structured query from proprietary source
219 Marketability Pre paid gross additions Structured query from proprietary source
220 Marketability Pre paid migrations IN
221 Marketability Pre paid inactive subscribers IN
222 Marketability Pre paid activations from dormant IN
223 Marketability Pre paid disconnections IN
224 Marketability Pre paid closing subscribers IN
225 Marketability Pre paid average subscribers IN
226 Marketability Pre paid churn percentage IN
227 Marketability Post paid opening subscribers TABS
228 Marketability Post paid gross additions TABS
229 Marketability Post paid migrations TABS
230 Marketability Post paid activations from dormant TABS
231 Marketability Post paid disconnections TABS
232 Marketability Post paid closing subscribers TABS
233 Marketability Post paid subscribers as a percentage of total subscribers TABS
234 Marketability Corporate subscribers TABS
235 Marketability Corporate subscriber revenue TABS
236 Marketability Public access subscribers Structured query from proprietary source
237 Marketability Public access subscriber revenue Structured query from proprietary source
238 Marketability Market share of gross additions Structured query from proprietary source
239 Marketability Overall market share Structured query from proprietary source
240 Marketability Pre paid Average Revenue per User (ARPU) Structured query from proprietary source
241 Marketability Post paid ARPU Structured query from proprietary source
242 Marketability Combined ARPU Structured query from proprietary source
243 Marketability Marginal ARPU Structured query from proprietary source
244 Marketability Pre paid incoming billable Mobile Operating Usage (MOU)/average subscribers Structured query from proprietary source
245 Marketability Pre paid outgoing billable MOU/average subscribers Structured query from proprietary source
246 Marketability Total pre paid billable MOU/average subscribers Structured query from proprietary source
247 Marketability International pre paid outgoing usage as a percentage of total pre paid outgoing usage Structured query from proprietary source
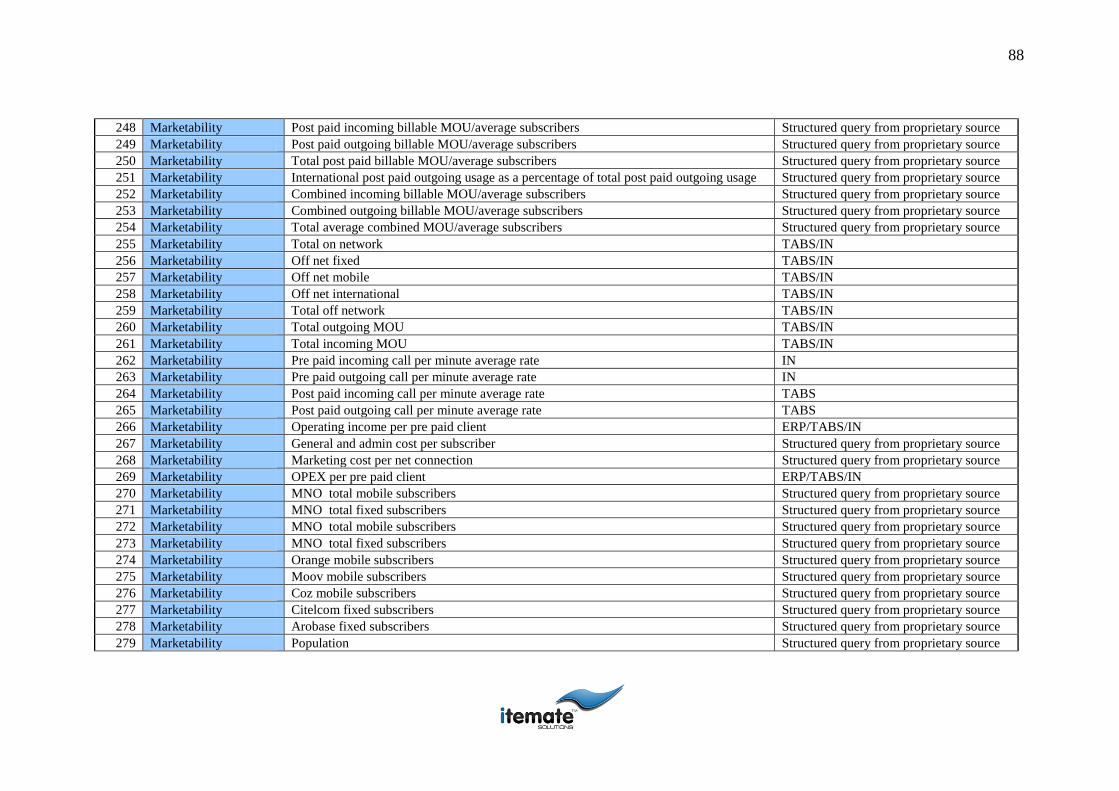
88
248 Marketability Post paid incoming billable MOU/average subscribers Structured query from proprietary source
249 Marketability Post paid outgoing billable MOU/average subscribers Structured query from proprietary source
250 Marketability Total post paid billable MOU/average subscribers Structured query from proprietary source
251 Marketability International post paid outgoing usage as a percentage of total post paid outgoing usage Structured query from proprietary source
252 Marketability Combined incoming billable MOU/average subscribers Structured query from proprietary source
253 Marketability Combined outgoing billable MOU/average subscribers Structured query from proprietary source
254 Marketability Total average combined MOU/average subscribers Structured query from proprietary source
255 Marketability Total on network TABS/IN
256 Marketability Off net fixed TABS/IN
257 Marketability Off net mobile TABS/IN
258 Marketability Off net international TABS/IN
259 Marketability Total off network TABS/IN
260 Marketability Total outgoing MOU TABS/IN
261 Marketability Total incoming MOU TABS/IN
262 Marketability Pre paid incoming call per minute average rate IN
263 Marketability Pre paid outgoing call per minute average rate IN
264 Marketability Post paid incoming call per minute average rate TABS
265 Marketability Post paid outgoing call per minute average rate TABS
266 Marketability Operating income per pre paid client ERP/TABS/IN
267 Marketability General and admin cost per subscriber Structured query from proprietary source
268 Marketability Marketing cost per net connection Structured query from proprietary source
269 Marketability OPEX per pre paid client ERP/TABS/IN
270 Marketability MNO total mobile subscribers Structured query from proprietary source
271 Marketability MNO total fixed subscribers Structured query from proprietary source
272 Marketability MNO total mobile subscribers Structured query from proprietary source
273 Marketability MNO total fixed subscribers Structured query from proprietary source
274 Marketability Orange mobile subscribers Structured query from proprietary source
275 Marketability Moov mobile subscribers Structured query from proprietary source
276 Marketability Coz mobile subscribers Structured query from proprietary source
277 Marketability Citelcom fixed subscribers Structured query from proprietary source
278 Marketability Arobase fixed subscribers Structured query from proprietary source
279 Marketability Population Structured query from proprietary source
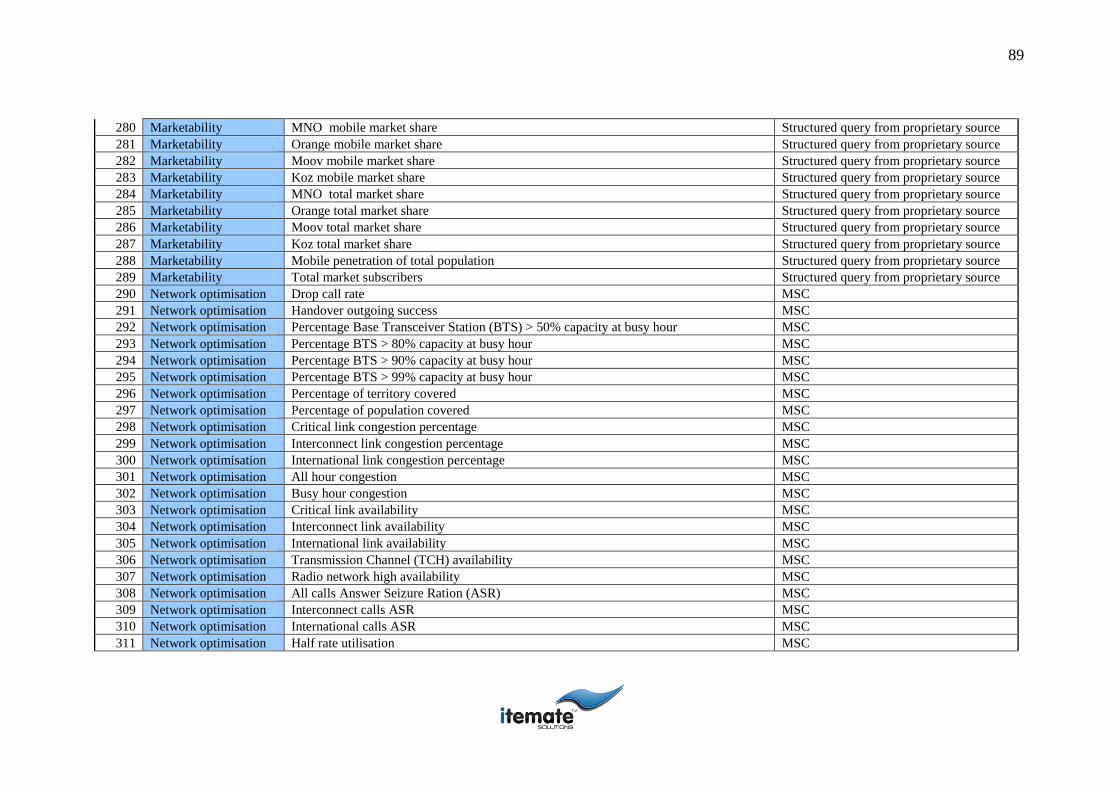
89
280 Marketability MNO mobile market share Structured query from proprietary source
281 Marketability Orange mobile market share Structured query from proprietary source
282 Marketability Moov mobile market share Structured query from proprietary source
283 Marketability Koz mobile market share Structured query from proprietary source
284 Marketability MNO total market share Structured query from proprietary source
285 Marketability Orange total market share Structured query from proprietary source
286 Marketability Moov total market share Structured query from proprietary source
287 Marketability Koz total market share Structured query from proprietary source
288 Marketability Mobile penetration of total population Structured query from proprietary source
289 Marketability Total market subscribers Structured query from proprietary source
290 Network optimisation Drop call rate MSC
291 Network optimisation Handover outgoing success MSC
292 Network optimisation Percentage Base Transceiver Station (BTS) > 50% capacity at busy hour MSC
293 Network optimisation Percentage BTS > 80% capacity at busy hour MSC
294 Network optimisation Percentage BTS > 90% capacity at busy hour MSC
295 Network optimisation Percentage BTS > 99% capacity at busy hour MSC
296 Network optimisation Percentage of territory covered MSC
297 Network optimisation Percentage of population covered MSC
298 Network optimisation Critical link congestion percentage MSC
299 Network optimisation Interconnect link congestion percentage MSC
300 Network optimisation International link congestion percentage MSC
301 Network optimisation All hour congestion MSC
302 Network optimisation Busy hour congestion MSC
303 Network optimisation Critical link availability MSC
304 Network optimisation Interconnect link availability MSC
305 Network optimisation International link availability MSC
306 Network optimisation Transmission Channel (TCH) availability MSC
307 Network optimisation Radio network high availability MSC
308 Network optimisation All calls Answer Seizure Ration (ASR) MSC
309 Network optimisation Interconnect calls ASR MSC
310 Network optimisation International calls ASR MSC
311 Network optimisation Half rate utilisation MSC
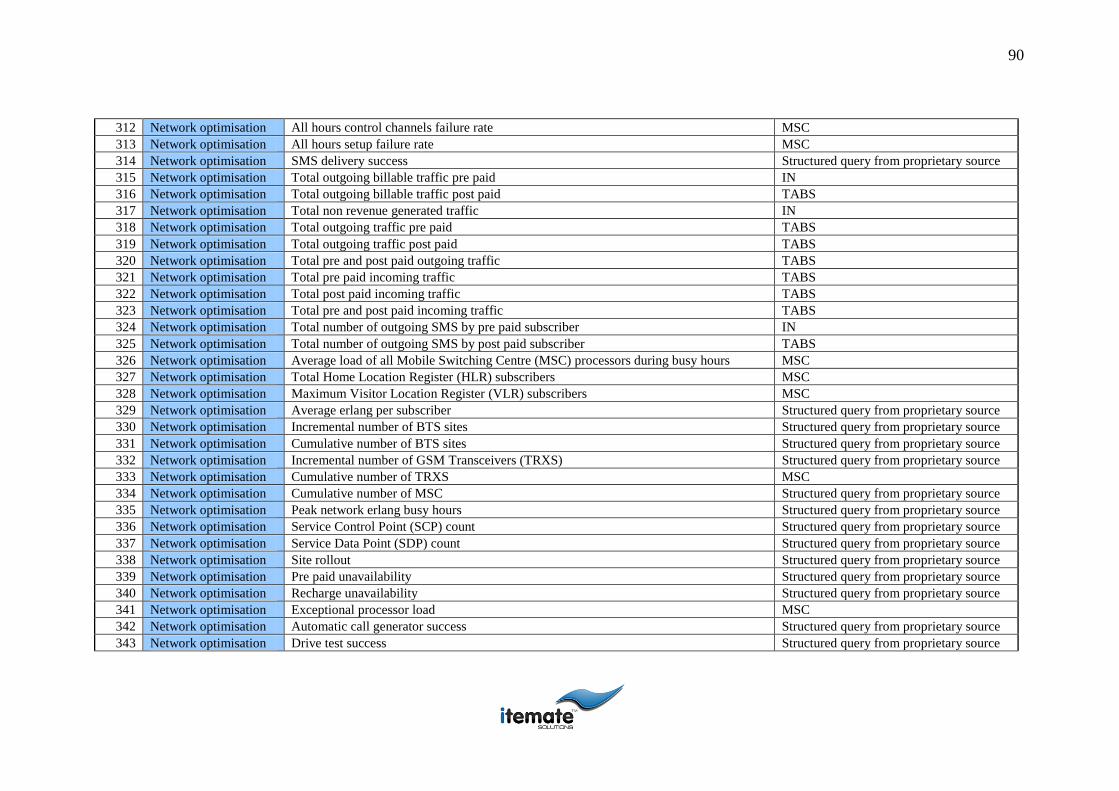
90
312 Network optimisation All hours control channels failure rate MSC
313 Network optimisation All hours setup failure rate MSC
314 Network optimisation SMS delivery success Structured query from proprietary source
315 Network optimisation Total outgoing billable traffic pre paid IN
316 Network optimisation Total outgoing billable traffic post paid TABS
317 Network optimisation Total non revenue generated traffic IN
318 Network optimisation Total outgoing traffic pre paid TABS
319 Network optimisation Total outgoing traffic post paid TABS
320 Network optimisation Total pre and post paid outgoing traffic TABS
321 Network optimisation Total pre paid incoming traffic TABS
322 Network optimisation Total post paid incoming traffic TABS
323 Network optimisation Total pre and post paid incoming traffic TABS
324 Network optimisation Total number of outgoing SMS by pre paid subscriber IN
325 Network optimisation Total number of outgoing SMS by post paid subscriber TABS
326 Network optimisation Average load of all Mobile Switching Centre (MSC) processors during busy hours MSC
327 Network optimisation Total Home Location Register (HLR) subscribers MSC
328 Network optimisation Maximum Visitor Location Register (VLR) subscribers MSC
329 Network optimisation Average erlang per subscriber Structured query from proprietary source
330 Network optimisation Incremental number of BTS sites Structured query from proprietary source
331 Network optimisation Cumulative number of BTS sites Structured query from proprietary source
332 Network optimisation Incremental number of GSM Transceivers (TRXS) Structured query from proprietary source
333 Network optimisation Cumulative number of TRXS MSC
334 Network optimisation Cumulative number of MSC Structured query from proprietary source
335 Network optimisation Peak network erlang busy hours Structured query from proprietary source
336 Network optimisation Service Control Point (SCP) count Structured query from proprietary source
337 Network optimisation Service Data Point (SDP) count Structured query from proprietary source
338 Network optimisation Site rollout Structured query from proprietary source
339 Network optimisation Pre paid unavailability Structured query from proprietary source
340 Network optimisation Recharge unavailability Structured query from proprietary source
341 Network optimisation Exceptional processor load MSC
342 Network optimisation Automatic call generator success Structured query from proprietary source
343 Network optimisation Drive test success Structured query from proprietary source
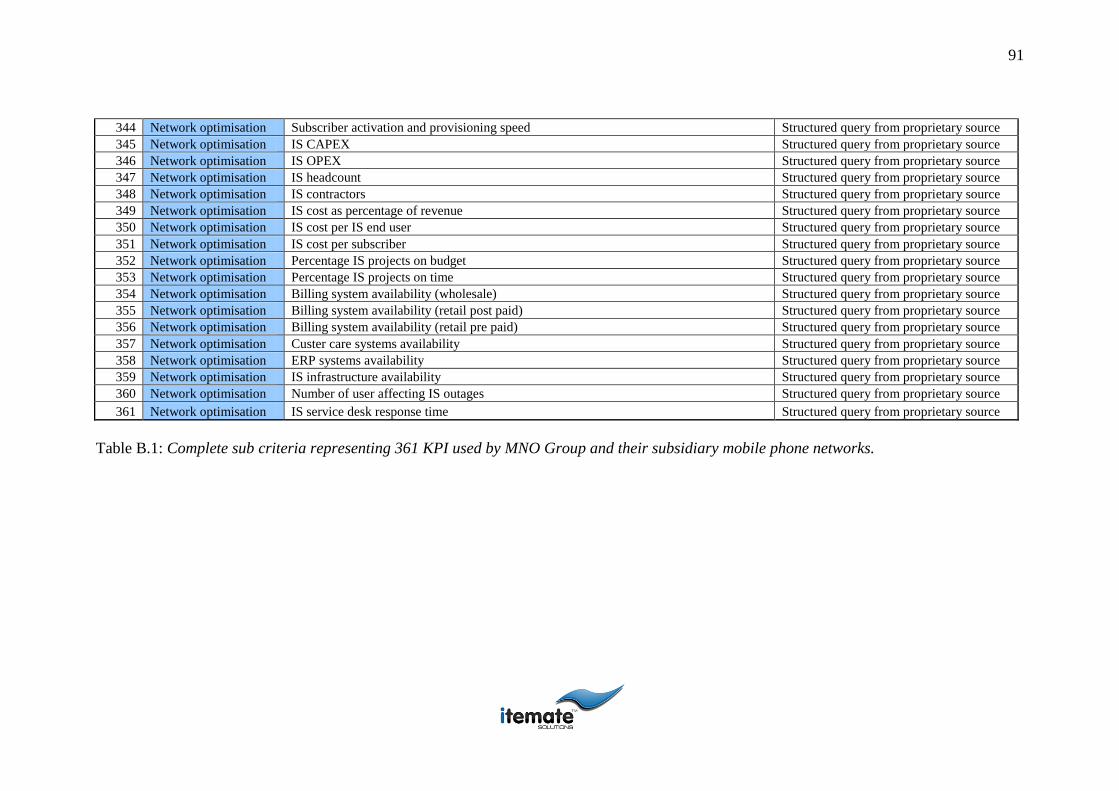
91
344 Network optimisation Subscriber activation and provisioning speed Structured query from proprietary source
345 Network optimisation IS CAPEX Structured query from proprietary source
346 Network optimisation IS OPEX Structured query from proprietary source
347 Network optimisation IS headcount Structured query from proprietary source
348 Network optimisation IS contractors Structured query from proprietary source
349 Network optimisation IS cost as percentage of revenue Structured query from proprietary source
350 Network optimisation IS cost per IS end user Structured query from proprietary source
351 Network optimisation IS cost per subscriber Structured query from proprietary source
352 Network optimisation Percentage IS projects on budget Structured query from proprietary source
353 Network optimisation Percentage IS projects on time Structured query from proprietary source
354 Network optimisation Billing system availability (wholesale) Structured query from proprietary source
355 Network optimisation Billing system availability (retail post paid) Structured query from proprietary source
356 Network optimisation Billing system availability (retail pre paid) Structured query from proprietary source
357 Network optimisation Custer care systems availability Structured query from proprietary source
358 Network optimisation ERP systems availability Structured query from proprietary source
359 Network optimisation IS infrastructure availability Structured query from proprietary source
360 Network optimisation Number of user affecting IS outages Structured query from proprietary source
361 Network optimisation IS service desk response time Structured query from proprietary source
Table B.1: Complete sub criteria representing 361 KPI used by MNO Group and their subsidiary mobile phone networks.
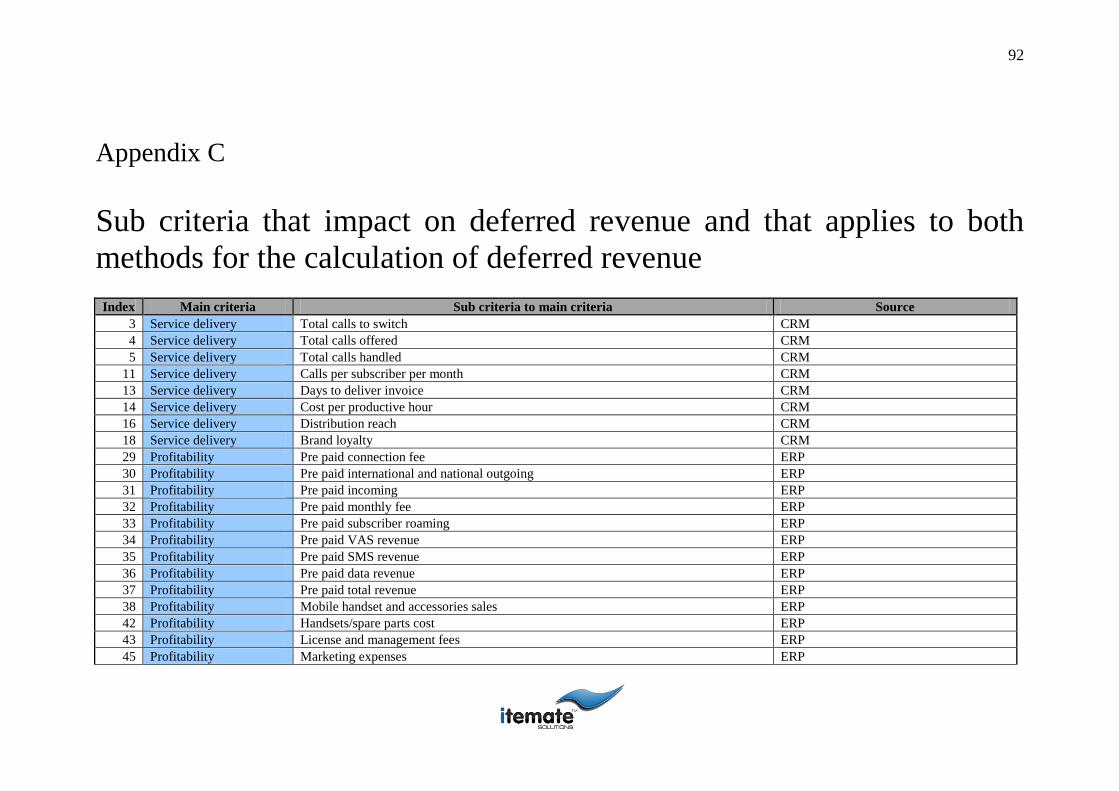
92
Appendix C
C. Sub criteria that impact on deferred revenue and that applies to both
methods for the calculation of deferred revenue
Index Main criteria Sub criteria to main criteria Source
3 Service delivery Total calls to switch CRM
4 Service delivery Total calls offered CRM
5 Service delivery Total calls handled CRM
11 Service delivery Calls per subscriber per month CRM
13 Service delivery Days to deliver invoice CRM
14 Service delivery Cost per productive hour CRM
16 Service delivery Distribution reach CRM
18 Service delivery Brand loyalty CRM
29 Profitability Pre paid connection fee ERP
30 Profitability Pre paid international and national outgoing ERP
31 Profitability Pre paid incoming ERP
32 Profitability Pre paid monthly fee ERP
33 Profitability Pre paid subscriber roaming ERP
34 Profitability Pre paid VAS revenue ERP
35 Profitability Pre paid SMS revenue ERP
36 Profitability Pre paid data revenue ERP
37 Profitability Pre paid total revenue ERP
38 Profitability Mobile handset and accessories sales ERP
42 Profitability Handsets/spare parts cost ERP
43 Profitability License and management fees ERP
45 Profitability Marketing expenses ERP

93
54 Profitability Bad debt provisioning ERP
55 Profitability Billing expenses ERP
56 Profitability Training expenses ERP
57 Profitability Consulting expenses ERP
58 Profitability Insurance expenses ERP
61 Profitability Maintenance ERP
63 Profitability Connection incentive ERP
66 Profitability Service provider discounts ERP
67 Profitability Dealer commissions ERP
68 Profitability SIM cards cost ERP
69 Profitability Scratch card cost ERP
70 Profitability Total operating expenses (OPEX) ERP
71 Profitability OPEX percentage of revenue ERP
72 Profitability Earnings before interest, tax, depreciation and amortisation (EBITDA) ERP
73 Profitability EBIDTA percentage ERP
79 Profitability Taxes ERP
80 Profitability Net profit/(loss) ERP
81 Profitability Return on sales (Net profit/total revenue) ERP
82 Profitability Effective tax rate ERP
92 Profitability Data revenue ERP
93 Profitability Total cost of sales ERP
94 Profitability Total operating expenses ERP
96 Profitability Inventory ERP
97 Profitability Allowance for doubtful debt ERP
98 Profitability Total accounts receivable ERP
99 Profitability Accrued revenue ERP
100 Profitability Pre paid expenses and other current assets ERP
109 Profitability Short term debts ERP
110 Profitability Creditors and accounts payable ERP
112 Profitability Unearned revenue Structured query from proprietary source
121 Profitability Retained earnings ERP
134 Profitability Net income/(loss) ERP
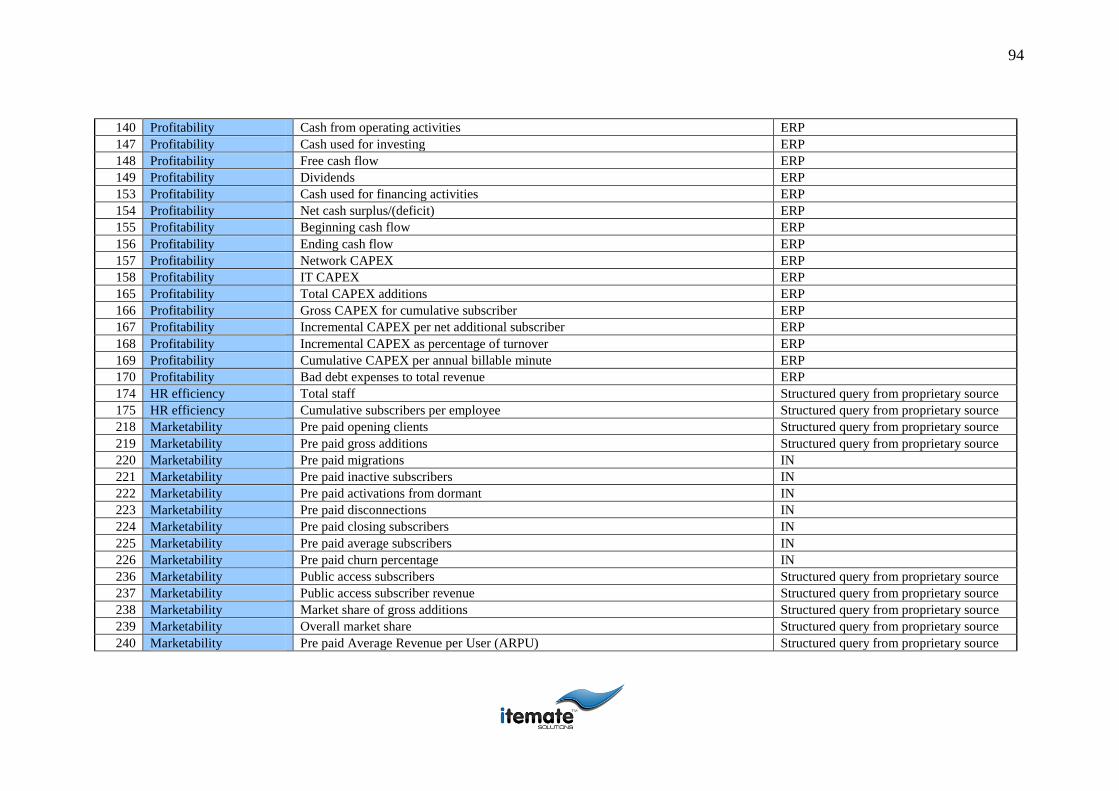
94
140 Profitability Cash from operating activities ERP
147 Profitability Cash used for investing ERP
148 Profitability Free cash flow ERP
149 Profitability Dividends ERP
153 Profitability Cash used for financing activities ERP
154 Profitability Net cash surplus/(deficit) ERP
155 Profitability Beginning cash flow ERP
156 Profitability Ending cash flow ERP
157 Profitability Network CAPEX ERP
158 Profitability IT CAPEX ERP
165 Profitability Total CAPEX additions ERP
166 Profitability Gross CAPEX for cumulative subscriber ERP
167 Profitability Incremental CAPEX per net additional subscriber ERP
168 Profitability Incremental CAPEX as percentage of turnover ERP
169 Profitability Cumulative CAPEX per annual billable minute ERP
170 Profitability Bad debt expenses to total revenue ERP
174 HR efficiency Total staff Structured query from proprietary source
175 HR efficiency Cumulative subscribers per employee Structured query from proprietary source
218 Marketability Pre paid opening clients Structured query from proprietary source
219 Marketability Pre paid gross additions Structured query from proprietary source
220 Marketability Pre paid migrations IN
221 Marketability Pre paid inactive subscribers IN
222 Marketability Pre paid activations from dormant IN
223 Marketability Pre paid disconnections IN
224 Marketability Pre paid closing subscribers IN
225 Marketability Pre paid average subscribers IN
226 Marketability Pre paid churn percentage IN
236 Marketability Public access subscribers Structured query from proprietary source
237 Marketability Public access subscriber revenue Structured query from proprietary source
238 Marketability Market share of gross additions Structured query from proprietary source
239 Marketability Overall market share Structured query from proprietary source
240 Marketability Pre paid Average Revenue per User (ARPU) Structured query from proprietary source
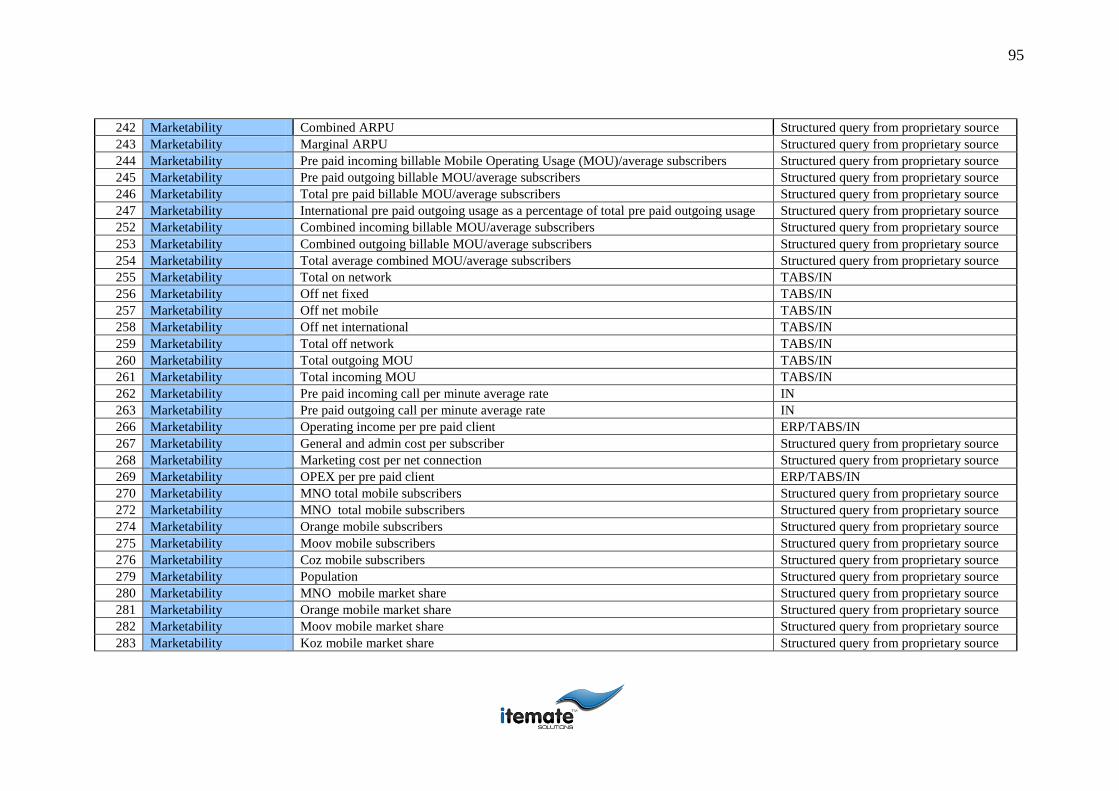
95
242 Marketability Combined ARPU Structured query from proprietary source
243 Marketability Marginal ARPU Structured query from proprietary source
244 Marketability Pre paid incoming billable Mobile Operating Usage (MOU)/average subscribers Structured query from proprietary source
245 Marketability Pre paid outgoing billable MOU/average subscribers Structured query from proprietary source
246 Marketability Total pre paid billable MOU/average subscribers Structured query from proprietary source
247 Marketability International pre paid outgoing usage as a percentage of total pre paid outgoing usage Structured query from proprietary source
252 Marketability Combined incoming billable MOU/average subscribers Structured query from proprietary source
253 Marketability Combined outgoing billable MOU/average subscribers Structured query from proprietary source
254 Marketability Total average combined MOU/average subscribers Structured query from proprietary source
255 Marketability Total on network TABS/IN
256 Marketability Off net fixed TABS/IN
257 Marketability Off net mobile TABS/IN
258 Marketability Off net international TABS/IN
259 Marketability Total off network TABS/IN
260 Marketability Total outgoing MOU TABS/IN
261 Marketability Total incoming MOU TABS/IN
262 Marketability Pre paid incoming call per minute average rate IN
263 Marketability Pre paid outgoing call per minute average rate IN
266 Marketability Operating income per pre paid client ERP/TABS/IN
267 Marketability General and admin cost per subscriber Structured query from proprietary source
268 Marketability Marketing cost per net connection Structured query from proprietary source
269 Marketability OPEX per pre paid client ERP/TABS/IN
270 Marketability MNO total mobile subscribers Structured query from proprietary source
272 Marketability MNO total mobile subscribers Structured query from proprietary source
274 Marketability Orange mobile subscribers Structured query from proprietary source
275 Marketability Moov mobile subscribers Structured query from proprietary source
276 Marketability Coz mobile subscribers Structured query from proprietary source
279 Marketability Population Structured query from proprietary source
280 Marketability MNO mobile market share Structured query from proprietary source
281 Marketability Orange mobile market share Structured query from proprietary source
282 Marketability Moov mobile market share Structured query from proprietary source
283 Marketability Koz mobile market share Structured query from proprietary source
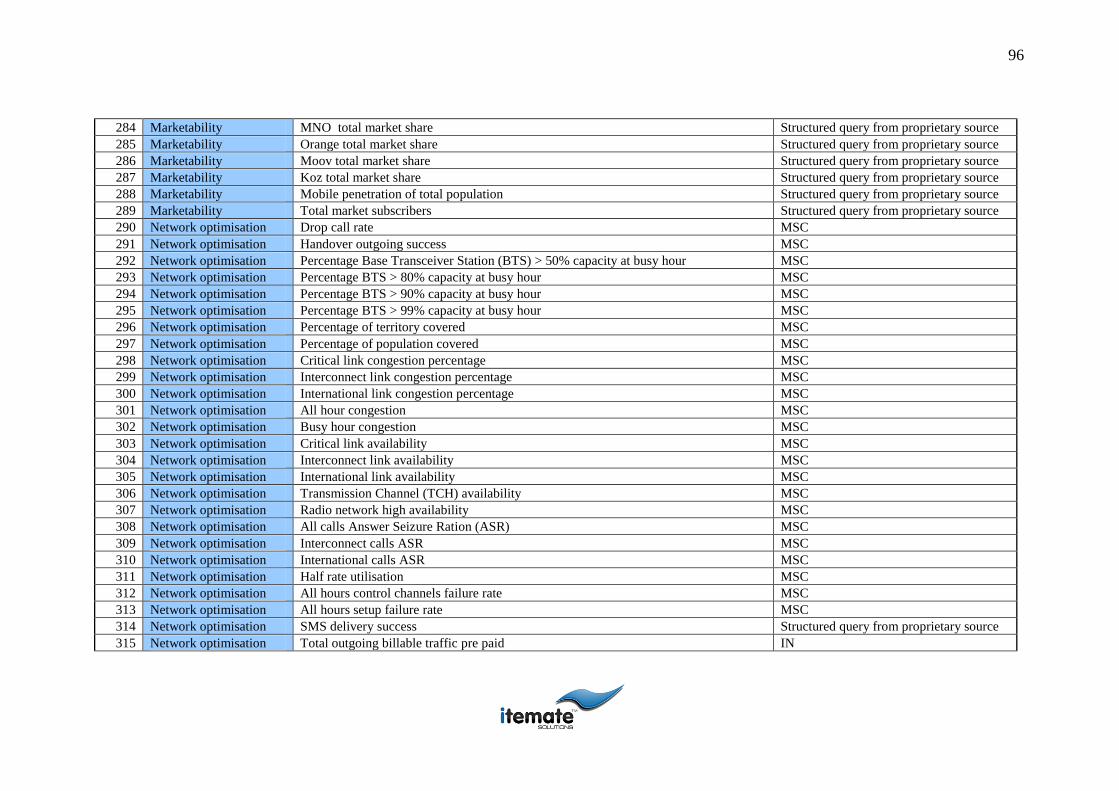
96
284 Marketability MNO total market share Structured query from proprietary source
285 Marketability Orange total market share Structured query from proprietary source
286 Marketability Moov total market share Structured query from proprietary source
287 Marketability Koz total market share Structured query from proprietary source
288 Marketability Mobile penetration of total population Structured query from proprietary source
289 Marketability Total market subscribers Structured query from proprietary source
290 Network optimisation Drop call rate MSC
291 Network optimisation Handover outgoing success MSC
292 Network optimisation Percentage Base Transceiver Station (BTS) > 50% capacity at busy hour MSC
293 Network optimisation Percentage BTS > 80% capacity at busy hour MSC
294 Network optimisation Percentage BTS > 90% capacity at busy hour MSC
295 Network optimisation Percentage BTS > 99% capacity at busy hour MSC
296 Network optimisation Percentage of territory covered MSC
297 Network optimisation Percentage of population covered MSC
298 Network optimisation Critical link congestion percentage MSC
299 Network optimisation Interconnect link congestion percentage MSC
300 Network optimisation International link congestion percentage MSC
301 Network optimisation All hour congestion MSC
302 Network optimisation Busy hour congestion MSC
303 Network optimisation Critical link availability MSC
304 Network optimisation Interconnect link availability MSC
305 Network optimisation International link availability MSC
306 Network optimisation Transmission Channel (TCH) availability MSC
307 Network optimisation Radio network high availability MSC
308 Network optimisation All calls Answer Seizure Ration (ASR) MSC
309 Network optimisation Interconnect calls ASR MSC
310 Network optimisation International calls ASR MSC
311 Network optimisation Half rate utilisation MSC
312 Network optimisation All hours control channels failure rate MSC
313 Network optimisation All hours setup failure rate MSC
314 Network optimisation SMS delivery success Structured query from proprietary source
315 Network optimisation Total outgoing billable traffic pre paid IN
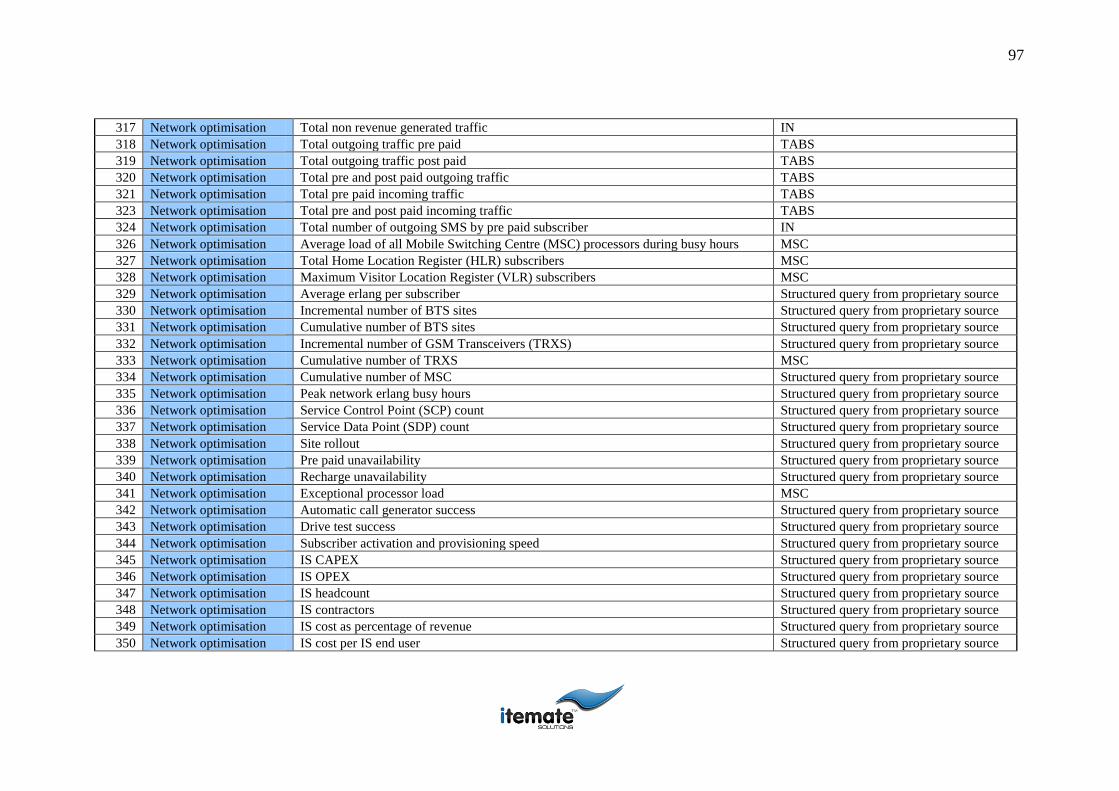
97
317 Network optimisation Total non revenue generated traffic IN
318 Network optimisation Total outgoing traffic pre paid TABS
319 Network optimisation Total outgoing traffic post paid TABS
320 Network optimisation Total pre and post paid outgoing traffic TABS
321 Network optimisation Total pre paid incoming traffic TABS
323 Network optimisation Total pre and post paid incoming traffic TABS
324 Network optimisation Total number of outgoing SMS by pre paid subscriber IN
326 Network optimisation Average load of all Mobile Switching Centre (MSC) processors during busy hours MSC
327 Network optimisation Total Home Location Register (HLR) subscribers MSC
328 Network optimisation Maximum Visitor Location Register (VLR) subscribers MSC
329 Network optimisation Average erlang per subscriber Structured query from proprietary source
330 Network optimisation Incremental number of BTS sites Structured query from proprietary source
331 Network optimisation Cumulative number of BTS sites Structured query from proprietary source
332 Network optimisation Incremental number of GSM Transceivers (TRXS) Structured query from proprietary source
333 Network optimisation Cumulative number of TRXS MSC
334 Network optimisation Cumulative number of MSC Structured query from proprietary source
335 Network optimisation Peak network erlang busy hours Structured query from proprietary source
336 Network optimisation Service Control Point (SCP) count Structured query from proprietary source
337 Network optimisation Service Data Point (SDP) count Structured query from proprietary source
338 Network optimisation Site rollout Structured query from proprietary source
339 Network optimisation Pre paid unavailability Structured query from proprietary source
340 Network optimisation Recharge unavailability Structured query from proprietary source
341 Network optimisation Exceptional processor load MSC
342 Network optimisation Automatic call generator success Structured query from proprietary source
343 Network optimisation Drive test success Structured query from proprietary source
344 Network optimisation Subscriber activation and provisioning speed Structured query from proprietary source
345 Network optimisation IS CAPEX Structured query from proprietary source
346 Network optimisation IS OPEX Structured query from proprietary source
347 Network optimisation IS headcount Structured query from proprietary source
348 Network optimisation IS contractors Structured query from proprietary source
349 Network optimisation IS cost as percentage of revenue Structured query from proprietary source
350 Network optimisation IS cost per IS end user Structured query from proprietary source
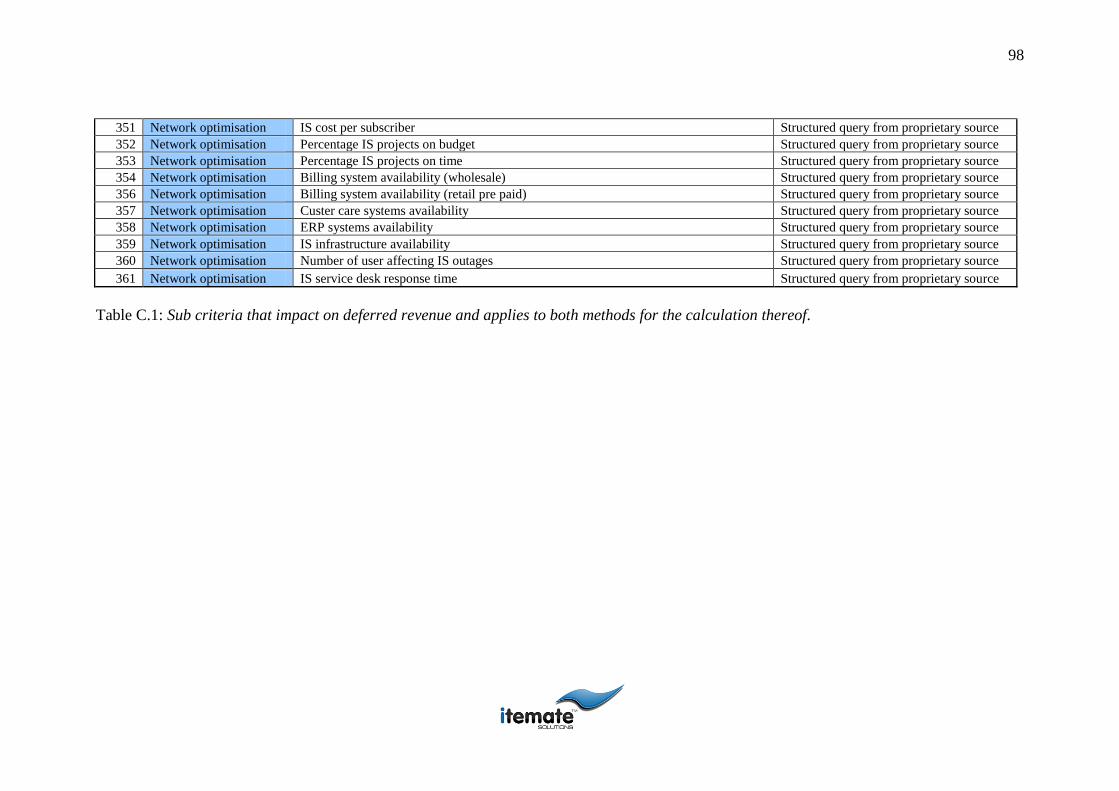
98
351 Network optimisation IS cost per subscriber Structured query from proprietary source
352 Network optimisation Percentage IS projects on budget Structured query from proprietary source
353 Network optimisation Percentage IS projects on time Structured query from proprietary source
354 Network optimisation Billing system availability (wholesale) Structured query from proprietary source
356 Network optimisation Billing system availability (retail pre paid) Structured query from proprietary source
357 Network optimisation Custer care systems availability Structured query from proprietary source
358 Network optimisation ERP systems availability Structured query from proprietary source
359 Network optimisation IS infrastructure availability Structured query from proprietary source
360 Network optimisation Number of user affecting IS outages Structured query from proprietary source
361 Network optimisation IS service desk response time Structured query from proprietary source
Table C.1: Sub criteria that impact on deferred revenue and applies to both methods for the calculation thereof.
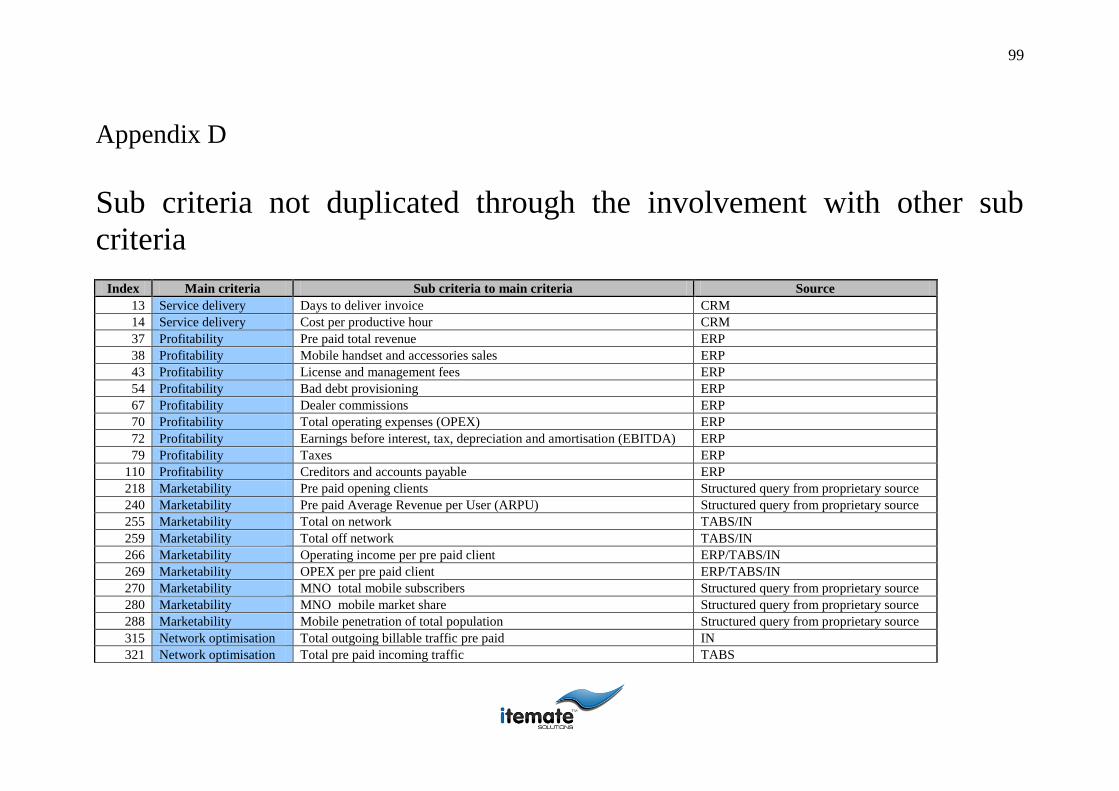
99
Appendix D
D. Sub criteria not duplicated through the involvement with other sub
criteria
Index Main criteria Sub criteria to main criteria Source
13 Service delivery Days to deliver invoice CRM
14 Service delivery Cost per productive hour CRM
37 Profitability Pre paid total revenue ERP
38 Profitability Mobile handset and accessories sales ERP
43 Profitability License and management fees ERP
54 Profitability Bad debt provisioning ERP
67 Profitability Dealer commissions ERP
70 Profitability Total operating expenses (OPEX) ERP
72 Profitability Earnings before interest, tax, depreciation and amortisation (EBITDA) ERP
79 Profitability Taxes ERP
110 Profitability Creditors and accounts payable ERP
218 Marketability Pre paid opening clients Structured query from proprietary source
240 Marketability Pre paid Average Revenue per User (ARPU) Structured query from proprietary source
255 Marketability Total on network TABS/IN
259 Marketability Total off network TABS/IN
266 Marketability Operating income per pre paid client ERP/TABS/IN
269 Marketability OPEX per pre paid client ERP/TABS/IN
270 Marketability MNO total mobile subscribers Structured query from proprietary source
280 Marketability MNO mobile market share Structured query from proprietary source
288 Marketability Mobile penetration of total population Structured query from proprietary source
315 Network optimisation Total outgoing billable traffic pre paid IN
321 Network optimisation Total pre paid incoming traffic TABS
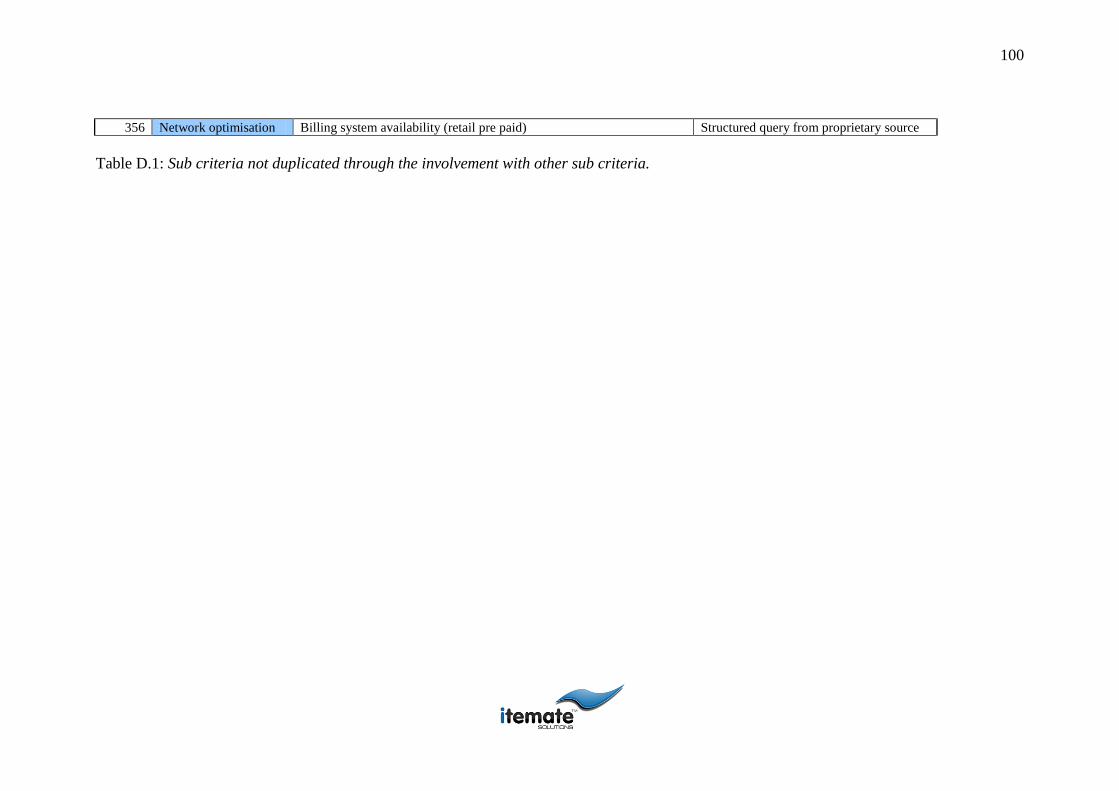
100
356 Network optimisation Billing system availability (retail pre paid) Structured query from proprietary source
Table D.1: Sub criteria not duplicated through the involvement with other sub criteria.
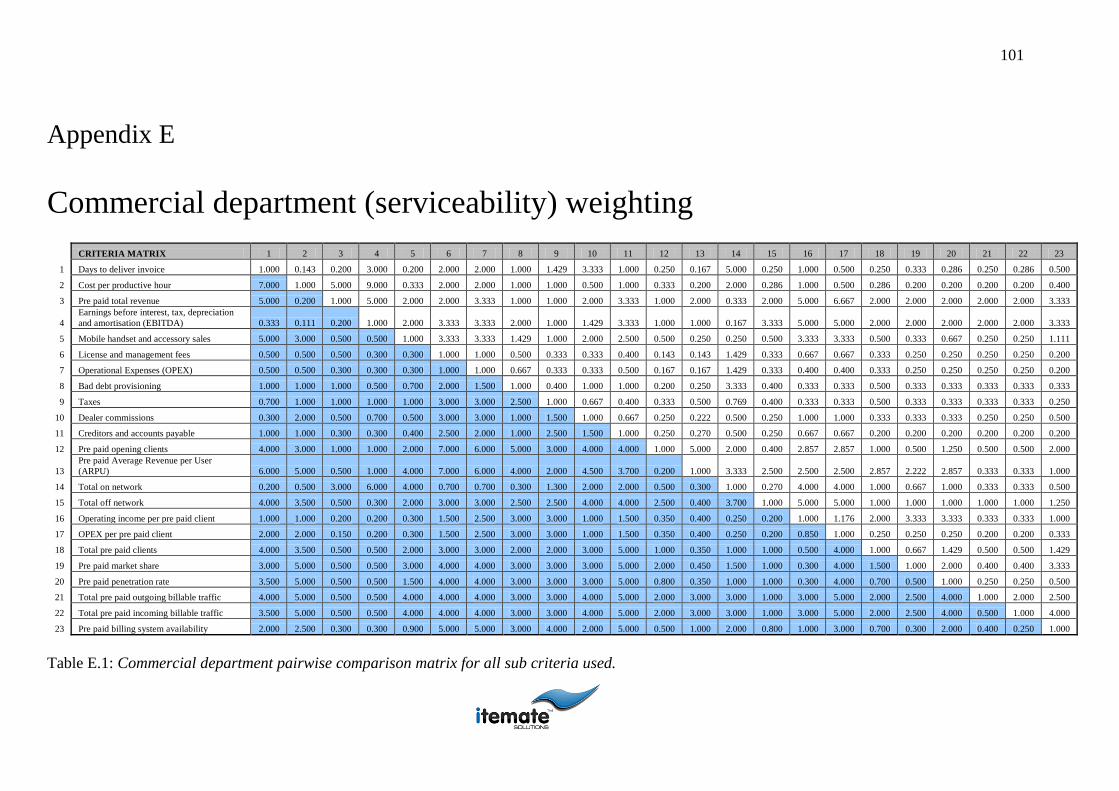
101
Appendix E
E. Commercial department (serviceability) weighting
CRITERIA MATRIX 1 2 3 4 5 6 7 8 9 10 11 12 13 14 15 16 17 18 19 20 21 22 23
1 Days to deliver invoice 1.000 0.143 0.200 3.000 0.200 2.000 2.000 1.000 1.429 3.333 1.000 0.250 0.167 5.000 0.250 1.000 0.500 0.250 0.333 0.286 0.250 0.286 0.500
2 Cost per productive hour 7.000 1.000 5.000 9.000 0.333 2.000 2.000 1.000 1.000 0.500 1.000 0.333 0.200 2.000 0.286 1.000 0.500 0.286 0.200 0.200 0.200 0.200 0.400
3 Pre paid total revenue 5.000 0.200 1.000 5.000 2.000 2.000 3.333 1.000 1.000 2.000 3.333 1.000 2.000 0.333 2.000 5.000 6.667 2.000 2.000 2.000 2.000 2.000 3.333
4
Earnings before interest, tax, depreciation
and amortisation (EBITDA) 0.333 0.111 0.200 1.000 2.000 3.333 3.333 2.000 1.000 1.429 3.333 1.000 1.000 0.167 3.333 5.000 5.000 2.000 2.000 2.000 2.000 2.000 3.333
5 Mobile handset and accessory sales 5.000 3.000 0.500 0.500 1.000 3.333 3.333 1.429 1.000 2.000 2.500 0.500 0.250 0.250 0.500 3.333 3.333 0.500 0.333 0.667 0.250 0.250 1.111
6 License and management fees 0.500 0.500 0.500 0.300 0.300 1.000 1.000 0.500 0.333 0.333 0.400 0.143 0.143 1.429 0.333 0.667 0.667 0.333 0.250 0.250 0.250 0.250 0.200
7 Operational Expenses (OPEX) 0.500 0.500 0.300 0.300 0.300 1.000 1.000 0.667 0.333 0.333 0.500 0.167 0.167 1.429 0.333 0.400 0.400 0.333 0.250 0.250 0.250 0.250 0.200
8 Bad debt provisioning 1.000 1.000 1.000 0.500 0.700 2.000 1.500 1.000 0.400 1.000 1.000 0.200 0.250 3.333 0.400 0.333 0.333 0.500 0.333 0.333 0.333 0.333 0.333
9 Taxes 0.700 1.000 1.000 1.000 1.000 3.000 3.000 2.500 1.000 0.667 0.400 0.333 0.500 0.769 0.400 0.333 0.333 0.500 0.333 0.333 0.333 0.333 0.250
10 Dealer commissions 0.300 2.000 0.500 0.700 0.500 3.000 3.000 1.000 1.500 1.000 0.667 0.250 0.222 0.500 0.250 1.000 1.000 0.333 0.333 0.333 0.250 0.250 0.500
11 Creditors and accounts payable 1.000 1.000 0.300 0.300 0.400 2.500 2.000 1.000 2.500 1.500 1.000 0.250 0.270 0.500 0.250 0.667 0.667 0.200 0.200 0.200 0.200 0.200 0.200
12 Pre paid opening clients 4.000 3.000 1.000 1.000 2.000 7.000 6.000 5.000 3.000 4.000 4.000 1.000 5.000 2.000 0.400 2.857 2.857 1.000 0.500 1.250 0.500 0.500 2.000
13
Pre paid Average Revenue per User
(ARPU) 6.000 5.000 0.500 1.000 4.000 7.000 6.000 4.000 2.000 4.500 3.700 0.200 1.000 3.333 2.500 2.500 2.500 2.857 2.222 2.857 0.333 0.333 1.000
14 Total on network 0.200 0.500 3.000 6.000 4.000 0.700 0.700 0.300 1.300 2.000 2.000 0.500 0.300 1.000 0.270 4.000 4.000 1.000 0.667 1.000 0.333 0.333 0.500
15 Total off network 4.000 3.500 0.500 0.300 2.000 3.000 3.000 2.500 2.500 4.000 4.000 2.500 0.400 3.700 1.000 5.000 5.000 1.000 1.000 1.000 1.000 1.000 1.250
16 Operating income per pre paid client 1.000 1.000 0.200 0.200 0.300 1.500 2.500 3.000 3.000 1.000 1.500 0.350 0.400 0.250 0.200 1.000 1.176 2.000 3.333 3.333 0.333 0.333 1.000
17 OPEX per pre paid client 2.000 2.000 0.150 0.200 0.300 1.500 2.500 3.000 3.000 1.000 1.500 0.350 0.400 0.250 0.200 0.850 1.000 0.250 0.250 0.250 0.200 0.200 0.333
18 Total pre paid clients 4.000 3.500 0.500 0.500 2.000 3.000 3.000 2.000 2.000 3.000 5.000 1.000 0.350 1.000 1.000 0.500 4.000 1.000 0.667 1.429 0.500 0.500 1.429
19 Pre paid market share 3.000 5.000 0.500 0.500 3.000 4.000 4.000 3.000 3.000 3.000 5.000 2.000 0.450 1.500 1.000 0.300 4.000 1.500 1.000 2.000 0.400 0.400 3.333
20 Pre paid penetration rate 3.500 5.000 0.500 0.500 1.500 4.000 4.000 3.000 3.000 3.000 5.000 0.800 0.350 1.000 1.000 0.300 4.000 0.700 0.500 1.000 0.250 0.250 0.500
21 Total pre paid outgoing billable traffic 4.000 5.000 0.500 0.500 4.000 4.000 4.000 3.000 3.000 4.000 5.000 2.000 3.000 3.000 1.000 3.000 5.000 2.000 2.500 4.000 1.000 2.000 2.500
22 Total pre paid incoming billable traffic 3.500 5.000 0.500 0.500 4.000 4.000 4.000 3.000 3.000 4.000 5.000 2.000 3.000 3.000 1.000 3.000 5.000 2.000 2.500 4.000 0.500 1.000 4.000
23 Pre paid billing system availability 2.000 2.500 0.300 0.300 0.900 5.000 5.000 3.000 4.000 2.000 5.000 0.500 1.000 2.000 0.800 1.000 3.000 0.700 0.300 2.000 0.400 0.250 1.000
Table E.1: Commercial department pairwise comparison matrix for all sub criteria used.
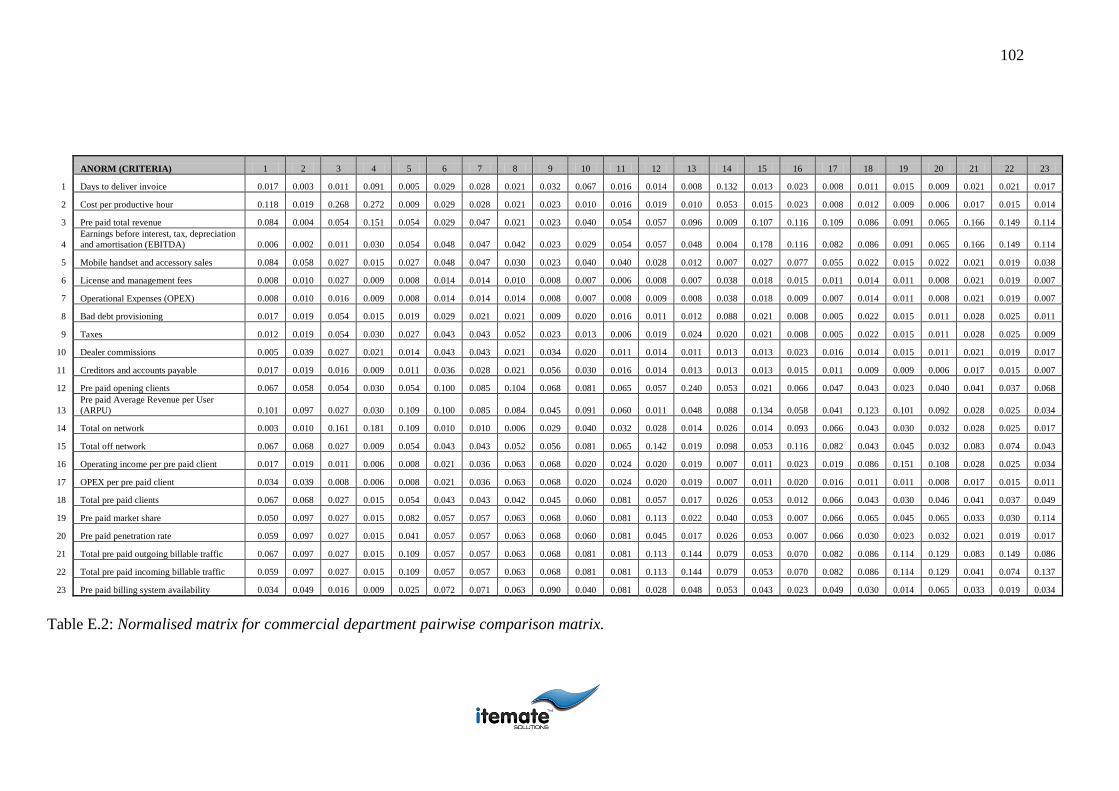
102
ANORM (CRITERIA) 1 2 3 4 5 6 7 8 9 10 11 12 13 14 15 16 17 18 19 20 21 22 23
1 Days to deliver invoice 0.017 0.003 0.011 0.091 0.005 0.029 0.028 0.021 0.032 0.067 0.016 0.014 0.008 0.132 0.013 0.023 0.008 0.011 0.015 0.009 0.021 0.021 0.017
2 Cost per productive hour 0.118 0.019 0.268 0.272 0.009 0.029 0.028 0.021 0.023 0.010 0.016 0.019 0.010 0.053 0.015 0.023 0.008 0.012 0.009 0.006 0.017 0.015 0.014
3 Pre paid total revenue 0.084 0.004 0.054 0.151 0.054 0.029 0.047 0.021 0.023 0.040 0.054 0.057 0.096 0.009 0.107 0.116 0.109 0.086 0.091 0.065 0.166 0.149 0.114
4
Earnings before interest, tax, depreciation
and amortisation (EBITDA) 0.006 0.002 0.011 0.030 0.054 0.048 0.047 0.042 0.023 0.029 0.054 0.057 0.048 0.004 0.178 0.116 0.082 0.086 0.091 0.065 0.166 0.149 0.114
5 Mobile handset and accessory sales 0.084 0.058 0.027 0.015 0.027 0.048 0.047 0.030 0.023 0.040 0.040 0.028 0.012 0.007 0.027 0.077 0.055 0.022 0.015 0.022 0.021 0.019 0.038
6 License and management fees 0.008 0.010 0.027 0.009 0.008 0.014 0.014 0.010 0.008 0.007 0.006 0.008 0.007 0.038 0.018 0.015 0.011 0.014 0.011 0.008 0.021 0.019 0.007
7 Operational Expenses (OPEX) 0.008 0.010 0.016 0.009 0.008 0.014 0.014 0.014 0.008 0.007 0.008 0.009 0.008 0.038 0.018 0.009 0.007 0.014 0.011 0.008 0.021 0.019 0.007
8 Bad debt provisioning 0.017 0.019 0.054 0.015 0.019 0.029 0.021 0.021 0.009 0.020 0.016 0.011 0.012 0.088 0.021 0.008 0.005 0.022 0.015 0.011 0.028 0.025 0.011
9 Taxes 0.012 0.019 0.054 0.030 0.027 0.043 0.043 0.052 0.023 0.013 0.006 0.019 0.024 0.020 0.021 0.008 0.005 0.022 0.015 0.011 0.028 0.025 0.009
10 Dealer commissions 0.005 0.039 0.027 0.021 0.014 0.043 0.043 0.021 0.034 0.020 0.011 0.014 0.011 0.013 0.013 0.023 0.016 0.014 0.015 0.011 0.021 0.019 0.017
11 Creditors and accounts payable 0.017 0.019 0.016 0.009 0.011 0.036 0.028 0.021 0.056 0.030 0.016 0.014 0.013 0.013 0.013 0.015 0.011 0.009 0.009 0.006 0.017 0.015 0.007
12 Pre paid opening clients 0.067 0.058 0.054 0.030 0.054 0.100 0.085 0.104 0.068 0.081 0.065 0.057 0.240 0.053 0.021 0.066 0.047 0.043 0.023 0.040 0.041 0.037 0.068
13
Pre paid Average Revenue per User
(ARPU) 0.101 0.097 0.027 0.030 0.109 0.100 0.085 0.084 0.045 0.091 0.060 0.011 0.048 0.088 0.134 0.058 0.041 0.123 0.101 0.092 0.028 0.025 0.034
14 Total on network 0.003 0.010 0.161 0.181 0.109 0.010 0.010 0.006 0.029 0.040 0.032 0.028 0.014 0.026 0.014 0.093 0.066 0.043 0.030 0.032 0.028 0.025 0.017
15 Total off network 0.067 0.068 0.027 0.009 0.054 0.043 0.043 0.052 0.056 0.081 0.065 0.142 0.019 0.098 0.053 0.116 0.082 0.043 0.045 0.032 0.083 0.074 0.043
16 Operating income per pre paid client 0.017 0.019 0.011 0.006 0.008 0.021 0.036 0.063 0.068 0.020 0.024 0.020 0.019 0.007 0.011 0.023 0.019 0.086 0.151 0.108 0.028 0.025 0.034
17 OPEX per pre paid client 0.034 0.039 0.008 0.006 0.008 0.021 0.036 0.063 0.068 0.020 0.024 0.020 0.019 0.007 0.011 0.020 0.016 0.011 0.011 0.008 0.017 0.015 0.011
18 Total pre paid clients 0.067 0.068 0.027 0.015 0.054 0.043 0.043 0.042 0.045 0.060 0.081 0.057 0.017 0.026 0.053 0.012 0.066 0.043 0.030 0.046 0.041 0.037 0.049
19 Pre paid market share 0.050 0.097 0.027 0.015 0.082 0.057 0.057 0.063 0.068 0.060 0.081 0.113 0.022 0.040 0.053 0.007 0.066 0.065 0.045 0.065 0.033 0.030 0.114
20 Pre paid penetration rate 0.059 0.097 0.027 0.015 0.041 0.057 0.057 0.063 0.068 0.060 0.081 0.045 0.017 0.026 0.053 0.007 0.066 0.030 0.023 0.032 0.021 0.019 0.017
21 Total pre paid outgoing billable traffic 0.067 0.097 0.027 0.015 0.109 0.057 0.057 0.063 0.068 0.081 0.081 0.113 0.144 0.079 0.053 0.070 0.082 0.086 0.114 0.129 0.083 0.149 0.086
22 Total pre paid incoming billable traffic 0.059 0.097 0.027 0.015 0.109 0.057 0.057 0.063 0.068 0.081 0.081 0.113 0.144 0.079 0.053 0.070 0.082 0.086 0.114 0.129 0.041 0.074 0.137
23 Pre paid billing system availability 0.034 0.049 0.016 0.009 0.025 0.072 0.071 0.063 0.090 0.040 0.081 0.028 0.048 0.053 0.043 0.023 0.049 0.030 0.014 0.065 0.033 0.019 0.034
Table E.2: Normalised matrix for commercial department pairwise comparison matrix.
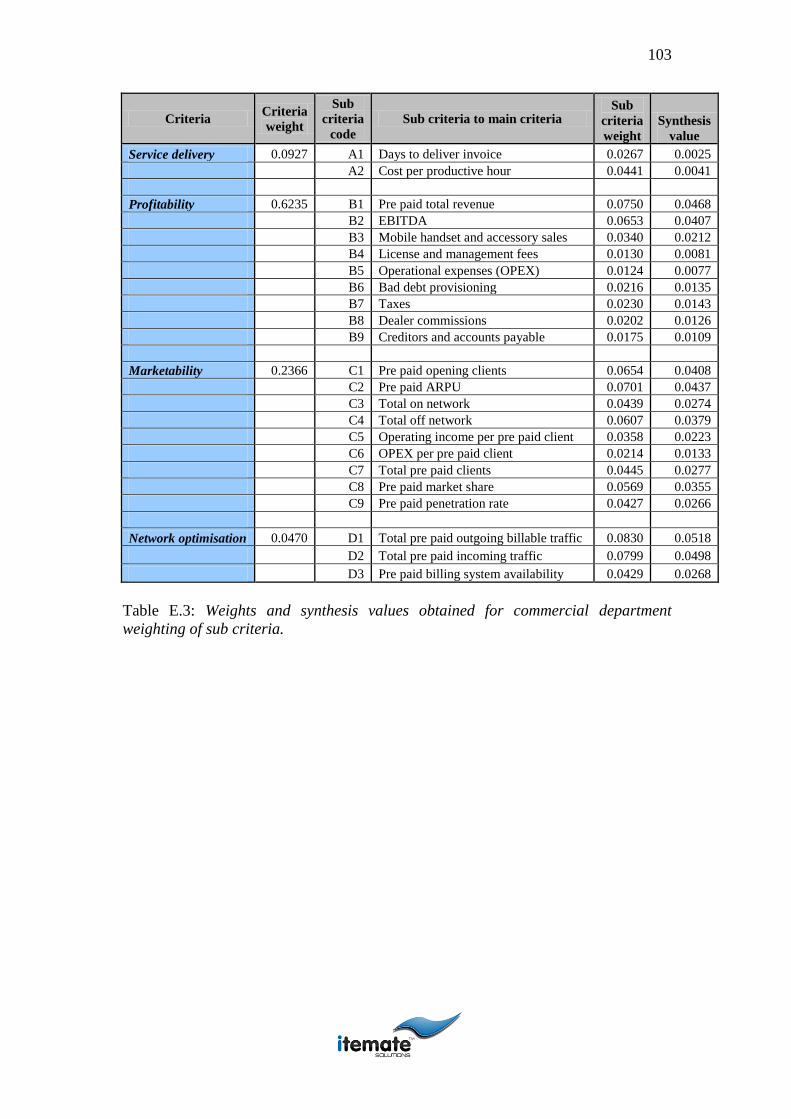
103
Criteria Criteria
weight
Sub
criteria
code
Sub criteria to main criteria Sub
criteria
weight
Synthesis
value
Service delivery 0.0927 A1 Days to deliver invoice 0.0267 0.0025
A2 Cost per productive hour 0.0441 0.0041
Profitability 0.6235 B1 Pre paid total revenue 0.0750 0.0468
B2 EBITDA 0.0653 0.0407
B3 Mobile handset and accessory sales 0.0340 0.0212
B4 License and management fees 0.0130 0.0081
B5 Operational expenses (OPEX) 0.0124 0.0077
B6 Bad debt provisioning 0.0216 0.0135
B7 Taxes 0.0230 0.0143
B8 Dealer commissions 0.0202 0.0126
B9 Creditors and accounts payable 0.0175 0.0109
Marketability 0.2366 C1 Pre paid opening clients 0.0654 0.0408
C2 Pre paid ARPU 0.0701 0.0437
C3 Total on network 0.0439 0.0274
C4 Total off network 0.0607 0.0379
C5 Operating income per pre paid client 0.0358 0.0223
C6 OPEX per pre paid client 0.0214 0.0133
C7 Total pre paid clients 0.0445 0.0277
C8 Pre paid market share 0.0569 0.0355
C9 Pre paid penetration rate 0.0427 0.0266
Network optimisation 0.0470 D1 Total pre paid outgoing billable traffic 0.0830 0.0518
D2 Total pre paid incoming traffic 0.0799 0.0498
D3 Pre paid billing system availability 0.0429 0.0268
Table E.3: Weights and synthesis values obtained for commercial department
weighting of sub criteria.
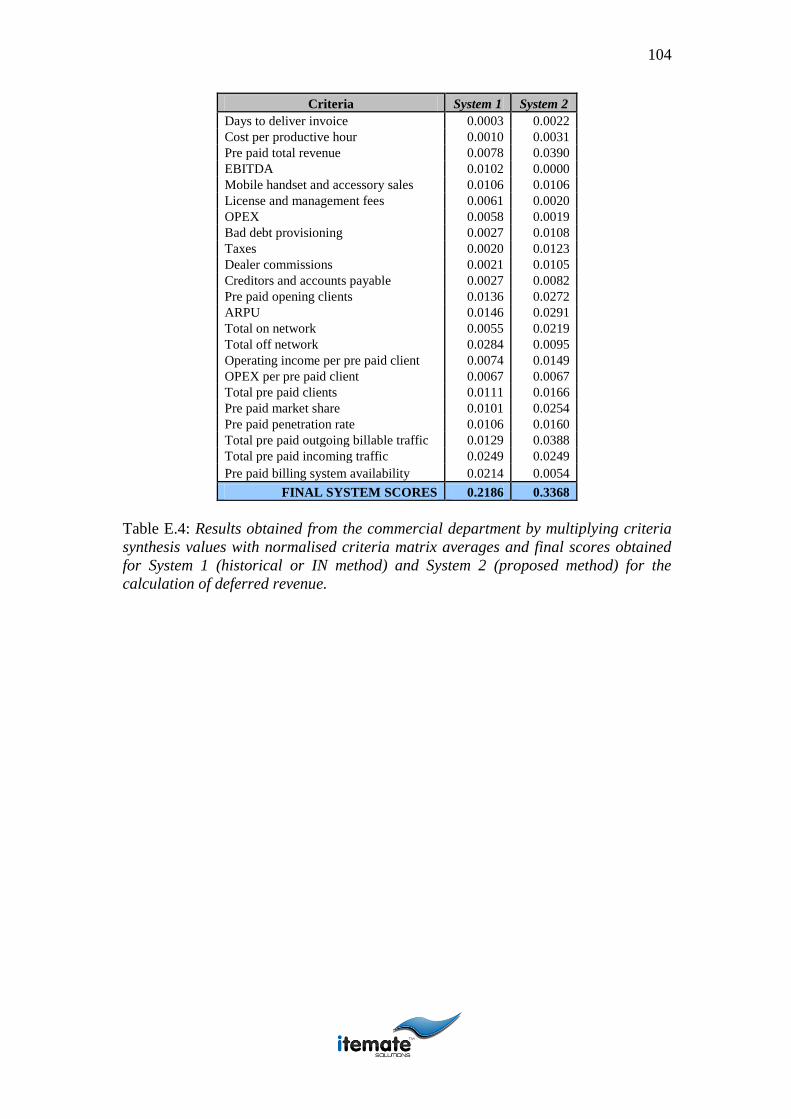
104
Criteria System 1 System 2
Days to deliver invoice 0.0003 0.0022
Cost per productive hour 0.0010 0.0031
Pre paid total revenue 0.0078 0.0390
EBITDA 0.0102 0.0000
Mobile handset and accessory sales 0.0106 0.0106
License and management fees 0.0061 0.0020
OPEX 0.0058 0.0019
Bad debt provisioning 0.0027 0.0108
Taxes 0.0020 0.0123
Dealer commissions 0.0021 0.0105
Creditors and accounts payable 0.0027 0.0082
Pre paid opening clients 0.0136 0.0272
ARPU 0.0146 0.0291
Total on network 0.0055 0.0219
Total off network 0.0284 0.0095
Operating income per pre paid client 0.0074 0.0149
OPEX per pre paid client 0.0067 0.0067
Total pre paid clients 0.0111 0.0166
Pre paid market share 0.0101 0.0254
Pre paid penetration rate 0.0106 0.0160
Total pre paid outgoing billable traffic 0.0129 0.0388
Total pre paid incoming traffic 0.0249 0.0249
Pre paid billing system availability 0.0214 0.0054
FINAL SYSTEM SCORES 0.2186 0.3368
Table E.4: Results obtained from the commercial department by multiplying criteria
synthesis values with normalised criteria matrix averages and final scores obtained
for System 1 (historical or IN method) and System 2 (proposed method) for the
calculation of deferred revenue.
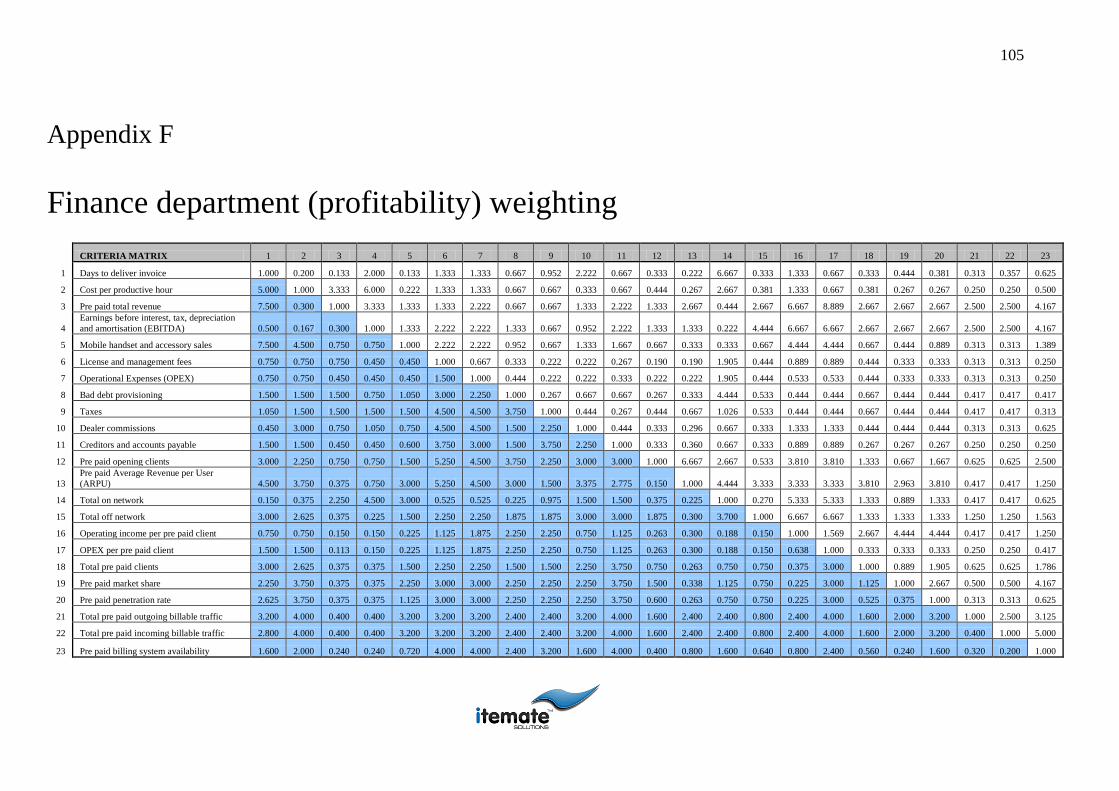
105
Appendix F
F. Finance department (profitability) weighting
CRITERIA MATRIX 1 2 3 4 5 6 7 8 9 10 11 12 13 14 15 16 17 18 19 20 21 22 23
1 Days to deliver invoice 1.000 0.200 0.133 2.000 0.133 1.333 1.333 0.667 0.952 2.222 0.667 0.333 0.222 6.667 0.333 1.333 0.667 0.333 0.444 0.381 0.313 0.357 0.625
2 Cost per productive hour 5.000 1.000 3.333 6.000 0.222 1.333 1.333 0.667 0.667 0.333 0.667 0.444 0.267 2.667 0.381 1.333 0.667 0.381 0.267 0.267 0.250 0.250 0.500
3 Pre paid total revenue 7.500 0.300 1.000 3.333 1.333 1.333 2.222 0.667 0.667 1.333 2.222 1.333 2.667 0.444 2.667 6.667 8.889 2.667 2.667 2.667 2.500 2.500 4.167
4
Earnings before interest, tax, depreciation
and amortisation (EBITDA) 0.500 0.167 0.300 1.000 1.333 2.222 2.222 1.333 0.667 0.952 2.222 1.333 1.333 0.222 4.444 6.667 6.667 2.667 2.667 2.667 2.500 2.500 4.167
5 Mobile handset and accessory sales 7.500 4.500 0.750 0.750 1.000 2.222 2.222 0.952 0.667 1.333 1.667 0.667 0.333 0.333 0.667 4.444 4.444 0.667 0.444 0.889 0.313 0.313 1.389
6 License and management fees 0.750 0.750 0.750 0.450 0.450 1.000 0.667 0.333 0.222 0.222 0.267 0.190 0.190 1.905 0.444 0.889 0.889 0.444 0.333 0.333 0.313 0.313 0.250
7 Operational Expenses (OPEX) 0.750 0.750 0.450 0.450 0.450 1.500 1.000 0.444 0.222 0.222 0.333 0.222 0.222 1.905 0.444 0.533 0.533 0.444 0.333 0.333 0.313 0.313 0.250
8 Bad debt provisioning 1.500 1.500 1.500 0.750 1.050 3.000 2.250 1.000 0.267 0.667 0.667 0.267 0.333 4.444 0.533 0.444 0.444 0.667 0.444 0.444 0.417 0.417 0.417
9 Taxes 1.050 1.500 1.500 1.500 1.500 4.500 4.500 3.750 1.000 0.444 0.267 0.444 0.667 1.026 0.533 0.444 0.444 0.667 0.444 0.444 0.417 0.417 0.313
10 Dealer commissions 0.450 3.000 0.750 1.050 0.750 4.500 4.500 1.500 2.250 1.000 0.444 0.333 0.296 0.667 0.333 1.333 1.333 0.444 0.444 0.444 0.313 0.313 0.625
11 Creditors and accounts payable 1.500 1.500 0.450 0.450 0.600 3.750 3.000 1.500 3.750 2.250 1.000 0.333 0.360 0.667 0.333 0.889 0.889 0.267 0.267 0.267 0.250 0.250 0.250
12 Pre paid opening clients 3.000 2.250 0.750 0.750 1.500 5.250 4.500 3.750 2.250 3.000 3.000 1.000 6.667 2.667 0.533 3.810 3.810 1.333 0.667 1.667 0.625 0.625 2.500
13
Pre paid Average Revenue per User
(ARPU) 4.500 3.750 0.375 0.750 3.000 5.250 4.500 3.000 1.500 3.375 2.775 0.150 1.000 4.444 3.333 3.333 3.333 3.810 2.963 3.810 0.417 0.417 1.250
14 Total on network 0.150 0.375 2.250 4.500 3.000 0.525 0.525 0.225 0.975 1.500 1.500 0.375 0.225 1.000 0.270 5.333 5.333 1.333 0.889 1.333 0.417 0.417 0.625
15 Total off network 3.000 2.625 0.375 0.225 1.500 2.250 2.250 1.875 1.875 3.000 3.000 1.875 0.300 3.700 1.000 6.667 6.667 1.333 1.333 1.333 1.250 1.250 1.563
16 Operating income per pre paid client 0.750 0.750 0.150 0.150 0.225 1.125 1.875 2.250 2.250 0.750 1.125 0.263 0.300 0.188 0.150 1.000 1.569 2.667 4.444 4.444 0.417 0.417 1.250
17 OPEX per pre paid client 1.500 1.500 0.113 0.150 0.225 1.125 1.875 2.250 2.250 0.750 1.125 0.263 0.300 0.188 0.150 0.638 1.000 0.333 0.333 0.333 0.250 0.250 0.417
18 Total pre paid clients 3.000 2.625 0.375 0.375 1.500 2.250 2.250 1.500 1.500 2.250 3.750 0.750 0.263 0.750 0.750 0.375 3.000 1.000 0.889 1.905 0.625 0.625 1.786
19 Pre paid market share 2.250 3.750 0.375 0.375 2.250 3.000 3.000 2.250 2.250 2.250 3.750 1.500 0.338 1.125 0.750 0.225 3.000 1.125 1.000 2.667 0.500 0.500 4.167
20 Pre paid penetration rate 2.625 3.750 0.375 0.375 1.125 3.000 3.000 2.250 2.250 2.250 3.750 0.600 0.263 0.750 0.750 0.225 3.000 0.525 0.375 1.000 0.313 0.313 0.625
21 Total pre paid outgoing billable traffic 3.200 4.000 0.400 0.400 3.200 3.200 3.200 2.400 2.400 3.200 4.000 1.600 2.400 2.400 0.800 2.400 4.000 1.600 2.000 3.200 1.000 2.500 3.125
22 Total pre paid incoming billable traffic 2.800 4.000 0.400 0.400 3.200 3.200 3.200 2.400 2.400 3.200 4.000 1.600 2.400 2.400 0.800 2.400 4.000 1.600 2.000 3.200 0.400 1.000 5.000
23 Pre paid billing system availability 1.600 2.000 0.240 0.240 0.720 4.000 4.000 2.400 3.200 1.600 4.000 0.400 0.800 1.600 0.640 0.800 2.400 0.560 0.240 1.600 0.320 0.200 1.000
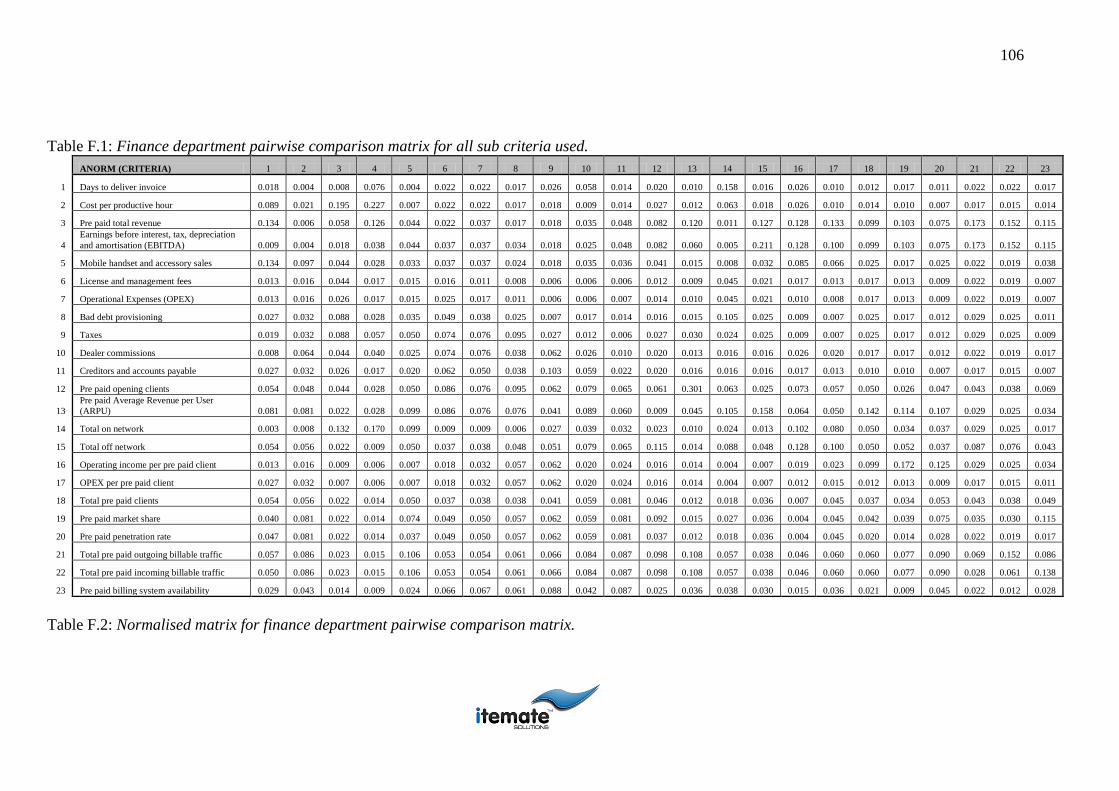
106
Table F.1: Finance department pairwise comparison matrix for all sub criteria used.
ANORM (CRITERIA) 1 2 3 4 5 6 7 8 9 10 11 12 13 14 15 16 17 18 19 20 21 22 23
1 Days to deliver invoice 0.018 0.004 0.008 0.076 0.004 0.022 0.022 0.017 0.026 0.058 0.014 0.020 0.010 0.158 0.016 0.026 0.010 0.012 0.017 0.011 0.022 0.022 0.017
2 Cost per productive hour 0.089 0.021 0.195 0.227 0.007 0.022 0.022 0.017 0.018 0.009 0.014 0.027 0.012 0.063 0.018 0.026 0.010 0.014 0.010 0.007 0.017 0.015 0.014
3 Pre paid total revenue 0.134 0.006 0.058 0.126 0.044 0.022 0.037 0.017 0.018 0.035 0.048 0.082 0.120 0.011 0.127 0.128 0.133 0.099 0.103 0.075 0.173 0.152 0.115
4
Earnings before interest, tax, depreciation
and amortisation (EBITDA) 0.009 0.004 0.018 0.038 0.044 0.037 0.037 0.034 0.018 0.025 0.048 0.082 0.060 0.005 0.211 0.128 0.100 0.099 0.103 0.075 0.173 0.152 0.115
5 Mobile handset and accessory sales 0.134 0.097 0.044 0.028 0.033 0.037 0.037 0.024 0.018 0.035 0.036 0.041 0.015 0.008 0.032 0.085 0.066 0.025 0.017 0.025 0.022 0.019 0.038
6 License and management fees 0.013 0.016 0.044 0.017 0.015 0.016 0.011 0.008 0.006 0.006 0.006 0.012 0.009 0.045 0.021 0.017 0.013 0.017 0.013 0.009 0.022 0.019 0.007
7 Operational Expenses (OPEX) 0.013 0.016 0.026 0.017 0.015 0.025 0.017 0.011 0.006 0.006 0.007 0.014 0.010 0.045 0.021 0.010 0.008 0.017 0.013 0.009 0.022 0.019 0.007
8 Bad debt provisioning 0.027 0.032 0.088 0.028 0.035 0.049 0.038 0.025 0.007 0.017 0.014 0.016 0.015 0.105 0.025 0.009 0.007 0.025 0.017 0.012 0.029 0.025 0.011
9 Taxes 0.019 0.032 0.088 0.057 0.050 0.074 0.076 0.095 0.027 0.012 0.006 0.027 0.030 0.024 0.025 0.009 0.007 0.025 0.017 0.012 0.029 0.025 0.009
10 Dealer commissions 0.008 0.064 0.044 0.040 0.025 0.074 0.076 0.038 0.062 0.026 0.010 0.020 0.013 0.016 0.016 0.026 0.020 0.017 0.017 0.012 0.022 0.019 0.017
11 Creditors and accounts payable 0.027 0.032 0.026 0.017 0.020 0.062 0.050 0.038 0.103 0.059 0.022 0.020 0.016 0.016 0.016 0.017 0.013 0.010 0.010 0.007 0.017 0.015 0.007
12 Pre paid opening clients 0.054 0.048 0.044 0.028 0.050 0.086 0.076 0.095 0.062 0.079 0.065 0.061 0.301 0.063 0.025 0.073 0.057 0.050 0.026 0.047 0.043 0.038 0.069
13
Pre paid Average Revenue per User
(ARPU) 0.081 0.081 0.022 0.028 0.099 0.086 0.076 0.076 0.041 0.089 0.060 0.009 0.045 0.105 0.158 0.064 0.050 0.142 0.114 0.107 0.029 0.025 0.034
14 Total on network 0.003 0.008 0.132 0.170 0.099 0.009 0.009 0.006 0.027 0.039 0.032 0.023 0.010 0.024 0.013 0.102 0.080 0.050 0.034 0.037 0.029 0.025 0.017
15 Total off network 0.054 0.056 0.022 0.009 0.050 0.037 0.038 0.048 0.051 0.079 0.065 0.115 0.014 0.088 0.048 0.128 0.100 0.050 0.052 0.037 0.087 0.076 0.043
16 Operating income per pre paid client 0.013 0.016 0.009 0.006 0.007 0.018 0.032 0.057 0.062 0.020 0.024 0.016 0.014 0.004 0.007 0.019 0.023 0.099 0.172 0.125 0.029 0.025 0.034
17 OPEX per pre paid client 0.027 0.032 0.007 0.006 0.007 0.018 0.032 0.057 0.062 0.020 0.024 0.016 0.014 0.004 0.007 0.012 0.015 0.012 0.013 0.009 0.017 0.015 0.011
18 Total pre paid clients 0.054 0.056 0.022 0.014 0.050 0.037 0.038 0.038 0.041 0.059 0.081 0.046 0.012 0.018 0.036 0.007 0.045 0.037 0.034 0.053 0.043 0.038 0.049
19 Pre paid market share 0.040 0.081 0.022 0.014 0.074 0.049 0.050 0.057 0.062 0.059 0.081 0.092 0.015 0.027 0.036 0.004 0.045 0.042 0.039 0.075 0.035 0.030 0.115
20 Pre paid penetration rate 0.047 0.081 0.022 0.014 0.037 0.049 0.050 0.057 0.062 0.059 0.081 0.037 0.012 0.018 0.036 0.004 0.045 0.020 0.014 0.028 0.022 0.019 0.017
21 Total pre paid outgoing billable traffic 0.057 0.086 0.023 0.015 0.106 0.053 0.054 0.061 0.066 0.084 0.087 0.098 0.108 0.057 0.038 0.046 0.060 0.060 0.077 0.090 0.069 0.152 0.086
22 Total pre paid incoming billable traffic 0.050 0.086 0.023 0.015 0.106 0.053 0.054 0.061 0.066 0.084 0.087 0.098 0.108 0.057 0.038 0.046 0.060 0.060 0.077 0.090 0.028 0.061 0.138
23 Pre paid billing system availability 0.029 0.043 0.014 0.009 0.024 0.066 0.067 0.061 0.088 0.042 0.087 0.025 0.036 0.038 0.030 0.015 0.036 0.021 0.009 0.045 0.022 0.012 0.028
Table F.2: Normalised matrix for finance department pairwise comparison matrix.
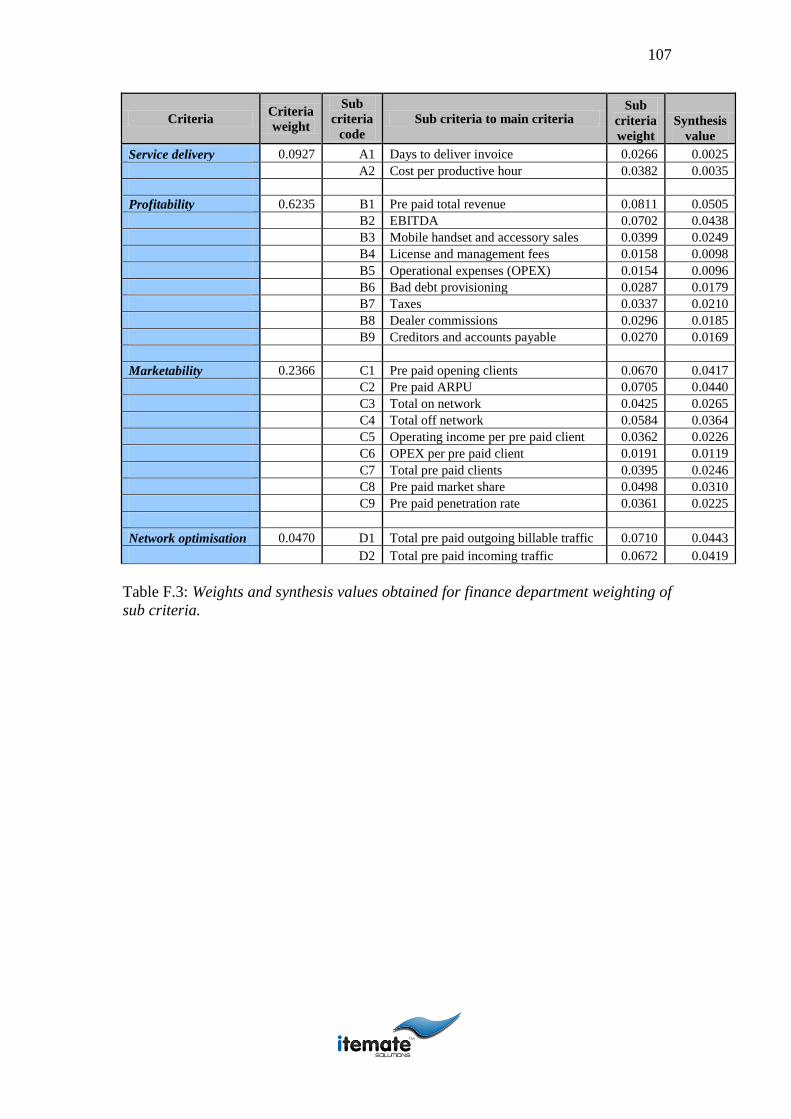
107
Criteria Criteria
weight
Sub
criteria
code
Sub criteria to main criteria Sub
criteria
weight
Synthesis
value
Service delivery 0.0927 A1 Days to deliver invoice 0.0266 0.0025
A2 Cost per productive hour 0.0382 0.0035
Profitability 0.6235 B1 Pre paid total revenue 0.0811 0.0505
B2 EBITDA 0.0702 0.0438
B3 Mobile handset and accessory sales 0.0399 0.0249
B4 License and management fees 0.0158 0.0098
B5 Operational expenses (OPEX) 0.0154 0.0096
B6 Bad debt provisioning 0.0287 0.0179
B7 Taxes 0.0337 0.0210
B8 Dealer commissions 0.0296 0.0185
B9 Creditors and accounts payable 0.0270 0.0169
Marketability 0.2366 C1 Pre paid opening clients 0.0670 0.0417
C2 Pre paid ARPU 0.0705 0.0440
C3 Total on network 0.0425 0.0265
C4 Total off network 0.0584 0.0364
C5 Operating income per pre paid client 0.0362 0.0226
C6 OPEX per pre paid client 0.0191 0.0119
C7 Total pre paid clients 0.0395 0.0246
C8 Pre paid market share 0.0498 0.0310
C9 Pre paid penetration rate 0.0361 0.0225
Network optimisation 0.0470 D1 Total pre paid outgoing billable traffic 0.0710 0.0443
D2 Total pre paid incoming traffic 0.0672 0.0419
Table F.3: Weights and synthesis values obtained for finance department weighting of
sub criteria.
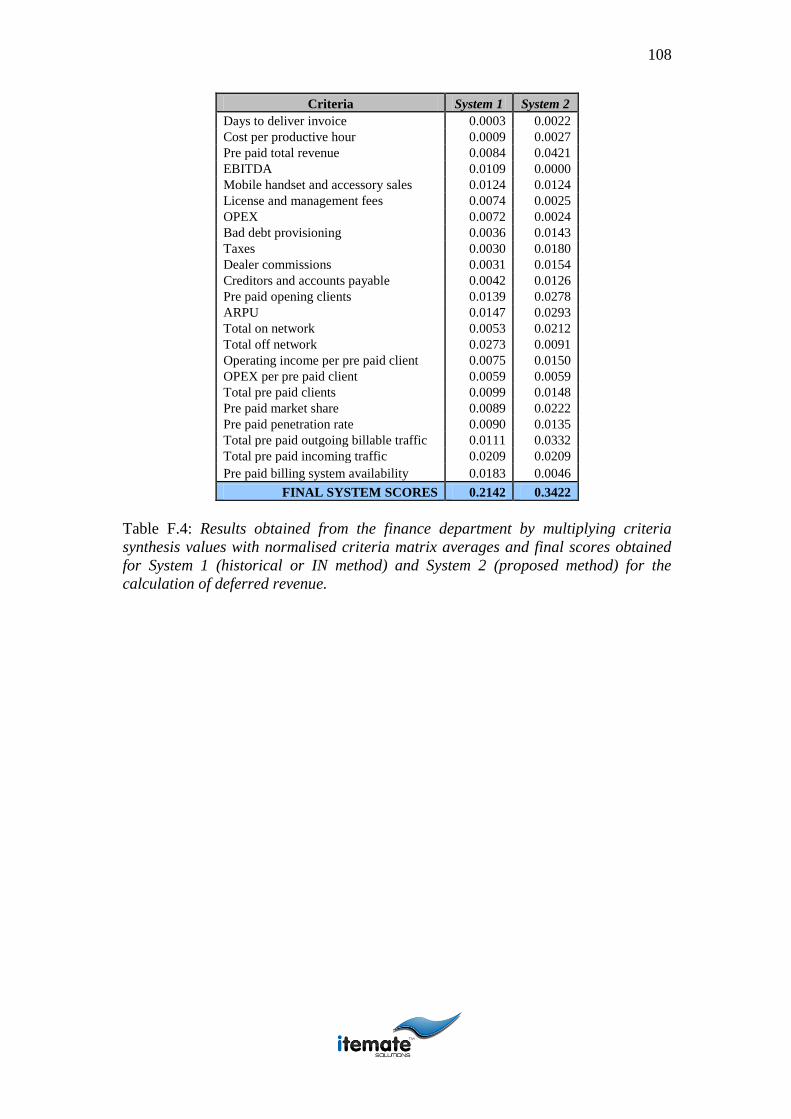
108
Criteria System 1 System 2
Days to deliver invoice 0.0003 0.0022
Cost per productive hour 0.0009 0.0027
Pre paid total revenue 0.0084 0.0421
EBITDA 0.0109 0.0000
Mobile handset and accessory sales 0.0124 0.0124
License and management fees 0.0074 0.0025
OPEX 0.0072 0.0024
Bad debt provisioning 0.0036 0.0143
Taxes 0.0030 0.0180
Dealer commissions 0.0031 0.0154
Creditors and accounts payable 0.0042 0.0126
Pre paid opening clients 0.0139 0.0278
ARPU 0.0147 0.0293
Total on network 0.0053 0.0212
Total off network 0.0273 0.0091
Operating income per pre paid client 0.0075 0.0150
OPEX per pre paid client 0.0059 0.0059
Total pre paid clients 0.0099 0.0148
Pre paid market share 0.0089 0.0222
Pre paid penetration rate 0.0090 0.0135
Total pre paid outgoing billable traffic 0.0111 0.0332
Total pre paid incoming traffic 0.0209 0.0209
Pre paid billing system availability 0.0183 0.0046
FINAL SYSTEM SCORES 0.2142 0.3422
Table F.4: Results obtained from the finance department by multiplying criteria
synthesis values with normalised criteria matrix averages and final scores obtained
for System 1 (historical or IN method) and System 2 (proposed method) for the
calculation of deferred revenue.

109
Appendix G
G. Marketing department (marketability) weighting
CRITERIA MATRIX 1 2 3 4 5 6 7 8 9 10 11 12 13 14 15 16 17 18 19 20 21 22 23
1 Days to deliver invoice 1.000 0.200 0.267 4.000 0.267 2.667 2.667 1.333 1.905 4.444 1.333 0.125 0.111 2.000 0.125 0.500 0.250 0.125 0.167 0.143 0.500 0.571 1.000
2 Cost per productive hour 5.000 1.000 6.667 12.000 0.444 2.667 2.667 1.333 1.333 0.667 1.333 0.167 0.143 1.000 0.143 0.500 0.250 0.143 0.200 0.200 0.400 0.400 0.800
3 Pre paid total revenue 3.750 0.150 1.000 6.667 2.667 2.667 4.444 1.333 1.333 2.667 4.444 0.500 1.000 0.167 1.000 2.500 3.333 1.000 1.000 1.000 4.000 4.000 6.667
4
Earnings before interest, tax,
depreciation and amortisation (EBITDA) 0.250 0.083 0.150 1.000 2.667 4.444 4.444 2.667 1.333 1.905 4.444 0.500 0.500 0.154 1.667 2.500 2.500 1.000 1.000 1.000 4.000 4.000 6.667
5 Mobile handset and accessory sales 3.750 2.250 0.375 0.375 1.000 4.444 4.444 1.905 1.333 2.667 3.333 0.250 0.125 0.125 0.250 1.667 1.667 0.250 0.167 0.333 0.500 0.500 2.222
6 License and management fees 0.375 0.375 0.375 0.225 0.225 1.000 1.333 0.667 0.444 0.444 0.533 0.125 0.125 0.714 0.167 0.333 0.333 0.167 0.125 0.125 0.500 0.500 0.400
7 Operational Expenses (OPEX) 0.375 0.375 0.225 0.225 0.225 0.750 1.000 0.889 0.444 0.444 0.667 0.143 0.143 0.714 0.167 0.200 0.200 0.167 0.125 0.125 0.500 0.500 0.400
8 Bad debt provisioning 0.750 0.750 0.750 0.375 0.525 1.500 1.125 1.000 0.533 1.333 1.333 0.167 0.125 1.667 0.200 0.167 0.167 0.250 0.167 0.167 0.667 0.667 0.667
9 Taxes 0.525 0.750 0.750 0.750 0.750 2.250 2.250 1.875 1.000 0.889 0.533 0.250 0.250 0.385 0.200 0.167 0.167 0.250 0.167 0.167 0.667 0.667 0.500
10 Dealer commissions 0.225 1.500 0.375 0.525 0.375 2.250 2.250 0.750 1.125 1.000 0.889 0.200 0.111 0.250 0.125 0.500 0.500 0.167 0.167 0.167 0.500 0.500 1.000
11 Creditors and accounts payable 0.750 0.750 0.225 0.225 0.300 1.875 1.500 0.750 1.875 1.125 1.000 0.143 0.135 0.250 0.125 0.333 0.333 0.143 0.143 0.143 0.400 0.400 0.400
12 Pre paid opening clients 8.000 6.000 2.000 2.000 4.000 8.000 7.000 6.000 4.000 5.000 7.000 1.000 2.500 1.000 0.200 1.429 1.429 0.500 0.250 0.625 1.000 1.000 4.000
13
Pre paid Average Revenue per User
(ARPU) 9.000 7.000 1.000 2.000 8.000 8.000 7.000 8.000 4.000 9.000 7.400 0.400 1.000 1.667 1.250 1.250 1.250 1.429 1.111 1.429 0.667 0.667 2.000
14 Total on network 0.500 1.000 6.000 6.500 8.000 1.400 1.400 0.600 2.600 4.000 4.000 1.000 0.600 1.000 0.135 2.000 2.000 0.500 0.333 0.500 0.667 0.667 1.000
15 Total off network 8.000 7.000 1.000 0.600 4.000 6.000 6.000 5.000 5.000 8.000 8.000 5.000 0.800 7.400 1.000 2.500 2.500 0.500 0.500 0.500 2.000 2.000 2.500
16 Operating income per pre paid client 2.000 2.000 0.400 0.400 0.600 3.000 5.000 6.000 6.000 2.000 3.000 0.700 0.800 0.500 0.400 1.000 0.588 1.000 1.667 1.667 0.667 0.667 2.000
17 OPEX per pre paid client 4.000 4.000 0.300 0.400 0.600 3.000 5.000 6.000 6.000 2.000 3.000 0.700 0.800 0.500 0.400 1.700 1.000 0.125 0.125 0.125 0.400 0.400 0.667
18 Total pre paid clients 8.000 7.000 1.000 1.000 4.000 6.000 6.000 4.000 4.000 6.000 7.000 2.000 0.700 2.000 2.000 1.000 8.000 1.000 0.333 0.714 1.000 1.000 2.857
19 Pre paid market share 6.000 5.000 1.000 1.000 6.000 8.000 8.000 6.000 6.000 6.000 7.000 4.000 0.900 3.000 2.000 0.600 8.000 3.000 1.000 1.000 0.800 0.800 6.667
20 Pre paid penetration rate 7.000 5.000 1.000 1.000 3.000 8.000 8.000 6.000 6.000 6.000 7.000 1.600 0.700 2.000 2.000 0.600 8.000 1.400 1.000 1.000 0.500 0.500 1.000
21 Total pre paid outgoing billable traffic 2.000 2.500 0.250 0.250 2.000 2.000 2.000 1.500 1.500 2.000 2.500 1.000 1.500 1.500 0.500 1.500 2.500 1.000 1.250 2.000 1.000 4.000 5.000
22 Total pre paid incoming billable traffic 1.750 2.500 0.250 0.250 2.000 2.000 2.000 1.500 1.500 2.000 2.500 1.000 1.500 1.500 0.500 1.500 2.500 1.000 1.250 2.000 0.250 1.000 8.000
23 Pre paid billing system availability 1.000 1.250 0.150 0.150 0.450 2.500 2.500 1.500 2.000 1.000 2.500 0.250 0.500 1.000 0.400 0.500 1.500 0.350 0.150 1.000 0.200 0.125 1.000

110
Table G.1: Marketing department pairwise comparison matrix for all sub criteria used.
ANORM (CRITERIA) 1 2 3 4 5 6 7 8 9 10 11 12 13 14 15 16 17 18 19 20 21 22 23
1 Days to deliver invoice 0.014 0.003 0.010 0.095 0.005 0.032 0.030 0.020 0.031 0.063 0.017 0.006 0.007 0.066 0.008 0.020 0.005 0.008 0.013 0.009 0.023 0.022 0.017
2 Cost per productive hour 0.068 0.017 0.261 0.286 0.009 0.032 0.030 0.020 0.022 0.009 0.017 0.008 0.009 0.033 0.010 0.020 0.005 0.009 0.016 0.012 0.018 0.016 0.014
3 Pre paid total revenue 0.051 0.003 0.039 0.159 0.051 0.032 0.050 0.020 0.022 0.038 0.055 0.024 0.066 0.005 0.067 0.100 0.068 0.065 0.081 0.062 0.184 0.157 0.116
4
Earnings before interest, tax, depreciation
and amortisation (EBITDA) 0.003 0.001 0.006 0.024 0.051 0.053 0.050 0.040 0.022 0.027 0.055 0.024 0.033 0.005 0.111 0.100 0.051 0.065 0.081 0.062 0.184 0.157 0.116
5 Mobile handset and accessory sales 0.051 0.039 0.015 0.009 0.019 0.053 0.050 0.029 0.022 0.038 0.041 0.012 0.008 0.004 0.017 0.067 0.034 0.016 0.013 0.021 0.023 0.020 0.039
6 License and management fees 0.005 0.006 0.015 0.005 0.004 0.012 0.015 0.010 0.007 0.006 0.007 0.006 0.008 0.023 0.011 0.013 0.007 0.011 0.010 0.008 0.023 0.020 0.007
7 Operational Expenses (OPEX) 0.005 0.006 0.009 0.005 0.004 0.009 0.011 0.013 0.007 0.006 0.008 0.007 0.009 0.023 0.011 0.008 0.004 0.011 0.010 0.008 0.023 0.020 0.007
8 Bad debt provisioning 0.010 0.013 0.029 0.009 0.010 0.018 0.013 0.015 0.009 0.019 0.017 0.008 0.008 0.055 0.013 0.007 0.003 0.016 0.013 0.010 0.031 0.026 0.012
9 Taxes 0.007 0.013 0.029 0.018 0.014 0.027 0.026 0.028 0.016 0.013 0.007 0.012 0.017 0.013 0.013 0.007 0.003 0.016 0.013 0.010 0.031 0.026 0.009
10 Dealer commissions 0.003 0.026 0.015 0.013 0.007 0.027 0.026 0.011 0.018 0.014 0.011 0.009 0.007 0.008 0.008 0.020 0.010 0.011 0.013 0.010 0.023 0.020 0.017
11 Creditors and accounts payable 0.010 0.013 0.009 0.005 0.006 0.022 0.017 0.011 0.031 0.016 0.012 0.007 0.009 0.008 0.008 0.013 0.007 0.009 0.012 0.009 0.018 0.016 0.007
12 Pre paid opening clients 0.108 0.103 0.078 0.048 0.077 0.095 0.080 0.090 0.065 0.071 0.087 0.047 0.166 0.033 0.013 0.057 0.029 0.032 0.020 0.039 0.046 0.039 0.070
13
Pre paid Average Revenue per User
(ARPU) 0.122 0.120 0.039 0.048 0.154 0.095 0.080 0.120 0.065 0.128 0.092 0.019 0.066 0.055 0.084 0.050 0.026 0.092 0.090 0.089 0.031 0.026 0.035
14 Total on network 0.007 0.017 0.235 0.155 0.154 0.017 0.016 0.009 0.042 0.057 0.050 0.047 0.040 0.033 0.009 0.080 0.041 0.032 0.027 0.031 0.031 0.026 0.017
15 Total off network 0.108 0.120 0.039 0.014 0.077 0.071 0.068 0.075 0.082 0.113 0.099 0.236 0.053 0.243 0.067 0.100 0.051 0.032 0.040 0.031 0.092 0.078 0.044
16 Operating income per pre paid client 0.027 0.034 0.016 0.010 0.012 0.036 0.057 0.090 0.098 0.028 0.037 0.033 0.053 0.016 0.027 0.040 0.012 0.065 0.134 0.103 0.031 0.026 0.035
17 OPEX per pre paid client 0.054 0.068 0.012 0.010 0.012 0.036 0.057 0.090 0.098 0.028 0.037 0.033 0.053 0.016 0.027 0.068 0.020 0.008 0.010 0.008 0.018 0.016 0.012
18 Total pre paid clients 0.108 0.120 0.039 0.024 0.077 0.071 0.068 0.060 0.065 0.085 0.087 0.094 0.046 0.066 0.134 0.040 0.163 0.065 0.027 0.044 0.046 0.039 0.050
19 Pre paid market share 0.081 0.086 0.039 0.024 0.115 0.095 0.091 0.090 0.098 0.085 0.087 0.189 0.060 0.098 0.134 0.024 0.163 0.194 0.081 0.062 0.037 0.031 0.116
20 Pre paid penetration rate 0.095 0.086 0.039 0.024 0.058 0.095 0.091 0.090 0.098 0.085 0.087 0.075 0.046 0.066 0.134 0.024 0.163 0.091 0.081 0.062 0.023 0.020 0.017
21 Total pre paid outgoing billable traffic 0.027 0.043 0.010 0.006 0.038 0.024 0.023 0.023 0.024 0.028 0.031 0.047 0.100 0.049 0.033 0.060 0.051 0.065 0.101 0.124 0.046 0.157 0.087
22 Total pre paid incoming billable traffic 0.024 0.043 0.010 0.006 0.038 0.024 0.023 0.023 0.024 0.028 0.031 0.047 0.100 0.049 0.033 0.060 0.051 0.065 0.101 0.124 0.011 0.039 0.139
23 Pre paid billing system availability 0.014 0.021 0.006 0.004 0.009 0.030 0.028 0.023 0.033 0.014 0.031 0.012 0.033 0.033 0.027 0.020 0.031 0.023 0.012 0.062 0.009 0.005 0.017
Table G.2: Normalised matrix for marketing department pairwise comparison matrix.

111
Criteria Criteria
weight
Sub
criteria
code
Sub criteria to main criteria Sub
criteria
weight
Synthesis
value
Service delivery 0.0927 A1 Days to deliver invoice 0.0229 0.0021
A2 Cost per productive hour 0.0409 0.0038
Profitability 0.6235 B1 Pre paid total revenue 0.0658 0.0410
B2 EBITDA 0.0574 0.0358
B3 Mobile handset and accessory sales 0.0277 0.0173
B4 License and management fees 0.0104 0.0065
B5 Operational expenses (OPEX) 0.0098 0.0061
B6 Bad debt provisioning 0.0158 0.0099
B7 Taxes 0.0160 0.0100
B8 Dealer commissions 0.0143 0.0089
B9 Creditors and accounts payable 0.0120 0.0075
Marketability 0.2366 C1 Pre paid opening clients 0.0649 0.0405
C2 Pre paid ARPU 0.0749 0.0467
C3 Total on network 0.0510 0.0318
C4 Total off network 0.0841 0.0524
C5 Operating income per pre paid client 0.0443 0.0276
C6 OPEX per pre paid client 0.0344 0.0214
C7 Total pre paid clients 0.0704 0.0439
C8 Pre paid market share 0.0904 0.0564
C9 Pre paid penetration rate 0.0717 0.0447
Network optimisation 0.0470 D1 Total pre paid outgoing billable traffic 0.0520 0.0324
D2 Total pre paid incoming traffic 0.0475 0.0296
D3 Pre paid billing system availability 0.0215 0.0134
Table G.3: Weights and synthesis values obtained for marketing department
weighting of sub criteria.
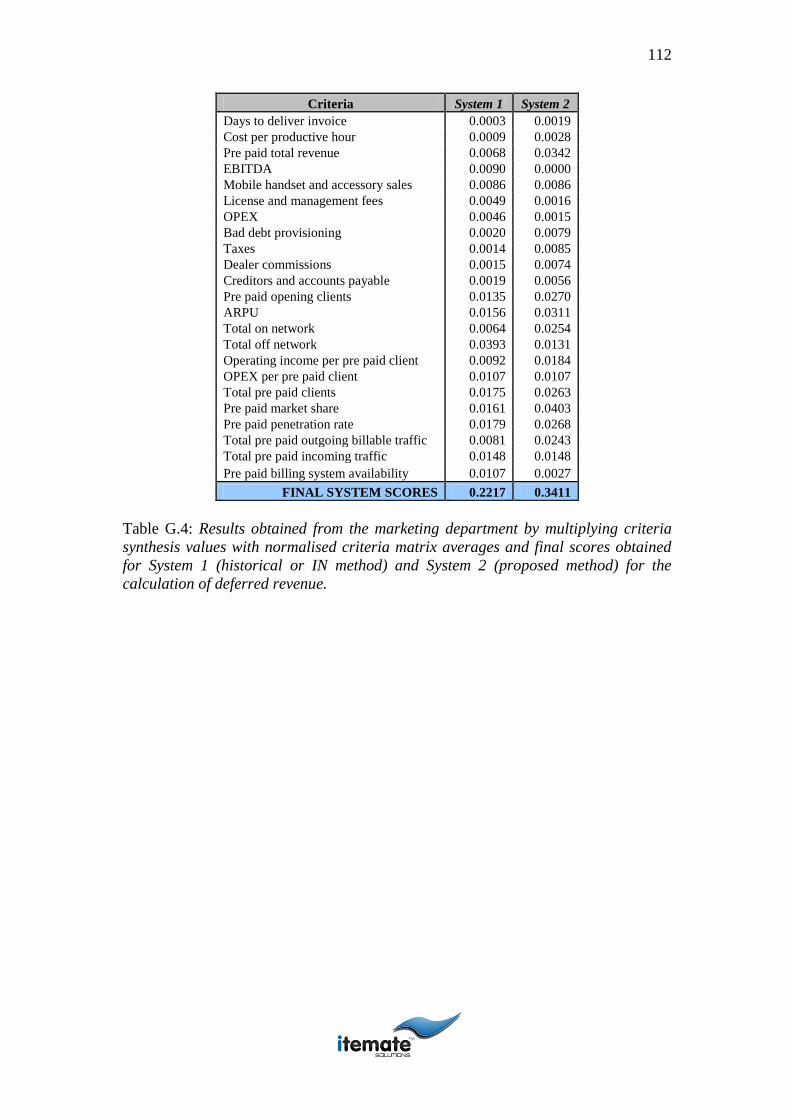
112
Criteria System 1 System 2
Days to deliver invoice 0.0003 0.0019
Cost per productive hour 0.0009 0.0028
Pre paid total revenue 0.0068 0.0342
EBITDA 0.0090 0.0000
Mobile handset and accessory sales 0.0086 0.0086
License and management fees 0.0049 0.0016
OPEX 0.0046 0.0015
Bad debt provisioning 0.0020 0.0079
Taxes 0.0014 0.0085
Dealer commissions 0.0015 0.0074
Creditors and accounts payable 0.0019 0.0056
Pre paid opening clients 0.0135 0.0270
ARPU 0.0156 0.0311
Total on network 0.0064 0.0254
Total off network 0.0393 0.0131
Operating income per pre paid client 0.0092 0.0184
OPEX per pre paid client 0.0107 0.0107
Total pre paid clients 0.0175 0.0263
Pre paid market share 0.0161 0.0403
Pre paid penetration rate 0.0179 0.0268
Total pre paid outgoing billable traffic 0.0081 0.0243
Total pre paid incoming traffic 0.0148 0.0148
Pre paid billing system availability 0.0107 0.0027
FINAL SYSTEM SCORES 0.2217 0.3411
Table G.4: Results obtained from the marketing department by multiplying criteria
synthesis values with normalised criteria matrix averages and final scores obtained
for System 1 (historical or IN method) and System 2 (proposed method) for the
calculation of deferred revenue.

113
Appendix H
H. IS department (network optimisation) weighting
CRITERIA MATRIX 1 2 3 4 5 6 7 8 9 10 11 12 13 14 15 16 17 18 19 20 21 22 23
1 Days to deliver invoice 1.000 0.119 0.167 3.158 0.211 2.105 2.105 1.053 1.504 3.509 1.053 0.294 0.196 5.882 0.294 1.176 0.588 0.294 0.392 0.336 0.143 0.238 0.417
2 Cost per productive hour 8.400 1.000 4.167 9.474 0.351 2.105 2.105 1.053 1.053 0.526 1.053 0.392 0.235 2.353 0.336 1.176 0.588 0.336 0.235 0.235 0.114 0.167 0.333
3 Pre paid total revenue 6.000 0.240 1.000 5.263 2.105 2.105 3.509 1.053 1.053 2.105 3.509 1.176 2.353 0.392 2.353 5.882 7.843 2.353 2.353 2.353 1.143 1.667 2.778
4
Earnings before interest, tax, depreciation
and amortisation (EBITDA) 0.317 0.106 0.190 1.000 2.105 3.509 3.509 2.105 1.053 1.504 3.509 1.176 1.176 0.196 3.922 5.882 5.882 2.353 2.353 2.353 1.143 1.667 2.778
5 Mobile handset and accessory sales 4.750 2.850 0.475 0.475 1.000 3.509 3.509 1.504 1.053 2.105 2.632 0.588 0.294 0.294 0.588 3.922 3.922 0.588 0.392 0.784 0.143 0.208 0.926
6 License and management fees 0.475 0.475 0.475 0.285 0.285 1.000 1.053 0.526 0.351 0.351 0.421 0.168 0.168 1.681 0.392 0.784 0.784 0.392 0.294 0.294 0.143 0.208 0.167
7 Operational Expenses (OPEX) 0.475 0.475 0.285 0.285 0.285 0.950 1.000 0.702 0.351 0.351 0.526 0.196 0.196 1.681 0.392 0.471 0.471 0.392 0.294 0.294 0.143 0.208 0.167
8 Bad debt provisioning 0.950 0.950 0.950 0.475 0.665 1.900 1.425 1.000 0.421 1.053 1.053 0.235 0.294 3.922 0.471 0.392 0.392 0.588 0.392 0.392 0.190 0.278 0.278
9 Taxes 0.665 0.950 0.950 0.950 0.950 2.850 2.850 2.375 1.000 0.702 0.421 0.392 0.588 0.905 0.471 0.392 0.392 0.588 0.392 0.392 0.190 0.278 0.208
10 Dealer commissions 0.285 1.900 0.475 0.665 0.475 2.850 2.850 0.950 1.425 1.000 0.702 0.294 0.261 0.588 0.294 1.176 1.176 0.392 0.392 0.392 0.143 0.208 0.417
11 Creditors and accounts payable 0.950 0.950 0.285 0.285 0.380 2.375 1.900 0.950 2.375 1.425 1.000 0.294 0.318 0.588 0.294 0.784 0.784 0.235 0.235 0.235 0.114 0.167 0.167
12 Pre paid opening clients 3.400 2.550 0.850 0.850 1.700 5.950 5.100 4.250 2.550 3.400 3.400 1.000 5.882 2.353 0.471 3.361 3.361 1.176 0.588 1.471 0.286 0.417 1.667
13
Pre paid Average Revenue per User
(ARPU) 5.100 4.250 0.425 0.850 3.400 5.950 5.100 3.400 1.700 3.825 3.145 0.170 1.000 3.922 2.941 2.941 2.941 3.361 2.614 3.361 0.190 0.278 0.833
14 Total on network 0.170 0.425 2.550 5.100 3.400 0.595 0.595 0.255 1.105 1.700 1.700 0.425 0.255 1.000 0.318 4.706 4.706 1.176 0.784 1.176 0.190 0.278 0.417
15 Total off network 3.400 2.975 0.425 0.255 1.700 2.550 2.550 2.125 2.125 3.400 3.400 2.125 0.340 3.145 1.000 5.882 5.882 1.176 1.176 1.176 0.571 0.833 1.042
16 Operating income per pre paid client 0.850 0.850 0.170 0.170 0.255 1.275 2.125 2.550 2.550 0.850 1.275 0.298 0.340 0.213 0.170 1.000 1.384 2.353 3.922 3.922 0.190 0.278 0.833
17 OPEX per pre paid client 1.700 1.700 0.128 0.170 0.255 1.275 2.125 2.550 2.550 0.850 1.275 0.298 0.340 0.213 0.170 0.723 1.000 0.294 0.294 0.294 0.114 0.167 0.278
18 Total pre paid clients 3.400 2.975 0.425 0.425 1.700 2.550 2.550 1.700 1.700 2.550 4.250 0.850 0.298 0.850 0.850 0.425 3.400 1.000 0.784 1.681 0.286 0.417 1.190
19 Pre paid market share 2.550 4.250 0.425 0.425 2.550 3.400 3.400 2.550 2.550 2.550 4.250 1.700 0.383 1.275 0.850 0.255 3.400 1.275 1.000 2.353 0.229 0.333 2.778
20 Pre paid penetration rate 2.975 4.250 0.425 0.425 1.275 3.400 3.400 2.550 2.550 2.550 4.250 0.680 0.298 0.850 0.850 0.255 3.400 0.595 0.425 1.000 0.143 0.208 0.417
21 Total pre paid outgoing billable traffic 7.000 8.750 0.875 0.875 7.000 7.000 7.000 5.250 5.250 7.000 8.750 3.500 5.250 5.250 1.750 5.250 8.750 3.500 4.375 7.000 1.000 1.667 2.083
22 Total pre paid incoming billable traffic 4.200 6.000 0.600 0.600 4.800 4.800 4.800 3.600 3.600 4.800 6.000 2.400 3.600 3.600 1.200 3.600 6.000 2.400 3.000 4.800 0.600 1.000 3.333
23 Pre paid billing system availability 2.400 3.000 0.360 0.360 1.080 6.000 6.000 3.600 4.800 2.400 6.000 0.600 1.200 2.400 0.960 1.200 3.600 0.840 0.360 2.400 0.480 0.300 1.000

114
Table H.1: IS department pairwise comparison matrix for all sub criteria used.
ANORM (CRITERIA) 1 2 3 4 5 6 7 8 9 10 11 12 13 14 15 16 17 18 19 20 21 22 23
1 Days to deliver invoice 0.016 0.002 0.010 0.096 0.006 0.030 0.030 0.022 0.034 0.069 0.017 0.015 0.008 0.135 0.014 0.023 0.008 0.011 0.014 0.009 0.018 0.021 0.017
2 Cost per productive hour 0.137 0.019 0.244 0.289 0.009 0.030 0.030 0.022 0.024 0.010 0.017 0.020 0.009 0.054 0.016 0.023 0.008 0.012 0.009 0.006 0.014 0.015 0.014
3 Pre paid total revenue 0.098 0.005 0.059 0.160 0.056 0.030 0.050 0.022 0.024 0.042 0.055 0.061 0.093 0.009 0.110 0.114 0.111 0.085 0.087 0.061 0.145 0.145 0.113
4
Earnings before interest, tax, depreciation
and amortisation (EBITDA) 0.005 0.002 0.011 0.030 0.056 0.050 0.050 0.044 0.024 0.030 0.055 0.061 0.047 0.005 0.184 0.114 0.083 0.085 0.087 0.061 0.145 0.145 0.113
5 Mobile handset and accessory sales 0.077 0.055 0.028 0.014 0.026 0.050 0.050 0.032 0.024 0.042 0.041 0.031 0.012 0.007 0.028 0.076 0.056 0.021 0.014 0.020 0.018 0.018 0.038
6 License and management fees 0.008 0.009 0.028 0.009 0.008 0.014 0.015 0.011 0.008 0.007 0.007 0.009 0.007 0.039 0.018 0.015 0.011 0.014 0.011 0.008 0.018 0.018 0.007
7 Operational Expenses (OPEX) 0.008 0.009 0.017 0.009 0.008 0.014 0.014 0.015 0.008 0.007 0.008 0.010 0.008 0.039 0.018 0.009 0.007 0.014 0.011 0.008 0.018 0.018 0.007
8 Bad debt provisioning 0.015 0.018 0.056 0.014 0.018 0.027 0.020 0.021 0.009 0.021 0.017 0.012 0.012 0.090 0.022 0.008 0.006 0.021 0.014 0.010 0.024 0.024 0.011
9 Taxes 0.011 0.018 0.056 0.029 0.025 0.041 0.040 0.050 0.022 0.014 0.007 0.020 0.023 0.021 0.022 0.008 0.006 0.021 0.014 0.010 0.024 0.024 0.009
10 Dealer commissions 0.005 0.037 0.028 0.020 0.013 0.041 0.040 0.020 0.032 0.020 0.011 0.015 0.010 0.014 0.014 0.023 0.017 0.014 0.014 0.010 0.018 0.018 0.017
11 Creditors and accounts payable 0.015 0.018 0.017 0.009 0.010 0.034 0.027 0.020 0.053 0.028 0.016 0.015 0.013 0.014 0.014 0.015 0.011 0.009 0.009 0.006 0.014 0.015 0.007
12 Pre paid opening clients 0.055 0.049 0.050 0.026 0.045 0.085 0.072 0.089 0.057 0.067 0.053 0.052 0.233 0.054 0.022 0.065 0.048 0.043 0.022 0.038 0.036 0.036 0.068
13
Pre paid Average Revenue per User
(ARPU) 0.083 0.082 0.025 0.026 0.090 0.085 0.072 0.071 0.038 0.076 0.049 0.009 0.040 0.090 0.138 0.057 0.042 0.122 0.097 0.087 0.024 0.024 0.034
14 Total on network 0.003 0.008 0.149 0.155 0.090 0.008 0.008 0.005 0.025 0.034 0.027 0.022 0.010 0.023 0.015 0.091 0.067 0.043 0.029 0.030 0.024 0.024 0.017
15 Total off network 0.055 0.057 0.025 0.008 0.045 0.036 0.036 0.045 0.048 0.067 0.053 0.110 0.013 0.072 0.047 0.114 0.083 0.043 0.043 0.030 0.072 0.073 0.043
16 Operating income per pre paid client 0.014 0.016 0.010 0.005 0.007 0.018 0.030 0.054 0.057 0.017 0.020 0.015 0.013 0.005 0.008 0.019 0.020 0.085 0.145 0.101 0.024 0.024 0.034
17 OPEX per pre paid client 0.028 0.033 0.007 0.005 0.007 0.018 0.030 0.054 0.057 0.017 0.020 0.015 0.013 0.005 0.008 0.014 0.014 0.011 0.011 0.008 0.014 0.015 0.011
18 Total pre paid clients 0.055 0.057 0.025 0.013 0.045 0.036 0.036 0.036 0.038 0.050 0.067 0.044 0.012 0.020 0.040 0.008 0.048 0.036 0.029 0.043 0.036 0.036 0.049
19 Pre paid market share 0.042 0.082 0.025 0.013 0.067 0.049 0.048 0.054 0.057 0.050 0.067 0.088 0.015 0.029 0.040 0.005 0.048 0.046 0.037 0.061 0.029 0.029 0.113
20 Pre paid penetration rate 0.048 0.082 0.025 0.013 0.034 0.049 0.048 0.054 0.057 0.050 0.067 0.035 0.012 0.020 0.040 0.005 0.048 0.022 0.016 0.026 0.018 0.018 0.017
21 Total pre paid outgoing billable traffic 0.114 0.168 0.051 0.027 0.185 0.100 0.099 0.110 0.118 0.139 0.138 0.182 0.208 0.121 0.082 0.102 0.124 0.127 0.162 0.181 0.127 0.145 0.085
22 Total pre paid incoming billable traffic 0.068 0.115 0.035 0.018 0.127 0.069 0.068 0.076 0.081 0.095 0.094 0.125 0.142 0.083 0.056 0.070 0.085 0.087 0.111 0.124 0.076 0.087 0.136
23 Pre paid billing system availability 0.039 0.058 0.021 0.011 0.028 0.086 0.085 0.076 0.107 0.048 0.094 0.031 0.047 0.055 0.045 0.023 0.051 0.030 0.013 0.062 0.061 0.026 0.041
Table H.2: Normalised matrix for IS department pairwise comparison matrix.
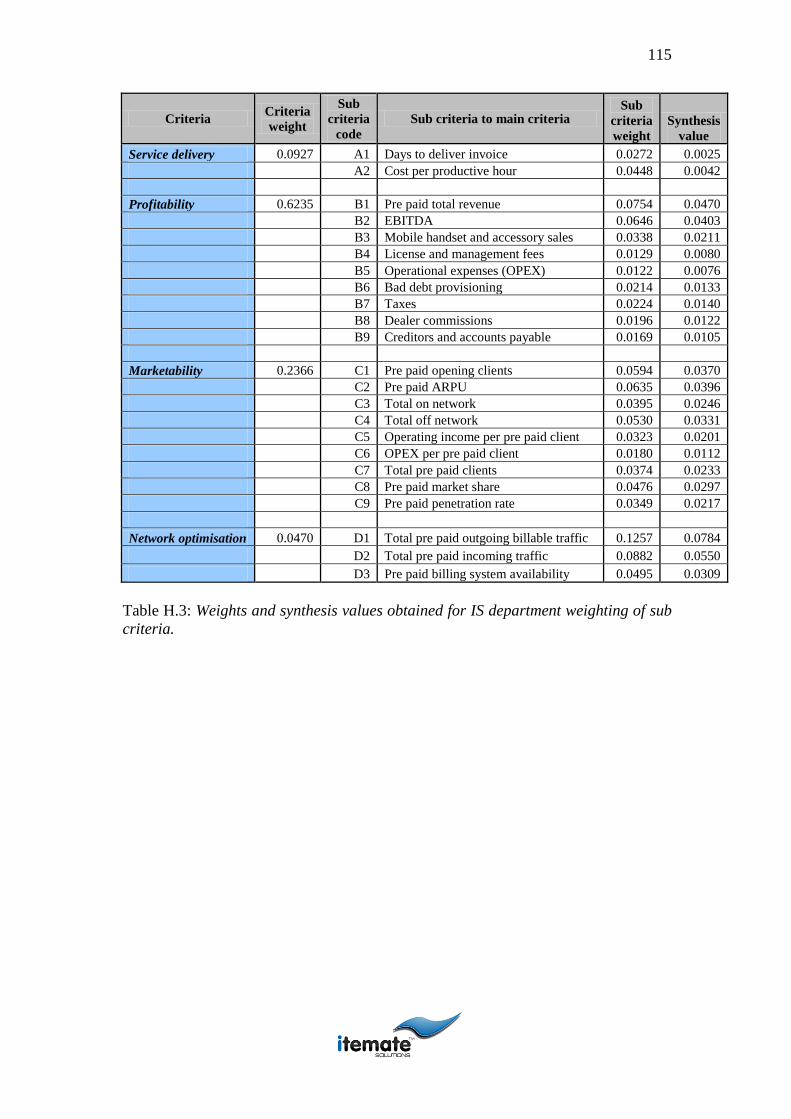
115
Criteria Criteria
weight
Sub
criteria
code
Sub criteria to main criteria Sub
criteria
weight
Synthesis
value
Service delivery 0.0927 A1 Days to deliver invoice 0.0272 0.0025
A2 Cost per productive hour 0.0448 0.0042
Profitability 0.6235 B1 Pre paid total revenue 0.0754 0.0470
B2 EBITDA 0.0646 0.0403
B3 Mobile handset and accessory sales 0.0338 0.0211
B4 License and management fees 0.0129 0.0080
B5 Operational expenses (OPEX) 0.0122 0.0076
B6 Bad debt provisioning 0.0214 0.0133
B7 Taxes 0.0224 0.0140
B8 Dealer commissions 0.0196 0.0122
B9 Creditors and accounts payable 0.0169 0.0105
Marketability 0.2366 C1 Pre paid opening clients 0.0594 0.0370
C2 Pre paid ARPU 0.0635 0.0396
C3 Total on network 0.0395 0.0246
C4 Total off network 0.0530 0.0331
C5 Operating income per pre paid client 0.0323 0.0201
C6 OPEX per pre paid client 0.0180 0.0112
C7 Total pre paid clients 0.0374 0.0233
C8 Pre paid market share 0.0476 0.0297
C9 Pre paid penetration rate 0.0349 0.0217
Network optimisation 0.0470 D1 Total pre paid outgoing billable traffic 0.1257 0.0784
D2 Total pre paid incoming traffic 0.0882 0.0550
D3 Pre paid billing system availability 0.0495 0.0309
Table H.3: Weights and synthesis values obtained for IS department weighting of sub
criteria.
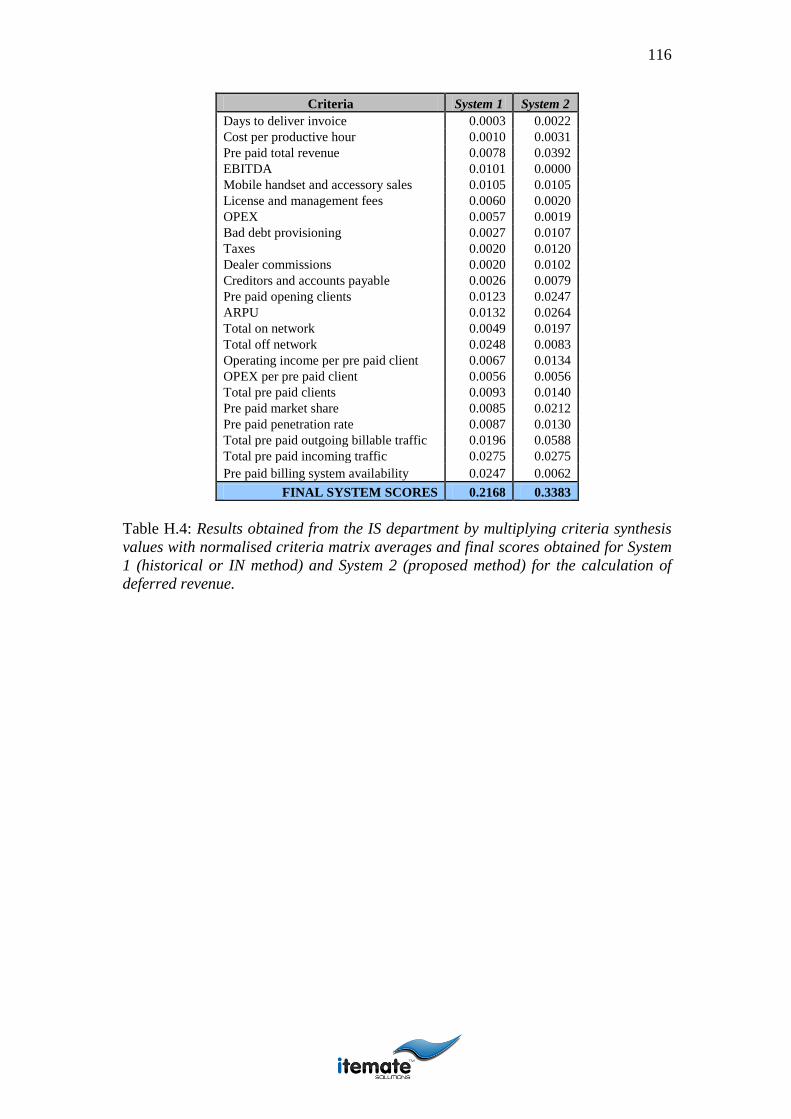
116
Criteria System 1 System 2
Days to deliver invoice 0.0003 0.0022
Cost per productive hour 0.0010 0.0031
Pre paid total revenue 0.0078 0.0392
EBITDA 0.0101 0.0000
Mobile handset and accessory sales 0.0105 0.0105
License and management fees 0.0060 0.0020
OPEX 0.0057 0.0019
Bad debt provisioning 0.0027 0.0107
Taxes 0.0020 0.0120
Dealer commissions 0.0020 0.0102
Creditors and accounts payable 0.0026 0.0079
Pre paid opening clients 0.0123 0.0247
ARPU 0.0132 0.0264
Total on network 0.0049 0.0197
Total off network 0.0248 0.0083
Operating income per pre paid client 0.0067 0.0134
OPEX per pre paid client 0.0056 0.0056
Total pre paid clients 0.0093 0.0140
Pre paid market share 0.0085 0.0212
Pre paid penetration rate 0.0087 0.0130
Total pre paid outgoing billable traffic 0.0196 0.0588
Total pre paid incoming traffic 0.0275 0.0275
Pre paid billing system availability 0.0247 0.0062
FINAL SYSTEM SCORES 0.2168 0.3383
Table H.4: Results obtained from the IS department by multiplying criteria synthesis
values with normalised criteria matrix averages and final scores obtained for System
1 (historical or IN method) and System 2 (proposed method) for the calculation of
deferred revenue.


