These instructions do not purport to cover all details or variations in equipment, nor to provide for every possiblecontingency to be met during installation, operation, and maintenance. The information is supplied for informationalpurposes only, and GE makes no warranty as to the accuracy of the information included herein. Changes, modifications,and/or improvements to equipment and specifications are made periodically and these changes may or may not be reflectedherein. It is understood that GE may make changes, modifications, or improvements to the equipment referenced herein or tothe document itself at any time. This document is intended for trained personnel familiar with the GE products referencedherein.
Public – This document is approved for public disclosure.
GE may have patents or pending patent applications covering subject matter in this document. The furnishing of thisdocument does not provide any license whatsoever to any of these patents.
GE provides the following document and the information included therein as is and without warranty of any kind,expressed or implied, including but not limited to any implied statutory warranty of merchantability or fitness forparticular purpose.
For further assistance or technical information, contact the nearest GE Sales or Service Office, or an authorized GE SalesRepresentative.
Capture Buffer/Dynamic Data Recorder TrendAdded the section Stored Capture Buffer Data to provide the procedure toaccess stored capture buffer data after a loss of power
Acronyms and AbbreviationsCDM Combustion Dynamics MonitoringCSV comma separated valueFFT fast Fourier transformHMI Human-machine InterfaceOPC DA OPC Data AccessOPC UA OPC Unified ArchitecturePME Proficy Machine Edition
Related DocumentsDocument # TitleGEH-6700 ToolboxST User Guide for Mark Controls PlatformGEH-6721_Vol_III Mark VIe and Mark VIeS Controls Systems Volume III: For GE Industrial ApplicationsGFK-2224 PACSystems RX7i, RX3i, and RSTi-EP TCP/IP Ethernet Communications User Manual
2 GEI-100795P TrenderFor public disclosure
Contents1 Overview ....................................................................................................................................................42 Display Features...........................................................................................................................................63 Data Sources................................................................................................................................................73.1 Live Trend.............................................................................................................................................93.2 Historical Trend.................................................................................................................................... 193.3 Capture Buffer/Dynamic Data Recorder Trend ........................................................................................... 203.4 Static File Trend ................................................................................................................................... 293.5 CDM On Demand................................................................................................................................. 303.6 Retrieve Data ....................................................................................................................................... 303.7 Variable Status ..................................................................................................................................... 31
7 Trace Settings ............................................................................................................................................ 457.1 Auto-range Trace .................................................................................................................................. 457.2 Manual Range Adjustment...................................................................................................................... 457.3 Colors................................................................................................................................................. 457.4 Hide or Show Traces ............................................................................................................................. 467.5 Statistical Calculations........................................................................................................................... 46
8 Command Line Arguments ........................................................................................................................... 479 Print and Export Data .................................................................................................................................. 4810 Spectral Analysis ...................................................................................................................................... 49
Instruction Guide GEI-100795P 3For public disclosure
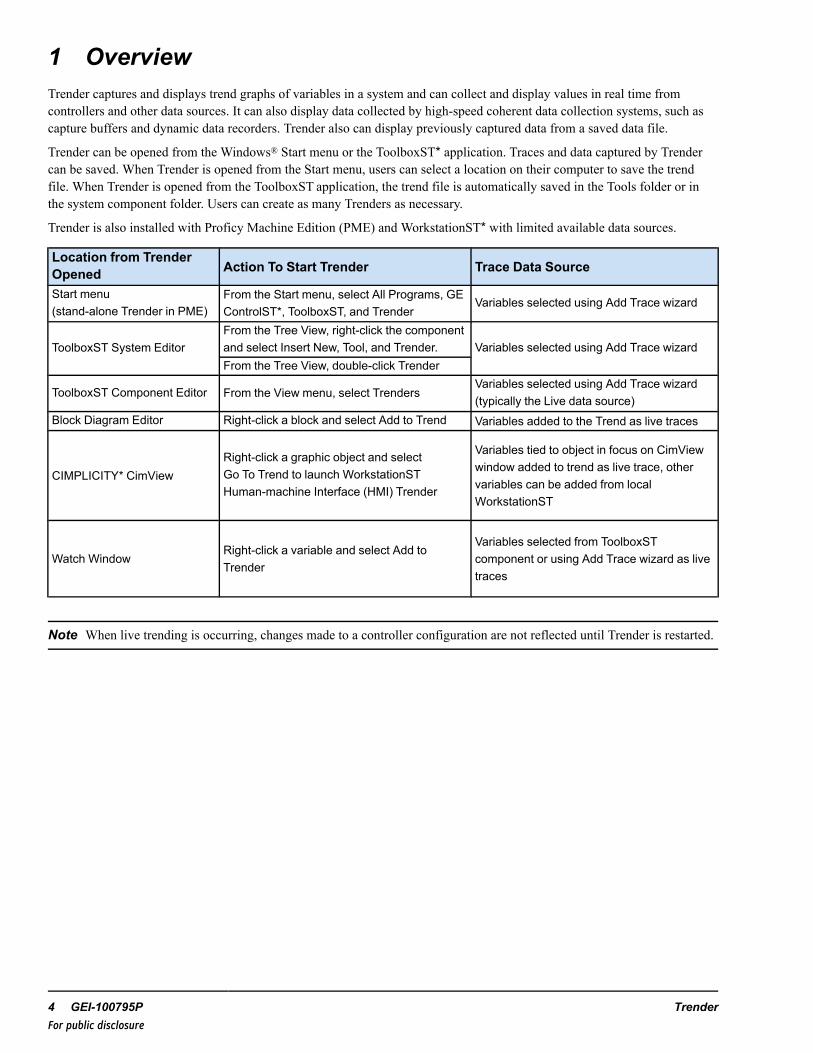
1 OverviewTrender captures and displays trend graphs of variables in a system and can collect and display values in real time fromcontrollers and other data sources. It can also display data collected by high-speed coherent data collection systems, such ascapture buffers and dynamic data recorders. Trender also can display previously captured data from a saved data file.
Trender can be opened from the Windows® Start menu or the ToolboxST* application. Traces and data captured by Trendercan be saved. When Trender is opened from the Start menu, users can select a location on their computer to save the trendfile. When Trender is opened from the ToolboxST application, the trend file is automatically saved in the Tools folder or inthe system component folder. Users can create as many Trenders as necessary.
Trender is also installed with Proficy Machine Edition (PME) and WorkstationST* with limited available data sources.
Location from TrenderOpened Action To Start Trender Trace Data Source
Start menu(stand-alone Trender in PME)
From the Start menu, select All Programs, GEControlST*, ToolboxST, and Trender
Variables selected using Add Trace wizard
ToolboxST System EditorFrom the Tree View, right-click the componentand select Insert New, Tool, and Trender. Variables selected using Add Trace wizardFrom the Tree View, double-click Trender
ToolboxST Component Editor From the View menu, select TrendersVariables selected using Add Trace wizard(typically the Live data source)
Block Diagram Editor Right-click a block and select Add to Trend Variables added to the Trend as live traces
CIMPLICITY* CimViewRight-click a graphic object and selectGo To Trend to launch WorkstationSTHuman-machine Interface (HMI) Trender
Variables tied to object in focus on CimViewwindow added to trend as live trace, othervariables can be added from localWorkstationST
Watch WindowRight-click a variable and select Add toTrender
Variables selected from ToolboxSTcomponent or using Add Trace wizard as livetraces
Note When live trending is occurring, changes made to a controller configuration are not reflected until Trender is restarted.
4 GEI-100795P TrenderFor public disclosure
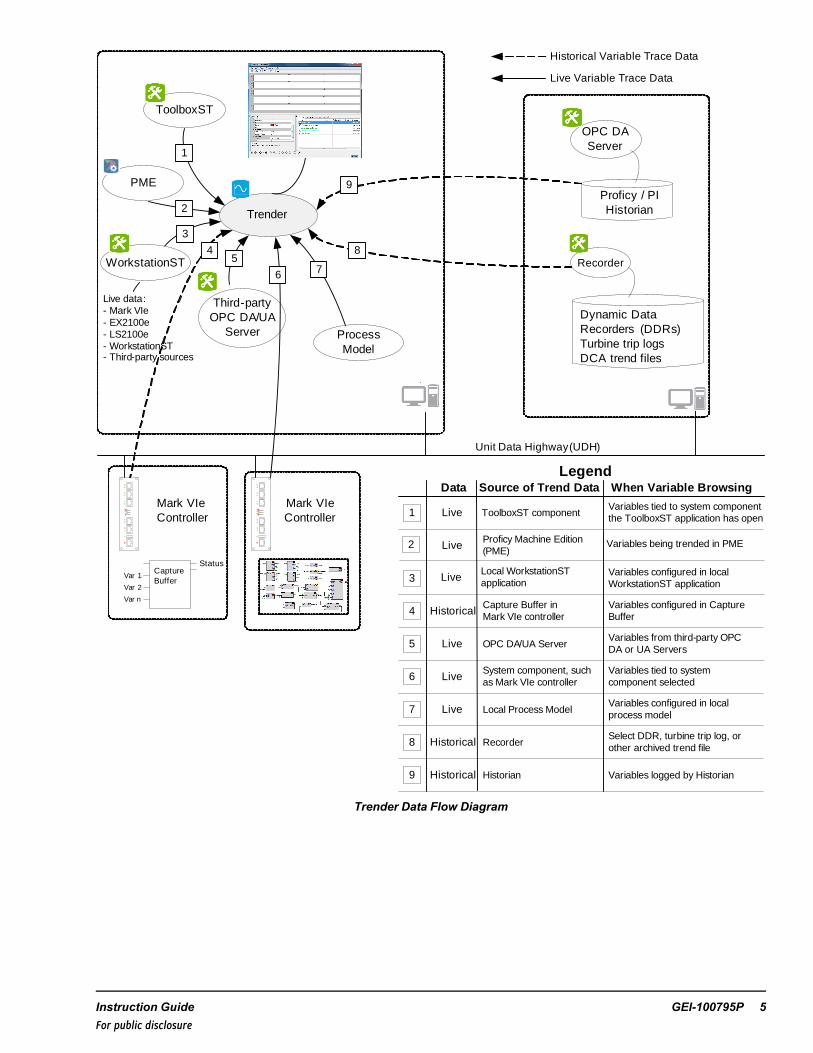
Unit Data Highway (UDH)
Third-party OPC DA/UA
Server
Trender
ToolboxST
Recorder
Dynamic Data Recorders (DDRs)Turbine trip logsDCA trend files
OPC DA Server
Live data:- Mark VIe- EX2100e- LS2100e- WorkstationST- Third-party sources
CaptureBuffer
Status
Var 1
Var 2
Var n
Mark VIe Controller
8
6WorkstationST
4
Process Model
3
9
Historical Variable Trace Data
Live Variable Trace Data
Mark VIe Controller
Proficy / PI Historian
1
57
1
Data Source of Trend Data When Variable Browsing
Live ToolboxST component Variables tied to system component the ToolboxST application has open
3
LiveSystem component, such as Mark VIe controller
Variables tied to system component selected
4
Live OPC DA/UA ServerVariables from third-party OPC DA or UA Servers5
Historical RecorderSelect DDR, turbine trip log, or other archived trend file
6
Historical Historian Variables logged by Historian
7
HistoricalCapture Buffer in Mark VIe controller
Variables configured in Capture Buffer
8
LiveProficy Machine Edition (PME)
Variables configured in local WorkstationST application
9
Live Local Process ModelVariables configured in local process model
2
LiveLocal WorkstationST application
Variables being trended in PME
Legend
PME
2
Trender Data Flow Diagram
Instruction Guide GEI-100795P 5For public disclosure
2 Display FeaturesThe following figure describes the features of the Trender window.
Graph View displays trend values represented by each configured trace.
Property Editor allows you to change settings that affect the capture and display of data
Toolbar contains buttons to perform commands
Auxiliary View contains tabs that display information about the current data
Traces tab displays all trending variables
User Note tab allows you to save comments, instructions, or notes about the current chapter
Sources tab displays sources where data is collected
Events tab lists all events that have occurred during the current chapter
Trender Display Features
Note The Trender tool bar may have fewer buttons that represented in this figure if Trender was opened from the ToolboxSTapplication.
6 GEI-100795P TrenderFor public disclosure
3 Data SourcesVariables can be added to Trender from several different data sources that can provide live or historical data. A historical datasource (such as Historian and WorkstationST Recorder) can have thousands of variables with data values that were sampledevery second and span the previous year. Other historical data sources (capture buffers, trip logs, and such) may have fewvariables with values that were sampled every ms over a short period of time. While any number of variables can be added toTrender, all must come from the same type of data source. (For example, you cannot display both live and static file variablessimultaneously.)
Trender represents each variable with a trace. A trace is similar to a digital storage oscilloscope, which displays data bytracing a line across the screen as values are acquired. Traces added to a trend display in the Traces tab. Variables are addedusing the Add Trace Wizard.
Note When a system component providing data source signals to a Trender is replicated, the Trender is replicated, as well.However, previously traced data is not available in the replicated Trender.
➢➢ To add traces and select a data source
1. From the Edit menu, select Add Traces to open the Add Trace Wizard.
2. When the Welcome window displays, click Next.
3. Select the trend type and click Next.
Add Trace Wizard Dialog Box
Note The only applicable data type available for use with PME trending is the Live trend type using OPC UA.CaptureBuffer, Dynamic Data Recorder, and CDM On Demand are not supported in PME. There is no available hardware support forthese capabilities in PACSystem controllers.
Instruction Guide GEI-100795P 7For public disclosure
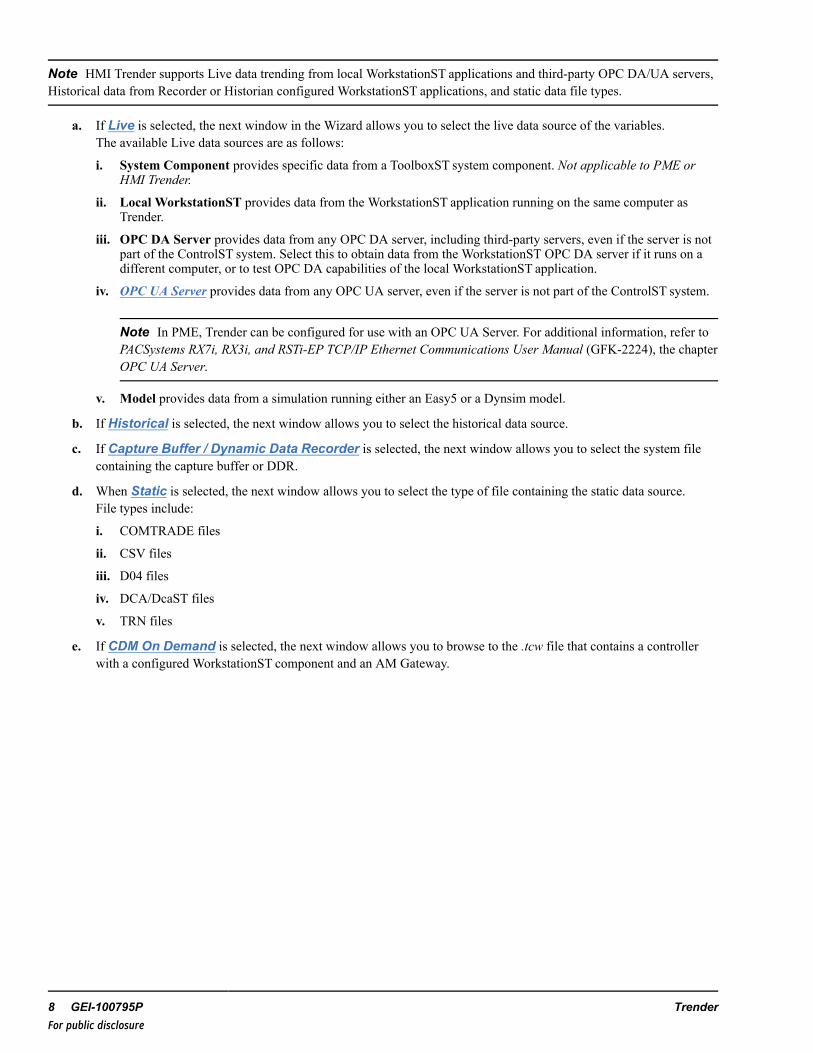
Note HMI Trender supports Live data trending from local WorkstationST applications and third-party OPC DA/UA servers,Historical data from Recorder or Historian configured WorkstationST applications, and static data file types.
a. If Live is selected, the next window in the Wizard allows you to select the live data source of the variables.The available Live data sources are as follows:
i. System Component provides specific data from a ToolboxST system component. Not applicable to PME orHMI Trender.
ii. Local WorkstationST provides data from the WorkstationST application running on the same computer asTrender.
iii. OPC DA Server provides data from any OPC DA server, including third-party servers, even if the server is notpart of the ControlST system. Select this to obtain data from the WorkstationST OPC DA server if it runs on adifferent computer, or to test OPC DA capabilities of the local WorkstationST application.
iv. OPC UA Server provides data from any OPC UA server, even if the server is not part of the ControlST system.
Note In PME, Trender can be configured for use with an OPC UA Server. For additional information, refer toPACSystems RX7i, RX3i, and RSTi-EP TCP/IP Ethernet Communications User Manual (GFK-2224), the chapterOPC UA Server.
v. Model provides data from a simulation running either an Easy5 or a Dynsim model.
b. If Historical is selected, the next window allows you to select the historical data source.
c. If Capture Buffer / Dynamic Data Recorder is selected, the next window allows you to select the system filecontaining the capture buffer or DDR.
d. When Static is selected, the next window allows you to select the type of file containing the static data source.File types include:
i. COMTRADE files
ii. CSV files
iii. D04 files
iv. DCA/DcaST files
v. TRN files
e. If CDM On Demand is selected, the next window allows you to browse to the .tcw file that contains a controllerwith a configured WorkstationST component and an AM Gateway.
8 GEI-100795P TrenderFor public disclosure
3.1 Live TrendLive trends are useful for monitoring systems in continuous operation. Trender displays live trends as incoming data in realtime.
➢➢ To add traces from a Live data source
1. From the Edit menu, select Add Traces.
2. When the Welcome Wizard displays, click Next.
3. Select Live and click Next.
4. Select the data source of the variables and click Next.
Note The following steps assume System Component was selected as the Live data source. The other Live data sourceswill open dialogs to connect to the correct source.
5. Select the component with the variables to trend and click Next. When running Trender from the Start menu, the nextwindow requires you to first select the system, then the component.
6. Select the time period to trend the data and click Next. For controller data, this must be a multiple of the controller framerate.
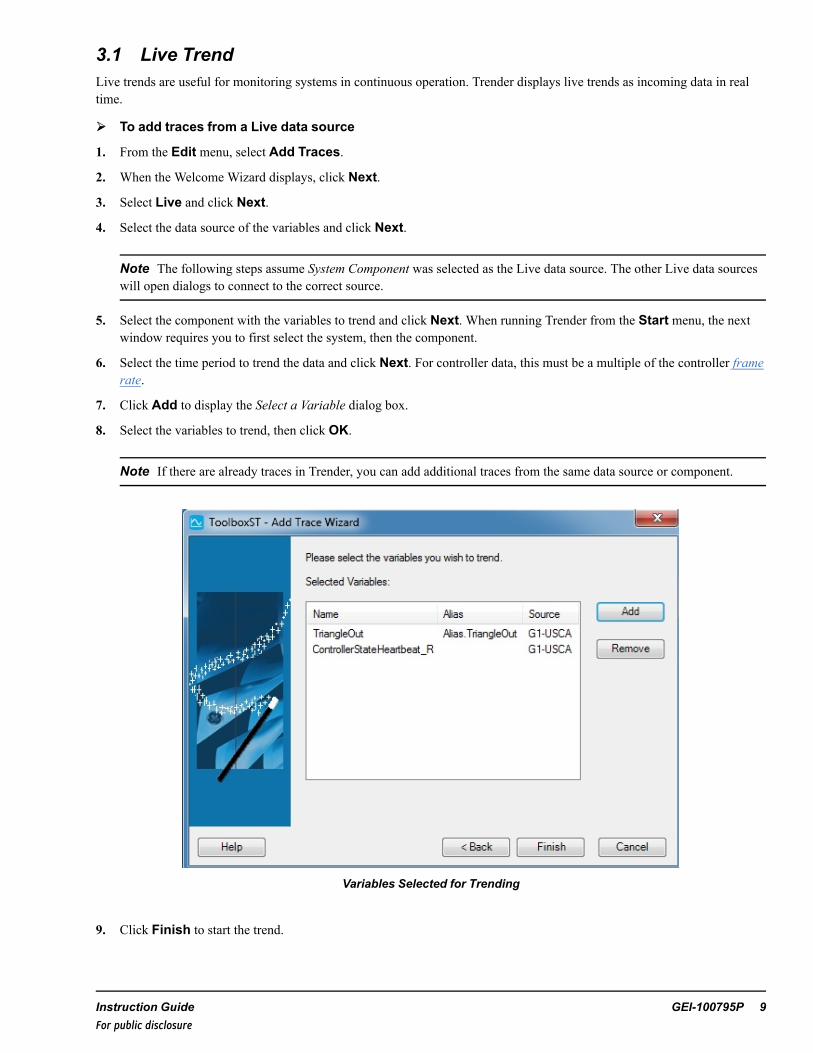
7. Click Add to display the Select a Variable dialog box.
8. Select the variables to trend, then click OK.
Note If there are already traces in Trender, you can add additional traces from the same data source or component.
Variables Selected for Trending
9. Click Finish to start the trend.
Instruction Guide GEI-100795P 9For public disclosure
ToolboxST System Component Frame Period
The default frame period for a trend in the ToolboxST application is the frame rate set in the system component. The frameperiod can be changed in the Property Editor from the Sources tab or from the Add Trace Wizard. For more information aboutframe rate configuration in a ToolboxST system component, refer to the ToolboxST User Guide for Mark Controls Platforms(GEH-6700), the section General Tab.
With the controller selected in the Sources tab, use the drop-down list to select a frame rate
ToolboxST Default Trender Frame Period
10 GEI-100795P TrenderFor public disclosure
3.1.1 OPC UA as Data Source
➢➢ To obtain data from an OPC UA server used with ToolboxST
1. From the Edit menu, select Add Traces.
2. When the welcome wizard displays, click Next.
3. Leave the default trend type as Live and click Next.
4. Select OPC-UA Server as the data source for the variables and click Next.
OPC UA Sever Selected as Data Source in ToolboxST
Attention
To connect to an OPC UA server, you must have that server’s Security Certificate inyour certificate store. For further details, refer to following documents depending onthe system:
•• ToolboxST system: ToolboxST User Guide for Mark Controls Platform (GEH-6700),the section Security Certificate/User Association
•• PME system: PACSystems RX7i and RX3i TCP/IP Ethernet Communications UserManual (GFK-2224), the section OPC UA Server Certificates
Instruction Guide GEI-100795P 11For public disclosure
5. Configure the OPC UA server from which to trend variables.
OPC UA Client Server Connection Configuration
Provide the OPC UA server configuration settings as follows:
Discovery URL: allows the user interface to browse registered OPC UA servers at the selected URL. The default URL opc.tcp://localhost:4840 allows the Endpoint URL drop-down menu to display registered OPC UA servers on the local computer.
Endpoint URL: defines the OPC UA server’s endpoint and optional security settings. Select one of the servers available fromthe Discovery server listed in the drop-down menu, or enter a known URL. Example URLs (provided hyperlinks) aredisplayed for known GE OPC UA servers.
Security Settings: the client can be configured to use a specific security profile using the Security Policy andMessageSecurity Mode drop-down menus, or the client can be made to use the most secure endpoint exposed by the server byselecting the Use Best Security check box. To use no security and avoid exchanging application certificates, select a SecurityPolicy of None and a Message Security Mode of None (the server must support the None security profile).
Authentication settings: the client can be configured to use an anonymous user or a user name and password.
12 GEI-100795P TrenderFor public disclosure
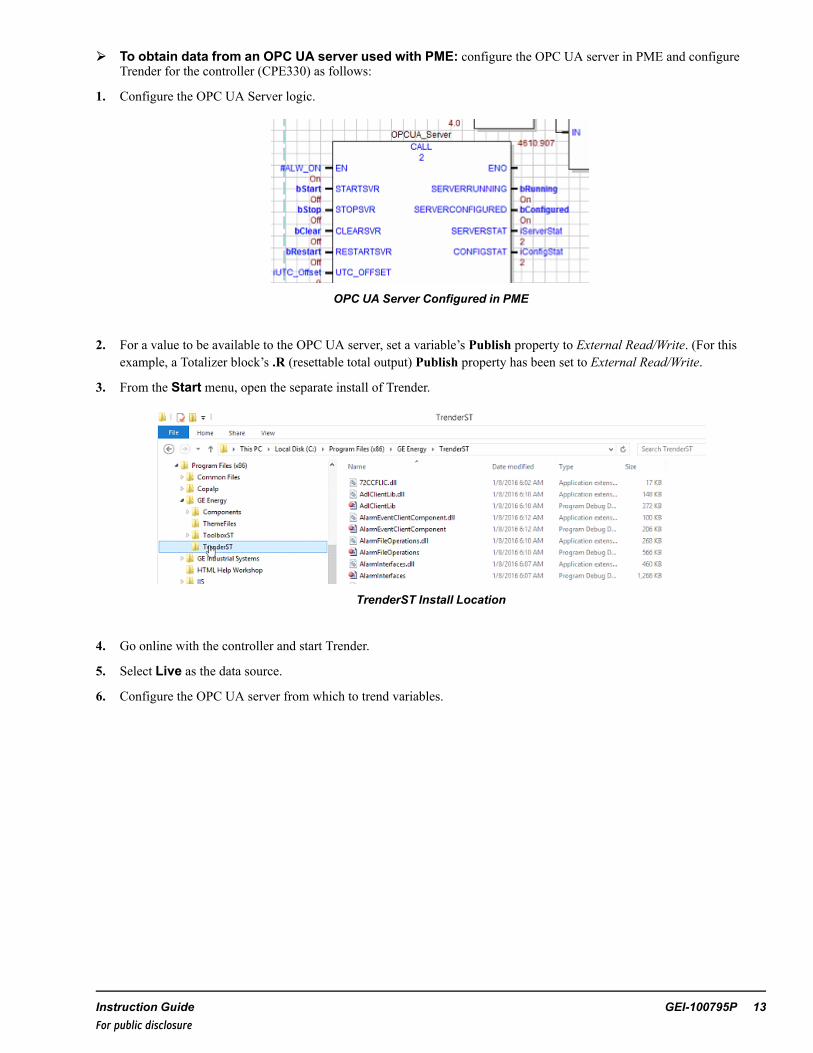
➢➢ To obtain data from an OPC UA server used with PME: configure the OPC UA server in PME and configureTrender for the controller (CPE330) as follows:
1. Configure the OPC UA Server logic.
OPC UA Server Configured in PME
2. For a value to be available to the OPC UA server, set a variable’s Publish property to External Read/Write. (For thisexample, a Totalizer block’s .R (resettable total output) Publish property has been set to External Read/Write.
3. From the Start menu, open the separate install of Trender.
TrenderST Install Location
4. Go online with the controller and start Trender.
5. Select Live as the data source.
6. Configure the OPC UA server from which to trend variables.
Instruction Guide GEI-100795P 13For public disclosure
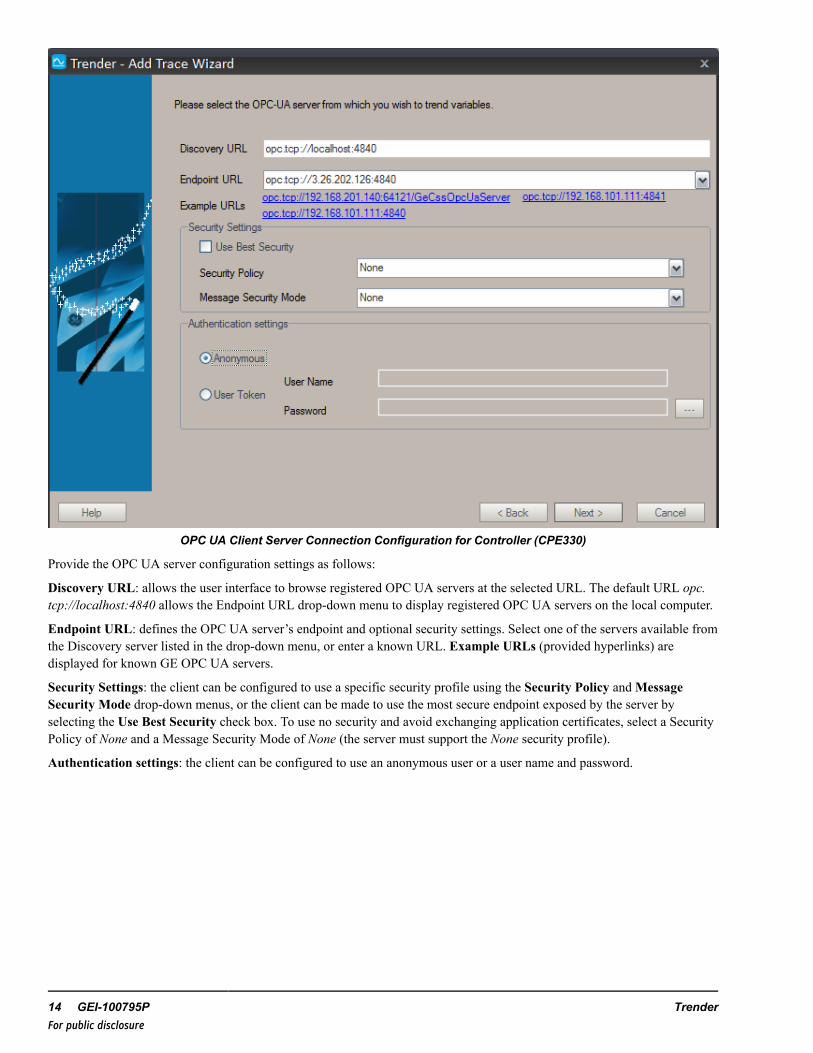
OPC UA Client Server Connection Configuration for Controller (CPE330)
Provide the OPC UA server configuration settings as follows:
Discovery URL: allows the user interface to browse registered OPC UA servers at the selected URL. The default URL opc.tcp://localhost:4840 allows the Endpoint URL drop-down menu to display registered OPC UA servers on the local computer.
Endpoint URL: defines the OPC UA server’s endpoint and optional security settings. Select one of the servers available fromthe Discovery server listed in the drop-down menu, or enter a known URL. Example URLs (provided hyperlinks) aredisplayed for known GE OPC UA servers.
Security Settings: the client can be configured to use a specific security profile using the Security Policy andMessageSecurity Mode drop-down menus, or the client can be made to use the most secure endpoint exposed by the server byselecting the Use Best Security check box. To use no security and avoid exchanging application certificates, select a SecurityPolicy of None and a Message Security Mode of None (the server must support the None security profile).
Authentication settings: the client can be configured to use an anonymous user or a user name and password.
14 GEI-100795P TrenderFor public disclosure
7. Add variables to the trend and configure the appropriate ranges.
Example OPC UATotalizer .R Variable Added to Trender
Instruction Guide GEI-100795P 15For public disclosure
8. Click the Record icon to start the trend.
Live Trender and Record Icon
Note For additional information, refer to PACSystems RX7i and RX3i TCP/IP Ethernet Communications User Manual(GFK-2224), the chapter OPC UA Server.
3.1.2 Add Additional Traces
➢➢ To add additional traces: from the Edit menu, select Add Traces. The Select a Variable dialog box displaysavailable variables for that component.Or click the Add Traces button on the Trender toolbar at the bottom of the Trender window.
Click the drop-down arrow and select Add using Add Trace Wizard to add variables from a different component
The selected variable displays in the Traces tab in the Auxiliary view.
➢➢ To remove traces: from the Edit menu, select Remove Selected Traces.
16 GEI-100795P TrenderFor public disclosure
3.1.3 Triggered TrendTrends from a Live data source can optionally be configured to collect incoming data when a specific triggered event occursin the control system. A triggered event can capture data for a predetermined period before and after the event occurs.
Note These options apply to the current trend only.
➢➢ To configure a triggered trend
1. Add a Live trend.
2. From the File menu, select Properties or click the Trender Properties button.
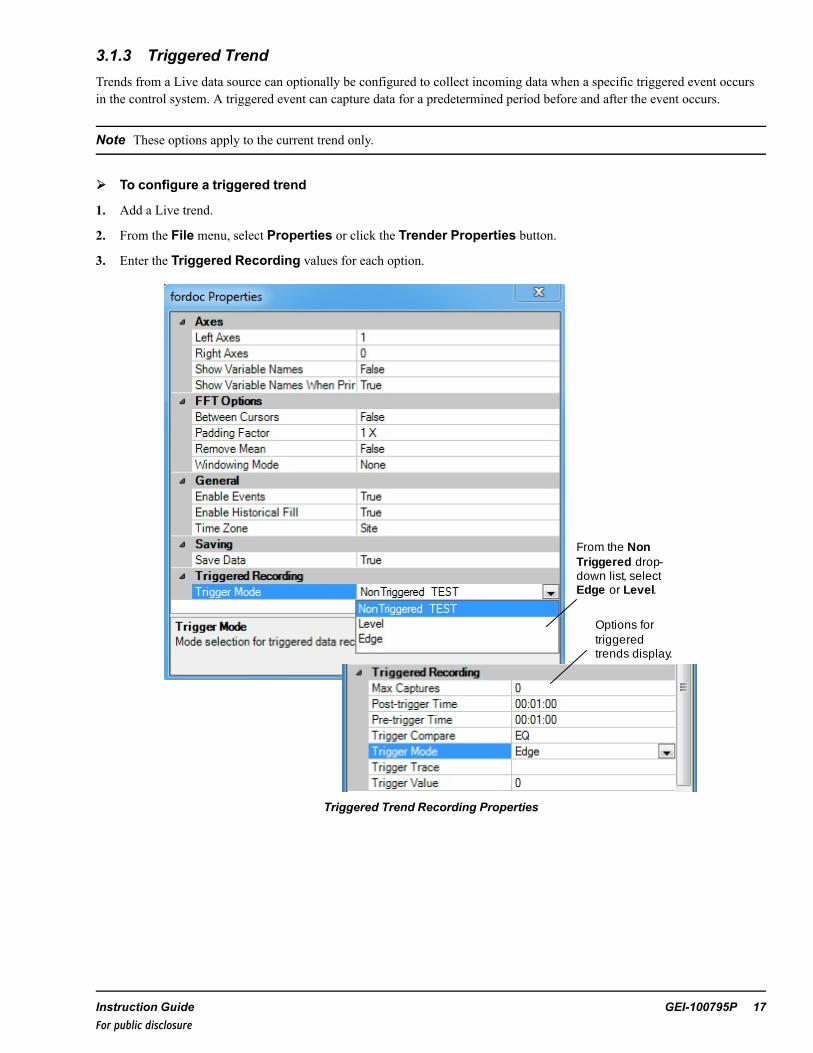
3. Enter the Triggered Recording values for each option.
From the Non Triggered drop-down list, select Edge or Level.
Options for triggered trends display.
Triggered Trend Recording Properties
Instruction Guide GEI-100795P 17For public disclosure
Options for the Triggered Recording include:
• Max Captures is the maximum number of chapters to collect due to a recurring trigger.• Post-trigger Time is the time to capture values after the trigger occurs.• Pre-trigger Time is the time to capture values before the trigger occurs.• Trigger Compare is how the trigger trace value is compared to the trigger value to determine when the value is
captured (for example, greater than).• Trigger Mode can be either edge or level.
− Edge collects pre-trigger and post-trigger samples.− Level collects pre-trigger and post-trigger samples, and also continues to
collect samples until the signal goes False.• Trigger Trace is the trace whose value is compared against the trigger value.• Trigger Value is the value to which the trigger trace value is compared.
While Trender is waiting for the trigger to occur, Pre-Trigger displays in the status bar.
While Trender is collecting data after the trigger occurs, Post-Trigger displays.
18 GEI-100795P TrenderFor public disclosure
3.2 Historical Trend➢➢ To add traces from a Historical data source
1. From the Edit menu, select Add Traces. When the welcome wizard window displays, click Next.
2. Select Historical as the trend type and click Next.
3. Select the Computer name of the workstation configured with the Recorder or Historian feature.
• Data Source automatically populates to identify the type of historical data (Recorder or Historian).• Server and Collection is the source of the data.
− Server (Historian) specifies the OPC HDA server to use.− Collection (Recorder) specifies the live data collection to use.
4. Click Next to continue.
5. Click Add to display the Select a Variable dialog box and select variables to trend.
6. Click OK, then click Finish.
Historical Trend Window
Note The Zoom to Data command in the View menu does not apply to either Historical trends or to the Historical Fillfeature.
Instruction Guide GEI-100795P 19For public disclosure
3.3 Capture Buffer/Dynamic Data Recorder TrendMany components use different methods of high-speed synchronous data capture. While each method addresses differentneeds, all methods are accessed as capture buffers in Trender because they have similar underlying data collectionmechanisms.
Note When running Trender from the Start menu, an extra wizard window displays for the system selection before thecomponent window displays.
➢➢ To add traces from a capture buffer data source
1. From the Edit menu, select Add Traces.
2. When the Welcome wizard window displays, click Next.
3. Select Capture Buffer / Dynamic Data Recorder and click Next.
4. Select the component and click Next to display a list of all available capture buffers.
5. Select one capture buffer and click Finish.
Capture Buffer Trend List
Stored Capture Buffer Data
Capture Buffer data that was saved immediately before the loss of control power is accessible from ToolboxST. A newCapture Buffer must be created using the Trender Wizard, but instead of creating an empty Capture Buffer, access thetime-and-date stamped Capture Buffer containing the stored data.
➢➢ To access stored Capture Buffer data
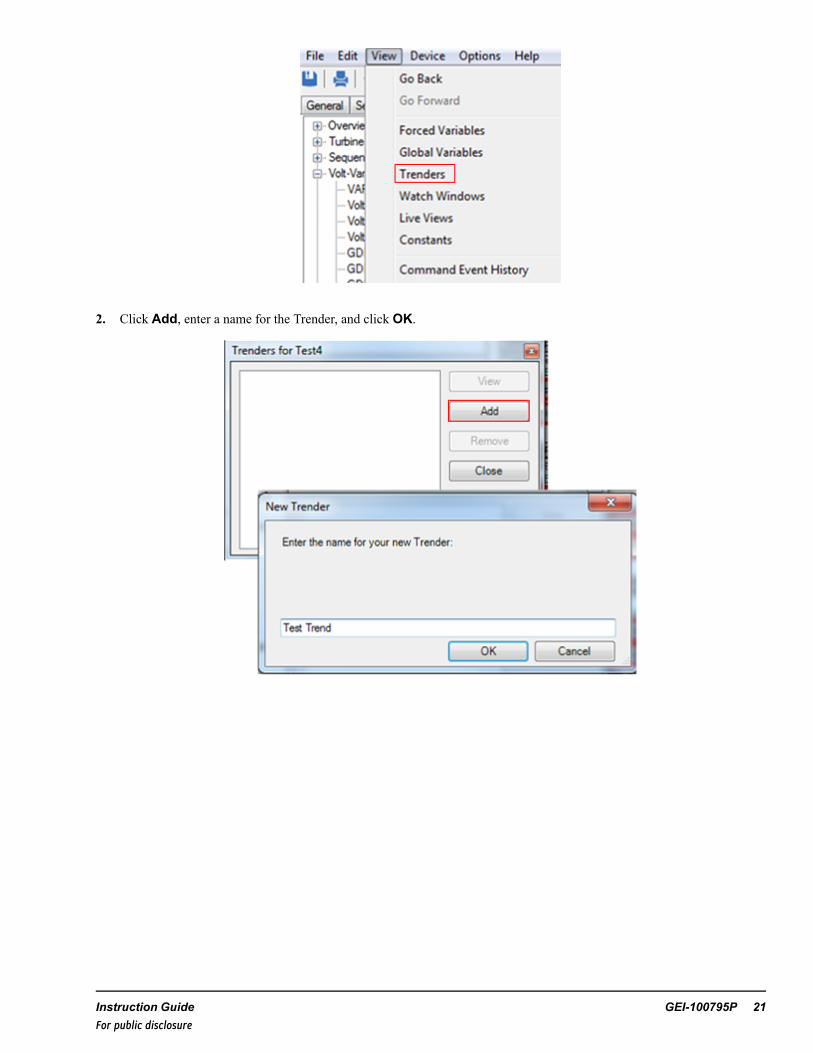
1. From the ToolboxST Component Editor toolbar, select View, then select Trenders.
20 GEI-100795P TrenderFor public disclosure
2. Click Add, enter a name for the Trender, and click OK.
Instruction Guide GEI-100795P 21For public disclosure
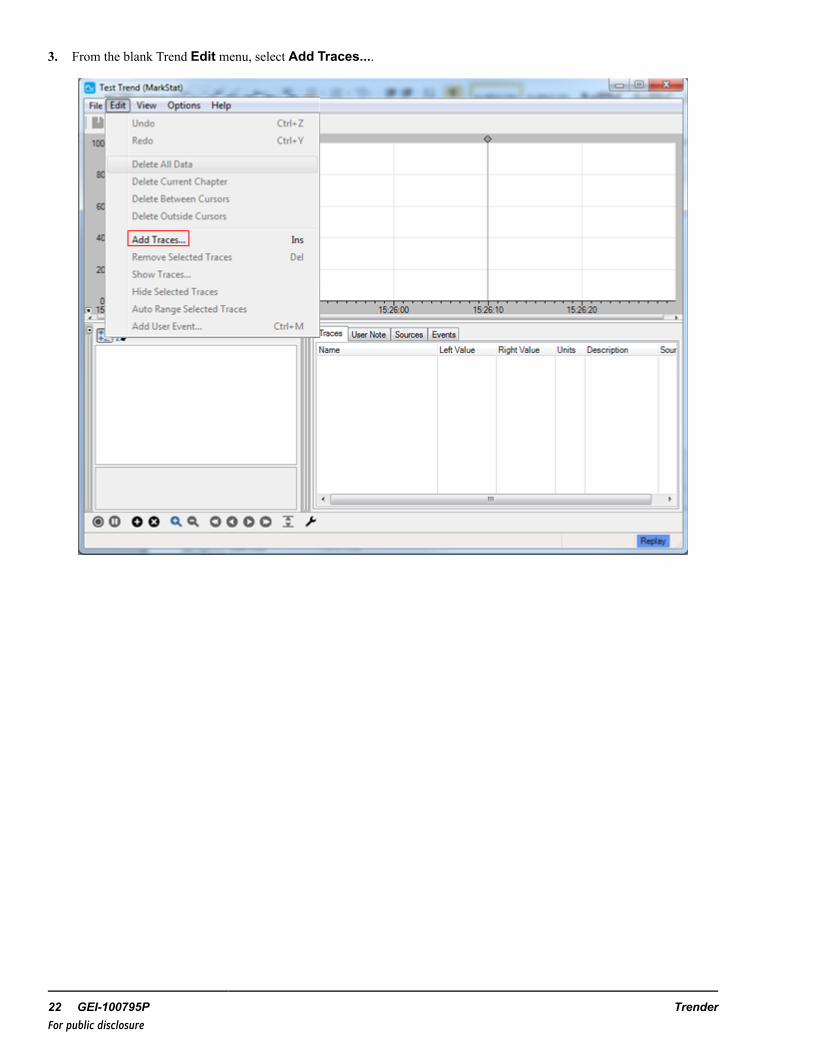
3. From the blank Trend Edit menu, select Add Traces....
22 GEI-100795P TrenderFor public disclosure
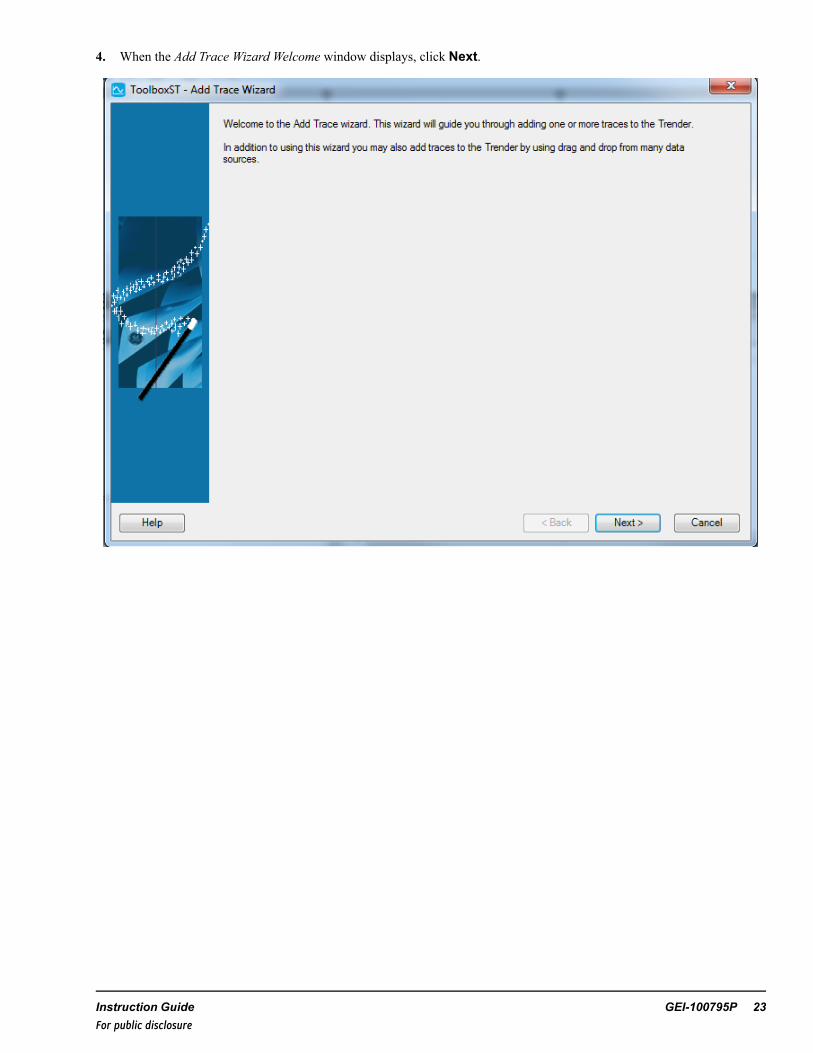
4. When the Add Trace Wizard Welcome window displays, click Next.
Instruction Guide GEI-100795P 23For public disclosure
5. Select Capture Buffer / Dynamic Data Recorder and click Next.
24 GEI-100795P TrenderFor public disclosure
6. Select the appropriate component (device) from the drop-down menu for which the Capture Buffer was created (defaultsto last device you worked in), and click Next.
Instruction Guide GEI-100795P 25For public disclosure
7. Select the Capture Buffer with the last date and time in the system (not saved to flash). The most current one should bethe last one created before power loss.
Note Capture Buffers without dates are currently active in the system.
8. Click Finish to load the trend variables.
26 GEI-100795P TrenderFor public disclosure
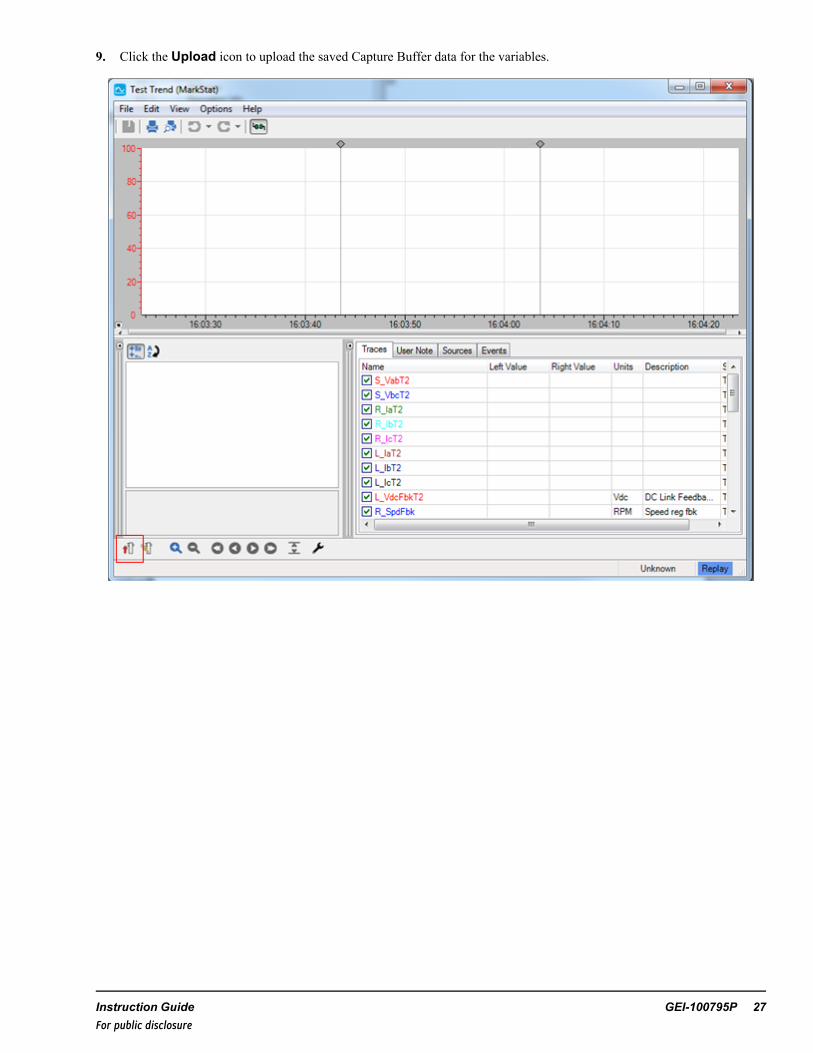
9. Click the Upload icon to upload the saved Capture Buffer data for the variables.
Instruction Guide GEI-100795P 27For public disclosure
Stored Capture Buffer Data Retrieved
28 GEI-100795P TrenderFor public disclosure
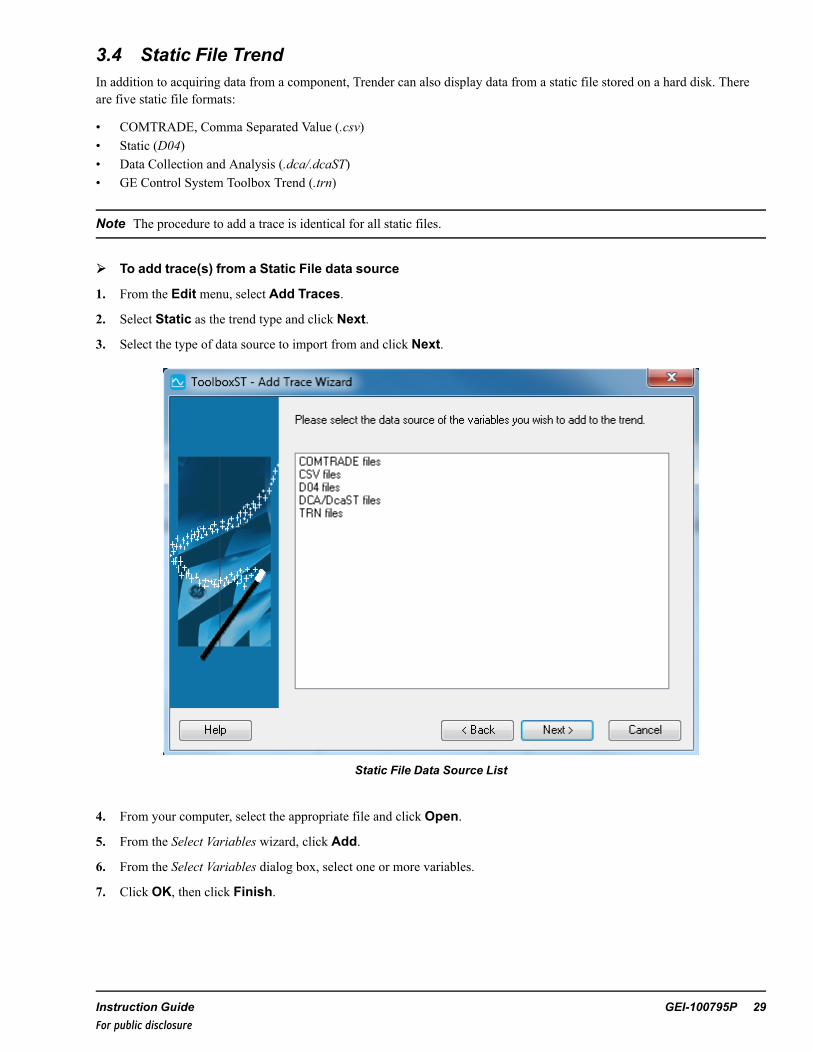
3.4 Static File TrendIn addition to acquiring data from a component, Trender can also display data from a static file stored on a hard disk. Thereare five static file formats:
• COMTRADE, Comma Separated Value (.csv)• Static (D04)• Data Collection and Analysis (.dca/.dcaST)• GE Control System Toolbox Trend (.trn)
Note The procedure to add a trace is identical for all static files.
➢➢ To add trace(s) from a Static File data source
1. From the Edit menu, select Add Traces.
2. Select Static as the trend type and click Next.
3. Select the type of data source to import from and click Next.
Static File Data Source List
4. From your computer, select the appropriate file and click Open.
5. From the Select Variables wizard, click Add.
6. From the Select Variables dialog box, select one or more variables.
7. Click OK, then click Finish.
Instruction Guide GEI-100795P 29For public disclosure
3.5 CDM On DemandIf you select the Skip opening system configuration file check box, the next window allows you to manually enter the name ofthe WorkstationST component running the AM Gateway and the controller that contains the PAMC I/O module forCombustion Dynamics Monitoring (CDM). You can also select them from the provided drop-down lists.
Note For more information, refer to the ToolboxST User Guide for Mark Controls Platform (GEH-6700), the chapter SpecialI/O Functions, and the section Configure PAMC I/O Module, and theMark VIe and Mark VIeS Controls Systems Volume III:For GE Industrial Applications (GEH-6721_Vol_III), the chapter PAMC Acoustic Monitoring Input Module.
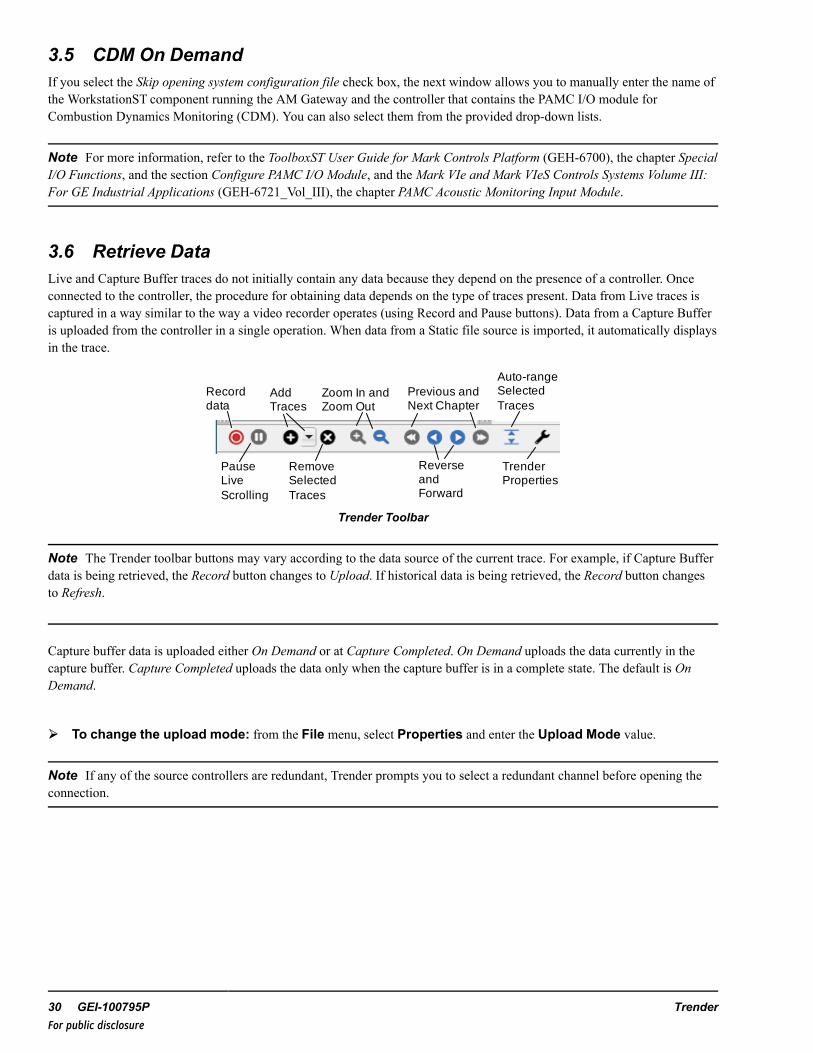
3.6 Retrieve DataLive and Capture Buffer traces do not initially contain any data because they depend on the presence of a controller. Onceconnected to the controller, the procedure for obtaining data depends on the type of traces present. Data from Live traces iscaptured in a way similar to the way a video recorder operates (using Record and Pause buttons). Data from a Capture Bufferis uploaded from the controller in a single operation. When data from a Static file source is imported, it automatically displaysin the trace.
Record data
Add Traces
Zoom In and Zoom Out
Reverse and Forward
Pause Live Scrolling
Remove Selected Traces
Previous and Next Chapter
Trender Properties
Auto-range Selected Traces
Trender Toolbar
Note The Trender toolbar buttons may vary according to the data source of the current trace. For example, if Capture Bufferdata is being retrieved, the Record button changes to Upload. If historical data is being retrieved, the Record button changesto Refresh.
Capture buffer data is uploaded either On Demand or at Capture Completed. On Demand uploads the data currently in thecapture buffer. Capture Completed uploads the data only when the capture buffer is in a complete state. The default is OnDemand.
➢➢ To change the upload mode: from the File menu, select Properties and enter the Upload Mode value.
Note If any of the source controllers are redundant, Trender prompts you to select a redundant channel before opening theconnection.
30 GEI-100795P TrenderFor public disclosure
➢➢ To capture, pause, or retrieve data
1. Click the Online icon.
2. From the Trender toolbar, click the Record Data icon to change Trender to Live mode. The Graph View continuouslyscrolls the time axis to display the latest incoming data while recording.
3. Click Pause to pause recording. The data continues to be collected but Trender switches to Replay mode until Pause isselected again.
4. Click Record Data again and Trender returns to Replay mode.
➢➢ To navigate between chapters: click Previous Chapter or Next Chapter. For more information, refer to the sectionChapters.
Note If these options are grayed, there are no other chapters available.
3.7 Variable StatusThe Auxiliary View displays the trending variables. Healthy variables display in green. If the variable is unhealthy, the valuedisplays in red and it is followed by the letter U.
Variable Status LettersLetter DescriptionU UnhealthyF ForcedA AlarmedK Alarm acknowledgedS Simulated
Instruction Guide GEI-100795P 31For public disclosure
4 Concepts
4.1 ChaptersTrender can record more than one set of data. The basic unit of data capture in Trender is a chapter. A chapter represents onesession, which is either a single upload for a Capture Buffer trend or a single period between clicks of the Record Data buttonfor a Live trend. Chapters are organized chronologically, so the first session is always the first chapter and the most recentsession is always the last chapter.
Trender only displays one chapter of information at a time. The user can navigate between chapters. Each chapter maintainsits own traces and events. The Events tab only displays events applicable to the currently displayed data. Similarly, the UserNote tab is unique to each chapter so comments about a data set are stored alongside each chapter.
4.2 Cursor ValuesIn the Graph View replay mode, two cursors individually select values of time and together select ranges of time. The cursorsare used by a number of functions in Trender, such as trace statistics, user events, and data export. The time represented byeach cursor is displayed in the status bar in the bottom of the Trender window.
Cursor Active cursor Click cursor to activate
Graph View Cursor Values
32 GEI-100795P TrenderFor public disclosure
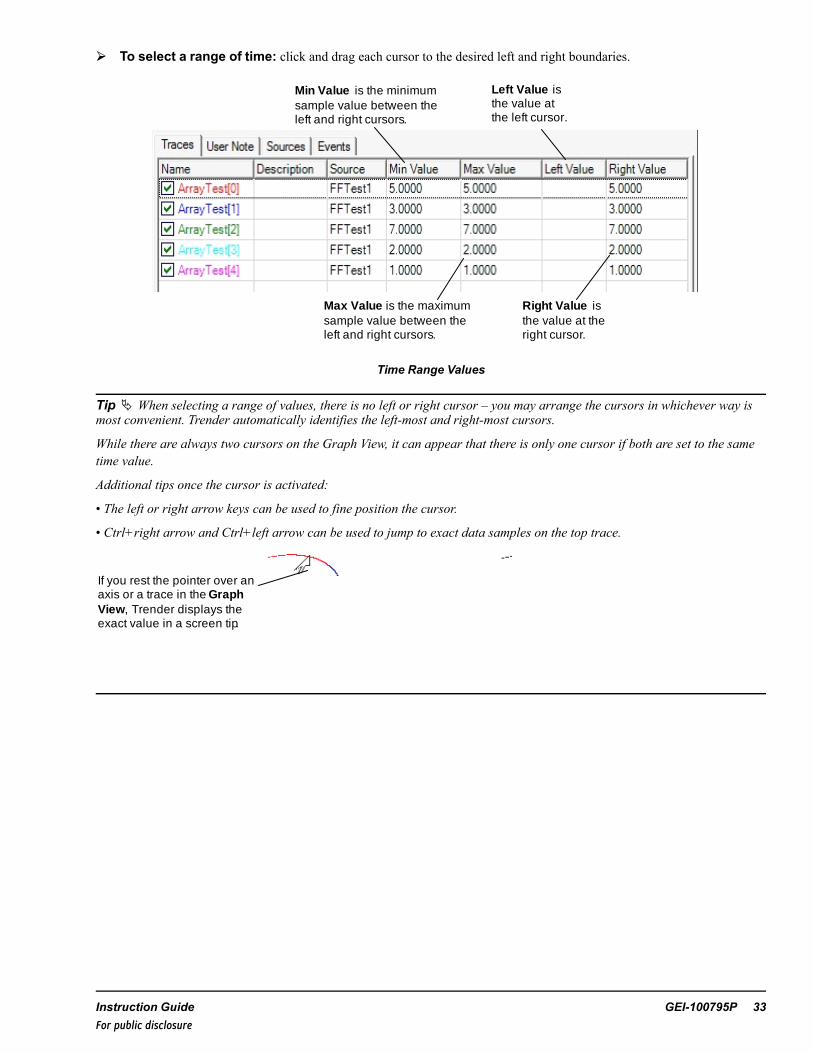
➢➢ To select a range of time: click and drag each cursor to the desired left and right boundaries.
Min Value is the minimum sample value between the left and right cursors.
Left Value is the value at the left cursor.
Max Value is the maximum sample value between the left and right cursors.
Right Value is the value at the right cursor.
Time Range Values
Tip � When selecting a range of values, there is no left or right cursor – you may arrange the cursors in whichever way ismost convenient. Trender automatically identifies the left-most and right-most cursors.
While there are always two cursors on the Graph View, it can appear that there is only one cursor if both are set to the sametime value.
Additional tips once the cursor is activated:
• The left or right arrow keys can be used to fine position the cursor.
• Ctrl+right arrow and Ctrl+left arrow can be used to jump to exact data samples on the top trace.
If you rest the pointer over an axis or a trace in the Graph View, Trender displays the exact value in a screen tip.
Instruction Guide GEI-100795P 33For public disclosure
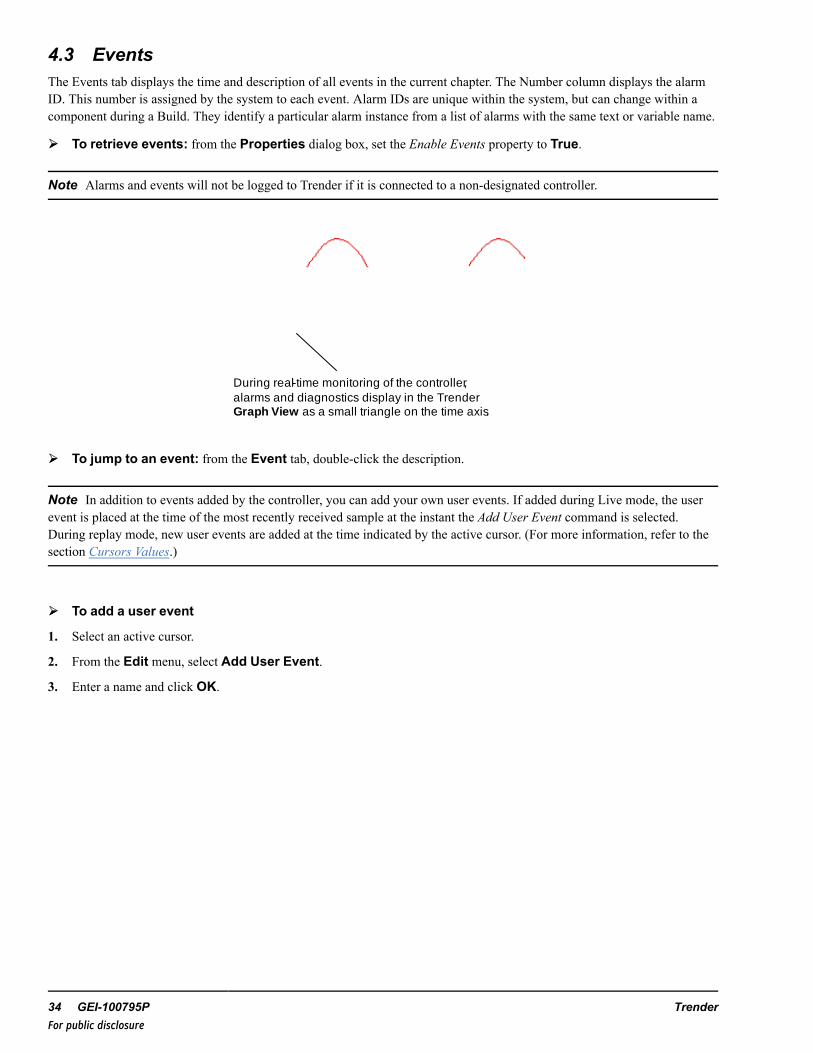
4.3 EventsThe Events tab displays the time and description of all events in the current chapter. The Number column displays the alarmID. This number is assigned by the system to each event. Alarm IDs are unique within the system, but can change within acomponent during a Build. They identify a particular alarm instance from a list of alarms with the same text or variable name.
➢➢ To retrieve events: from the Properties dialog box, set the Enable Events property to True.
Note Alarms and events will not be logged to Trender if it is connected to a non-designated controller.
During real-time monitoring of the controller, alarms and diagnostics display in the Trender Graph View as a small triangle on the time axis.
➢➢ To jump to an event: from the Event tab, double-click the description.
Note In addition to events added by the controller, you can add your own user events. If added during Live mode, the userevent is placed at the time of the most recently received sample at the instant the Add User Event command is selected.During replay mode, new user events are added at the time indicated by the active cursor. (For more information, refer to thesection Cursors Values.)
➢➢ To add a user event
1. Select an active cursor.
2. From the Edit menu, select Add User Event.
3. Enter a name and click OK.
34 GEI-100795P TrenderFor public disclosure
4.4 Historical FillThe Historical Fill option allows you to capture historical data while recording live trends.
➢➢ From the File menu, select Properties.
The Enable Historical Fillproperty is set to True by default.
Historical data is retrieved when Trender starts recording the live data. Trender retrieves three times the trend duration worthof historical data. For example, if the trend duration is one minute, three minutes of historical data is retrieved.
Note Historical data for a variable can only be retrieved if the variable is being collected by the Recorder in theContinuousLive collection or by the Historian.
When in Replay mode, scrolling backward past the last collected data in the Graph View starts a historical fill.
Instruction Guide GEI-100795P 35For public disclosure
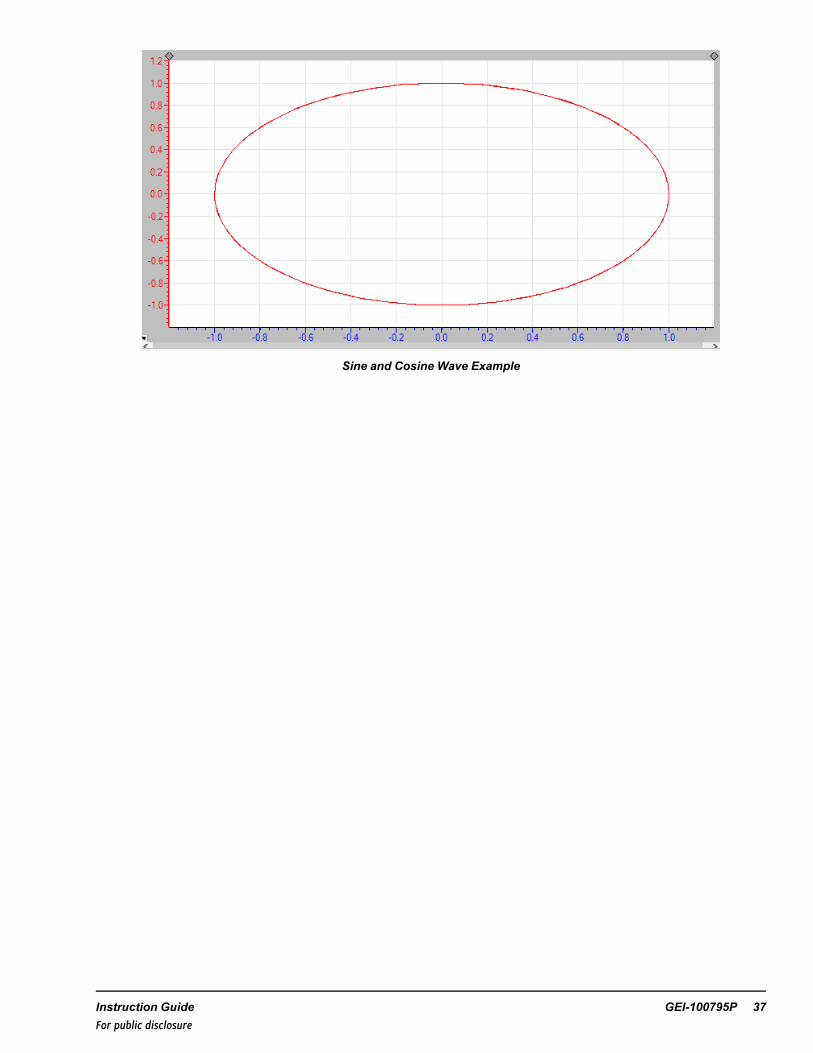
5 X-Y TrendingThe X-Y Trending feature allows you to plot one variable against another.
➢➢ To plot two variables
1. Set the X variable.
From the Tracestab, right-click the variable and select Set as X Variable
2. Set the X-Y plot.
From the View menu, select X-Y Plot .
36 GEI-100795P TrenderFor public disclosure
Sine and Cosine Wave Example
Instruction Guide GEI-100795P 37For public disclosure
6 Graph ViewThe Graph View can display data on either a single graph or a set of stacked graphs. Single Trace mode displays all traces onthe same graph, while Stacked Trace mode displays each trace on an individual graph. In both modes, all traces share thesame time axis, but each trace maintains its own vertical axis.
Note When a trend is first opened in Single Graph mode, the vertical axis corresponds to the first trace listed on the Tracestab. Each trace is drawn according to its own scale. Traces other than the first trace may not correspond to the displayedvertical axes.
If there are too many traces to display stacked graphs effectively in the available space, Trender may revert to Single Tracemode even if you have selected Stacked Trace mode.
➢➢ To display additional vertical axes
1. From the File menu, select Properties.
2. From the [name] Properties dialog box, set the Left Axes to the desired value.
In this example, the Left Axes value is set to five so a vertical axis displays for each trace
38 GEI-100795P TrenderFor public disclosure
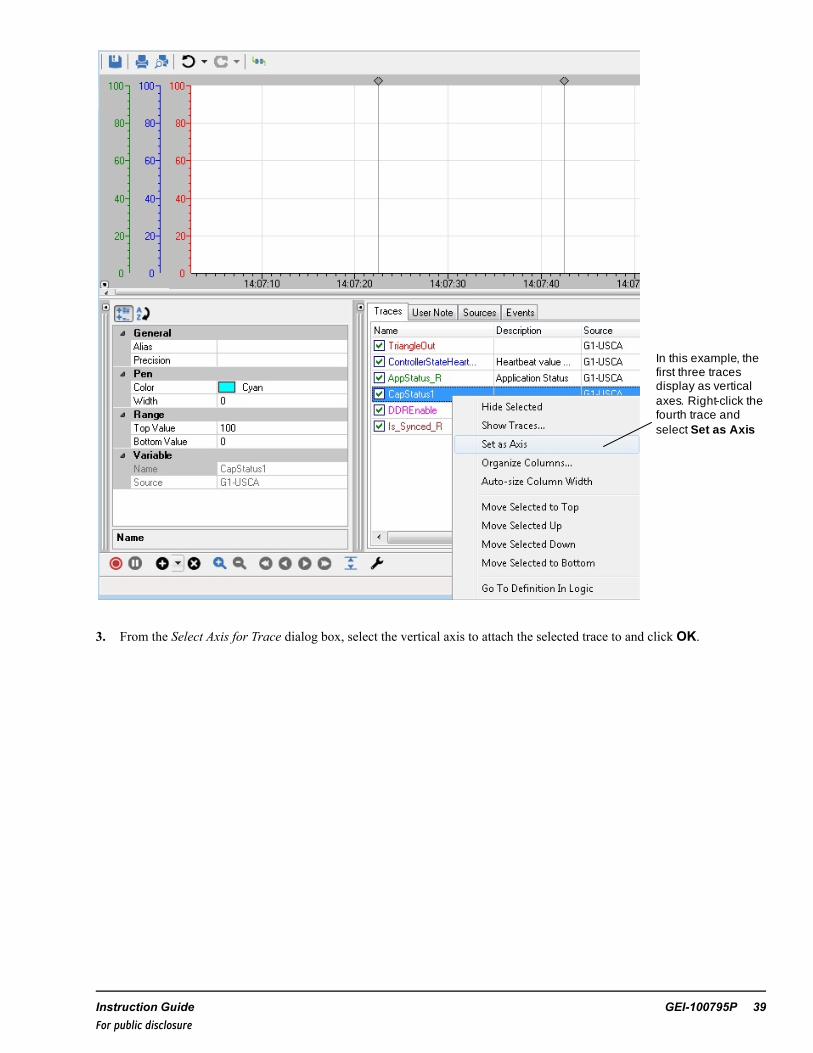
In this example, the first three traces display as vertical axes. Right-click the fourth trace and select Set as Axis
3. From the Select Axis for Trace dialog box, select the vertical axis to attach the selected trace to and click OK.
Instruction Guide GEI-100795P 39For public disclosure
In this example, the selected trace (cyan) displays over the selected vertical axis (green)
Stacked Trace Mode, Single Trace Mode
40 GEI-100795P TrenderFor public disclosure
➢➢ To turn Stacked Trace mode on or off: from the View menu, select Stacked Traces.
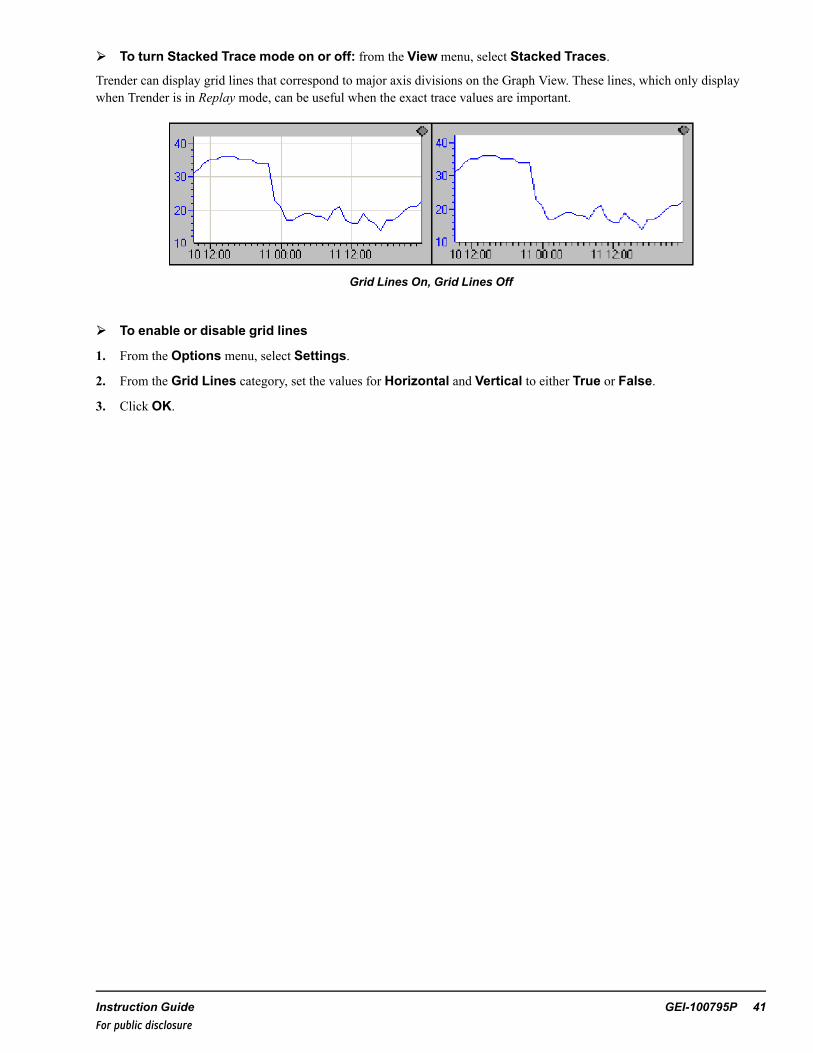
Trender can display grid lines that correspond to major axis divisions on the Graph View. These lines, which only displaywhen Trender is in Replay mode, can be useful when the exact trace values are important.
Grid Lines On, Grid Lines Off
➢➢ To enable or disable grid lines
1. From the Options menu, select Settings.
2. From the Grid Lines category, set the values for Horizontal and Vertical to either True or False.
3. Click OK.
Instruction Guide GEI-100795P 41For public disclosure
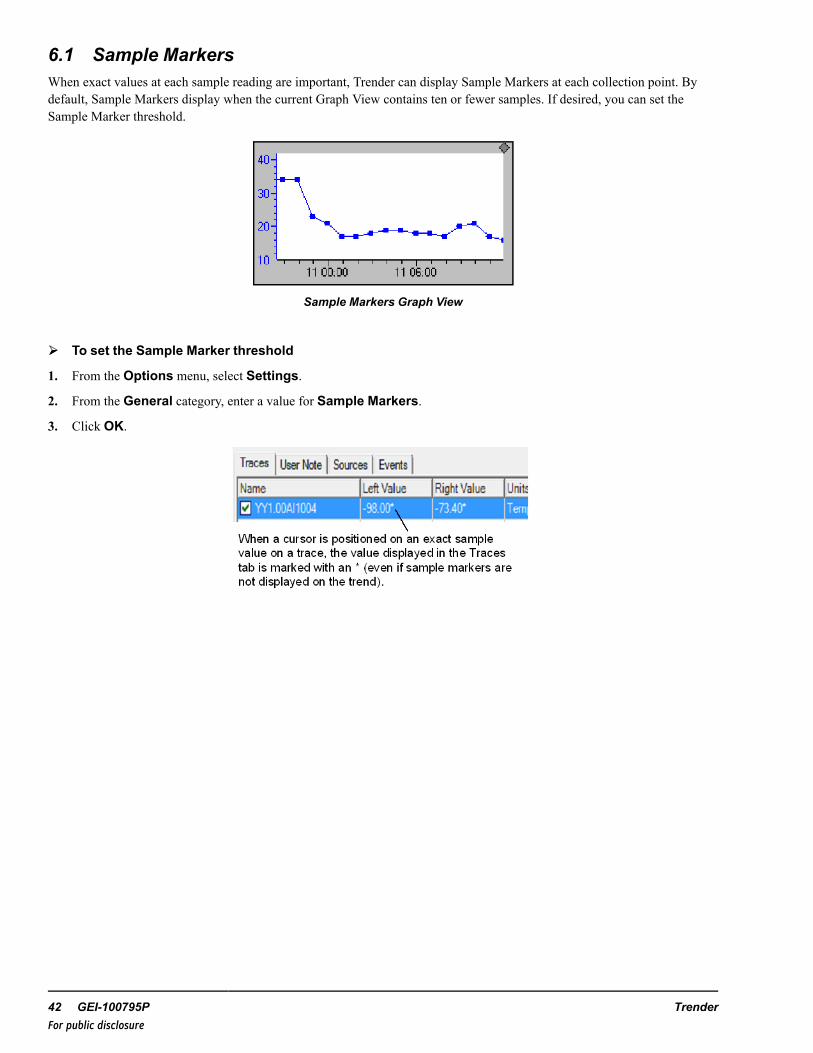
6.1 Sample MarkersWhen exact values at each sample reading are important, Trender can display Sample Markers at each collection point. Bydefault, Sample Markers display when the current Graph View contains ten or fewer samples. If desired, you can set theSample Marker threshold.
Sample Markers Graph View
➢➢ To set the Sample Marker threshold
1. From the Options menu, select Settings.
2. From the General category, enter a value for Sample Markers.
3. Click OK.
42 GEI-100795P TrenderFor public disclosure
6.2 Time AxisThe time axis controls the range of samples that display in the Graph View. All traces share a single time axis, even whenStacked Trace mode is enabled. Time axis adjustments are made from the Trender toolbar.
➢➢ To change the range displayed on the Time Axis: click Reverse or Forward.
➢➢ To display a shorter or longer period of time: click Zoom In (to reduce the duration) or Zoom Out.
Note You can also click the time axis and, from the Property Editor, edit the Duration property.
The Zoom In and Zoom Out commands perform differently depending on the mode. In Live mode, Zoom In sets the durationto one third of the current value, and Zoom Out sets the duration to three times the current value. In replay mode, Zoom Outstill sets the duration to three times the current value, but Zoom In sets the duration to the exact region selected by the twocursors. For more information on selecting a range, refer to the section Cursor Values.
Tip � To quickly change the axis range, click any point on the axis and drag it to a new location. This works for both thevalue and time axes, and is frequently the most effective way to change the displayed set of data.
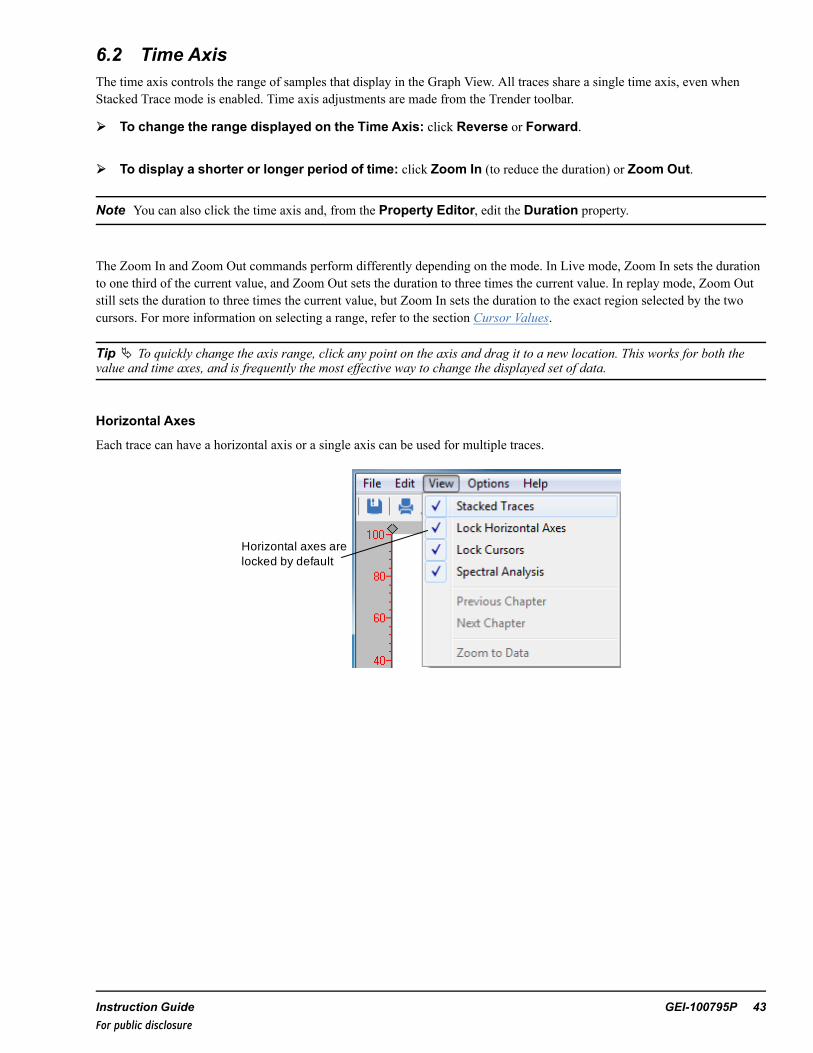
Horizontal Axes
Each trace can have a horizontal axis or a single axis can be used for multiple traces.
Horizontal axes are locked by default
Instruction Guide GEI-100795P 43For public disclosure
Example of locked horizontal axis (one axis for three traces)
Example of unlocked horizontal axis (one axis for each trace)
Unlocked axes are individually scrollable
44 GEI-100795P TrenderFor public disclosure
7 Trace SettingsTrender maintains separate settings for each trace. These settings, which include trace color, precision, and pen width, areaccessed through the Property Editor when a trace is selected on the Trace tab. Additionally, range properties allow anappropriate scale to be set for the value (vertical) axis for each trace.
7.1 Auto-range TraceTo display a set of collected samples in the Graph View, an appropriate value axis range must be selected. For most data sets,an optimal range displays all collected samples in the selected time range with minimal wasted space. The Auto-range featuresets the range of the value axis for the currently selected trace(s) to the optimal values. Even if you decide to further refine therange of the trace, the Auto-range feature provides a convenient starting point.
➢➢ To auto-range a trace: from the Traces tab, select one or more traces and from the Property Editor, clickAuto-Range Selected Traces.
7.2 Manual Range AdjustmentWhen Auto-Range Selected Traces selects an inappropriate range, or if you want precise control over the range, you canprovide a minimum and maximum value for the value (vertical) axis.
➢➢ To manually adjust the range for a trace: from the Traces tab, select one or more traces and, from the PropertyEditor, set the Bottom Value and Top Value.
7.3 ColorsThe Trender assigns each new trace a color from a set of eight stored in the Settings dialog box. After eight traces are created,these colors are reused.
➢➢ To change an assigned color
1. From the Traces tab, select a trace.
2. From the Property Editor, select the Color property.
3. From the drop-down list, select a color and click OK.
➢➢ To modify default trace colors
1. From the Options menu, select Settings.
2. From the Property Editor, select the trace to be changed.
3. From the drop-down list, select the desired trace color and click OK.
Instruction Guide GEI-100795P 45For public disclosure
7.4 Hide or Show TracesTrender can contain more traces than can be monitored at once such as with capture buffers. Traces that are hidden still collectdata, but they do not display in the Graph View or the Trace tab.
➢➢ To hide or show traces
1. From the Traces tab, select one or more traces.
2. From the Edit menu, select Hide Selected Traces or Show Traces.
7.5 Statistical CalculationsIn Replay mode, Trender can calculate a set of basic one-variable statistics for the collected data. These statistics, which arecalculated only on the data in the time range selected by the two cursors, include Difference, Average, Maximum, Minimum,and Standard Deviation (calculated as final – initial). The calculated values display as columns on the Traces tab.
➢➢ To display statistical calculations
1. From the Options menu, select Settings.
2. From the Tree View, select Replay Columns.
3. From the Available list, select one or more columns and click either Add or Add All to move the statistics to theSelected list.
4. Click OK.
46 GEI-100795P TrenderFor public disclosure
8 Command Line ArgumentsCommand line arguments are used for variable configuration and functionality. For example, a command line argument usedto change the trend time duration is Trender.exe /Duration:00:02:01 c:\site\MyTrend.trend.
The following table describes the possible command line arguments used in Trender.
Command Line Argument Description
File Path
Used to provide a path to a .Trend file or .tcw file.A .Trend file is a previously saved trend configuration file created by the Trender (forexample, C:\site\Startup.Trend).A .tcw file is a ToolboxST project configuration file.
For Live type trends, a comma-separated argument list can be provided. Thevariable name and data type are required; the remaining arguments are optional.Multiple variables can be added by repeating the argument for each variable. Thedata source is expected to be the Local WorkstationSTsource.
For Live type trends, a comma-separated argument list can be provided. The sourcename must be a valid source in the trend configuration, so the File Path argumentshould be specified as either a .Trend file or a .tcw file.Valid source names are:• A device name from a .tcw file or a saved trend of a component in a .tcw file.• Local WorkstationST
The variable name and data type are required; the remaining arguments areoptional.
/DeleteVariable:SourceName, VarName
The source name must be a valid source in the trend configuration, so the File Pathargument should be specified as either a .Trend file or a .tcw file.Valid source names are:• A device name from a .tcw file or a saved trend of a component in a .tcw file.• Local WorkstationST
The variable name is a required argument.
/Record When specified, data recording will begin after Trender initialization.
/Pause When specified, automatic live scrolling is paused.
/Export:FilePathExports all data from the Trender to a .csv file. The File Path argument should bespecified as a .Trend file.
/DisableBackFill When specified, the Trender will not attempt to backfill from historical data sources.
/Duration:hh:mm:ssChanges the duration of the trend from 1 minute (default) to the specified duration inhh (hours), mm (minutes), and ss (seconds). For example /Duration:00:10:00 wouldyield a time axis of 10 minutes.
Instruction Guide GEI-100795P 47For public disclosure
9 Print and Export DataTrender can print the currently displayed graph to any printer attached to the system. Printed graphs reflect the current displayof the Graph View, including displayed traces, colors, and axis boundaries. Use the File menu and select either Print Previewor Print.
All traces in a trend, including ones currently hidden, can be exported to an external file for analysis.
➢➢ To export traces
1. From the File menu, select Export Data.
2. In the Trender Export Data Options dialog box, select options described in the following figure and save to thedesired format. The default options produce a standard .csv file.
3. Click OK and save the file.
Enter the character used to separate values in the exported file (as, or, and such).
Select for the time range set by the cursors.
Select to use the value of the previous sample for missing samples.
Select for a column to contain increasing numbers.
Select to include more information, such as descriptions, units, and data types.
Select for a column containing time stamps.
Select the precision of the exported time stamps.
Select for the first line of the exported file to contain header information for each column. Enter a value
to use for a data field if no data is available.
48 GEI-100795P TrenderFor public disclosure
10 Spectral AnalysisTrender can perform a spectral analysis on a data set. The spectral analysis of this data quickly isolates the most commonvarying frequencies. A spectral analysis of a waveform changes this time domain data into frequency domain data, also calleda frequency spectrum of the data set. This is also referred to as a fast Fourier transform (FFT).
The effect of an FFT on a sample data set is displayed in the following procedure. The first is an input data set displayingactual generator speed (RPM) and PWA accelerometer Y/Z direction data (force in Gs).
➢➢ To perform a spectral analysis
From the View menu, select Spectral Analysis
In the following example, analyzing the input waveform (top) produces the frequency spectrum below it, where one distinctgrouping displays at a frequency centered on 0.
Spectral Analysis Example
Instruction Guide GEI-100795P 49For public disclosure
➢➢ To access FFT settings: from the File menu, select Properties or click the Trender Properties icon.
Settings include:
• Between Cursors, if set to True, applies an FFT on the data between the left and right cursors.• Padding Factor provides a way to interpolate between real points with copies of the same data, which enhances the
spectrum resolution.• Remove Mean, if set to True, improves the ability to scale the data for visualization.• Windowing Mode affects the equations used by the FFT as follows:
− None− Hann− Hamming− Bartlett− Welch
Note For information on these mathematical terms, refer to any textbook on numerical methods.