Ecological Restoration and Planning for Alang-Sosiya Ship-Breaking Yard, Gujarat 8 HEAVY METAL POLLUTION Heavy metals are among the best known and most widely studied pollutants in an aquatic system. However, the behaviour of heavy metals in sediments varies according to the physico-chemical nature of the aquatic system. The Gulf of Khambhat (Cambay) represents a semiestuarine condition. When the river-water/surface runoff carrying the pollutants from onshore comes in contact with saline water, a flocculation of the organic and inorganic dissolved species begins as a result of chemical as well as electrostatic interaction (Aston and Chestner 1973; Rasid 1974; Eckert and Sholkovitz 1976; Boyle et al. 1977; Sholkovitz et al. 1978 and others). A general phenomenon during mixing is a large scale removal of dissolved metal species from water. Flocculation of dissolved organic and inorganic matter during the mixing is an important removal mechanism for Fe, Mn, Al, P, Zn, Cu, Ni, Co, Pb and Mo. Accordingly, both suspended and bottom sediments in the Gulf of Cambay act as a sink for most of the pollutants introduced from the mainland. Thus analysis of the sediment and water provide knowledge regarding state of heavy metal pollution in the Gulf around Alang Shipbreaking Yard. 8.1 INTERTIDAL ZONE 8.1.1 Methods Heavy metals were estimated both from water (dissolved) and sediments of intertidal zones at five different sites viz. N-Control, N-ASSBY, M- ASSBY, S-ASSBY and S-Control. Dissolved heavy metals (Fe, Mn and Zn) were estimated using ICP Emission Spectrophotometer. However, 0.01 M HCl were used to extract heavy metals from the < 500 μm fraction of sediments and analysed for Fe, Mn, Zn, Cr, Cu, Pb, Ni and Cd, using Atomic Absorption Spectrophotometer (AAS). 8.1.2 Heavy metal distribution Higher concentration of Fe and Mn were recorded from the ASSBY areas as compared to the control sites (Table 8.1). This highlights the input of the metals into the intertidal water from the ASSBY activities. However, most of the other dissolved heavy metals were recorded below detection limit of the instrument and thus considered under the safe limits. Table 8.1 Distribution of major dissolved heavy Similarly, relatively high concentration of heavy metals was recorded from the sediments at ASSBY areas than the control sites (Table 8.2). This further substantiate the above view that ship breaking activities are polluting the intertidal zones through the inputs of heavy metals. Sites Fe (μg/l) Mn (μg/l) Zn (μg/l) N-Control 127.4 20.1 51.5 N-ASSBY 248.0 188.5 61.5 M-ASSBY 200.0 61.0 56.0 S-ASSBY 128.8 28.6 30.2 S-Control 124.8 25.7 38.0 100
Transcript
Ecological Restoration and Planning forAlang-Sosiya Ship-Breaking Yard, Gujarat
8
HEAVY METAL POLLUTION
Heavy metals are among the best known and mostwidely studied pollutants in an aquatic system.However, the behaviour of heavy metals insediments varies according to the physico-chemicalnature of the aquatic system. The Gulf ofKhambhat (Cambay) represents a semiestuarinecondition. When the river-water/surface runoffcarrying the pollutants from onshore comes incontact with saline water, a flocculation of theorganic and inorganic dissolved species begins asa result of chemical as well as electrostaticinteraction (Aston and Chestner 1973; Rasid 1974;Eckert and Sholkovitz 1976; Boyle et al. 1977;Sholkovitz et al. 1978 and others). A generalphenomenon during mixing is a large scaleremoval of dissolved metal species from water.Flocculation of dissolved organic and inorganicmatter during the mixing is an important removalmechanism for Fe, Mn, Al, P, Zn, Cu, Ni, Co, Pband Mo. Accordingly, both suspended and bottomsediments in the Gulf of Cambay act as a sink formost of the pollutants introduced from themainland. Thus analysis of the sediment and waterprovide knowledge regarding state of heavy metalpollution in the Gulf around Alang ShipbreakingYard.
8.1 INTERTIDAL ZONE
8.1.1 Methods
Heavy metals were estimated both from water(dissolved) and sediments of intertidal zones atfive different sites viz. N-Control, N-ASSBY, M-ASSBY, S-ASSBY and S-Control. Dissolvedheavy metals (Fe, Mn and Zn) were estimatedusing ICP Emission Spectrophotometer. However,0.01 M HCl were used to extract heavy metalsfrom the < 500 µm fraction of sediments andanalysed for Fe, Mn, Zn, Cr, Cu, Pb, Ni and Cd,using Atomic Absorption Spectrophotometer(AAS).
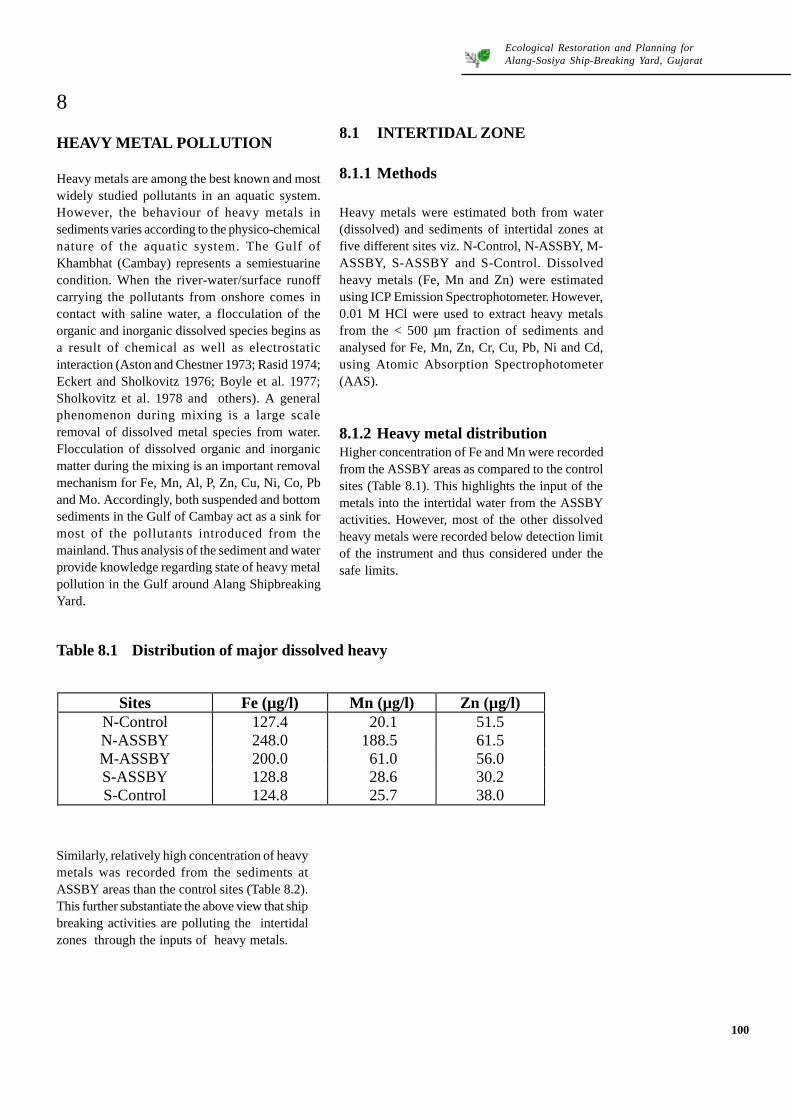
8.1.2 Heavy metal distributionHigher concentration of Fe and Mn were recordedfrom the ASSBY areas as compared to the controlsites (Table 8.1). This highlights the input of themetals into the intertidal water from the ASSBYactivities. However, most of the other dissolvedheavy metals were recorded below detection limitof the instrument and thus considered under thesafe limits.
Table 8.1 Distribution of major dissolved heavy
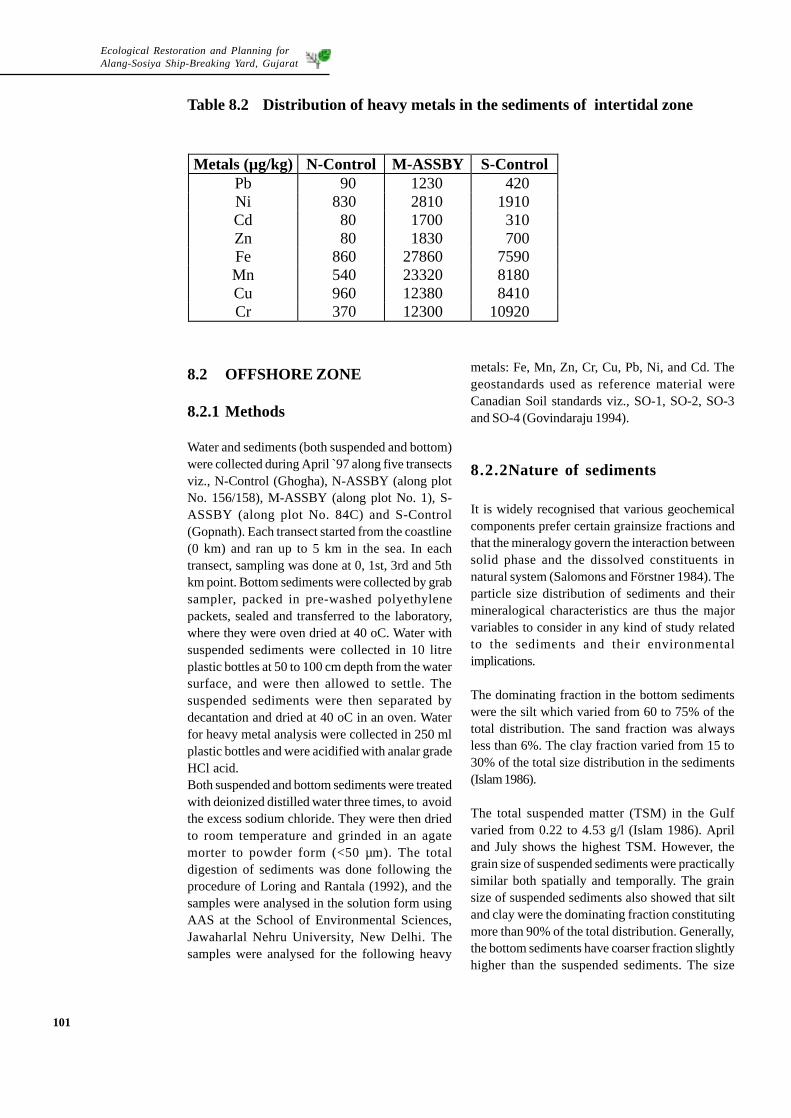
Similarly, relatively high concentration of heavymetals was recorded from the sediments atASSBY areas than the control sites (Table 8.2).This further substantiate the above view that shipbreaking activities are polluting the intertidalzones through the inputs of heavy metals.
Ecological Restoration and Planning forAlang-Sosiya Ship-Breaking Yard, Gujarat
Table 8.2 Distribution of heavy metals in the sediments of intertidal zone
8.2 OFFSHORE ZONE
8.2.1 Methods
Water and sediments (both suspended and bottom)were collected during April ̀ 97 along five transectsviz., N-Control (Ghogha), N-ASSBY (along plotNo. 156/158), M-ASSBY (along plot No. 1), S-ASSBY (along plot No. 84C) and S-Control(Gopnath). Each transect started from the coastline(0 km) and ran up to 5 km in the sea. In eachtransect, sampling was done at 0, 1st, 3rd and 5thkm point. Bottom sediments were collected by grabsampler, packed in pre-washed polyethylenepackets, sealed and transferred to the laboratory,where they were oven dried at 40 oC. Water withsuspended sediments were collected in 10 litreplastic bottles at 50 to 100 cm depth from the watersurface, and were then allowed to settle. Thesuspended sediments were then separated bydecantation and dried at 40 oC in an oven. Waterfor heavy metal analysis were collected in 250 mlplastic bottles and were acidified with analar gradeHCl acid.Both suspended and bottom sediments were treatedwith deionized distilled water three times, to avoidthe excess sodium chloride. They were then driedto room temperature and grinded in an agatemorter to powder form (<50 µm). The totaldigestion of sediments was done following theprocedure of Loring and Rantala (1992), and thesamples were analysed in the solution form usingAAS at the School of Environmental Sciences,Jawaharlal Nehru University, New Delhi. Thesamples were analysed for the following heavy
metals: Fe, Mn, Zn, Cr, Cu, Pb, Ni, and Cd. Thegeostandards used as reference material wereCanadian Soil standards viz., SO-1, SO-2, SO-3and SO-4 (Govindaraju 1994).
8.2.2Nature of sediments
It is widely recognised that various geochemicalcomponents prefer certain grainsize fractions andthat the mineralogy govern the interaction betweensolid phase and the dissolved constituents innatural system (Salomons and Förstner 1984). Theparticle size distribution of sediments and theirmineralogical characteristics are thus the majorvariables to consider in any kind of study relatedto the sediments and their environmentalimplications.
The dominating fraction in the bottom sedimentswere the silt which varied from 60 to 75% of thetotal distribution. The sand fraction was alwaysless than 6%. The clay fraction varied from 15 to30% of the total size distribution in the sediments(Islam 1986).
The total suspended matter (TSM) in the Gulfvaried from 0.22 to 4.53 g/l (Islam 1986). Apriland July shows the highest TSM. However, thegrain size of suspended sediments were practicallysimilar both spatially and temporally. The grainsize of suspended sediments also showed that siltand clay were the dominating fraction constitutingmore than 90% of the total distribution. Generally,the bottom sediments have coarser fraction slightlyhigher than the suspended sediments. The size
Metals (µg/kg) N-Control M-ASSBY S-Control Pb 90 1230 420 Ni 830 2810 1910 Cd 80 1700 310 Zn 80 1830 700 Fe 860 27860 7590 Mn 540 23320 8180 Cu 960 12380 8410 Cr 370 12300 10920
101
Ecological Restoration and Planning forAlang-Sosiya Ship-Breaking Yard, Gujarat
distribution of sediments (Islam 1986) also showsthat nearly half of the distribution spectrum ofbottom sediments overlaps the distributionspectrum of suspended sediments, which suggeststhat the bottom sediments are also capable ofdemobilisation. The fine grained sediments have alarge surface to mass ratio, and thus provide widespace for metal adsorption. This fine sand, silt andclay size class, as suggested by Mantei and Foster(1991), is fine enough to accumulate higherquantity of metal as well as large enough to resisttransport and have longer residence time in theaquatic system.
The enrichment of heavy minerals and the natureof clay minerals are two significant criteria whichdetermines the abundance of heavy metals in asediment mass. The Gulf of Cambay sedimentsshow that the dominant clay mineral in bothsuspended and bottom sediments ismontmorrilonite. Montmorillonite in suspendedsediments ranges from 76 to 83% of the total clayminerals, while illite constitutes 9 to 18%, chlorite4 to 5% and kaolinite constitutes 3 to 5% (Islam1986). There is an overall homogeneity in thedistribution of clay minerals all over the coast. Thecation exchange capacity (CEC) of different clayminerals are as follows:
High CEC of montmorillonite is due to its highspecific surface area which ranges from 700 to 800X 103 m2/kg, compared with much lower valuesfor kaolinite 15 to 40 X 103 m2/kg. This suggeststhat montmorillonite has the highest scavengingcapacity by ion exchange. The mineral assemblagein the Gulf of Cambay shows that the sedimentspossess significant scavenging potential of heavymetals from sea water.
8.3 HEAVY METALCONCENTRATION INSEDIMENTS
Heavy metal concentration in both bottom andsuspended sediments are presented in Table 8.3to 8.8. The concentration of heavy metals in globalstandard shale is presented in Table 8.9.
Montmorillonite 80 to 150 meq/100 gm Illite 10 to 40 meq/100 gm Kaolinite 3 to 15 meq/100 gm
102
Ecological Restoration and Planning forAlang-Sosiya Ship-Breaking Yard, Gujarat
Table 8.3 Distribution of Fe (µg/g) in the sediments.
Table 8.4 Distribution of Mn (µg/g) in the sediments
Table 8.5 Distribution of Zn (µg/g) in sediments.
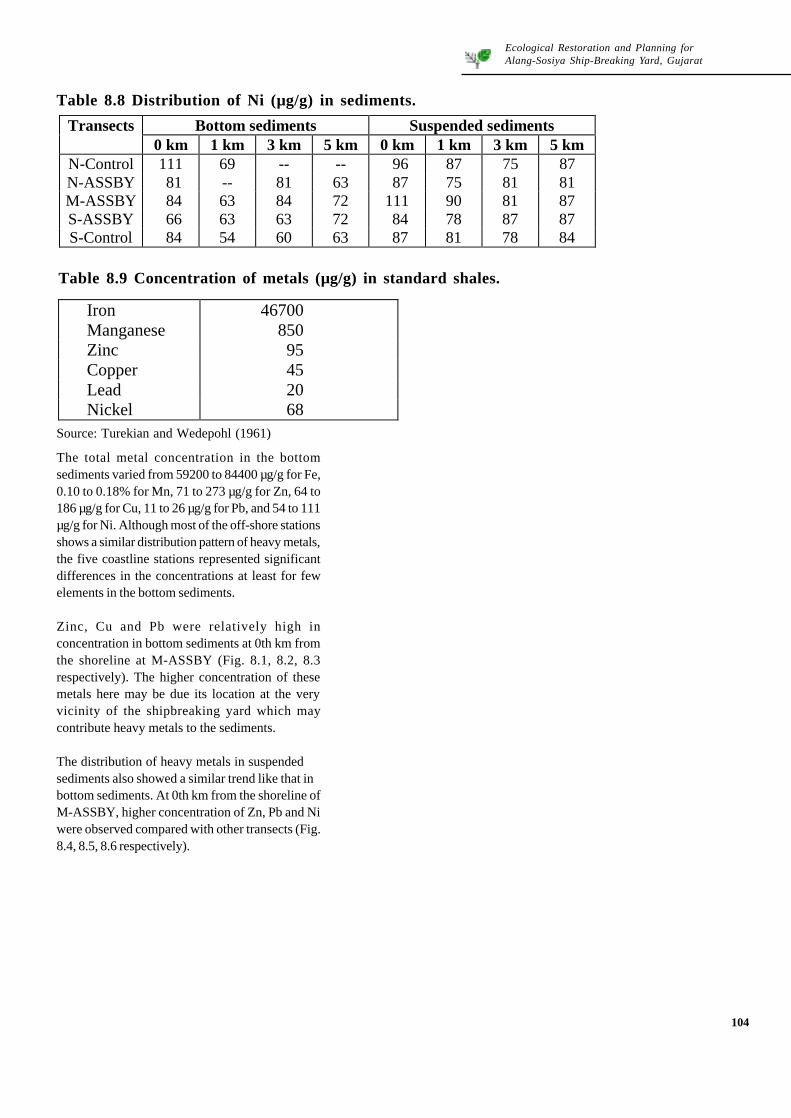
Transects Bottom sediments Suspended sediments 0 km 1 km 3 km 5 km 0 km 1 km 3 km 5 km
Iron 46700 Manganese 850 Zinc 95 Copper 45 Lead 20 Nickel 68
104
The total metal concentration in the bottomsediments varied from 59200 to 84400 µg/g for Fe,0.10 to 0.18% for Mn, 71 to 273 µg/g for Zn, 64 to186 µg/g for Cu, 11 to 26 µg/g for Pb, and 54 to 111µg/g for Ni. Although most of the off-shore stationsshows a similar distribution pattern of heavy metals,the five coastline stations represented significantdifferences in the concentrations at least for fewelements in the bottom sediments.
Zinc, Cu and Pb were relatively high inconcentration in bottom sediments at 0th km fromthe shoreline at M-ASSBY (Fig. 8.1, 8.2, 8.3respectively). The higher concentration of thesemetals here may be due its location at the veryvicinity of the shipbreaking yard which maycontribute heavy metals to the sediments.
The distribution of heavy metals in suspendedsediments also showed a similar trend like that inbottom sediments. At 0th km from the shoreline ofM-ASSBY, higher concentration of Zn, Pb and Niwere observed compared with other transects (Fig.8.4, 8.5, 8.6 respectively).
Ecological Restoration and Planning forAlang-Sosiya Ship-Breaking Yard, Gujarat
8.1 Zn concentration in bottom sediments
Fig 8.2 Cu concentration in bottom sediments
Fig 8.3 Pb concentration in bottom sediments
0
10 0
20 0
30 0
40 0
N-C o ntro l N-Alan g M-A lan g S -A lan g S -C ont rol
µg
/l
0 th km 1s t km
3 rd km 5th km
0
50
100
150
200
N-C ontrol N-Alang M-Alang S-Alang S-C ontrol
µg/
l
0th km 1st km
3rd km 5th km
0
5
1 0
1 5
2 0
2 5
3 0
N-Co ntro l N-A lan g M-A lan g S -Alan g S -C o ntro l
µg
/l
0t h km 1s t km
3rd km 5th km
105
Ecological Restoration and Planning forAlang-Sosiya Ship-Breaking Yard, Gujarat
Fig 8.6 Pb concentration in suspended sediments
0
1 00
2 00
3 00
4 00
N-C on trol N-Ala ng M-A lan g S -Alan g S -C on trol
µg
/l
0th km 1 st km
3rd km 5 th km
Fig 8.4 Zn concentration in suspended sediments
Fig 8.5 Cu concentration in suspended sediments
0
5 0
10 0
15 0
20 0
N-Co ntro l N-Ala ng M-Alan g S -Ala ng S -C o ntro l
µg
/l
0t h km 1 st km
3rd km 5 th km
0
5
1 0
1 5
2 0
2 5
3 0
3 5
N -C ont ro l N -A lan g M -A lang S -A la ng S -C o nt ro l
µg
/l
0 th k m 1 s t km
3rd km 5 th km
106
Ecological Restoration and Planning forAlang-Sosiya Ship-Breaking Yard, Gujarat
It is to be noted here that at 0th km from the shorelineat M-ASSBY was the longest running shipbreakingplot, and is situated longitudinally at the middle ofthe shipbreaking yard. Thus input from theshipbreaking yard would be significant in this plot.The off-shore stations and other stations along thecoastline shows relatively uniform concentrationof heavy metals due to their well mixing by off-shore currents.
Generally the suspended sediments show higherconcentration of heavy metals compared to that ofthe bottom sediments due to granulometric effectof the sediments.
8.3.1Interelemental relationship
The correlation coefficient matrix for heavy metalsin both bottom and suspended sediments arepresented in Table 8.10 and 8.11.
Table 8.10 Correlation coefficient matrix for bottom sediments
Table 8.11 Correlation coefficient matrix for suspended sediments
Cu Fe Mn Ni Pb Zn Cu 1.00 Fe 0.57 1.00 Mn -0.03 0.45 1.00 Ni 0.45 0.38 -0.28 1.00 Pb 0.49 0.40 -0.13 0.13 1.00 Zn 0.91 0.56 -0.09 0.33 0.55 1.00
Cu Fe Mn Ni Pb Zn Cu 1.00 Fe 0.32 1.00 Mn 0.15 -0.37 1.00 Ni 0.73 0.27 -0.14 1.00 Pb 0.64 -0.01 0.29 0.39 1.00 Zn 0.75 0.21 0.25 0.41 0.50 1.00
107
Ecological Restoration and Planning forAlang-Sosiya Ship-Breaking Yard, Gujarat
Copper shows good positive correlation coefficientwith Fe in bottom sediments (n = 17) suggesting acommon source mineral (viz., Chalcopyrite) forthese elements. Good positive correlation also canbe observed between the pairs Cu-Zn (r = 0.91),Fe-Zn (r = 0.56), and Zn-Pb (r = 0.55) in the bottomsediments. However, in suspended sediments (n =20) good positive correlation has been observedbetween the pairs Cu-Ni (r = 0.75), Cu-Zn (r = 0.75)and Cu-Pb (r = 0.64) which suggest their co-origin.Correlation coefficient between elements, whichare known to behave similarly in sedimentaryenvironment (viz., Fe and Mn) is very poor in thesamples analysed. This suggests that, thesedimentary geochemical behaviour of theelements have been musked by anthropogenicinput in the study area. However, a detail elementalanalysis of the sediments would have revealed thesource of heavy metals in the study area.
8.3.2Quantification of heavy metals
8.3.2.1 Metal ratio
It is common practice to express the metal ratiowith respect to average shale to represent thedegree of pollution (Förstner and Wittmann 1981).Metal ratio with respect to standard shale arepresented in Table 8.12, 8.13 and 8.14, both for thebottom and suspended sediments.
The metal ratio for Fe in almost all bottom and suspended sediments lies between 1 and 2. Themetal ratio for Mn lies between 1.65 to 2.98 in bottom sediments and between 1.86 and 3.20 in suspendedsediments. The ratio for Zn is more than 1 in 70% of bottom and in 95% of suspended sediments.Copper shows the highest of all metal ratios relativeto standard shale in both bottom and suspendedsediments. Lead shows a negative enrichmentexcept at 0th km from the shoreline at M-ASSBYand N-ASSBY. Nickel in all suspended sedimentsshow ratio more than 1, while in 53% of bottomsediments Ni ratio is more than 1.
The metal ratio thus shows a higher concentrationof Cu in sediments. Most of the metals show higherconcentration at 0th km of M-ASSBY.
108
Ecological Restoration and Planning forAlang-Sosiya Ship-Breaking Yard, Gujarat
Table 8.12 Metal ratio for Fe and Mn relative to standard shale
Table 8.13 Metal ratio for Zn and Cu relative to standard shale
Transects Fe Mn 0 km 1 km 3 km 5 km 0 km 1 km 3 km 5 km
Table 8.14 Metal ratio for Pb and Ni relative to standard shale
109
Ecological Restoration and Planning forAlang-Sosiya Ship-Breaking Yard, Gujarat
8.3.2.2 Geoaccumulation Index(Igeo)
The geoaccumulation index proposed by Müller(1979) for the quantification of metal accumulationin sediments was calculated for the sediments ofAlang. The geoaccumulation index is expressedas
Igeo = log2 (Cn/1.5 X Bn)where Cn is the measured concentration, Bn is thebackground value (average shale) of elements n;and 1.5 is the background matrix correction factor.The factor 1.5 is used for variations in thebackground data due to lithogenic effects. Thegeoaccumulation index consists of seven gradesas shown in Table 8.15.
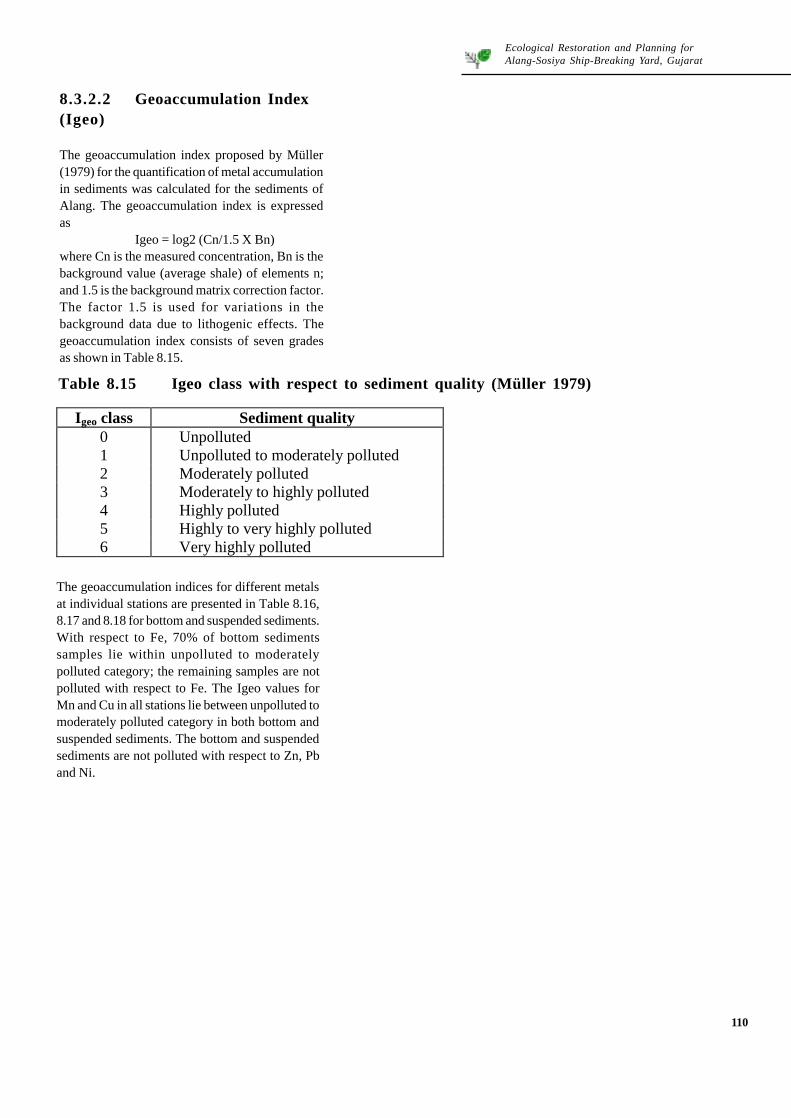
Table 8.15 Igeo class with respect to sediment quality (Müller 1979)
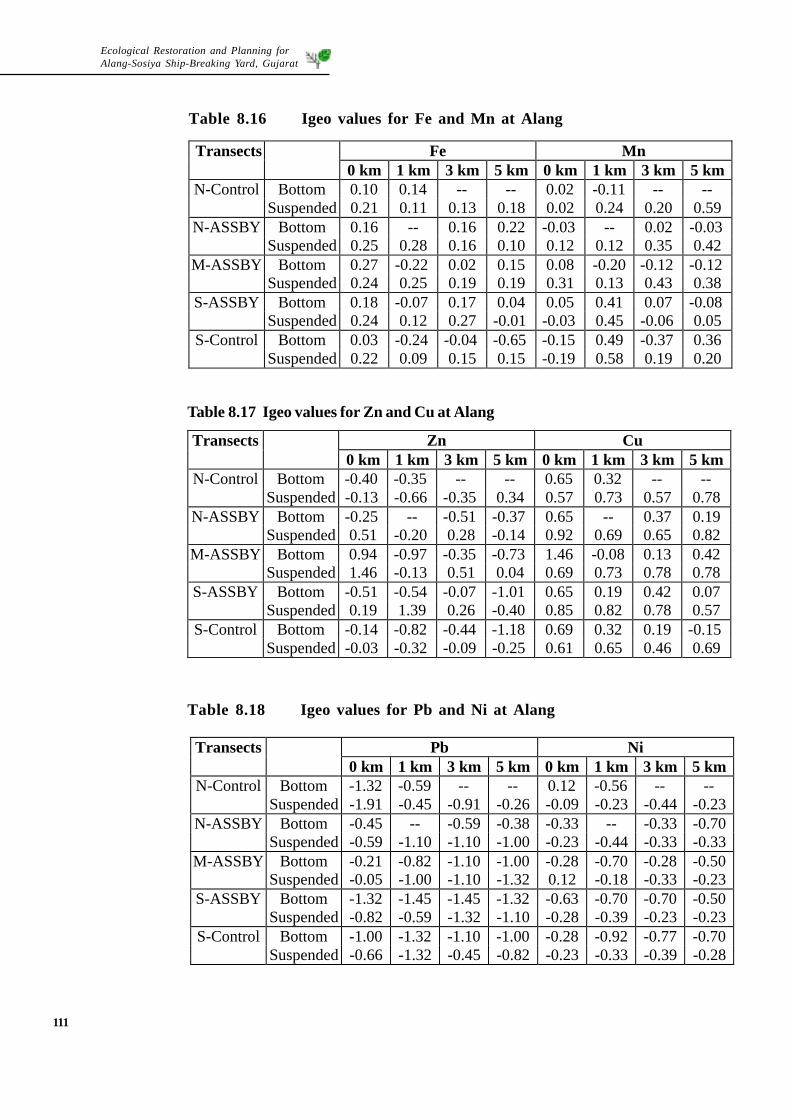
The geoaccumulation indices for different metalsat individual stations are presented in Table 8.16,8.17 and 8.18 for bottom and suspended sediments.With respect to Fe, 70% of bottom sedimentssamples lie within unpolluted to moderatelypolluted category; the remaining samples are notpolluted with respect to Fe. The Igeo values forMn and Cu in all stations lie between unpolluted tomoderately polluted category in both bottom andsuspended sediments. The bottom and suspendedsediments are not polluted with respect to Zn, Pband Ni.
I geo class Sediment quality 0 Unpolluted 1 Unpolluted to moderately polluted 2 Moderately polluted 3 Moderately to highly polluted 4 Highly polluted 5 Highly to very highly polluted 6 Very highly polluted
110
Ecological Restoration and Planning forAlang-Sosiya Ship-Breaking Yard, Gujarat
Table 8.16 Igeo values for Fe and Mn at Alang
Table 8.17 Igeo values for Zn and Cu at Alang
Table 8.18 Igeo values for Pb and Ni at Alang
Transects Fe Mn 0 km 1 km 3 km 5 km 0 km 1 km 3 km 5 km
Ecological Restoration and Planning forAlang-Sosiya Ship-Breaking Yard, Gujarat
8.4 CONCLUSION
Presently deposited unconsolidated bottom andsuspended sediments in and around AlangShipbreaking Yard were composed mainly of finesand, silt and clay, and the clay mineral assemblagewere dominated by the montmorillonite group.These sediments have the potential to trap heavymetals because of their large surface to mass ratioand high cation exchange capacity (CEC). Thestudy area represents a semiestuarine conditionwhere flocculation, adsorption-desorptionprocesses are active due to the presence of highlyionised sea water.
There was higher concentration of Cu in the studyarea. However, all other metals shows a ratio ofaround 1. At 0th km of M-ASSBY, the metals showa relative enrichment. The Igeo values shows that,the sediment quality ranged between unpollutedto moderately polluted category with respect to Fe,Mn and Cu. The sediments were not polluted withrespect to Zn, Pb and Ni concentration.
Thus it can be concluded that although thesediments in and around Alang have the potentialto trap a large quantity of heavy metals, they arestill mostly unpolluted with respect to heavymetals. The sediments may show higher pollutionif kept unmonitored for a long time.
112
Ecological Restoration and Planning forAlang-Sosiya Ship-Breaking Yard, Gujarat
9
SOCIO-ECONOMIC ASPECTS
Impact of ship-breaking activity offshore and onintertidal zones was analysed and discussed inChapter 6 and 7. While it appears that the offshoreimpact - say, at a distance of five kms -has beenminimal so far, the intertidal zone ]is experiencingsome pressure on its environmental quality. Oneof the major contributing factors in polluting theintertidal zone is the discharge of waste generateddue to very large human presence in and aroundASSBY. The situation onshore is worse as we shallpresently see.
The shipbreaking activity, as mentioned in Chapter1, was shifted out of Taiwan and Korea due to itslabour intensive character. When wages shot upin those countries with their burgeoningeconomies, the shipbreaking activity, in search ofcheap labour and with practically no regulatorymechanism, found strong foothold in threecountries of the Indian subcontinent, viz., India,Pakistan and Bangladesh. Among the threecountries, India (and, Gujarat in particular) is in aposition to take a large share of this growingbusiness due to the country's vast unsatiateddomestic market for steel. In this emergingscenario, which has been discussed at length inChapter 3, it is absolutely essential that the humanfactor is given due importance to optimise theeconomic benefits of ASSBY by obtaining lessexpensive steel for non-critical uses with negligiblecapital outlay.
As part of this study social scientists have examinedthe economic impacts of ship-breaking activity onneighbouring villages and on rerolling industry innearby industrial towns and more particularly theonshore environmental impacts due to unplannedgrowth of a large human settlement without properhousing facilities and civic amenities. In thischapter, we shall attempt to deal with the onshoreimpact of the entire ship-breaking activity onresident communities and on overall environment.
9.1 METHODOLOGY
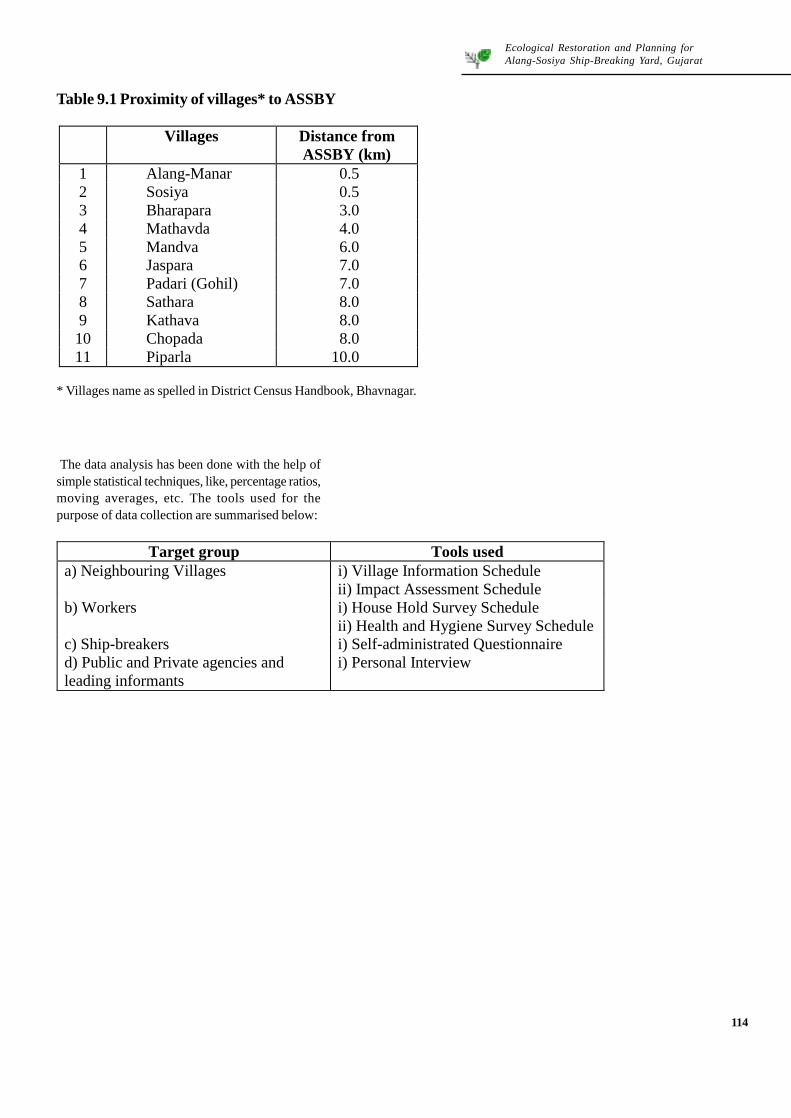
A team of social scientists made frequent visits toASSBY site to gather information from primary andsecondary sources. Data on ship-breaking activityat Alang, composition of labour force, regulatorymechanism, process of breaking, storage andtransportation, etc., was gathered from GMB andthe ship breakers' association. Data relating to livingconditions, life style, health status, etc. of workerswas collected through direct interviews andthrough a detailed questionnaire given at a widelypublicised medical camp. This was reinforced byanother systematic sample survey of socio-economic conditions of workers by a separate teamunder the leadership of an eminent social scientist.Data were collected from workers' settlement as wellas from the eleven villages in the neighbourhood.A firm of consulting architects and planners wasalso retained to help in analysing the currenthaphazard settlement and for evolving futureapproach to the problem. Discussions with theinformed people at the site and empiricalobservation helped in further validating the data.In order to know the economic impact of ASSBY onits neighbouring villages, data was collected fromthe following 11 villages (Table 9.1, Fig. 9.1) fallingwithin its 10 km radius.
113
Ecological Restoration and Planning forAlang-Sosiya Ship-Breaking Yard, Gujarat
The data analysis has been done with the help ofsimple statistical techniques, like, percentage ratios,moving averages, etc. The tools used for thepurpose of data collection are summarised below:
* Villages name as spelled in District Census Handbook, Bhavnagar.
Target group Tools used a) Neighbouring Villages i) Village Information Schedule
ii) Impact Assessment Schedule b) Workers i) House Hold Survey Schedule
ii) Health and Hygiene Survey Schedule c) Ship-breakers i) Self-administrated Questionnaire d) Public and Private agencies and leading informants
i) Personal Interview
Ecological Restoration and Planning forAlang-Sosiya Ship-Breaking Yard, Gujarat
Fig. 9.1. Neighbouring villages of ASSBY
115
Ecological Restoration and Planning forAlang-Sosiya Ship-Breaking Yard, Gujarat
9.2 NEIGHBOURING VILLAGES
Different villages were studied for theirdemographic profile, infrastructure facilities andassociation with ASSBY in terms of employmentgeneration.
9.2.1Demography
The demographic profile of the neighbouringvillages (Tables 9.2) shows that except for Alang-
Manar villages, no other village demonstrates anysignificant demographic change over a decade. Thiscould be due to relatively modest availability ofhousing and civic amenities in these villages andmost of the work force having migrated from distantareas, speaking different languages having shownpreference to live close. It should also be notedthat the entire workforce of about 30,000 people inASSBY area was not covered in the 1991 census. Itis obvious, therefore, that the census data do notreflect the true demographic scenario of the site. Inother words different linguistic and culturalbackground of the workforce and the logistic sectorshave led to minimising the direct physical impact ofASSBY on the villages.
Table 9.2 Population change in the neighbouring villages of ASSBY
Village Area No. of Households Population (ha) 1981 1991 1981 1991
Source: District Census Handbook 1991, National Informatics Centre, Rajkot.
9.2.2 Amenities and infrastructure
Along the 8-10 km long coastal strip of the ASSBYmore than 500 service sector establishments havemushroomed on the other side of the service roadsituated at the back of the shipbreaking plots, whichcater to the daily needs of ASSBY workforce. Thesocial infrastructure of ASSBY includes a bankbranch, a police station, a Red-cross dispensary, acouple of public sanitary block, an overhead tankfor water supply and the administrative blocks ofGujarat Maritime Board.
The ASSBY has been developed on the coastalland of Alang and Sosiya villages. But both thesevillages are poorly connected with the major
approach road linking ASSBY with the Bhavnagar-Veraval coastal highway. Several other villages inthe neighbourhood enjoy such road link resultingin better economic benefits from ASSBY largelybecause of relatively easy access to the yard forcommuting people. In this context, it is interestingto note that though Sosiya is less than one kmaway from ASSBY, it lost part of its work force in1991 as compared to that of 1981. It is recently thatthe Sosiya side of ASSBY is linked to the developedcomponent of shipbreaking yard through a bridgeconstructed on Manari river. Similarly, Alang villageis also very poorly connected with the majorapproach road. Though, ASSBY enjoys proximityof Alang as a village site, the whole villagesettlement is situated far away from ASSBY. It islargely because of this that Alang perhaps reflectsrelatively lower economic impact due to growth of
116
Ecological Restoration and Planning forAlang-Sosiya Ship-Breaking Yard, Gujarat
ASSBY.
It is village Manar on the major approach road thathas shown significant demographic change during1981-1991 (No such change is recorded in thecensus handbook for Manar village as it wasmerged with Alang village for the purpose of censusoperation). This suggests that daily commutingfacilities have been a critical factor in transmittingthe impact of ASSBY in favour of its neighbouringvillages.
9.2.3 Employment due to ASSBY
The worker population of almost all villages
117
Source: District Census Handbook 1991, National Informatics Centre,Rajkot.
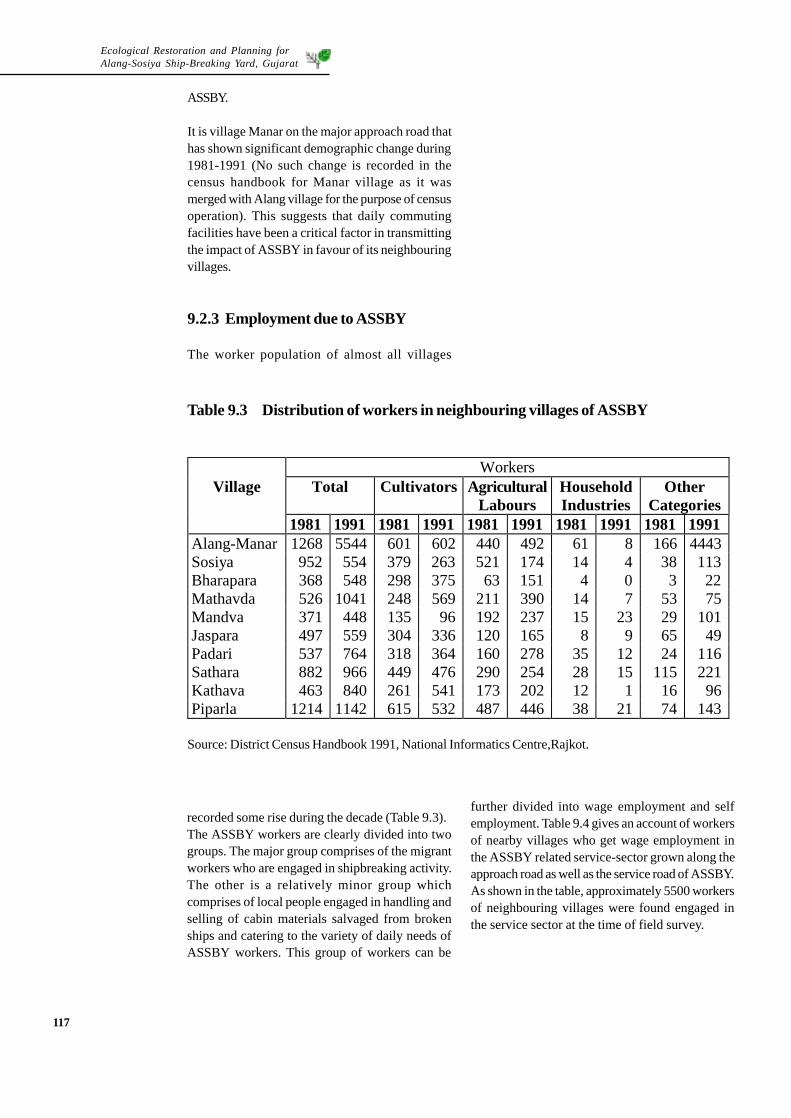
Table 9.3 Distribution of workers in neighbouring villages of ASSBY
recorded some rise during the decade (Table 9.3).The ASSBY workers are clearly divided into twogroups. The major group comprises of the migrantworkers who are engaged in shipbreaking activity.The other is a relatively minor group whichcomprises of local people engaged in handling andselling of cabin materials salvaged from brokenships and catering to the variety of daily needs ofASSBY workers. This group of workers can be
further divided into wage employment and selfemployment. Table 9.4 gives an account of workersof nearby villages who get wage employment inthe ASSBY related service-sector grown along theapproach road as well as the service road of ASSBY.As shown in the table, approximately 5500 workersof neighbouring villages were found engaged inthe service sector at the time of field survey.
Ecological Restoration and Planning forAlang-Sosiya Ship-Breaking Yard, Gujarat
118
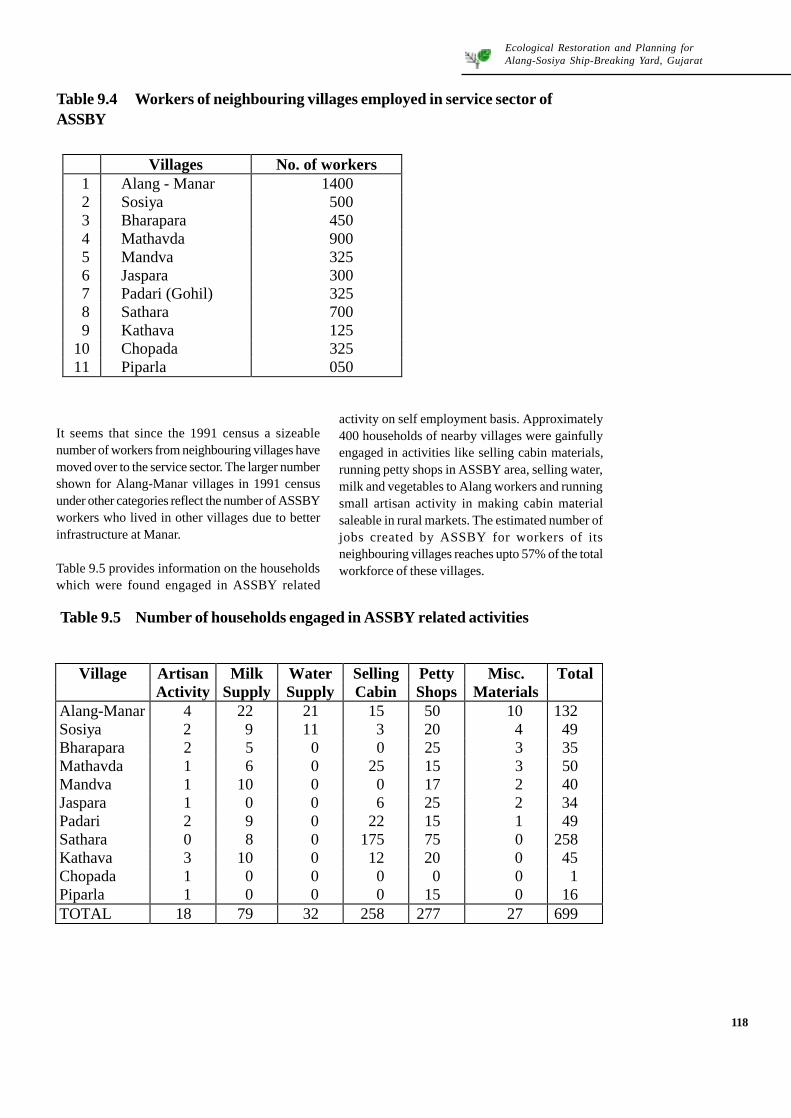
Table 9.4 Workers of neighbouring villages employed in service sector ofASSBY
It seems that since the 1991 census a sizeablenumber of workers from neighbouring villages havemoved over to the service sector. The larger numbershown for Alang-Manar villages in 1991 censusunder other categories reflect the number of ASSBYworkers who lived in other villages due to betterinfrastructure at Manar.
Table 9.5 provides information on the householdswhich were found engaged in ASSBY related
activity on self employment basis. Approximately400 households of nearby villages were gainfullyengaged in activities like selling cabin materials,running petty shops in ASSBY area, selling water,milk and vegetables to Alang workers and runningsmall artisan activity in making cabin materialsaleable in rural markets. The estimated number ofjobs created by ASSBY for workers of itsneighbouring villages reaches upto 57% of the totalworkforce of these villages.
Table 9.5 Number of households engaged in ASSBY related activities
Ecological Restoration and Planning forAlang-Sosiya Ship-Breaking Yard, Gujarat
119
Beyond the ASSBY's neighbourhood of 10 kmradius, if the entire triangle of Alang, Bhavnagarand Sihor is taken into account, the growth ofASSBY may be found to have supported flow ofinvestments in more than 150 downstream industrialunits in re-rolling sector and in manufacturing ofoxygen. Over 6000 workers are employed in thesedownstream industrial units. Besides, over 600trucks daily operate carrying ship-plates to re-rollingmills from Alang and LPG and oxygen cylinders toASSBY. Over 100 trailers and equal number of smallpassenger vehicles operate for the transportationof goods and people to and from ASSBY. All puttogether the transport sector provides employmentto around 5000 people.
9.2.4 Land use pattern
The growth of ASSBY has brought changes in thepattern of land use. It was found during the fieldsurvey that some of the agricultural land parcelswere brought under non-agricultural uses,particularly those adjacent to the road or morefavourably exposed to the site of ASSBY. Forexample, some 15 to 17 plots of agricultural land ofManar village and 125 to 130 plots of Mathavdawere developed for selling the cabin material ofbroken ships. Cultivable and gouchar lands werediverted for these plots. As a result of changinglanduse pattern, the land price in some of the nearbyvillages appreciated significantly (Table 9.6).Maximum price appreciation was noticed in the caseof agricultural land of Alang, Mathavda, Kathava,Sosiya and Mandva villages and more particularlyfor the survey numbers falling on the roadside or
Table 9.6 Change in land prices in neighbouring villages of ASSBY
Village Index of Unit price in 1996 (base year 1981:100)
Ecological Restoration and Planning forAlang-Sosiya Ship-Breaking Yard, Gujarat
120
exposed favourably to the site of ASSBY.Development of ASSBY has not brought anysignificant pressure on the existing stock of housesin nearby villages except in case of Manar. In all,197 housing units were occupied by workersengaged in shipbreaking in four villages. Of these,150 units were occupied in Manar, when the fieldsurvey was undertaken. Manar experiencedappreciation in the property price to the measure ofapproximately 300 percent in 1996 as compared tothe prices prevailing in early 1980s. In other villagesthe land price appreciated marginally.
9.3 PROFILE OF WORKERS
As part of this study, a sample survey wasundertaken, based on reporting at a medical camp,to assess the various facets of human presencesuch as living condition of workers, their agegroups, educational level, status of health, nativestate, factors of motivation, occupational health andsafety. However, this study based on response ofthose who voluntarily came to the speciallyorganised medical camp after due publicity needed
to be validated. Keeping this in view an independentsurvey led by an eminent social scientist was alsoconducted following the random samplingprocedure. The sample for the second survey waslarger. Despite the two different mode of sampling,there was a fair degree of similarity in data collectionin both surveys. Hence, the results presented beloware generated by integrating the findings of boththe studies.
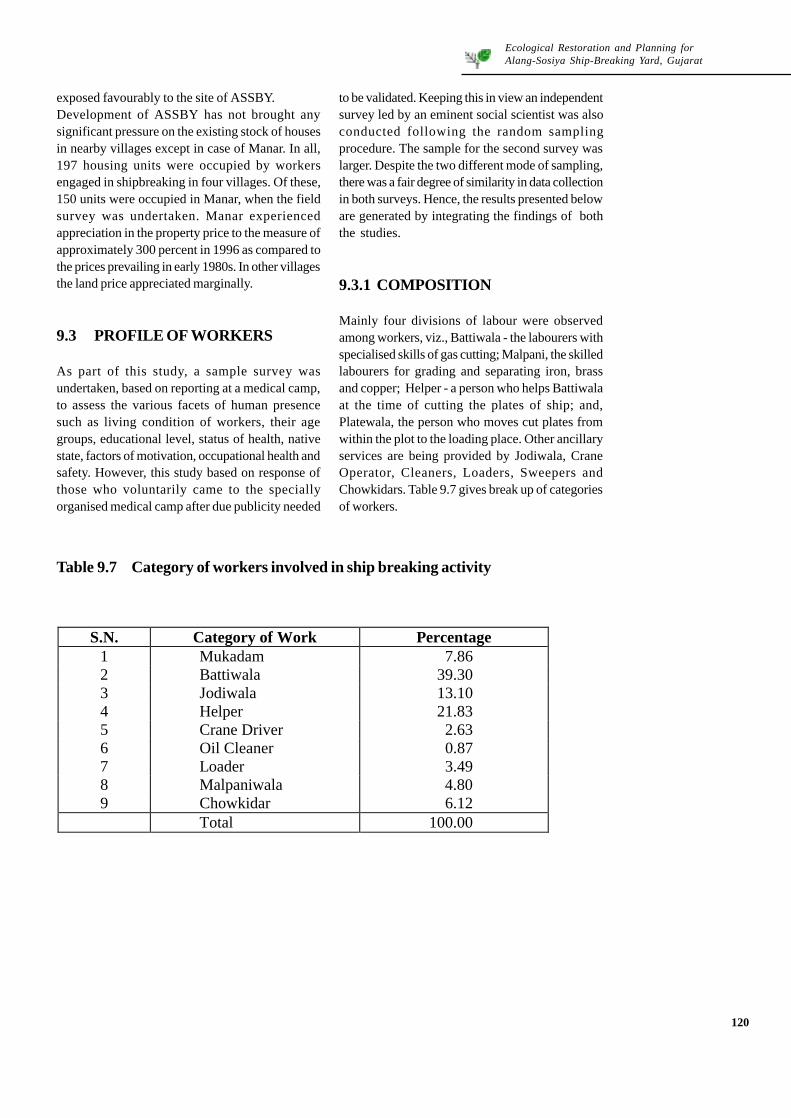
9.3.1COMPOSITION
Mainly four divisions of labour were observedamong workers, viz., Battiwala - the labourers withspecialised skills of gas cutting; Malpani, the skilledlabourers for grading and separating iron, brassand copper; Helper - a person who helps Battiwalaat the time of cutting the plates of ship; and,Platewala, the person who moves cut plates fromwithin the plot to the loading place. Other ancillaryservices are being provided by Jodiwala, CraneOperator, Cleaners, Loaders, Sweepers andChowkidars. Table 9.7 gives break up of categoriesof workers.
Table 9.7 Category of workers involved in ship breaking activity
Ecological Restoration and Planning forAlang-Sosiya Ship-Breaking Yard, Gujarat
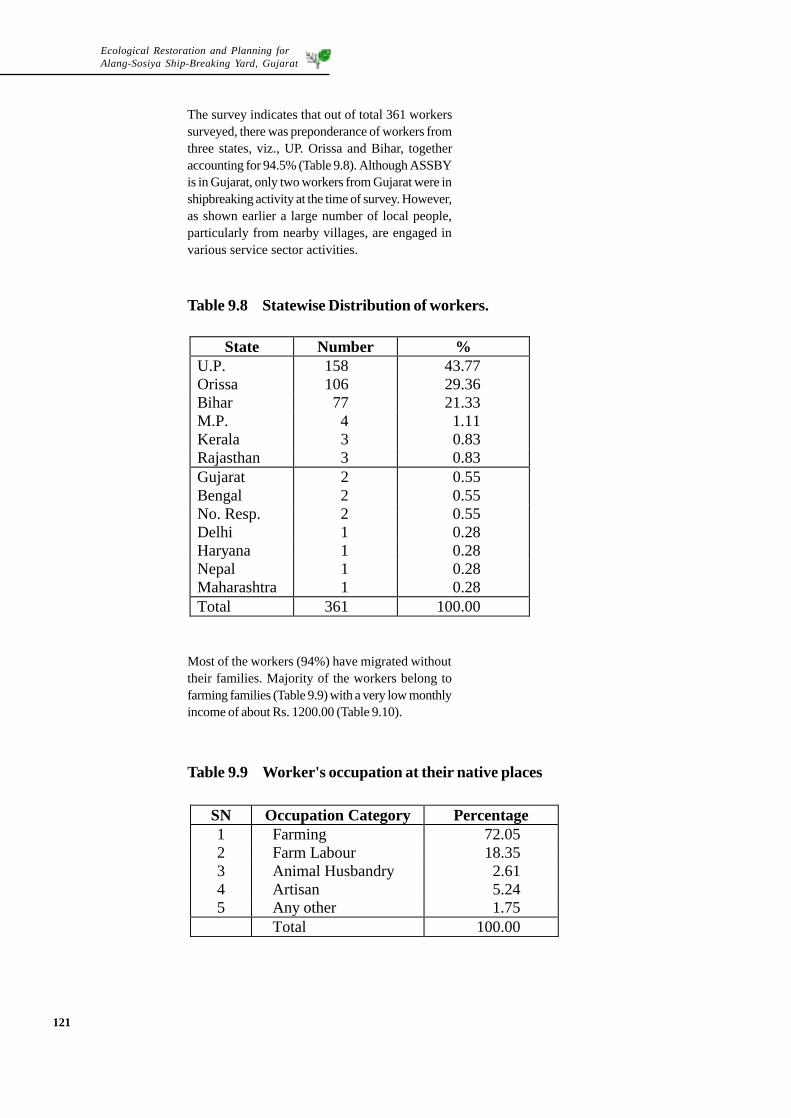
The survey indicates that out of total 361 workerssurveyed, there was preponderance of workers fromthree states, viz., UP. Orissa and Bihar, togetheraccounting for 94.5% (Table 9.8). Although ASSBYis in Gujarat, only two workers from Gujarat were inshipbreaking activity at the time of survey. However,as shown earlier a large number of local people,particularly from nearby villages, are engaged invarious service sector activities.
Most of the workers (94%) have migrated withouttheir families. Majority of the workers belong tofarming families (Table 9.9) with a very low monthlyincome of about Rs. 1200.00 (Table 9.10).
State Number % U.P. 158 43.77 Orissa 106 29.36 Bihar 77 21.33 M.P. 4 1.11 Kerala 3 0.83 Rajasthan 3 0.83 Gujarat 2 0.55 Bengal 2 0.55 No. Resp. 2 0.55 Delhi 1 0.28 Haryana 1 0.28 Nepal 1 0.28 Maharashtra 1 0.28 Total 361 100.00
Table 9.8 Statewise Distribution of workers.
Table 9.9 Worker's occupation at their native places
SN Occupation Category Percentage 1 Farming 72.05 2 Farm Labour 18.35 3 Animal Husbandry 2.61 4 Artisan 5.24 5 Any other 1.75
Total 100.00
121
Ecological Restoration and Planning forAlang-Sosiya Ship-Breaking Yard, Gujarat
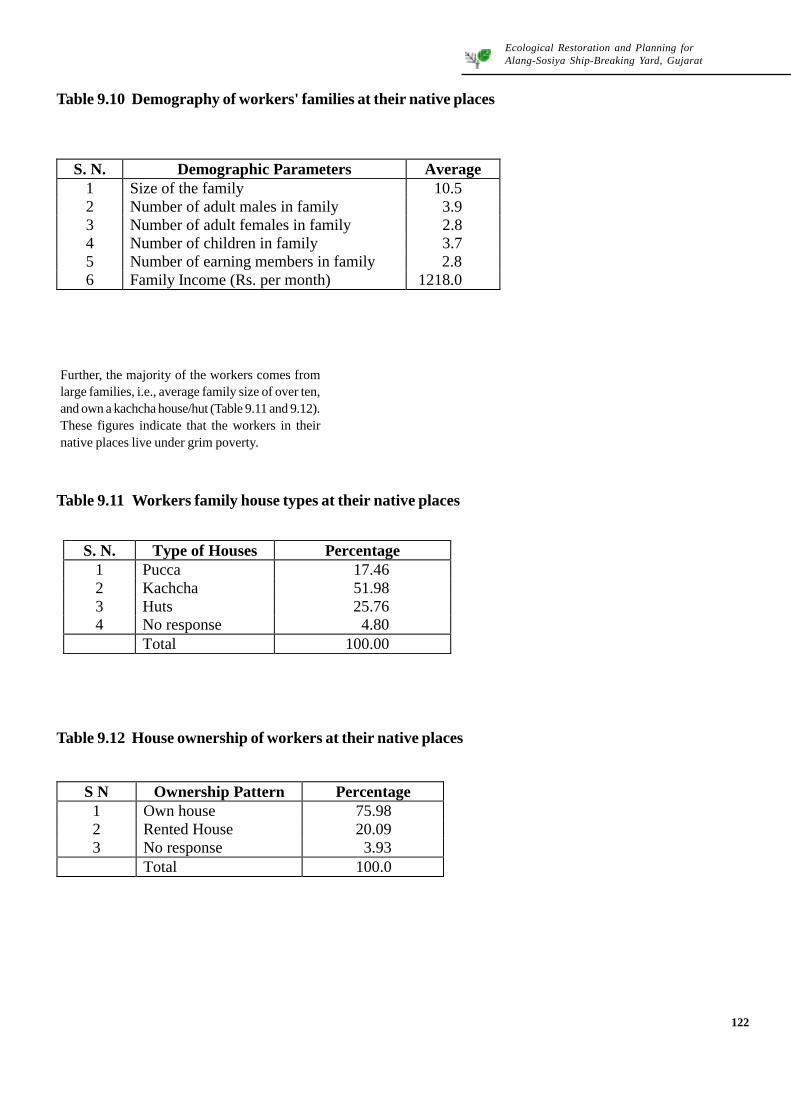
Table 9.10 Demography of workers' families at their native places
Further, the majority of the workers comes fromlarge families, i.e., average family size of over ten,and own a kachcha house/hut (Table 9.11 and 9.12).These figures indicate that the workers in theirnative places live under grim poverty.
S. N. Demographic Parameters Average 1 Size of the family 10.5 2 Number of adult males in family 3.9 3 Number of adult females in family 2.8 4 Number of children in family 3.7 5 Number of earning members in family 2.8 6 Family Income (Rs. per month) 1218.0
S. N. Type of Houses Percentage 1 Pucca 17.46 2 Kachcha 51.98 3 Huts 25.76 4 No response 4.80
Total 100.00
Table 9.11 Workers family house types at their native places
Table 9.12 House ownership of workers at their native places
S N Ownership Pattern Percentage 1 Own house 75.98 2 Rented House 20.09 3 No response 3.93
Total 100.0
122
Ecological Restoration and Planning forAlang-Sosiya Ship-Breaking Yard, Gujarat
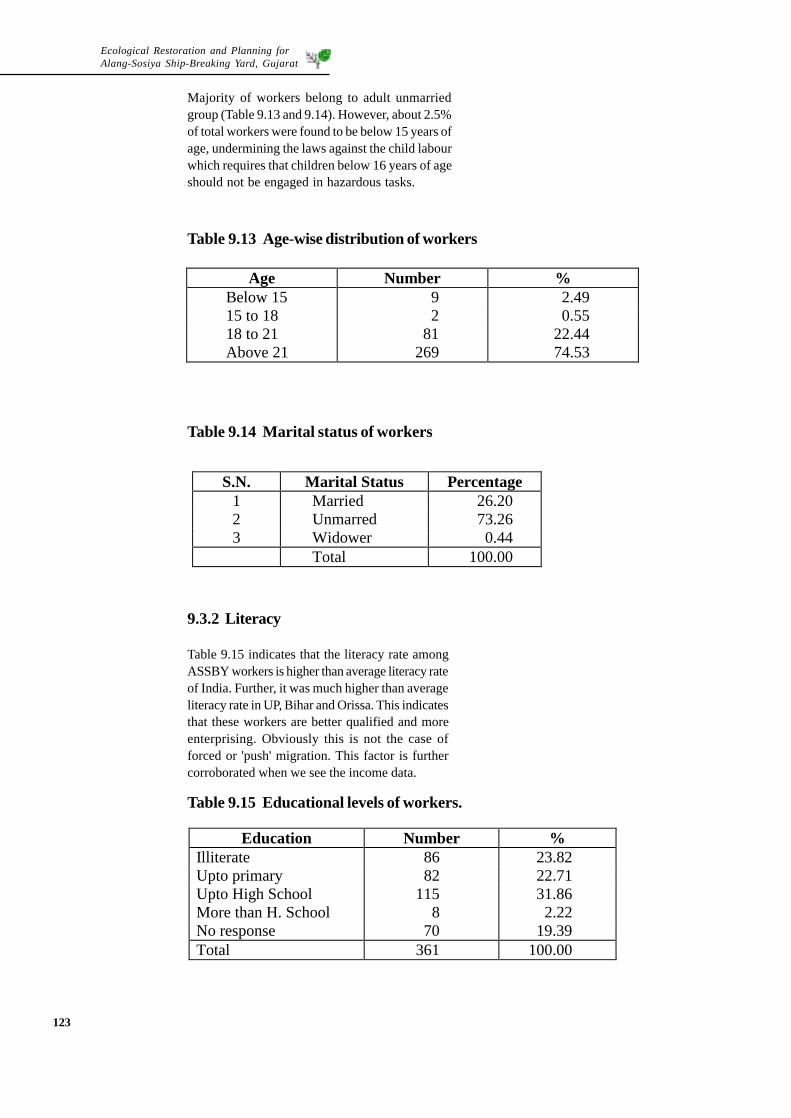
Majority of workers belong to adult unmarriedgroup (Table 9.13 and 9.14). However, about 2.5%of total workers were found to be below 15 years ofage, undermining the laws against the child labourwhich requires that children below 16 years of ageshould not be engaged in hazardous tasks.
Table 9.14 Marital status of workers
9.3.2 Literacy
Table 9.15 indicates that the literacy rate amongASSBY workers is higher than average literacy rateof India. Further, it was much higher than averageliteracy rate in UP, Bihar and Orissa. This indicatesthat these workers are better qualified and moreenterprising. Obviously this is not the case offorced or 'push' migration. This factor is furthercorroborated when we see the income data.
Age Number % Below 15 9 2.49 15 to 18 2 0.55 18 to 21 81 22.44 Above 21 269 74.53
Table 9.13Age-wise distribution of workers
S.N. Marital Status Percentage 1 Married 26.20 2 Unmarred 73.26 3 Widower 0.44 Total 100.00
Table 9.15 Educational levels of workers.
Education Number % Illiterate 86 23.82 Upto primary 82 22.71 Upto High School 115 31.86 More than H. School 8 2.22 No response 70 19.39 Total 361 100.00
123
Ecological Restoration and Planning forAlang-Sosiya Ship-Breaking Yard, Gujarat
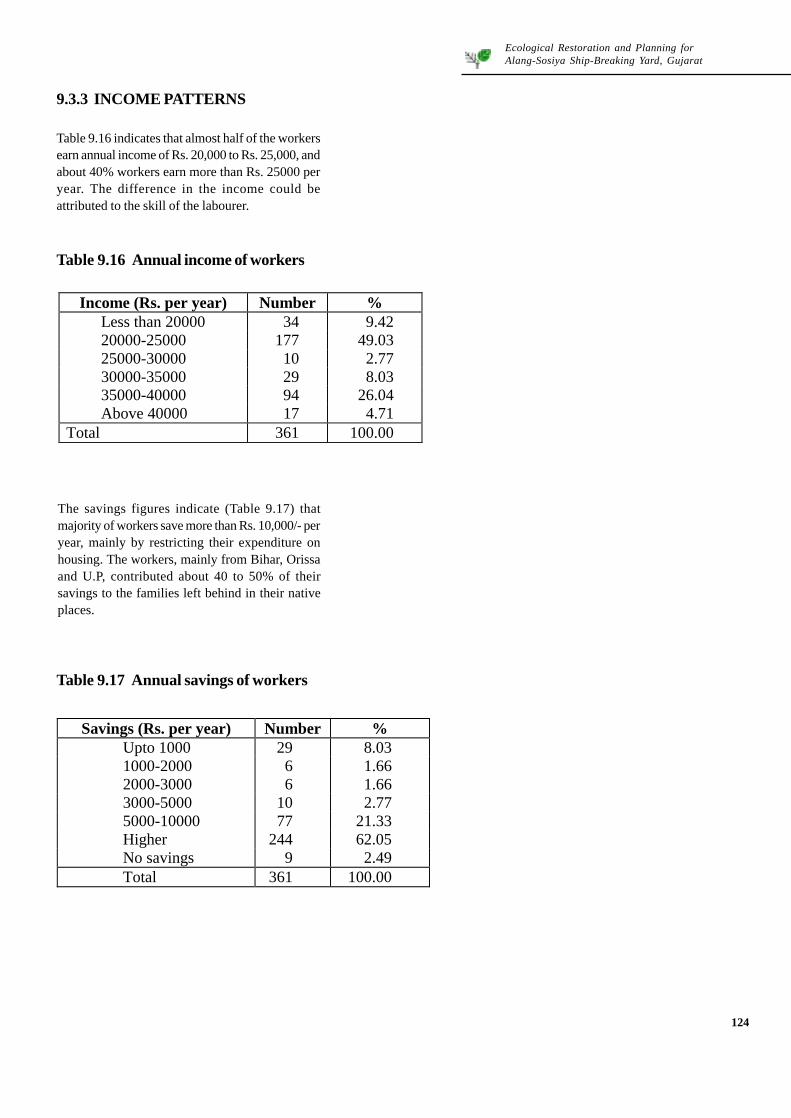
9.3.3 INCOME PATTERNS
Table 9.16 indicates that almost half of the workersearn annual income of Rs. 20,000 to Rs. 25,000, andabout 40% workers earn more than Rs. 25000 peryear. The difference in the income could beattributed to the skill of the labourer.
Table 9.17 Annual savings of workers
The savings figures indicate (Table 9.17) thatmajority of workers save more than Rs. 10,000/- peryear, mainly by restricting their expenditure onhousing. The workers, mainly from Bihar, Orissaand U.P, contributed about 40 to 50% of theirsavings to the families left behind in their nativeplaces.
Income (Rs. per year) Number % Less than 20000 34 9.42 20000-25000 177 49.03 25000-30000 10 2.77 30000-35000 29 8.03 35000-40000 94 26.04 Above 40000 17 4.71
Total 361 100.00
Table 9.16Annual income of workers
Savings (Rs. per year) Number % Upto 1000 29 8.03 1000-2000 6 1.66 2000-3000 6 1.66 3000-5000 10 2.77 5000-10000 77 21.33 Higher 244 62.05 No savings 9 2.49 Total 361 100.00
124
Ecological Restoration and Planning forAlang-Sosiya Ship-Breaking Yard, Gujarat
9.3.4 Living conditions
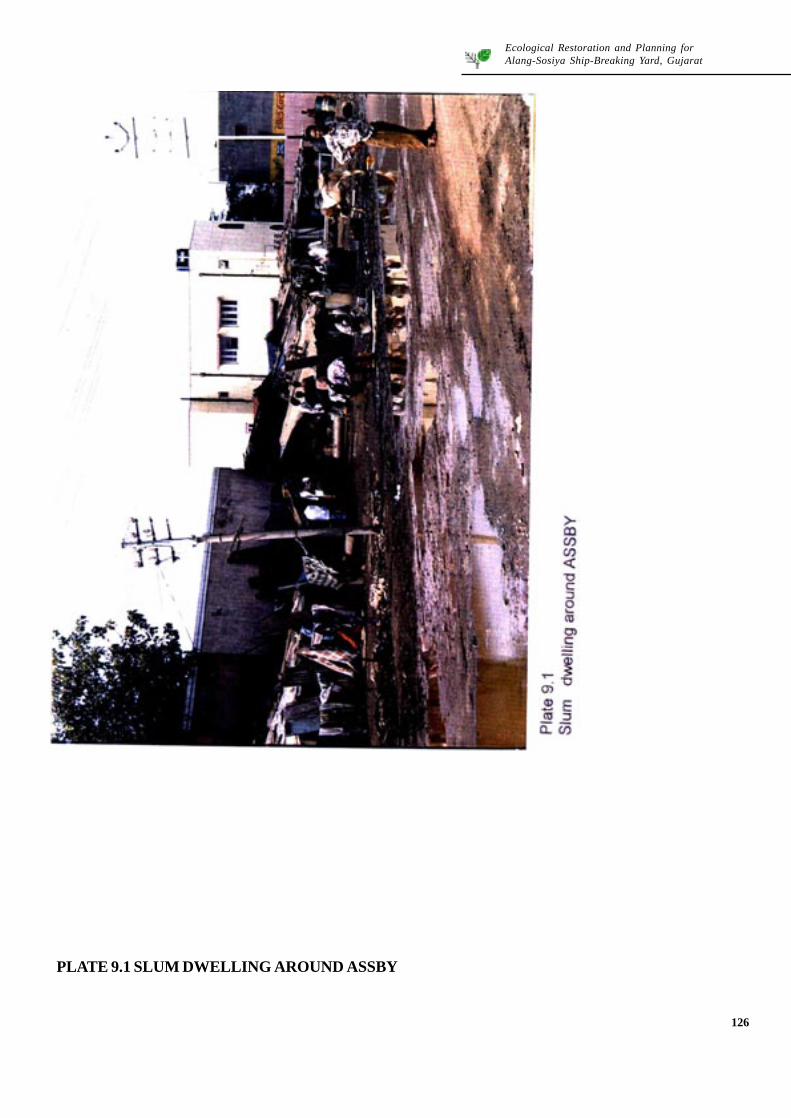
Though the workers earn more, there is a tendencyto save more by spending less, especially onhousing (Table 9.18, Plate 9.1).
A vast majority (96.2%) of workers live in smallhuts (Table 9.19), each having the size of about 100sq.ft. These huts are like slum dwellings where fiveto six persons live with an average floor space ofabout 22 sq. ft. (Table 9.20). The hut is generallyused only for sleeping purpose and often they sleepin shifts. The hut is a Kachcha structure made from
either log or ferrous scrap gathered from the wasteof the shipbreaking industry. The huts are withoutventilation or adequate air circulation. During therainy season they do not have any protectionagainst wind or rain. No hut has attached toiletfacility. In the same way not a singleaccommodation has either water or sewerage facility.
Table 9.19 Accommodation types used by workers
S. N. Expenditure (Rs. per month) % 1 Below 100 23.58 2 100-200 17.90 3 200-300 10.93 4 300-400 5.68 5 400-500 3.49 6 500 and above 3.49 7 Zero expenditure 34.93 Total 100.00
Table 9.18 Monthly expenditure of workers on housing
Type Number % Kachcha 11 3.2 Pucca 2 0.6 Hut 334 96.2 Total 347 100.00
125
Ecological Restoration and Planning forAlang-Sosiya Ship-Breaking Yard, Gujarat
PLATE 9.1 SLUM DWELLING AROUND ASSBY
126
Ecological Restoration and Planning forAlang-Sosiya Ship-Breaking Yard, Gujarat
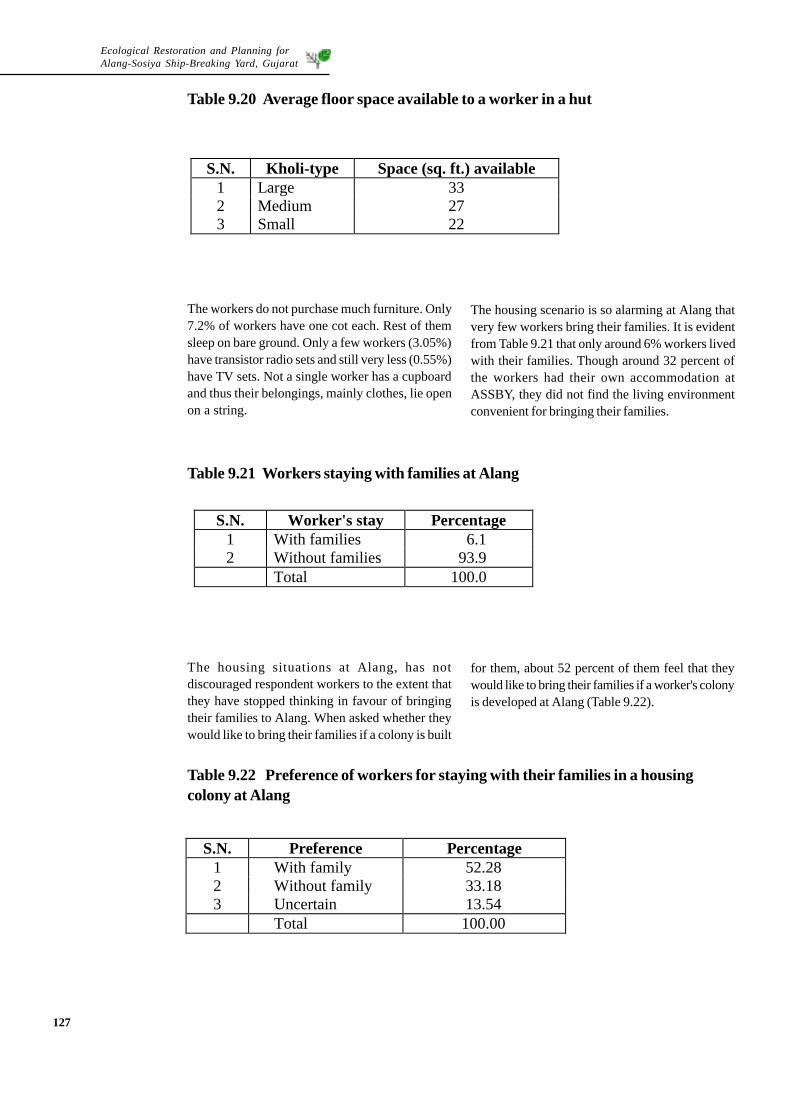
Table 9.20 Average floor space available to a worker in a hut
The workers do not purchase much furniture. Only7.2% of workers have one cot each. Rest of themsleep on bare ground. Only a few workers (3.05%)have transistor radio sets and still very less (0.55%)have TV sets. Not a single worker has a cupboardand thus their belongings, mainly clothes, lie openon a string.
The housing scenario is so alarming at Alang thatvery few workers bring their families. It is evidentfrom Table 9.21 that only around 6% workers livedwith their families. Though around 32 percent ofthe workers had their own accommodation atASSBY, they did not find the living environmentconvenient for bringing their families.
The housing situations at Alang, has notdiscouraged respondent workers to the extent thatthey have stopped thinking in favour of bringingtheir families to Alang. When asked whether theywould like to bring their families if a colony is built
for them, about 52 percent of them feel that theywould like to bring their families if a worker's colonyis developed at Alang (Table 9.22).
Table 9.22 Preference of workers for staying with their families in a housingcolony at Alang
S.N. Kholi-type Space (sq. ft.) available 1 Large 33 2 Medium 27 3 Small 22
S.N. Worker's stay Percentage 1 With families 6.1 2 Without families 93.9
Total 100.0
Table 9.21 Workers staying with families at Alang
S.N. Preference Percentage 1 With family 52.28 2 Without family 33.18 3 Uncertain 13.54
Total 100.00
127
Ecological Restoration and Planning forAlang-Sosiya Ship-Breaking Yard, Gujarat
Majority of workers have settled down at ASSBYas approximately 40 percent of them stay at Alangfor more than 6 years (Table 9.23). Only 18 percentworkers have come recently to work in ASSBY.What worries them is perhaps the job security.The information contained in Table 9.24 shows
that more than 85 percent of workers covered underthe survey do not enjoy job security. This has giventhem a status of casual workers and discouragedthem from thinking in favour of settling down inASSBY area permanently.
9.3.5 Victuals
It is rather revealing that the workers in ASSBYspend good amount on their food. Only about 1percent of workers, spend less then Rs. 300/- permonth on their food items. More than 64% of
workers spend between Rs. 600 and Rs. 900 permonth on their food (Table 9.25). Moreover, lookingto the number of vegetables, fish and fruit vendorsand the grocery stores selling food items inferencecan be drawn that workers engaged in shipbreakingdo not stint on food.
Table 9.25 Expenditure of workers on food items
S.N. Period of Stay (years) Percentage 1 Less than 1 17.87 2 1 to 5 42.29 3 6 to 10 21.99 4 More than 10 17.85
Table 9.23 Worker's length of stay at Alang
Table 9.24 Worker's job status
S.N. Job Status Percentage 1 Permanent 14.41 2 Non-permanent 85.59
Ecological Restoration and Planning forAlang-Sosiya Ship-Breaking Yard, Gujarat
to caters to the worker's need of these items. Morethan 50 percent of workers, spend more than Rs.200 per month on above items (Table 9.26).
The ASSBY workers - like most others who areengaged in physically demanding as well ashazardous work - are accustomed to spend moreon tea, beatel leaves, tobacco etc., for quickrelaxation during the long laborious and sometimesmonotonous working hours. Against eachshipbreaking plot, an average 3-4 shops are located
Safe drinking water is rare. Between two ship-breaking plots a cement tank is constructed inwhich mobile water tankers refill the water. Someplot owners have dug their own wells, from whichlabourers fetch water manually. There are no propersanitation and drainage facilities; the labourershave to go to closeby open places for toilet.Poor drinking water and drainage facilities lead torecurrence of water borne diseases around ASSBY.Water samples collected from this area recordedthe presence of various pathogens (Table 9.27).Most probable number (MPN) and Standard Plate
Count (SPC) of pathogens in different categoriesof samples was found higher than their safe limitsfor drinking water. The coliform density varies frommere presence (+) to abundant (+++). While salinecoastal and marine areas do not support theirsurvival for more than 24 hours, the estuarine waterat Alang contains a significant number of coliform.This indicates the overloading of faecal materialsin the estuarine water. Other pathogens likeSalmonella spp., Clostridium spp. andStaphylococcus spp. have also been observed inthe coastal and marine water of the study area.
S.N. Expenditure (Rs. per month) % 1 Below 100 18.8 2 100-200 31.0 3 200 and above 50.2
Table 9.27 Pathogens population in the waters of ASSBY
129
Ecological Restoration and Planning forAlang-Sosiya Ship-Breaking Yard, Gujarat
9.3.6 Health and hygiene
Health and Hygiene of those who work and stayat ASSBY need urgent attention. Shipbreaking isprone to occupational health hazards - typical ofthe nature of work of breaking the ships throughthe oxy-acetylene gas cutting method. Loss oflimbs or lives is not uncommon in this industry.Small cuts and burns are received often by workersand rarely a complaint is made for such injuries. Itis believed that such losses are computable andthe laws regarding compensation are more or lessclear. Therefore, shipbreaking at Alang is not aspecial case of occupational risks.
But this is an oversimplification of the problem.We need to look beyond the calculus of loss and
compensation. Though the problem of worker'ssafety is very much at the core, there are severaldiseases which regularly hit the workers at Alang.Our approach, in this study, was not restricted tostudy the cause and effect of occupational hazardsin shipbreaking activity but also to take into accountthe total working and living environment.
The District Leprosy Control Unit of Bhavnagarhas organised four check up camps for ASSBYworkers, between September 1995 and August 1996examining total of 20,000 workers. The highpresence of both MB (infectious) and PB (non-infectious) types of leprosy cases were identifiedamong ASSBY workers (Table 9.28). These casesreflect poor hygienic and cramped living conditionsof workers who share common accommodations.
Table 9.28 Number of leprosy cases among the workers of different states.
Source: Leprosy Control Unit, Bhavnagar District, Bhavnagar
A private qualified medical practitioner hasestablished 10 bed hospital with X-Ray facilitiesin ASSBY area. He supplied detailed informationof incidence of diseases based on 939 casesreported to his hospital during a period of twomonths. Of these, 175 cases of serious nature werereferred to Bhavnagar for further treatment. Hisestimate of deaths of workers due to accidentswhile undergoing shipbreaking activity rangesbetween 2 to 5 per week on an average. Sinceofficial record of such deaths is not available, thiscould be a case of exaggeration. During the studyteam's visits to ASSBY, cases of fatal and non-fatal injuries were mentioned in general terms. Thesame medical practitioner also found high rate ofmorbidity among the employees who worked after5.0 p.m. due to extreme exhaustion. On two
occasions when the team visited his hospital, allthe ten beds were found occupied by patientssuffering from burns, fracture, fever, etc.The team met a few non-qualified medicalpractitioners who have set up their 'clinics' alongthe ASSBY service road. These doctors hail fromU.P., Bihar and Orissa and have a close bond withtheir patients due to common language and regionalbackground. Information drawn from differentsources suggest that unqualified practitioners maybe about 100 in number at ASSBY. They seem tohave thriving practice.
The Red-cross society of Bhavnagar hasestablished a clinic with one doctor. The team wasinformed that this clinic treats 25-30 cases of out-door patients everyday. This clinic has no facilities
Ecological Restoration and Planning forAlang-Sosiya Ship-Breaking Yard, Gujarat
for indoor patients. Its expansion was, however, atplanning stage.
Further, during the survey it was recorded that manyof the workers suffered more than one ailments.Different types of ailments and their frequenciesare presented in Table 9.29. The Table shows thatall ailments identified during the camp had no directrelationship with shipbreaking activity. For example,back-pain, chest pain, hydrocil, skin ailment orrespiratory diseases manifest after a long gestationperiod. It is obviously difficult for any worker to
ask for compensation for the loss of theirfunctioning. Inhalation of burnt fumes of carbonmonoxide and carbon dioxide cause respiratoryailments after some time-lag. Falciperum-malaria,typhoid, etc. are caused because of poor hygieneand non-availability of potable water. Tables 9.30and 9.31 record the frequency of diseases andaccidents occurred to workers in the last one year.It is revealing that 78 percent of workers complainedabout the recurrence of ailments in a period of oneyear.
Frequency No. of workers Percentage Once 40 17.47 Twice 179 78.17 Thrice 10 4.36 Total 229 100.00
Ecological Restoration and Planning forAlang-Sosiya Ship-Breaking Yard, Gujarat
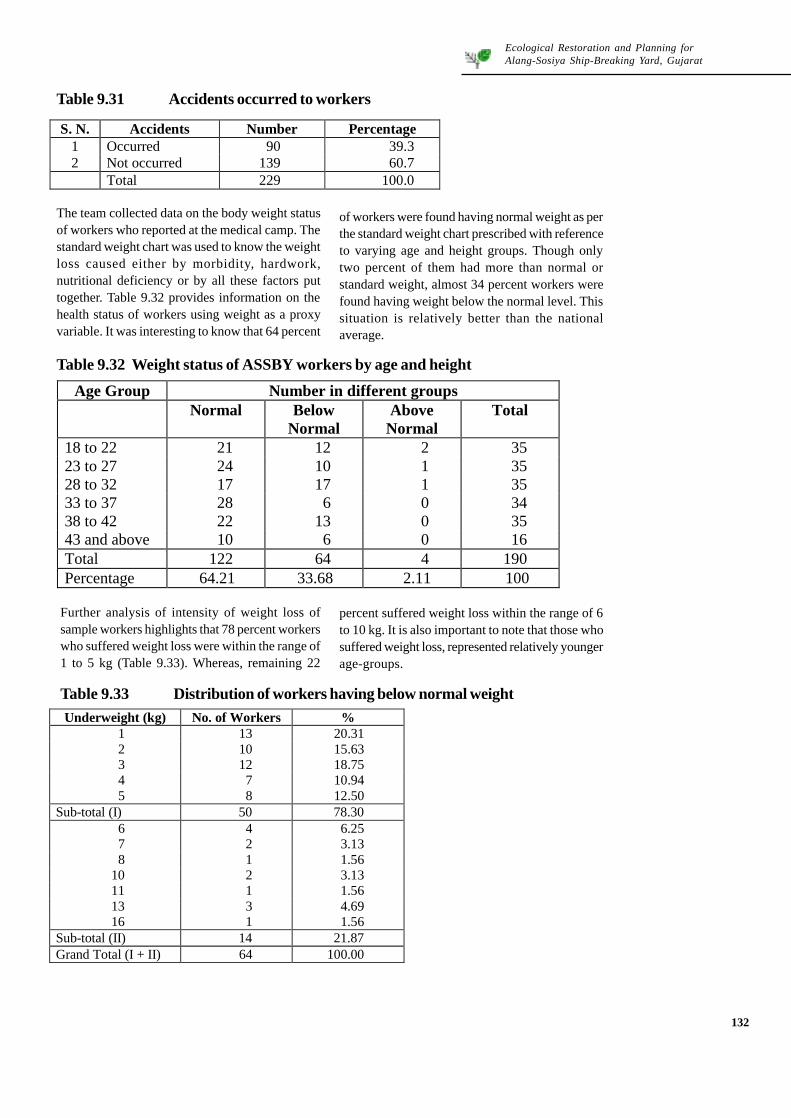
Table 9.31 Accidents occurred to workers
S. N. Accidents Number Percentage 1 Occurred 90 39.3 2 Not occurred 139 60.7
Total 229 100.0
The team collected data on the body weight statusof workers who reported at the medical camp. Thestandard weight chart was used to know the weightloss caused either by morbidity, hardwork,nutritional deficiency or by all these factors puttogether. Table 9.32 provides information on thehealth status of workers using weight as a proxyvariable. It was interesting to know that 64 percent
of workers were found having normal weight as perthe standard weight chart prescribed with referenceto varying age and height groups. Though onlytwo percent of them had more than normal orstandard weight, almost 34 percent workers werefound having weight below the normal level. Thissituation is relatively better than the nationalaverage.
Table 9.32 Weight status of ASSBY workers by age and height
Age Group Number in different groups Normal Below Above Total Normal Normal
18 to 22 21 12 2 35 23 to 27 24 10 1 35 28 to 32 17 17 1 35 33 to 37 28 6 0 34 38 to 42 22 13 0 35 43 and above 10 6 0 16 Total 122 64 4 190 Percentage 64.21 33.68 2.11 100
Further analysis of intensity of weight loss ofsample workers highlights that 78 percent workerswho suffered weight loss were within the range of1 to 5 kg (Table 9.33). Whereas, remaining 22
percent suffered weight loss within the range of 6to 10 kg. It is also important to note that those whosuffered weight loss, represented relatively youngerage-groups.
Table 9.33 Distribution of workers having below normal weightUnderweight (kg) No. of Workers %
Sub-total (II) 14 21.87 Grand Total (I + II) 64 100.00
132
Ecological Restoration and Planning forAlang-Sosiya Ship-Breaking Yard, Gujarat
9.3.7 Industrial safety
No safety standards are observed either by workersor by plot management. The survey revealed thatabout 4% workers had met with accidents and 3%workers suffered burns atleast twice. Only a minorproportion of workers (0.55%) suffered injuries morethan twice. About 5.3% of workers have reportedorthopaedic injuries. However, it was seen that theinjuries which merit special attention relate only toa few cases of burns.
Working hours are not fixed as about 38% workersworked upto 8 hours; 54% workers worked between8 and 12 hours. About 7 workers have reportedmore than 12 hours of work.
The state of industrial safety was found to be pooras only very few plot owners provide safetyequipments and articles, viz., shoes, cap, gloveseye glasses, etc. Only a little population of workers(2.8%) have reported using helmets as safetymeasures during the work. Only one worker wasreported using gloves, while, only two workers eachreported using shoes and gas masks. Only threeworkers reported having welding glasses. It isnecessary to remember here that gas cutting is theprime work here. While majority of workers haveacquired skills by experience, 8.9% workers reportedthat had some training for such skills.
The nozzles of gas cylinders are made of rubberwhere there is chance of melting due to heat andconsequent explosion. Seldom, shipowners beachthe ship without adequate inspection and start thebreaking process with oil in fuel tanker. The chancesof accident due to fire and explosion thus increase.Controlling fire in the ship beached in water is noteasy. Special skills of fire control on ships have yetto be developed at ASSBY. It is, however, notproposed to make a detailed report of industrialsafety or management practices at Alang since thatwould be outside the scope of this study.
Generally, the ship breaking industry falls underFactories Act which must be followed. Somelabourers responded that the Provident Fund (PF)is deducted by owners but no receipt is given. Theworker rarely knows his accumulation in ProvidentFund (PF). When a labourer resigns or changes hiswork place, his accumulated amount in the PF israrely paid.
It is quite clear from the two surveys that theworkforce is predominantly from three states,namely, UP, Bihar and Orissa, which are generallylower in all India averages of per capita income,agricultural productivity, employment opportunitiesand in general social and economic development.The labour force is predominantly rural, largelydepending on agriculture. A large percentage ofworkers earn about Rs. 2000/- or more per monthand have a tendency to save to assist the largerfamily in the native place. An average worker hasstrong family ties. He goes to his native place atleastonce a year despite long distance, preferably duringthe agricultural season so that he can assist thefamily physically also. He seems to shun all luxuriesand manages to live in sub-human condition. He,however, knows that his main objective to earn andsave depends on his physical fitness and therefore,does not stint on food and generally manages toremain physically fit.
The selection of site at Alang for establishment ofa shipbreaking yard apparently had no reference tothe development of area economy. This is preciselythe reason why ASSBY looks as a graft over theentire sub-region. Nevertheless, growth of ASSBYhas exerted positive impact on nearby villages, moreparticularly, in terms of employment generation. TheASSBY has brought about almost full employmentsituation in its neighbourhood.