30
GEEREF IMPACT REPORT 2017 PUBLIC VERSION CATALYSING BILLIONS FOR CLEAN POWER LUBILIA, UGANDA, FRONTIER I

GEEREF IMPACT REPORT 2017
PUBLIC VERSION
CATALYSING BILLIONS FOR CLEAN POWER
LUBILIA, UGANDA, FRONTIER I

2GEEREF IMPACT REPORT 2017
TABLE OF CONTENTS AND ABBREVIATIONS:
GEEREF PORTFOLIO SUMMARY AND FOREWORD………..………………………………………….3
GEEREF IMPACT STRATEGY….…………………………………………………………………………………...7
GEEREF PORTFOLIO METRICS……………………………………………………………………………….…12
GEEREF IMPACT THEME…………………………………………………………………………………………..22
I M P A C T O V E R V I E W F O R E W O R D I M P A C T A P P R O A C H I M P A C T M E T R I C S F U N D S P O R T F O L I O I M P A C T T H E M E A P P E N D I C E S
ABBREVIATIONS
AML Anti-money laundering
AREF Africa Renewable Energy Fund
BEE Black Economic Empowerment
CAP Corrective Action Plan
CAPEX Capital Expenditure
CO2 Carbon dioxide
CSR Corporate Social Responsibility
DFI Development finance institution
EC European Commission
EE Energy Efficiency
EELAF Emerging Energy Latin America Fund
EIA Environmental Impact Assessment
EIB European Investment Bank
EIF European Investment Fund
EMPEA Emerging Markets Private Equity Association
EPA U.S. Environment Protection Fund
EPC Engineering, procurement and construction
E&S Environmental and social
ESG Environmental, social and governance
ESIA Environmental and social impact assessment
ESMP Environmental and social management plan
ESMS Environmental and social management system
EU European Union
GEEREF Global Energy Efficiency and Renewable Energy Fund
GHG Greenhouse gas
H&S Health and Safety
IFC International Finance Corporation
IPP Independent power producer
KYC Know Your Customer
MENA Middle East and North Africa
MSEF MGM Sustainable Energy Fund
MW Megawatt
MWh Megawatt hour
ODA Official Development Assistance
PAP Project-affected People
PE Private Equity
PPA Power purchase agreement
PS Performance Standards
RAP Resettlement Action Plan
RE Renewable energy
REAF Renewable Energy Asia Fund
RFSF Regional Fund Support Facility
SCAF Seed Capital Assistance Facility
SDG Sustainable Development Goals
VGGT Voluntary Guidelines on the Responsible Governance of Tenure

Dear investors,
As of the end of 2017, GEEREF’s portfolio consisted of 13funds. The funds’ investment activities have reached 450,000households in 15 countries. Once the funds’ projects are built-up (incl. pipeline), we expect to reach at least 24 countries and12 million households annually. EUR 166m have beencommitted, which led to over EUR 3bn of investments intomore than 100 renewable energy projects, creating 2.7 GW ofnew clean energy generation capacity of which 0.8 GW isalready operational.
This report seeks to highlight the impact that your trust andcommitted capital have had so far, impact beyond financialresults. While this will not be discussed further in the followingpages, I wanted to stress how you, our public and privateinvestors, have already made a lasting mark on impact finance.Today, any discussion of impact or sustainable finance is boundto evoke “blended finance”. Blended finance is the newbuzzword to describe how investors, and especially public andprivate ones, with different risk and return appetites can worktogether on common impact goals. In 2008, GEEREF may havebeen among the first, if not the very first, such blended financeinvestment vehicle. At the time, I used to speak of a PublicPrivate Partnership; today I must say “a blended finance” fund.
Beyond the buzz, this report illustrates, again, that if our 24investors had not come, and yes blended… together, we couldnot have demonstrated that developing new renewable energypower plants and energy efficiency projects in frontier marketsis possible and financially profitable. In addition, it can be donekeeping affected communities and the environment at thecenter of each project. Merit goes to each one of our fundmanagement teams and the professionalism they demonstrateday after day, project after project, but it also goes to each oneof our investors, for your commitment and trust. I often like tosay that more than blended capital, we have smart capital toinvest.
We choose to put a special emphasis in this report on LandAcquisition and its impact on local communities. Most of ourprojects involve some degree of displacement of population. Itis always a labor intensive and lengthy process. It requires
patience, building trust with affected communities andabsolute care that they be left at least as well off andpreferably better off at the end of the process. BecauseGEEREF’s resettlement and compensation processes treatwomen and men equally, and are done in full respect of localtraditional structures, we plant the seeds for the benefit of thenext generation of boys and girls. They will have seen theirmothers empowered on the same footing as their fathers.
When we initially met, we told you that we were all aboutPeople, Planet and Profit. Nothing has changed, or rather, ourconviction that these three pillars must continue to guide us isstronger.
People. It is not only the right thing to do, but also theintelligent thing to do. Everyone should be free to movearound the world if s/he so desires; but it should not bebecause life has become unbearable and unsafe in the lands/he lives on.
Planet. Month after month, hurricane after hurricane, droughtafter drought, melting cap after melting cap, we see ourenvironment confused and jolting.
Profit. I must confess that I can imagine puzzled historians ofthe future, if we get there, pondering whether their ancestorsreally hesitated to consider how financially profitable rescue ofthe mothership would be and wondering if they had any wit orsense… Should not we all be crying like King Richard: “A horse,a horse, my kingdom for a horse?” Since profitability is theengine of greater funding and can be done without diminishingthe impact our projects have on the Planet and its People, andwe also have our fiduciary obligation at heart, Profit remainspart of the foundation of our action.
As always, we welcome questions and remarks.
CYRILLE ARNOULDHEAD OF THE GEEREF FRONT OFFICE
3
A LETTER FROM THE GEEREF TEAM: GEEREF IN 2017
The GEEREF team from left to right: David Pin, Jenia Ganzen, Dunja Dolanjski, Mélanie Martin, Cyrille Arnould, Ioannis Tsakiris, Aglaé Touchard-Le Drian, Mervin Chaumiere, Gunter Fischer, Mónica Arévalo, Quirin Sluijs, Eleni Zioga, Nicolas Panayotopoulos, Eva Chrysanthou, Eugene Howard. Not pictured: Lucie Bernatkova, Alvyda Usiskaite
GEEREF IMPACT REPORT 2017
I M P A C T O V E R V I E W F O R E W O R D I M P A C T A P P R O A C H I M P A C T M E T R I C S F U N D S P O R T F O L I O I M P A C T T H E M E A P P E N D I C E S

4
I M P A C T O V E R V I E W F O R E W O R D I M P A C T A P P R O A C H I M P A C T M E T R I C S F U N D S P O R T F O L I O I M P A C T T H E M E A P P E N D I C E S
GEEREF PORTFOLIO2017 SUMMARY & PORTFOLIO MAP
1.4GW
Total Future Capacity
336MW
Operational
24MW
Operational
77MW
Total Future Capacity
1.2GW
Total Future Capacity
428MW
Operational
84MW
Total Future Capacity
~800MWOF CLEAN ENERGY
CAPACITY INSTALLED
1,900 GWHOF CLEAN ENERGY
GENERATED
1.5 M TCO2AVOIDED
450,000HOUSEHOLDS IMPACTED
2.8 GW OF CLEAN ENERGY CAPACITY CURRENTLY UNDER DEVELOPMENT (1.2 GW), CONSTRUCTION (0.8 GW) AND
OPERATION (0.8 GW)
ADDITIONAL 1.3 GW IN PIPELINE
GEEREF IMPACT REPORT 2017
THESE 105 PROJECTS REPRESENT
EUR 3 BNIN TOTAL PROJECT COSTS
THESE FUNDS HAVE RAISED
EUR ~1BN AND INVESTED 0.6 BN SO FAR INTO 105 PROJECTS
PUBLIC AND PRIVATE INVESTORS HAVE COMMITTED
EUR 222MTO GEEREF – THE FUND OF FUNDS
GEEREF HAS COMMITTED
EUR 166MTO ITS 13 UNDERLYING FUNDS…
A multiplier of 6.3x of GEEREF’s investment
A multiplier of 5x of funds’ investments
Please note, figures may not add up due to rounding.

5
2.8 GW OF CLEAN ENERGY CAPACITY UNDER
DEVELOPMENT AND OPERATION
Sub-Saharan Africa51%
MENA1%
LAC3%
Southeast Asia31%
South Asia13% Central Asia
1%
Biomass2%
Geothermal8%
Hydro19%
SDG1%
Solar PV42% Wind
27%
COOPEGUANACASTE SOLAR PARK, COSTA RICA, MSEF I
GEEREF PORTFOLIO2017 SUMMARY: PORTFOLIO SPLIT
PER TECHNOLOGY* PER STATUS* PER GEOGRAPHY*
GEEREF IMPACT REPORT 2017
*Based on total current capacity (i.e. 2.8 GW) under development, construction and operation.
I M P A C T O V E R V I E W F O R E W O R D I M P A C T A P P R O A C H I M P A C T M E T R I C S F U N D S P O R T F O L I O I M P A C T T H E M E A P P E N D I C E S
Construction25%
Development46%
Operating29%

Investment Advisor: The EIB Group
• The European Investment Fund is the Advisor to the GEEREF Board and Investment Committee
• The European Investment Bank is the Sub-Advisor, and is responsible for identifying and recommending investment
opportunities to the Advisor as well as ongoing portfolio monitoring
• Owned by 28 EU Member States
• AAA-rating
• Largest multilateral borrower and lender by volume
• Largest provider of climate finance (USD 19.4bn in 2017)
• Active in developing countries for over 50 years
• Global leader in standards for ESG
• Over 2,900 staff based in Luxembourg
• Public-private partnership owned by the EIB Group, the EU and
29 public and private banks
• AAA-rating
• Leader in European private equity with over 14.4 billion of
outstanding PE assets under management, and to over 500
funds
• Over 500 staff based in Luxembourg
I M P A C T O V E R V I E W F O R E W O R D I M P A C T A P P R O A C H I M P A C T M E T R I C S F U N D S P O R T F O L I O I M P A C T T H E M E A P P E N D I C E S
6
GEEREF SET-UP:PUBLIC – PRIVATE PARTNERSHIP ADVISED BY THE EIBGROUP
GEEREF IMPACT REPORT 2017
GEEREF
PUBLIC INVESTORS (SUBORDINATED CAPITAL) EUR 112m
European Commission
Germany
Norway
PRIVATE INVESTORS EUR 110m
Including Australian pension funds, European and US family offices,
Canadian asset managers.Investment Committee
• 3 permanent and 3 expert
members nominated by public
shareholders, and 1
independent member
Board of Directors
• 3 Directors appointed by
public investors and 1
Independent Director
• Responsible for all aspects of
administration and
management of the Fund
EIB HEADQUARTERS, LUXEMBOURG
“GEEREF has been a pioneering initiative in the EIB Group in the field of blended finance and impact investment. The impact report illustrates well the comprehensive approach of the team to achieve its triple bottle line: Planet, People, Profit”.Adrian Kamenitzer, Director Equity, New Products and Special Transactions, EIB
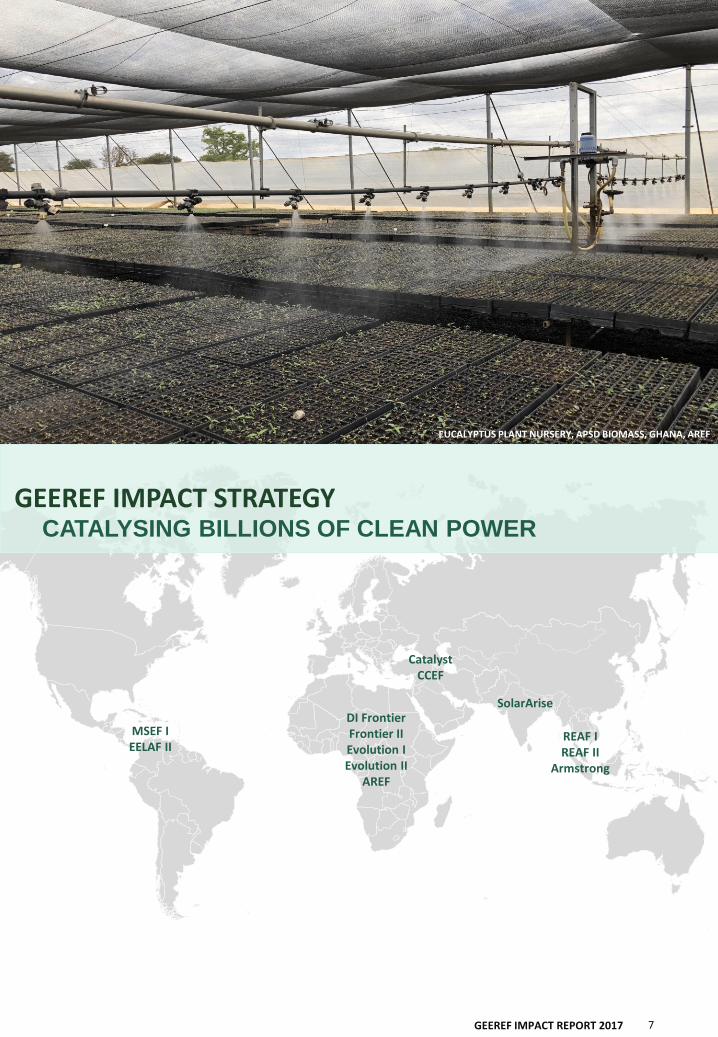
GEEREF IMPACT STRATEGYCATALYSING BILLIONS OF CLEAN POWER
C O L A N T A B I O G A S , C O L O M B I A ( M S E F )
7GEEREF IMPACT REPORT 2017
DI Frontier Frontier IIEvolution IEvolution II
AREF
MSEF IEELAF II
REAF IREAF II
Armstrong
CatalystCCEF
SolarArise
EUCALYPTUS PLANT NURSERY, APSD BIOMASS, GHANA, AREF

8
INP
UTS
GEEREF: THE FUND OF FUNDS (APPROACH)
PUBLIC INVESTORS (CONCESSIONAL CAPITAL) PRIVATE INVESTORS
EU, GERMANY AND NORWAY24 INVESTORS FROM NORTH AMERICA, EUROPE AND
AUSTRALIA
OU
TPU
TS
GEEREF’S INVESTEE FUNDS
REAFEVOLUTIONFRONTIER
EELAF IIARMSTRONG
MSEFAREF
SOLARARISECCEF
CATALYSTREAF II
EVOLUTION IIFRONTIER II
OU
TCO
MES FUNDS’ UNDERLYING PORTFOLIO PROJECTS
FUND EQUITY EQUITY CO-INVESTMENT PROJECT DEBT
IMPA
CTS
DELIVERED IN ACCORDANCE WITH EIB E&S STANDARDS AND GEEREF’S TRIPPLE BOTTOM LINE
2.8 GW CLEAN ENERGY CAPACITY
(4.15 GW including current pipeline)
9,500 GWh OF ELECTRICITY TO BE PRODUCED PER ANNUM
(14.37 GWh incl. current pipeline)
5 MILLION TONNES OF CARBON EMISSIONS TO BE
REDUCED PER ANNUM(8.24 tCO2eq incl. current
pipeline)
8.5 MILLION BENEFICIARY HOUSEHOLDS PER ANNUM
(11.8 million incl. pipeline)
CA
PIT
AL
RA
ISE
DT
OT
AL
CA
PIT
AL
DE
PL
OY
ED
CA
PIT
AL
DE
PL
OY
ED
AT
PR
OJE
CT
-LE
VE
LGEEREF: IMPACT STRATEGYMOBILISING CAPITAL FOR CLEAN ENERGY
GEEREF’s Strategy: GEEREF is a fund that invests in renewable energy and energy efficiency-focused private equityfunds and directly into projects or companies, with an aim to generate both financial and social returns for itsinvestors and stakeholders.
As of the end of 2017, GEEREF had 13 funds in its portfolio across emerging markets in Sub-Saharan Africa, South andSoutheast Asia, Latin America and the Caribbean, the Middle East and Central Asia. These have, in turn developedmore than 105 renewable energy and energy efficiency projects, out of which 36 are operational. GEEREF’s approachto financing clean energy expansion, which combines patient capital investment into infrastructure with a specialisedtechnical assistance to support fund managers and developers, is overlaid with a comprehensive impact approach thatmaximises the returns for all of its stakeholders – GEEREF’s investors as well as the local communities that host each ofGEEREF’s 105 projects.
Mobilisation of Capital: GEEREF was designed to mobilise high amount of investment, in particular from privateinvestors, into its underlying projects. GEEREF has a blended structure where public capital has been used to attractprivate sector investors. The fund of funds approach enables further leverage on the public capital at the investeefund-level as well as further down, at the project-level.
GEEREF IMPACT REPORT 2017
I M P A C T O V E R V I E W F O R E W O R D I M P A C T A P P R O A C H I M P A C T M E T R I C S F U N D S P O R T F O L I O I M P A C T T H E M E A P P E N D I C E S
ON
CE
10
5 C
UR
RE
NT
PR
OJE
CT
S A
RE
FU
LL
Y
OP
ER
AT
ION
AL

GEEREF IMPACT REPORT 2017 9
Impact Assessment: GEEREF implements a two-fold approach, which combines qualitative and quantitativeassessments, to ensure that its impact objectives and the triple bottom line approach are achieved in all of itsinvestment activities.
1. QUALITATIVE EIB STANDARDSImplement and Comply with Standards and Processes
2. QUANTITATIVE GEEREF IMPACT METRICSQuantify and Measure
GEEREF requires its portfolio funds to carry out socialand environmental due diligence in their new projects,using EIB’s ten Environmental and Social Standards, andsubsequently monitor the projects in compliance withthe standards. This is institutionalised in the contractualframework with the fund managers. GEEREF’s earlyparticipation as a cornerstone investors, supports theimplementation of EIB Standards from the onset of afund’s structuring and portfolio construction.
GEEREF measures and monitors quantifiable, realisedimpact on the ground on an annual basis to assess ESGperformance, share results with investors and the widerinvestment community.
0
2
4
6
8
10
1. ENVIRONMENTAL &SOCIAL RISKS
2. POLLUTION
3. BIODIVERSITY &ECOSYSTEMS
4. CLIMATE
5. CULTURAL HERITAGE
6. INVOLUNTARYRESETTLEMENT
7. VULNERABLE GROUPS
8. LABOUR SYSTEMS
9. HEALTH & SAFETY
10. STAKEHOLDERENGAGEMENT
Investee fund initial score against EIB Standards
GEEREF helps its funds raise standards
EIB STANDARDS* GEEREF IMPACT METRICS
GEEREF: IMPACT STRATEGYCOMBINING QUALITATIVE AND QUANTITATIVE IMPACT ASSESSMENT
PILLAR 1: CLEAN ENERGYPILLAR 2:
ENVIRONMENT/CLIMATE CHANGE
INSTALLED CAPACITY (MW)
ELECTRICITY GENERATED (MWH)
ENERGY EFFICIENCY SAVINGS (MWH)
NET EMISSIONS REDUCED (CO2eq)
PILLAR 3: SUSTAINABLE DEVELOPMENT
PILLAR 4: FINANCIAL LEVERAGE
BENEFICIARY HOUSEHOLDS (#)
BENEFICIARY SMES (#)
NUMBER OF PEOPLE EMPLOYED (#)
TRAINING (HRS.)
FUND MULTIPLIER
PROJECT MULTIPLIER
*Figure only illustrative
I M P A C T O V E R V I E W F O R E W O R D I M P A C T A P P R O A C H I M P A C T M E T R I C S F U N D S P O R T F O L I O I M P A C T T H E M E A P P E N D I C E S

GEEREF IMPACT REPORT 2017 10
1. TRANSACTION SOURCINGOn-going
2. DUE DILIGENCE3 – 6 months
3. INVESTMENT DECISION &
NEGOTIATION6 – 12 months
4. POST-INVESTMENT7 – 10 years
INITIAL FUND STRUCTURING
PROJECT IMPLEMENTATION ONGOING MONITORING
E&S STANDARDS
E&S best practice through the lifecycle of operations. E&S obligations, processes and procedures are listed and described in relevant contractual documents (Limited Partnership
Agreement, Side Letter and other)Environmental and Social Management Systems (ESMS) are built within each fund’s
management system to manage risks associated with projects and enhance positive outcomes.
TECHNICAL ASSISTANCE
FACILITY
GEEREF’s Regional Fund Support Facility (RFSF), funded by the European Commission, helps nascent fund managers address gaps with recruitment of qualified professionals and the
development of investment and monitoring capabilities.
ADVISORY BOARD
Regular formal and informal supervision to advise on best practice, conflicts of interest, deviations from stated policies, internal issues, strategy and market context.
IMPACT REPORTING
GEEREF’s annual impact reporting exercise helps funds maintain focus on Impact and E&S issues. “GEEREF Days”, an annual meeting for investors and fund managers, facilitates best
practice and learnings across the global portfolio and strive for greater results.
GEEREF’s Impact Report supports greater transparency in Impact Investment and knowledge sharing.
GEEREF: IMPACT STRATEGYVALUE ADDED THROUGHOUT THE PROJECT VALUE CHAIN
I M P A C T O V E R V I E W F O R E W O R D I M P A C T A P P R O A C H I M P A C T M E T R I C S F U N D S P O R T F O L I O I M P A C T T H E M E A P P E N D I C E S
Value added: GEEREF works closely with fund managers ateach stage of the transaction development. GEEREF providesinput on the structuring and strategy to the funds’ teams.
During the due diligence and negotiations phase, GEEREFprovides feedback on terms and conditions to ensure thefund’s marketability to private investors. In addition, EIBtechnical experts thoroughly review the fund’senvironmental and social processes, standards and staffingplan to ensure alignment with best international practices.GEEREF’s technical assistance facility (RFSF) fund managersin upgrading their practices in case of identified gaps.
Finally, following a fund’s inclusion into GEEREF’s portfolio,GEEREF provides continuous feedback to the fund managersthrough an active role in the Advisory Role and site visitswhen necessary. GEEREF chairs some of the portfolio funds’Advisory Boards. EIB’s technical experts review and enhancethe funds’ E&S practices via regular monitoring.

GEEREF’s Approach and SDGs: GEEREF has a triplebottom line approach: People - Planet - Profit.Underpinning its investment strategy, there is afundamental commitment to financial, environmentaland social sustainability principles which are mutuallyreinforcing and create maximum value to GEEREF’sshareholders.
Importantly, GEEREF is in a unique place to anchor,influence and drive strategy of funds and theirunderlying projects via the use of private equity as along-term investment instrument.
GEEREF mapped its portfolio to SDG targets. Its activitiesdirectly contribute to 4 SDGs. GEEREF contributes to theexpansion of clean energy capacity in developingcountries and climate change mitigation and as such,directly contributes to SDG 7: Affordable and CleanEnergy and SDG 13: Climate Action. Given the labour-intensity associated with construction of infrastructureassets, GEEREF also contributes to employmentopportunities and skills training in markets where itoperates (SDG 9). As a public private partnership,GEEREF also directly contributes to SDG 17 (partnershipsfor the goals).
In addition, as expansion of clean energy promotes thebroader development objectives of economic prosperity,well-being and a healthy environment, GEEREF’s
activities contribute at least to 13 SDGs*.
Measuring SDG impact: Assessing the exact contributionto SDGs that GEEREF can claim remains a challengebecause of the wide breadth of the SDGs, underlyingtargets and key performance indicators, all of which areset at national level. As a result, the figures and findingsof this report may not capture the entirety of the impactgenerated.
GEEREF has endeavored to track its direct contribution toSDGs via its existing metrics, as illustrated below.
GEEREF’S DIRECT SDG CONTRIBUTION
GEEREF’S METRICSGEEREF’S REALISED IMPACT
IN 2017
GEEREF’S CUMMULATIVE REALISED IMPACT SINCE
2014
Capacity Installed (MW)Electricity Generated and
Saved (MWh)
Emissions reduced (tones of CO2eq)
Number of People Employed: temporary,
permanent, male, female Training delivered (hours)
120 MW (new capacity) 1.8 million MWh
1.5 million tones of CO2eq
1800 permanent male jobs630 permanent female jobs4,500 temporary male jobs360 temporary female jobs
46,500 training hours
788 MW 4.9 million MWh
4.3 million tones of CO2eq
GEEREF IS A PUBLIC-PRIVATE
PARTNERSHIP
GEEREF BUILDS UP NEW CLEAN
ENERGY CAPACITY
GEEREF CONTRIBUTES TO DECREASING GHG
EMISSIONS IN ENERGY AND OTHER INDUSTRIES
GEEREF CREATES EMPLOYMENT
OPPORTUNITIES AND SKILLS TRAINING
GEEREF: IMPACT STRATEGYCONTRIBUTING TO SDGS IN DEVELOPING COUNTRIES
I M P A C T O V E R V I E W F O R E W O R D I M P A C T A P P R O A C H I M P A C T M E T R I C S F U N D S P O R T F O L I O I M P A C T T H E M E A P P E N D I C E S
*As per the latest IRENA study on SDGs.

GEEREF IMPACT METRICSCATALYSING BILLIONS OF CLEAN POWER
C O L A N T A B I O G A S , C O L O M B I A ( M S E F )
12GEEREF IMPACT REPORT 2017
DI Frontier Frontier IIEvolution IEvolution II
AREF
MSEF IEELAF II
REAF IREAF II
Armstrong
CatalystCCEF
SolarArise
HARDAP, NAMIBIA, EVOLUTION II

GEEREF IMPACT REPORT 2017 13
All data are collected annually from GEEREF’s fund managers and are analysed by the GEEREF team. The reportaccounts for data and results for the entirety of each project, rather than a pro rata share of them, with theunderlying assumption that the projects would not have been financed without GEEREF’ support. The data is reportedon an annual basis as a snapshot of the status at year-end 2017.
The analysis is done at three levels:
1. Actual reported values from the relevant financial year from each of the investments in each portfolio in thereporting period. This may include assets that have been fully operational for the whole financial year or partiallyoperational. The ‘actual’ figures present total realized figures as of the end of the year.
2. Current portfolio assumes that all projects in the existing portfolio (under development, construction and inoperation) are fully operational for a full year. The figure provides a snapshot of the expected annual impact ofthe projects that were in portfolio, in 2017, once fully operational.
3. Targeted portfolio assumes that all projects in the current portfolio and in pipeline are fully operational for a fullyear. It provides a snapshot of the expected annual impact of all the projects that GEEREF’s portfolio funds willend up supporting.
Both current portfolio and targeted portfolio metrics are modelled and use total capital commitments, project sizesand technologies, capex and capacity factors in order to derive a set of notional values for the portfolio. These figuresare very sensitive to the evolution of assumptions, including the grid factor and the average consumption perhousehold per country. These assumptions are updated on an annual basis.
It is to be highlighted that all reported data attribute the full scale of impact to GEEREF, considering GEEREF’s role asan anchor investor.
The data collection is organised in four Pillars: Energy, Environment, Sustainable Development and FinancialLeverage. While some metrics in Energy, Environment and Sustainable Development Pillars are reported as providedby the fund managers, others are calculated by the GEEREF Team using inputs from fund managers and externalresources. The latter category includes: households impacted and emissions reduced. The number of householdsimpacted is calculated by dividing total electricity generated (as reported by fund managers) by average householdconsumption in a given country (World Bank statistics). The amount of emissions reduced is calculated by multiplyingelectricity generated (as reported by fund manager) by a given country grid emission factor (as provided by the EIBstatistics). For the fourth Pillar, Financial Leverage, GEEREF reports on the amount of capital mobilised (both privateand public) at three layers: project level, fund level and GEEREF level. The project level multiplier assesses the totalproject capex (including fund equity, co-investment and debt) relative to the equity invested by the fund manager.The fund level multiplier assesses the total that a fund has raised from all of investors relative to the initial capitalcontribution made by GEEREF. The GEEREF level multiplier is the project level multiplier times the fund levelmultiplier.
A final calculation (ODA impact) shows the impact achieved by ODA funding which catalysed the private investors. Thiscalculates the ratio of public to total capital and derives a final multiplier for all capital invested through GEEREF’sportfolio projects relative to the initial ODA contributions to GEEREF.
GEEREF reports to the OECD on the amount of private finance mobilised by its investments on an annual basis. TheOECD methodology can be found here. The above described GEEREF methodology differs from the OECDmethodology in few aspects. The OECD methodology focuses on private capital mobilisation while GEEREF accountsboth for public and private capital mobilisation. In addition, the OECD only accounts for capital mobilised on the fundlevel (based on the shareholding percentage) and ignores the mobilisation effect on the project-level.
A more detailed explanation of the GEEREF Impact Methodology can be found on GEEREF’s website here.
I M P A C T O V E R V I E W F O R E W O R D I M P A C T A P P R O A C H I M P A C T M E T R I C S F U N D S P O R T F O L I O I M P A C T T H E M E A P P E N D I C E S
GEEREF PORTFOLIO METRICSBEHIND THE FIGURES

GEEREF IMPACT REPORT 2017 14
GEEREF PORTFOLIO METRICSPILLAR 1 AND 2: CLEAN ENERGY & ENVIRONMENT/CLIMATEMITIGATION
NUMBER OF PROJECTS
In 2017, delivered 120 MW of new clean energy
capacity in developing countries.
GEEREF’s operational projects generated 2,000 GWh of
clean energy and electricity savings of 67 GWh,
equivalent to 1.5 million tones of CO2 saved.
INSTALLED CAPACITY(MW)
ELECTRICITY GENERATED(MWH)
ELECTRICITY SAVED (MWH)
GHG MITIGATION (tCO2EQ)
460 525 663788
2,818
4,146
2014 2015 2016 2017 CURRENTPORTFOLIO
est.
TARGETEDPORTFOLIO
est.
-
13,430
51,998
67,178
78,985 78,985
2014 2015 2016 2017 CURRENTPORTFOLIO
est.
TARGETEDPORTFOLIO
est.
67,000 MWh of energy
savings in 2017
32
48
82
105
147
2014 2015 2016 2017 TARGETEDPORTFOLIO est.
Almost 800 MW capacity installed;
over 2,818 MW under development and
construction;
additional 1,325 MW in pipeline
364,499
1,038,810 1,385,048 1,471,564
4,978,560
8,238,598
2014 2015 2016 2017 CURRENTPORTFOLIO
est.
TARGETEDPORTFOLIO
est.
1.5 million tones of CO2 equivalent
avoided in 2017
283,4681,087,091 1,555,263 1,925,350
9,422,306
14,370,420
2014 2015 2016 2017 CURRENTPORTFOLIO
est.
TARGETEDPORTFOLIO
est.
2 million MWh of clean energy electricity supplied
to the national grids in 2017
I M P A C T O V E R V I E W F O R E W O R D I M P A C T A P P R O A C H I M P A C T M E T R I C S F U N D S P O R T F O L I O I M P A C T T H E M E A P P E N D I C E S

GEEREF IMPACT REPORT 2017 15
~800 MWCLEAN ENERGY
CAPACITY INSTALLED
In 2017 GEEREF’s funds registered a 20 percent increase in the installed capacity, reachinga total of 800 MW. 125 MW were connected to the grid throughout the year, primarily inSouth and Southeast Asia (86% of new addition).
Majority of the installed projects were concentrated in three countries: South Africa (40%),India (30%) and Vietnam (11%) – and implemented by the three most advanced and ‘oldest’funds in GEEREF’s portfolio: Evolution I, REAF I and Armstrong. As a minority shareholder inrelatively large operating projects, Evolution I represents the largest contributor theaggregate capacity installed.
With 2 GW currently under development and construction and additional 1.3 GW in thepipeline, a total of 4.15 GW of capacity is the current notional capacity of GEEREF’sinvestments (based on GEEREF’s existing 13 portfolio funds). This figure will keep increasingwith each new GEEREF commitment until it is fully invested and its portfolio funds have allallocated their funds to investments.
2,000 GWHCLEAN ENERGY
GENERATED
In 2017 GEEREF’s 36 grid-connected projects generated 2,000 GWh of clean energy, up by25%, or 400 GWh, from 2016. Most of the electricity generated was in South Africa (46%),Vietnam (23%) and India (17%). While India has more installed capacity than Vietnam, thecapacity factor of these projects (solar) is lower than of the ones in Vietnam (hydro),resulting in higher electricity generation by Vietnamese projects.
Once all portfolio projects, currently under development and construction, are operational,9,400 GWh of clean energy will be generated annually, with Vietnam (21%), South Africa(16%), India (13%) and Kenya as main beneficiaries. When pipeline projects are included,the generation goes up to 14,400 GWh annually. Assuming a renewable energy asset life of20 years, the total electricity generated over the life of all projects in the future portfoliowill be 288,000 GWh.
67 GWHELECTRICITY SAVED
GEEREF had two active funds – MSEF and Evolution I – and one liquidated fund (EELAF II)that also target energy efficiency, with a total of 18 operational projects in their portfolio.Combined, these projects generated savings of 52 GWh in 2017, with the majority of thesavings located in Mexico (60%), followed by South Africa (25%) and Colombia (13%).
When additional projects, currently under development or being installed, arecommissioned, GEEREF’s funds will save the equivalent of 79 GWh annually. Assuming anenergy efficiency asset life of 10 years, the total electricity saved over the life of all projectsin the future portfolio will be 790 GWh.
1.5 MILLION tCO2eqAVOIDED
In 2017, the electricity production and savings contributed to the avoidance of anequivalent of 1.5 million tones of CO2 annually. Once all projects that are currently underdevelopment or construction are installed, the figure increases to 5 million tones of CO2
annually. This is an equivalent to emissions generated by a coal plant in a year, or 700,000OECD households’ electricity use in a year, or emissions of almost 1 billion passengervehicles, using EPA data.* Once all pipeline projects are operational, 8.2 million tones ofCO2 will be avoided annually. Over the full life of the assets this translates into 164 milliontones of CO2 avoided.
* https://www.epa.gov/energy/greenhouse-gas-equivalencies-calculator
GEEREF PORTFOLIO METRICSPILLAR 1 AND 2: CLEAN ENERGY & ENVIRONMENT/CLIMATE MITIGATION
I M P A C T O V E R V I E W F O R E W O R D I M P A C T A P P R O A C H I M P A C T M E T R I C S F U N D S P O R T F O L I O I M P A C T T H E M E A P P E N D I C E S

GEEREF IMPACT REPORT 2017 16
IMPLIED BENEFICIARY HOUSEHOLDS BENEFITTING FROM NEW/IMPROVED ENERGY ACCESS (ANNUAL)
PERMANENT EMPLOYEES
TEMPORARY EMPLOYEES BENEFICIARY SMES
TRAINING PROVIDED (HRS, ANNUAL) TAXES PAID (EUR M, ANNUAL)
GEEREF PORTFOLIO METRICSPILLAR 3: SUSTAINABLE DEVELOPMENT
34 5
56
67
2015 2016 2017 CURRENTPORTFOLIO est.
TARGETEDPORTFOLIO est.
20,749
46,302 46,543
124,363
226,691
2015 2016 2017 CURRENTPORTFOLIO est.
TARGETEDPORTFOLIO est.
741 1,524 1,792
2,4743,149
276
644632
1,266
1,406
2015 2016 2017 CURRENTPORTFOLIO est.
TARGETEDPORTFOLIO est.
Female Male
1,978 2,688 4,522
5,505
11,416
27171
206
360
701
2015 2016 2017 CURRENTPORTFOLIO est.
TARGETEDPORTFOLIO est.
Female Male
350414
703
959
1,570
2015 2016 2017 CURRENTPORTFOLIO est.
TARGETEDPORTFOLIO est.
33,713 228,716 298,733 453,227
8,500,120
11,813,821
2014 2015 2016 2017 CURRENTPORTFOLIO
est.
TARGETEDPORTFOLIO
est.
I M P A C T O V E R V I E W F O R E W O R D I M P A C T A P P R O A C H I M P A C T M E T R I C S F U N D S P O R T F O L I O I M P A C T T H E M E A P P E N D I C E S

GEEREF IMPACT REPORT 2017 17
450,000HOUSEHOLDS
BENEFITTING FROM NEW/IMPROVEDENERGY ACCESS
In 2017, GEEREF’s funds reached an equivalent of 450,000 beneficiary households in 15countries through electricity generated from 788 MW of installed capacity. This is up by34%, or 150,000 households, and from 12 countries in 2016.
Once the funds’ projects are fully built up (including pipeline, i.e. 4.2 GW of installedcapacity) GEEREF should provide new or improved access to 11.8 million householdsannually in 24 countries, with the largest portion of households located in Africa, where twocountries represent half of the beneficiary households - in Uganda (15%) and Kenya (32%).This stems from low household consumption in these countries, where every new MWhgenerated impacts a high number households beneficiaries (for instance 0.6 MWh inUganda per household compared to 20.5 MWh per household in South Africa).
7,200EMPLOYEES
In 2017, GEEREF’s projects employed around 7,200 people. Majority of the employees wereon temporary contracts (65%). Majority of the employees were located in Uganda (27%),India (20%) and the Philippines (16%).
The largest portion of labour (47%) was employed during construction, followed byoperation (19%) and development (22%). 66% of temporary labour was hired duringconstruction and 28% for operation phase. Permanent labour was mostly employed indevelopment (54%) and operation (37%) stages.
The vast majority of all employees were male (88%). Majority (75%) of female employeeswere in permanent positions and engaged in the development (58%) and operation stages(21%) of projects. 21% of women were engaged in construction.
Importantly, a large number of the funds‘ projects are located in overlooked rural areas,where employment has a significant catalytic effect that trickles into and benefits the widerrural economy.
In addition, GEEREFs funds employed 181 employees directly at the fund-level, including 54women. 13% of fund-level partners/directors are women.
46,500TRAINING HOURS
Most of the training provided included health & safety training, technical training andenvironmental and social compliance training. Majority of the training hours (50%) weregiven on operational projects.
It is expected that, once all the projects that are currently under development andconstruction reach their operational phase, 28,500 hours of training will have beenprovided annually. The run-rate figure is lower than the actual 2017 figure as less training isrequired during operation of projects than during construction.
5 MILLIONTAXES PAID
In 2017, GEEREF-supported projects contributed EUR 5m in taxes to national governments.Clean energy infrastructure receives beneficial tax treatment in some countries of ourinvestments to incentivise investors‘ participation in and expansion of the sector.
The relatively low level of taxes paid in 2017 is reflective of the fact that majority ofGEEREF’s projects are either in development and construction.
I M P A C T O V E R V I E W F O R E W O R D I M P A C T A P P R O A C H I M P A C T M E T R I C S F U N D S P O R T F O L I O I M P A C T T H E M E A P P E N D I C E S
GEEREF PORTFOLIO METRICSPILLAR 3: SUSTAINABLE DEVELOPMENT

GEEREF IMPACT REPORT 2017 18
GEEREF COMMITMENTS TO FUNDS (EUR M) FUNDS’ COMMITMENTS TO PROJECTS (EUR M)
TOTAL RAISED BY GEEREF FUNDS (EUR M)1TOTAL PROJECT FINANCE COMMITTED (EUR M)
FUND MULTIPLIER PROJECT MULTIPLIER
1 Including GEEREF commitments
68
99
154
166
2014 2015 2016 2017
123
317
468
606
782
1,080
2014 2015 2016 2017 CURRENTPORTFOLIO est.
TARGETEDPORTFOLIO est.
1,218
2,174 2,386
2,996
4,353
6,193
2014 2015 2016 2017 CURRENTPORTFOLIO est.
TARGETEDPORTFOLIO est.
414
672
906
1,038
1,254
2014 2015 2016 2017 TARGETED
6.1
6.8
5.9
6.3
7.5
2014 2015 2016 2017 TARGETEDPORTFOLIO est.
GEEREF PORTFOLIO METRICSPILLAR 3: FINANCIAL LEVERAGE
I M P A C T O V E R V I E W F O R E W O R D I M P A C T A P P R O A C H I M P A C T M E T R I C S F U N D S P O R T F O L I O I M P A C T T H E M E A P P E N D I C E S
6.8 6.6
5.1 4.95.6 5.7
2014 2015 2016 2017 CURRENTPORTFOLIO est.
TARGETEDPORTFOLIO est.

GEEREF IMPACT REPORT 2017 19
CAPITAL MOBILIZATION AT FUND-LEVEL, BY FUNDING SOURCE
PRIVATE CAPITAL MOBILIZATION AT FUND-LEVEL, BY GEOGRAPHY
CAPITAL MOBILIZATION AT PROJECT-LEVEL,BY FINANCIAL INSTRUMENT & SOURCE
CAPITAL MOBILIZATION AT PROJECT-LEVEL,BY GEOGRAPHY
1 Including GEEREF commitments
GEEREF PORTFOLIO METRICSPILLAR 3: FINANCIAL LEVERAGE
DFI73%
Private27%
Fund equity20%
Equity (public)3%
Equity (private)14%
Debt (public)28%
Debt (private)35%
3 BN OF CAPITAL RAISED BY
GEEREF PORTFOLIO FUNDS
Africa23%
LAC4%
MENA and Central
Asia8%
South Asia6%
Southeast Asia59%
East Asia & Pacific
15%
LAC3%
MENA2%
South Asia10%
Sub-Saharan Africa70%
3 BN OF CAPITAL RAISED BY
GEEREF PORTFOLIO FUNDS
I M P A C T O V E R V I E W F O R E W O R D I M P A C T A P P R O A C H I M P A C T M E T R I C S F U N D S P O R T F O L I O I M P A C T T H E M E A P P E N D I C E S
1 BN OF CAPITAL RAISED BY
GEEREF PORTFOLIO FUNDS
1 BN OF CAPITAL RAISED BY
GEEREF PORTFOLIO FUNDS
DAM NAI WIND PROJECT PHASE 2 TURBINE BLADE ARRIVAL AT CAM RANH PORT, VIETNAM, ARMSTRONG

GEEREF IMPACT REPORT 2017 20
GEEREF-LEVEL
EUR 222 MSIZE OF GEEREF
Public investors committed EUR 112m into GEEREF, which mobilised further EUR 110m ofprivate investors’ commitments.
As of the end of 2017, GEEREF’s portfolio consisted of EUR 166m of commitments into 13funds.
FUND-LEVEL
EUR 1 BN TOTAL RAISED BY
FUND MANAGERS AS A RESULT OF
GEEREF’S COMMITMENT
Based on GEEREF’s commitment of EUR 166m, fund managers have raised a total of EUR ~1bn. This translates into a fund-level multiplier of 6.3x, an increase compared to the 2016multiplier of 5.9x. The slight increase in the fund multiplier is mostly driven a successful finalclosing of REAF II, where the fund manager was able to raise EUR 50m on the back ofGEEREF’s EUR 14.4m commitment. As of the end of 2017, three of GEEREF’s funds were stillfundraising. It is expected that once these funds reach final closings, the fund-levelmultiplier will increase to 7.2x.
A vast majority of the capital raised as of the end of 2017 – 73% – comes fromDevelopment Finance Institutions (DFIs), such as the Dutch Development Bank (FMO), theUK development finance institution CDC Group and International Finance Corporation (IFC).27% percent from a diversified pool of private investors (asset managers, impact investors,and other). This is a 4% increase as compared to 2016, demonstrating a larger appetite ofprivate investors for the asset class. At the time of this report, Asia receives 59% of privatecapital catalysed by GEEREF.
International organizations have been working on a harmonized approach to calculatingfinancial mobilization. GEEREF has been reviewing the approaches of the OECD and a set ofMultilateral Development Banks. However, their approaches do not fully capture the fullscope of capital mobilisation of a vehicle like GEEREF. For example, the OECD’s approachfocuses solely on the amount of private capital mobilised and only at the fund level. It alsoattributes the private capital mobilised to each of the DFIs investing in a fund based on theirshare in a fund. Using the OECD methodology, GEEREF would have mobilised a total of 30million of private capital at the investee fund level between 2012 and 2016 and in 2017,GEEREF would have mobilised an additional 15 m of private capital.
PROJECT-LEVEL
EUR 3 BNOF PROJECT
FINANCING RAISED
By year-end 2017, the final cost of projects developed by GEEREF fund managers reachedEUR 3 bn, 20% of which represents their equity contribution and 17% represents equitycontribution of other, mostly private, investors. The remaining 63% of project financingcomes from lenders, almost evenly split between DFIs, national development banks orequivalent and private local banks.
The total capital mobilized increased by EUR 0.7bn compared to 2016 but the multiplierdecreased from 5.1x to 4.9x. This is driven by the immaturity of some of the projectportfolios of the latest vintages (e.g. Evolution II, REAF II, CCEF, Catalyst). In addition, fundshave been increasingly doing all-equity financing of underlying projects. Based on forecastsprovided by these portfolio funds, once portfolios mature and all portfolio and pipelineprojects reach financial close, the multiplier is expected to increase to 5.7x.
GEEREF PORTFOLIO METRICSPILLAR 3: FINANCIAL LEVERAGE
I M P A C T O V E R V I E W F O R E W O R D I M P A C T A P P R O A C H I M P A C T M E T R I C S F U N D S P O R T F O L I O I M P A C T T H E M E A P P E N D I C E S

INSTALLED CAPACITY(MW, PER FUND)
ELECTRICITY GENERATED(MWH, PER FUND)
GHG MITIGATION (TCO2EQ, PER FUND)
BENEFICIARY HOUSEHOLDS (#, PER FUND)
GEEREF IMPACT REPORT 2017 21
GEEREF PORTFOLIO METRICSFUND IMPACT FIGURES CONTRIBUTION ANALYSIS
I M P A C T O V E R V I E W F O R E W O R D I M P A C T A P P R O A C H I M P A C T M E T R I C S F U N D S P O R T F O L I O I M P A C T T H E M E A P P E N D I C E S
Evolution I
REAF I
Frontier IArmstrong
MSEF
AREF
SolarArise
REAF II
Catalyst
CCEF
Frontier IIEvolution II
2008 2009 2010 2012 2013 2014 2016 2017 2019 2020 2021 2023 2024 2025 2027 2028
Investment Period
Armstrong; 180
EVO I; 317
MSEF; 24
REAF I; 160
REAF II; 18 SolarArise; 70
2014 2015 2016 2017 AREF
Armstrong
DI Frontier I
EVO I
MSEF
REAF I
REAF IISolarArise
2014 2015 2016 2017
AREF
Armstrong
DI Frontier I
EVO IMSEF
REAF I
REAF II
SolarArise
2014 2015 2016 2017
AREF
Armstrong
DI Frontier I
EVO I
MSEF
REAF I
REAF IISolarArise
2014 2015 2016 2017
Divestment Period

DI Frontier Frontier IIEvolution IEvolution II
AREF
MSEF IEELAF II
REAF IREAF II
Armstrong
CatalystCCEF
SolarArise
GEEREF IMPACT THEME: LAND ACQUISITIONCATALYSING BILLIONS OF CLEAN POWER
22GEEREF IMPACT REPORT 2017
SITI I, UGANDA, FRONTIER I
Relevant EIB E&S standards apply throughout the involuntary resettlement process, helping fund managers toimprove their E&S performance through implementation of sound environmental and social practices, transparencyand accountability.
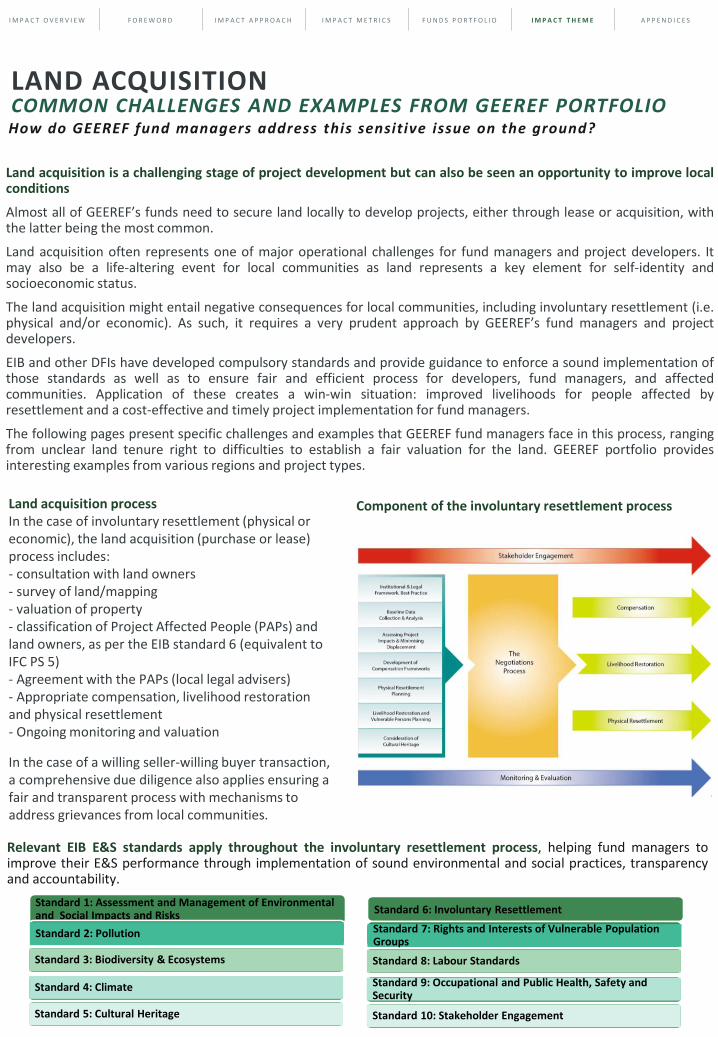
Land acquisition process In the case of involuntary resettlement (physical or economic), the land acquisition (purchase or lease) process includes:- consultation with land owners - survey of land/mapping- valuation of property- classification of Project Affected People (PAPs) and land owners, as per the EIB standard 6 (equivalent to IFC PS 5)- Agreement with the PAPs (local legal advisers)- Appropriate compensation, livelihood restoration and physical resettlement- Ongoing monitoring and valuation
In the case of a willing seller-willing buyer transaction, a comprehensive due diligence also applies ensuring a fair and transparent process with mechanisms to address grievances from local communities.
I M P A C T O V E R V I E W F O R E W O R D I M P A C T A P P R O A C H I M P A C T M E T R I C S F U N D S P O R T F O L I O I M P A C T T H E M E A P P E N D I C E S
LAND ACQUISITIONCOMMON CHALLENGES AND EXAMPLES FROM GEEREF PORTFOLIO
Land acquisition is a challenging stage of project development but can also be seen an opportunity to improve localconditions
Almost all of GEEREF’s funds need to secure land locally to develop projects, either through lease or acquisition, withthe latter being the most common.
Land acquisition often represents one of major operational challenges for fund managers and project developers. Itmay also be a life-altering event for local communities as land represents a key element for self-identity andsocioeconomic status.
The land acquisition might entail negative consequences for local communities, including involuntary resettlement (i.e.physical and/or economic). As such, it requires a very prudent approach by GEEREF’s fund managers and projectdevelopers.
EIB and other DFIs have developed compulsory standards and provide guidance to enforce a sound implementation ofthose standards as well as to ensure fair and efficient process for developers, fund managers, and affectedcommunities. Application of these creates a win-win situation: improved livelihoods for people affected byresettlement and a cost-effective and timely project implementation for fund managers.
The following pages present specific challenges and examples that GEEREF fund managers face in this process, rangingfrom unclear land tenure right to difficulties to establish a fair valuation for the land. GEEREF portfolio providesinteresting examples from various regions and project types.
How do GEEREF fund managers address this sensitive issue on the ground?
Component of the involuntary resettlement process
Standard 1: Assessment and Management of Environmental and Social Impacts and Risks
Standard 2: Pollution
Standard 3: Biodiversity & Ecosystems
Standard 4: Climate
Standard 5: Cultural Heritage
Standard 6: Involuntary Resettlement
Standard 7: Rights and Interests of Vulnerable Population Groups
Standard 8: Labour Standards
Standard 9: Occupational and Public Health, Safety and Security
Standard 10: Stakeholder Engagement

GEEREF IMPACT REPORT 2017 24
Most common challenges faced by fund managers in the process of acquiring the landinclude:
I M P A C T O V E R V I E W F O R E W O R D I M P A C T A P P R O A C H I M P A C T M E T R I C S F U N D S P O R T F O L I O I M P A C T T H E M E A P P E N D I C E S
LAND ACQUISITIONCOMMON CHALLENGES AND EXAMPLES FROM GEEREF PORTFOLIO
CHALLENGE EXAMPLE FROM FUND
1. Issues with the local legal regulation, especiallyregarding land tenure rights:
• Unclear land ownership and tenure rights(customary rights vs statutory rights)
• Ownership of the land restricted to thehousehold head, including in some in patriarchaltribes
• Lengthy public approval processes to secure landtenure rights
• Weak enforceability of land sale contracts
“We have encountered instances where the land is not titled or where land is titled, you encounter two individuals/entities claiming ownership to the same piece of land. Some even have separate valid certificates to prove ownership to the same land. Proving legal ownership becomes a cumbersome and lengthy legal process. In addition, bureaucratic delays associated with the transfer of ownership within the government agencies affect the release of land for the project execution. The project could also affect informal settlers.For instance, Kikagati project had to be categorized as a category A due to the over 600 undocumented settlers who were farming illegally within the riparian land that required to be compensated and moved despite the affected land largely being owned by the Uganda government through the National Environmental Management Authority.” AREF (Sub-Saharan Africa)
2. Environmental matters, as the project development might lead to potential negative impacts on the land
“The steep terrain in which projects are located means that protecting land from degradation through erosion, rock falls and spoil material tipping is hard to manage. This has led to a number of grievances, and the project has had to compensate landowners for damage to land, structures and/or crops.”Frontier Energy (East Africa)
3. Agreement on the land valuation and the compensation mechanism
“During the compensation process, it is common to receive exaggerated claims greater than the actual land and this requires detailed surveys to determine the actual and current farm sizes.” AREF (Sub-Saharan Africa)
4. Handling grievance mechanisms from local communities
“When displacement cannot be avoided, the developer will generally offer displaced communities and persons compensation for loss of assets at full replacement cost and other assistance to help them improve or restore their standards of living or livelihoods, as provided in EIB standard 6 or IFC PS5. However, different types of land can becompensated at different rates, and allocations may lead to objections, disputes and/or grievances. It is therefore of utmost importance that Evolution I follows international best practice guidelines and ensure that Portfolio Companies implement transparent and consistent compensation procedures, as well as robust stakeholder engagement processes, where applicable.” Evolution I (South Africa)
5. Change of Land use and convoluted zoning of lands (fragmented)
“By law we have to convert the acquired land into Non-Agricultural land to use the land for setting up solar plant. In some States, the process of conversion is time consuming.”, Solar Arise (India)

GEEREF IMPACT REPORT 2017 25
I M P A C T O V E R V I E W F O R E W O R D I M P A C T A P P R O A C H I M P A C T M E T R I C S F U N D S P O R T F O L I O I M P A C T T H E M E A P P E N D I C E S
LAND ACQUISITIONCOMMON CHALLENGES AND EXAMPLES FROM GEEREF PORTFOLIO
6. Agreement between community members onlivelihood restoration programs
“Building consensus between competing ideas within the community is a significant challenge when identifying livelihood restoration programmes. Where livelihood support projects have been set up with a community management structure, they tend to not perform well due to the lack of commitment within the members selected. A case in point is the sustainable community charcoal production set up by APSD. APSD set up community owned and managed fast growing acacia plantations that would be processed in efficient community charcoal kilns and sold to earn an income. The management of the plantation faltered due to competing ideas. Poor management resulted in the plantations being affected by fires that made the projects not successful as envisaged. Measures are being looked into how to optimise the projects and ensure that the community benefits.”, AREF (Africa)
7. Interaction with local authorities might be challenging, as they might not be aware of the international standards implemented and lack proper incentives to be engaged
“Many times local authorities aren't aware of the international standards that are followed, therefore when local authorities are leading the land acquisition process it can be difficult to steer them in the direction consistent with EIB standard 6 orIFC PS 5. This can be solved by proper engagement beforehand and guiding the authorities each step of the way. It means that even though this is a government led land acquisition process, it requires the project team to be very involved at each step.”, REAFII (South East Asia)
8. Political interference, as politicians might try to claim ownership of the job creation due to the project development
“As part of the engagement process, political interests try tocapitalise on the land acquisition process as well as the projectactivities especially the community development programmesand the ability to create local employment opportunities, as anopportunity to seek political mileage.”, AREF (Sub-SaharanAfrica)
“In Vietnam, the Government is responsible for land acquisitionand compensation process of approved projects of 'nationalimportance', including energy projects. Armstrong and ourdevelopers must collaborate with them to try to improve theprocess. We aim to increase transparency, speed, consultationwith the affected people, and also we usually provideadditional compensation in many cases. The extent ofcollaboration permitted depends on the particular provincialGOV agency in charge. We aim to achieve compliance with IFCPS5 but must also work within the GOV mandated process”,Armstrong (South East Asia)
“We have seen where a land acquisition process can go wrongwhen there are political influences involved. This can be verydifficult to maneuver as the sensitivities surrounding theprocess can be high. This requires increased engagement withcommunity and authorities while not taking political sides.Additionally, documentation and proper records are even moreimportant in this instance as on many occasions an offer thathas been accepted can be retracted due to politicalinfluences.”, REAF II (South East Asia)

GEEREF IMPACT REPORT 2017 26
Example : Lessons learned from Frontier Energy’s approach to land acquisition (1/3)
1. Active ongoing community and public engagement during the land acquisition process (example of Siti 1 and 2)
Engaging the whole household
- While land might be owned in specific patriarchal tribes by the male household head (such as the Sabiny tribe inEastern Uganda where Siti 1 and 2 are located), partners, wives and children might not be involved in the process ofland sale.
- Frontier implements international best practices always ensures that all processes, not limited to disclosure, includespouses. The Frontier team approaches these gender imbalance with great care, so as neither alienate the womenPAPs from their families and communities nor undermine gender relations and balance. The Frontier team rathertries to engage women so that their opinions provide input in the decisions making together with, or on behalf of,their spouses and families.
Proper disclosure
- The Frontier team systematically ensures that community liaison officers dealing with disclosures to PAPs aresensitive to the local beliefs, while also ensuring everyone is informed on project’s rational and implementationprocesses including land acquisition.
Getting local support
- Frontier continuously engages local leaders in support of project to sensitise and ensure the people in theircommunities are aware of the applied legal processes available to protect their rights.
- As a private developer, engaging with public authorities might also be challenging. Hence it is critical to engage themat an early stages and fully inform them on the project and its impacts.
Proactive supervision and monitoring
- Proactive supervision and monitoring of the land acquisition process is key to ensuring that the commitments andlimits set during the engagement process are maintained. Engagement is an on-going two-way communication thatserve to foster a relationship of confidence and mutual trust between the project managers and the concernedcommunities.
I M P A C T O V E R V I E W F O R E W O R D I M P A C T A P P R O A C H I M P A C T M E T R I C S F U N D S P O R T F O L I O I M P A C T T H E M E A P P E N D I C E S
LAND ACQUISITIONCOMMON CHALLENGES AND EXAMPLES FROM GEEREF PORTFOLIO

GEEREF IMPACT REPORT 2017 27
Example : Lessons learned from Frontier’s approach to land acquisition (2/3)
2. Ensuring the fairness of the compensation mechanism (example of Nyagamasani)
- As part of the compensation process, Frontier favors the replacement of houses instead of the payment incash, although within a single country such as Uganda, PAPs might have different priorities (“For example, themajority of PAPs opted for cash compensation in Western Uganda (Lubilia site), while on our eastern Ugandaprojects (Siti I&II), they opted for land-for-land compensation. This difference could be attributed to socio-economic conditions such as accessibility (or lack of) to urban areas, employment opportunities, administrativeservices, and dependency on agriculture.”, E&S responsible at Frontier) .
- In the case of replacement, the PAPs identify their own land, with the support from the project's communityliaison officer, and the portfolio company then buys the land for the PAP as replacement. The Frontier teamalso assures that the PAP has security of tenure for his/her newly acquired land, either in the form of a letterfrom the local authority or a land title.
- As part of the compensation process, Frontier is also integrating the lost income from crops (coffee/vanilla)in the valuation.
- Rates guiding the compensation mechanism are set by a public valuer and do not always reflect the marketprice. The team has made its best to ensure that the lost income is valued at the actual market price (cropsvaluation might in some countries not been reviewed on a regular basis).
- Frontier also tried to include cultural compensation in the replacement cost (when relocation of graves areconcerned for instance), as there is still few guidance on these aspects.
- In addition, the Frontier team has also worked to bring water networks to local communities to which theyparticipated through minor voluntary land donations.
- For Frontier, the most challenging issues have been faced when acquiring additional lands at an advancedstage of the project development when there are only limited options for the fund manager and hence pricesare often over-valued.
- Key enablers to agree on the valuation throughout the land acquisition process include a proper publicdisclosure, an ongoing stakeholder engagement as well as an on time payment.
I M P A C T O V E R V I E W F O R E W O R D I M P A C T A P P R O A C H I M P A C T M E T R I C S F U N D S P O R T F O L I O I M P A C T T H E M E A P P E N D I C E S
LAND ACQUISITIONCOMMON CHALLENGES AND EXAMPLES FROM GEEREF PORTFOLIO
GEEREF IMPACT REPORT 2017 28
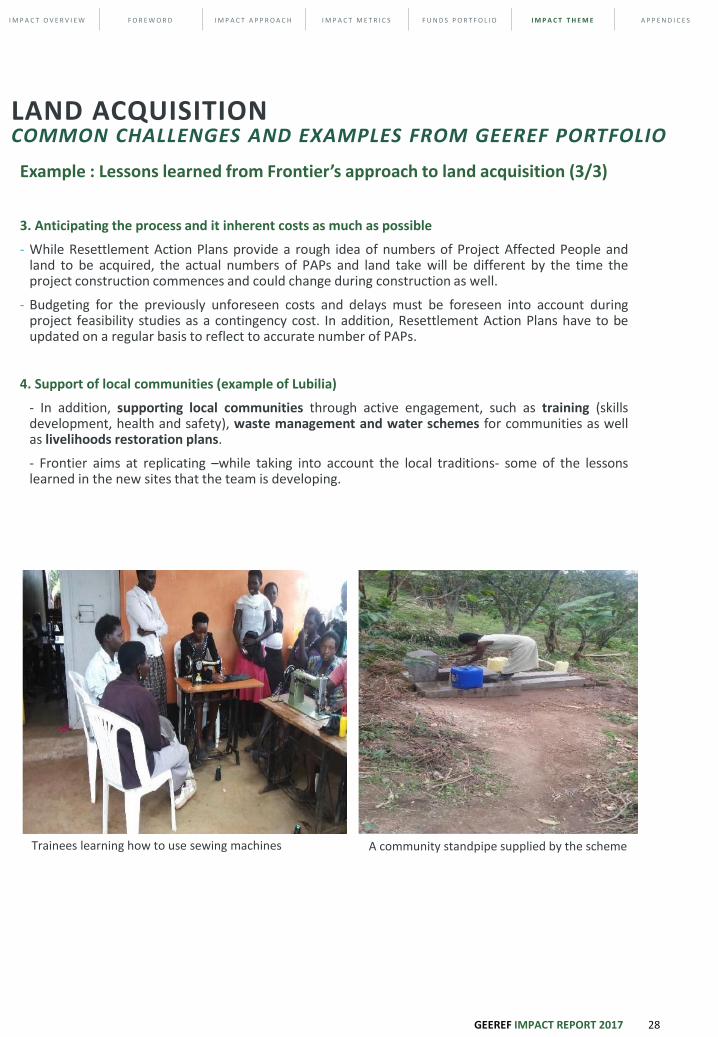
Example : Lessons learned from Frontier’s approach to land acquisition (3/3)
3. Anticipating the process and it inherent costs as much as possible
- While Resettlement Action Plans provide a rough idea of numbers of Project Affected People andland to be acquired, the actual numbers of PAPs and land take will be different by the time theproject construction commences and could change during construction as well.
- Budgeting for the previously unforeseen costs and delays must be foreseen into account duringproject feasibility studies as a contingency cost. In addition, Resettlement Action Plans have to beupdated on a regular basis to reflect to accurate number of PAPs.
4. Support of local communities (example of Lubilia)
- In addition, supporting local communities through active engagement, such as training (skillsdevelopment, health and safety), waste management and water schemes for communities as wellas livelihoods restoration plans.
- Frontier aims at replicating –while taking into account the local traditions- some of the lessonslearned in the new sites that the team is developing.
Trainees learning how to use sewing machines A community standpipe supplied by the scheme
I M P A C T O V E R V I E W F O R E W O R D I M P A C T A P P R O A C H I M P A C T M E T R I C S F U N D S P O R T F O L I O I M P A C T T H E M E A P P E N D I C E S
LAND ACQUISITIONCOMMON CHALLENGES AND EXAMPLES FROM GEEREF PORTFOLIO

GEEREF IMPACT REPORT 2017 29
As illustrated through the GEEREF portfolio, key general lessons learned from fundmanagers through the land acquisition process include:
- Engaging with local community and local authorities at the onset to get support at the earliest stages of the project,and then regularly through its planning, designing, construction and operation
- Ensuring a proper land mapping at the earliest stage of the due diligence
- Engaging with local legal advisers
- Favoring land replacement to payment in cash when possible
- Trying to avoid involuntary resettlement wherever possible and to minimize its impact on those affected ordisplaced through mitigation measures,
- Fair compensation for improvements to living conditions,
- As well as restoration, and when possible, improvement of the livelihood,
- Supporting security of land tenure for local communities,
- Supporting social activities for local communities and enabling the transfer of skills and competencies,
- Providing jobs locally
- Finally proactively supervising and monitoring the land acquisition process is key to ensuring that the commitmentsand limits set during the engagement process are respected.
A balanced and humble approach to land acquisition
- Preserving the balance between achieving economic development (be it through the development of renewable energy or energy efficiency projects) and ensuring respect for human rights, and the environmental and social sustainability is demanding.
- On the one hand, a poorly managed land acquisition process can negatively impact the sustainability of the project and negatively impact project sustainability and wellbeing of affected communities, on the other hand, a proactive and interactive process can enhance the outcomes of the project and improve living standards of local communities;
- Anticipating during the due diligence – at GEEREF level, and then at the fund manager and portfolio company levels-, potential issues related to land acquisition is hence instrumental throughout the key steps of the process (including stakeholders engagement, land mapping, proper compensation system, restoration of the livelihood and ongoing monitoring)
- The EIB is proactively trying to integrate the key principles of the voluntary guidelines on the responsible governance of tenure (VGGT*) during its due diligence. The guidelines provide guidance to improve the governance of tenure of land (as well as fisheries and forests) with the aim to preserving sustainable social and economic livelihood and to preserving the security of land tenure.
* VGGT (Volontary Guidelines on the Responsible Governance of Tenure):www.fao.org/docrep/016/i2801e/i2801e.pdf
LAND ACQUISITIONCOMMON CHALLENGES AND EXAMPLES FROM GEEREF PORTFOLIO
I M P A C T O V E R V I E W F O R E W O R D I M P A C T A P P R O A C H I M P A C T M E T R I C S F U N D S P O R T F O L I O I M P A C T T H E M E A P P E N D I C E S
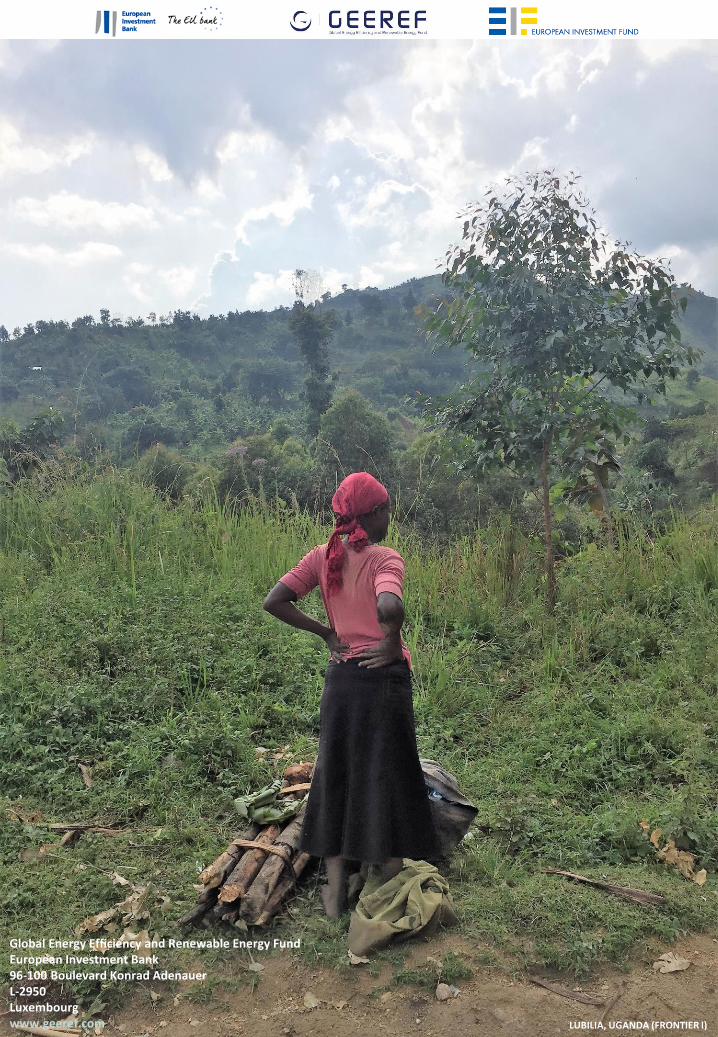
LUBILIA, UGANDA (FRONTIER I)
Global Energy Efficiency and Renewable Energy FundEuropean Investment Bank96-100 Boulevard Konrad AdenauerL-2950Luxembourgwww.geeref.com


![Home Page [aref-bk.men.gov.ma]](https://static.documents.pub/doc/80x56/61745aa4e162c2299b5eeb5e/home-page-aref-bkmengovma.jpg)


