Gel-Phase Microdomains and Lipid Rafts in Monolayers Affect the Redox Properties of Ubiquinone-10 Lucia Becucci, Federica Scaletti, and Rolando Guidelli* Chemistry Department, Florence University, Firenze, Italy ABSTRACT The redox properties of ubiquinone-10 (UQ) were examined in monolayers of mixtures of dioleoylphosphatidyl- choline, palmitoylsphingomyelin, and cholesterol of different compositions, self-assembled on a mercury electrode, over the pH range from 7.5 to 9.5. A detailed analysis of the cyclic voltammograms of UQ in the above lipid environments points to a mech- anism consisting of an elementary electron transfer step followed by two protonation (or deprotonation) steps in quasiequilibrium and by a further electron transfer step. In a lipid environment of solid-ordered (s o ) microdomains in a liquid-disordered (l d ) matrix, electron transport across the lipid monolayer takes place in the l d phase. In a pure s o phase, UQ tends to segregate into UQ-rich pools, exhibiting reversible electron transfer steps. In a lipid environment consisting of liquid-ordered (l o ) microdomains (lipid rafts) in an l d matrix, UQ molecules tend to localize along the edge of the lipid rafts. However, in a lipid environment consisting exclusively of l o and s o microdomains, UQ molecules tend to segregate into UQ-rich pools. In all lipid environments, electron transport by UQ occurs with the quinone moiety localized on the solution side with respect to the ester linkages of the dioleoyl- phosphatidylcholine molecules. INTRODUCTION Ubiquinone-10 (UQ) is an important electron carrier between membrane-bound redox enzymes. It participates in the mitochondrial respiratory chain by shuttling electrons from NADH-ubiquinone reductase to ubiquinone-cyto- chrome c reductase and by contributing to the generation of a proton electrochemical potential gradient across the mitochondrial membrane. Also important, albeit lesser known, is the UQ role in plasma membranes. The amount of UQ in plasma membranes is more than one-third of its content in the mitochondrial membrane and exerts multifar- ious functions (for a review, see Crane (1)). Thus, it is involved in a plasma membrane electron transport system by which NADH in the cytoplasm transfers electrons through UQ to electron acceptors such as iron or oxygen outside the cell (1–3). When this system is activated, the proton release through the H þ /Na þ antiport is greatly increased. Because much of UQ in cell membranes is in the quinol form, it can be a very effective antioxidant (1,4,5). At least three enzymes (NADH cytochrome b5 reductase, NADH/NADPH oxidoreductase, and NADPH coenzyme Q reductase) are known to keep UQ reduced in plasma membranes. Thus, a yeast mutant deficient in UQ shows more lipid peroxide formation than normal yeast. UQ-dependent electron transport across the plasma membrane can be used to regenerate ascorbate outside the cell from ascorbate radical (1). In addition, UQ plays a role in cell signaling and gene expression. Thus, the autooxidation of semiquinone formed in various membranes during electron transport activity can be a primary basis for generation of H 2 O 2 . Hydrogen peroxide in turn activates transcription factors such as NF k B to induce gene expression (1). A cell surface NADH oxidase and a transplasma membrane NADH oxidase have been shown to oxidize quinol in plasma membranes. A coenzyme UQ oxidase can oxidize quinol at the outer surface with produc- tion of superoxide. Gene transcription regulated by the he- mopexin system is controlled by surface copper reduction dependent on UQ (1). UQ is an amphiphilic molecule having a polar headgroup and a long hydrophobic isoprenoid chain. In common with other quinones, its reduction involves the uptake of two electrons and two protons at physiological pH. Knowledge of the UQ redox properties and reduction mechanism is important for the understanding of its function. However, there is no general consensus on the values of the redox potentials of the two UQ/UQ and UQ /UQH 2 couples and of the equilibrium constants of the intermediate proton- ation steps. Parameters obtained from studies in organic solvents cannot be extended to a membrane environment, where the aqueous solution bathing the membrane can participate in the intermediate protonation steps. The electrochemistry of UQ attached to carbon electrodes immersed in aqueous solutions has been studied by different groups (6,7). Gordillo and Schiffrin (8) investigated the redox properties of UQ by transferring UQ spread at the air/solution interface to a hanging mercury-drop electrode (HMDE). A mercury electrode is a more convenient support for a self-assembled amphiphilic film than a carbon elec- trode. Its surface is highly and easily reproducible and its liquid state imparts lateral mobility to the adsorbed mole- cules (9), whereas the surface state of a carbon electrode is difficult to control. Lipid monolayers incorporating UQ self-assembled on HMDEs have been investigated by Submitted April 15, 2011, and accepted for publication May 26, 2011. *Correspondence: guidelli@unifi.it Editor: Claudia Steinem. Ó 2011 by the Biophysical Society 0006-3495/11/07/0134/10 $2.00 doi: 10.1016/j.bpj.2011.05.051 134 Biophysical Journal Volume 101 July 2011 134–143
Transcript
134 Biophysical Journal Volume 101 July 2011 134–143
Gel-Phase Microdomains and Lipid Rafts in Monolayers Affect the RedoxProperties of Ubiquinone-10
ABSTRACT The redox properties of ubiquinone-10 (UQ) were examined in monolayers of mixtures of dioleoylphosphatidyl-choline, palmitoylsphingomyelin, and cholesterol of different compositions, self-assembled on a mercury electrode, over thepH range from 7.5 to 9.5. A detailed analysis of the cyclic voltammograms of UQ in the above lipid environments points to amech-anism consisting of an elementary electron transfer step followed by two protonation (or deprotonation) steps in quasiequilibriumand by a further electron transfer step. In a lipid environment of solid-ordered (so) microdomains in a liquid-disordered (ld) matrix,electron transport across the lipid monolayer takes place in the ld phase. In a pure so phase, UQ tends to segregate into UQ-richpools, exhibiting reversible electron transfer steps. In a lipid environment consisting of liquid-ordered (lo) microdomains (lipidrafts) in an ld matrix, UQ molecules tend to localize along the edge of the lipid rafts. However, in a lipid environment consistingexclusively of lo and so microdomains, UQ molecules tend to segregate into UQ-rich pools. In all lipid environments, electrontransport by UQ occurs with the quinone moiety localized on the solution side with respect to the ester linkages of the dioleoyl-phosphatidylcholine molecules.
INTRODUCTION
Ubiquinone-10 (UQ) is an important electron carrierbetween membrane-bound redox enzymes. It participatesin the mitochondrial respiratory chain by shuttling electronsfrom NADH-ubiquinone reductase to ubiquinone-cyto-chrome c reductase and by contributing to the generationof a proton electrochemical potential gradient across themitochondrial membrane. Also important, albeit lesserknown, is the UQ role in plasma membranes. The amountof UQ in plasma membranes is more than one-third of itscontent in the mitochondrial membrane and exerts multifar-ious functions (for a review, see Crane (1)). Thus, it isinvolved in a plasma membrane electron transport systemby which NADH in the cytoplasm transfers electronsthrough UQ to electron acceptors such as iron or oxygenoutside the cell (1–3).
When this system is activated, the proton release throughthe Hþ/Naþ antiport is greatly increased. Because much ofUQ in cell membranes is in the quinol form, it can be a veryeffective antioxidant (1,4,5). At least three enzymes (NADHcytochrome b5 reductase, NADH/NADPH oxidoreductase,and NADPH coenzyme Q reductase) are known to keepUQ reduced in plasma membranes. Thus, a yeast mutantdeficient in UQ shows more lipid peroxide formation thannormal yeast. UQ-dependent electron transport across theplasma membrane can be used to regenerate ascorbateoutside the cell from ascorbate radical (1). In addition,UQ plays a role in cell signaling and gene expression.Thus, the autooxidation of semiquinone formed in variousmembranes during electron transport activity can be a
Submitted April 15, 2011, and accepted for publication May 26, 2011.
primary basis for generation of H2O2. Hydrogen peroxidein turn activates transcription factors such as NFkB to inducegene expression (1). A cell surface NADH oxidase and atransplasma membrane NADH oxidase have been shownto oxidize quinol in plasma membranes. A coenzyme UQoxidase can oxidize quinol at the outer surface with produc-tion of superoxide. Gene transcription regulated by the he-mopexin system is controlled by surface copper reductiondependent on UQ (1).
UQ is an amphiphilic molecule having a polar headgroupand a long hydrophobic isoprenoid chain. In common withother quinones, its reduction involves the uptake of twoelectrons and two protons at physiological pH. Knowledgeof the UQ redox properties and reduction mechanism isimportant for the understanding of its function. However,there is no general consensus on the values of the redoxpotentials of the two UQ/UQ�� and UQ��/UQH2 couplesand of the equilibrium constants of the intermediate proton-ation steps. Parameters obtained from studies in organicsolvents cannot be extended to a membrane environment,where the aqueous solution bathing the membrane canparticipate in the intermediate protonation steps.
The electrochemistry of UQ attached to carbon electrodesimmersed in aqueous solutions has been studied by differentgroups (6,7). Gordillo and Schiffrin (8) investigated theredox properties of UQ by transferring UQ spread at theair/solution interface to a hanging mercury-drop electrode(HMDE). A mercury electrode is a more convenient supportfor a self-assembled amphiphilic film than a carbon elec-trode. Its surface is highly and easily reproducible and itsliquid state imparts lateral mobility to the adsorbed mole-cules (9), whereas the surface state of a carbon electrodeis difficult to control. Lipid monolayers incorporatingUQ self-assembled on HMDEs have been investigated by
Moncelli et al. (10,11) and by Gordillo and Schiffrin (12)using cyclic voltammetry and potential-step chronocoulom-etry. This simple biomimetic membrane provides a realisticenvironment for the investigation of UQ redox behavior.
More recently, monolayers and bilayers of lipid mixturesself-assembled on mercury were shown to form spontane-ously gel-phase microdomains, thanks to the fluidityimparted to these films by the liquid metal support (9). Ina mixture of a lipid component with a melting temperature(Tm) higher than room temperature and a component witha Tm value much lower than room temperature, gel-phasemicrodomains enriched in the high-Tm component are sur-rounded by a liquid-crystalline phase enriched in the low-Tm one (9,13). The gel phase is anisotropic, tightly packed,and has limited lateral mobility and axial rotation of the acylchains. Conversely, the liquid-crystalline phase is isotropic,loosely packed, and has a high degree of lateral mobility andaxial rotation. Addition of cholesterol (Chol) to these binarymixtures has a disordering effect on the gel (solid-ordered,so) phase and an ordering effect on the liquid-crystalline(liquid-disordered, ld) phase. In particular, Chol increaseslateral diffusion and axial rotation in the so microdomains,causing them to become isotropic and to pass from the gelphase to the so-called liquid-ordered (lo) phase. This phaseis regarded as liquid thanks to its sufficient lateral diffusion,and ordered because it is more tightly packed than theliquid-crystalline phase, due to the still modest axial rotationof its acyl chains (13).
The differential capacitance of the hydrocarbon tailregion of monolayers of binary mixtures of a low-Tm anda high-Tm lipid increases during the transition from the ldphase to the coexistence of ld and so phases (9). Additionof Chol to this binary mixture causes a decrease in differen-tial capacitance. This behavior is explained by regarding thecapacitance as a measure of the total perimeter of the somicrodomains, due to the mismatch between these microdo-mains and the ld phase. Chol removes this mismatch byconverting the anisotropic so microdomains into isotropiclo microdomains (the lipid rafts). Therefore, it is possibleto follow the same phase transitions reported in the literatureon giant unilamellar vesicles by carrying out differentialcapacitance measurements on mercury-supported mono-layers of lipid mixtures (9).
A recent investigation of the redox properties of octade-cylviologen incorporated in this biomimetic membrane,carried out in our laboratory, showed that an accurate fittingof cyclic voltammetric curves provides a wealth of informa-tion on electrode kinetics, permitting us to discriminatebetween different reaction mechanisms (14). The increasein the lateral interactions between the different redox statesof the reactant with an increase in its surface concentration,as estimated from the shape of the cyclic voltammograms(CVs), may also provide additional information on its stateof aggregation. This work describes the redox behavior ofUQ in monolayers of lipid mixtures of dioleoylphosphati-
dylcholine (DOPC), palmitoylsphingomyelin (PSM), andChol, self-assembled on a HMDE at pH 9.5, and providesa mechanistic interpretation of this behavior.
MATERIALS AND METHODS
The water used was obtained from water produced by an inverted osmosis
unit, upon distilling it once and then distilling the water so obtained from
alkaline permanganate. Suprapur KCl (Merck, Milano, Italy) was baked
at 500�C before use to remove any organic impurities. DOPC and PSM
were purchased in chloroform solution (Avanti Polar Lipids, Birmingham,
AL). Chol was purchased (Sigma, Milano, Italy) and used without further
purification. H3BO3, NaOH, K2HPO4, and KH2PO4 (Merck) were used as
received.
All measurements were carried out in aqueous 0.1 M KCl buffered at
pH 7.5 with a 4 � 10�3 M phosphate buffer and at pH 9.5 with a 4 � 10�3
Mborate buffer. Usewasmade of a home-madeHMDE, described elsewhere
(15). A home-made glass capillary with a finely tapered tip, ~1 mm in outer
diameter, was employed. Capillary andmercury reservoir were thermostated
at 255 0.1�C in a water-jacketed box to avoid any changes in drop area due
to a change in temperature. Lipid monolayers were self-assembled on
mercury as described earlier (10,11). Briefly, lipidmixtures in pentane, either
with or without UQ, were spread on the surface of the working 0.1 M KCl
aqueous solution and the pentane was allowed to evaporate. The HMDE
was then immersed slowly in the solution across the lipid film, under the
control of an oleodynamic system.
This procedure gives rise to a self-assembled lipid monolayer, with the
hydrocarbon tails directed toward the hydrophobic mercury surface. In
particular, a lipid solution in pentane without UQ was spread on the
working solution surface. After pentane evaporation, the quality of the
self-assembled lipid monolayer was tested by measuring its differential
capacitance by AC voltammetry over the potential range from –0.150 V
to –0.750 V and by then recording a CV. An additional aliquot of lipid in
pentane, containing an amount of UQ such as to yield a final 3 mol %
UQ concentration, was then spread on the working solution surface. The
lack of complete homogenization of UQ in the lipid film causes different
amounts of UQ to be captured by the HMDE upon its immersion in the solu-
tion through the film. This permitted us to verify the effect of different UQ
surface concentrations on the behavior of the resulting CVs. In a number of
selected cases, lipid solutions in pentane containing a well-defined mole
fraction of UQ were prepared and spread on the surface of a lipid-free
working solution, to confirm the results obtained by the procedure adopting
3 mol % UQ.
Cyclic voltammetric measurements were carried out with an Autolab
instrument PGSTAT12 (Echo Chemie, Utrecht, The Netherlands) supplied
with an FRA2 module for impedance measurements, scanner generator
ScanGen, and GPES 4.9007 software. Potentials were measured versus
a AgjAgCl electrode immersed in the 0.1 M KCl working solution, but
are referred to a saturated calomel electrode (SCE). Cyclic voltammetric
measurements were carried in the staircase mode, which diminishes the
capacitive current in the same manner as pulse voltammetry. CVs were
recorded after scanning the potential back and forth over the chosen
potential range a number of times (usually three or four) high enough to
attain stabilization. Electrochemical impedance spectra of mercury-
supported lipid monolayers were not affected by the addition of 3 mol %
UQ over the accessible potential range, within the limits of experimental
accuracy.
RESULTS
The cyclic voltammetric behavior of the UQ/UQH2 redoxsystem was investigated at pH 9.5 in DOPC/PSM lipidmixtures of compositions varying from pure DOPC to
Biophysical Journal 101(1) 134–143
136 Becucci et al.
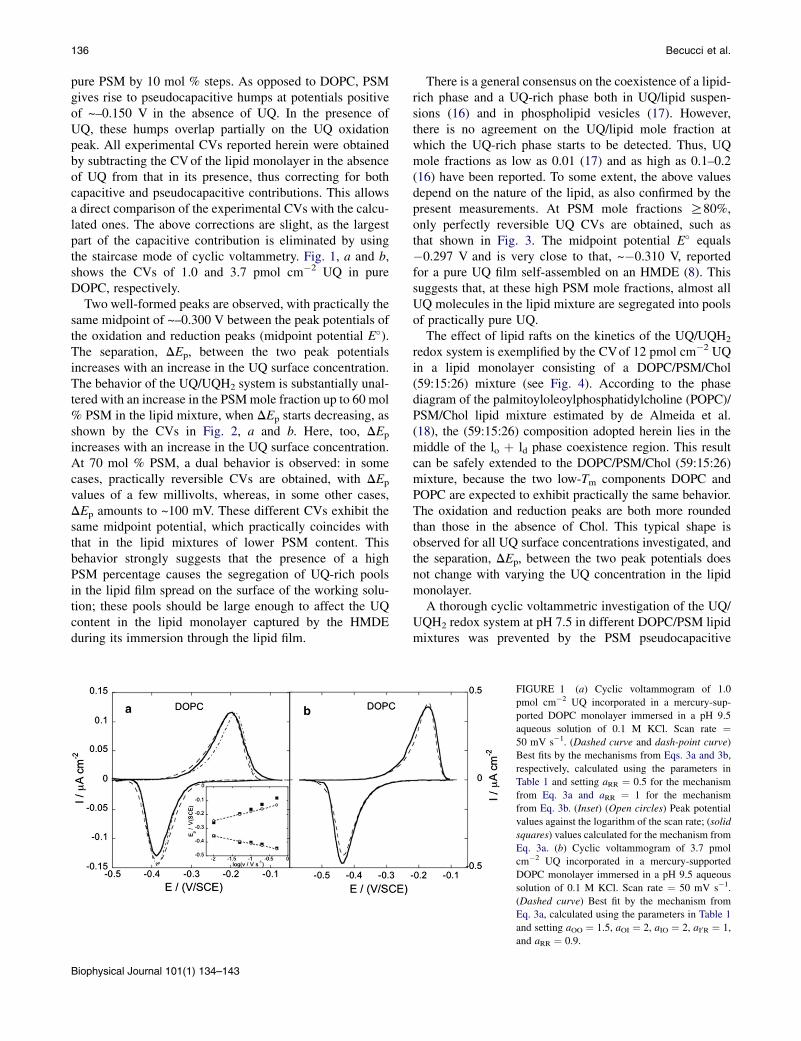
pure PSM by 10 mol % steps. As opposed to DOPC, PSMgives rise to pseudocapacitive humps at potentials positiveof ~–0.150 V in the absence of UQ. In the presence ofUQ, these humps overlap partially on the UQ oxidationpeak. All experimental CVs reported herein were obtainedby subtracting the CVof the lipid monolayer in the absenceof UQ from that in its presence, thus correcting for bothcapacitive and pseudocapacitive contributions. This allowsa direct comparison of the experimental CVs with the calcu-lated ones. The above corrections are slight, as the largestpart of the capacitive contribution is eliminated by usingthe staircase mode of cyclic voltammetry. Fig. 1, a and b,shows the CVs of 1.0 and 3.7 pmol cm�2 UQ in pureDOPC, respectively.
Two well-formed peaks are observed, with practically thesame midpoint of ~–0.300 V between the peak potentials ofthe oxidation and reduction peaks (midpoint potential E�).The separation, DEp, between the two peak potentialsincreases with an increase in the UQ surface concentration.The behavior of the UQ/UQH2 system is substantially unal-tered with an increase in the PSMmole fraction up to 60 mol% PSM in the lipid mixture, when DEp starts decreasing, asshown by the CVs in Fig. 2, a and b. Here, too, DEp
increases with an increase in the UQ surface concentration.At 70 mol % PSM, a dual behavior is observed: in somecases, practically reversible CVs are obtained, with DEp
values of a few millivolts, whereas, in some other cases,DEp amounts to ~100 mV. These different CVs exhibit thesame midpoint potential, which practically coincides withthat in the lipid mixtures of lower PSM content. Thisbehavior strongly suggests that the presence of a highPSM percentage causes the segregation of UQ-rich poolsin the lipid film spread on the surface of the working solu-tion; these pools should be large enough to affect the UQcontent in the lipid monolayer captured by the HMDEduring its immersion through the lipid film.
Biophysical Journal 101(1) 134–143
There is a general consensus on the coexistence of a lipid-rich phase and a UQ-rich phase both in UQ/lipid suspen-sions (16) and in phospholipid vesicles (17). However,there is no agreement on the UQ/lipid mole fraction atwhich the UQ-rich phase starts to be detected. Thus, UQmole fractions as low as 0.01 (17) and as high as 0.1–0.2(16) have been reported. To some extent, the above valuesdepend on the nature of the lipid, as also confirmed by thepresent measurements. At PSM mole fractions R80%,only perfectly reversible UQ CVs are obtained, such asthat shown in Fig. 3. The midpoint potential E� equals�0.297 V and is very close to that, ~�0.310 V, reportedfor a pure UQ film self-assembled on an HMDE (8). Thissuggests that, at these high PSM mole fractions, almost allUQ molecules in the lipid mixture are segregated into poolsof practically pure UQ.
The effect of lipid rafts on the kinetics of the UQ/UQH2
redox system is exemplified by the CVof 12 pmol cm�2 UQin a lipid monolayer consisting of a DOPC/PSM/Chol(59:15:26) mixture (see Fig. 4). According to the phasediagram of the palmitoyloleoylphosphatidylcholine (POPC)/PSM/Chol lipid mixture estimated by de Almeida et al.(18), the (59:15:26) composition adopted herein lies in themiddle of the lo þ ld phase coexistence region. This resultcan be safely extended to the DOPC/PSM/Chol (59:15:26)mixture, because the two low-Tm components DOPC andPOPC are expected to exhibit practically the same behavior.The oxidation and reduction peaks are both more roundedthan those in the absence of Chol. This typical shape isobserved for all UQ surface concentrations investigated, andthe separation, DEp, between the two peak potentials doesnot change with varying the UQ concentration in the lipidmonolayer.
A thorough cyclic voltammetric investigation of the UQ/UQH2 redox system at pH 7.5 in different DOPC/PSM lipidmixtures was prevented by the PSM pseudocapacitive
FIGURE 1 (a) Cyclic voltammogram of 1.0
pmol cm�2 UQ incorporated in a mercury-sup-
ported DOPC monolayer immersed in a pH 9.5
aqueous solution of 0.1 M KCl. Scan rate ¼50 mV s�1. (Dashed curve and dash-point curve)
Best fits by the mechanisms from Eqs. 3a and 3b,
respectively, calculated using the parameters in
Table 1 and setting aRR ¼ 0.5 for the mechanism
from Eq. 3a and aRR ¼ 1 for the mechanism
from Eq. 3b. (Inset) (Open circles) Peak potential
values against the logarithm of the scan rate; (solid
squares) values calculated for the mechanism from
Eq. 3a. (b) Cyclic voltammogram of 3.7 pmol
cm�2 UQ incorporated in a mercury-supported
DOPC monolayer immersed in a pH 9.5 aqueous
solution of 0.1 M KCl. Scan rate ¼ 50 mV s�1.
(Dashed curve) Best fit by the mechanism from
Eq. 3a, calculated using the parameters in Table 1
in a mercury-supported DOPC/PSM (40:60) monolayer immersed in a
pH 9.5 aqueous solution of 0.1 M KCl. Scan rate ¼ 50 mV s�1. (Dashed
curve) Best fit by the mechanism from Eq. 3a, calculated using the param-
eters in Table 1, except for k0s¼ k00s¼ 15 s�1, and setting aIO¼ 1 and aRR¼0.5. (b) Cyclic voltammogram of 3.2 pmol cm�2 UQ incorporated in a
mercury-supported DOPC/PSM (40:60) monolayer immersed in a pH 9.5
aqueous solution of 0.1 M KCl. Scan rate ¼ 50 mV s�1. (Dashed curve)
Best fit by the mechanism from Eq. 3a, calculated using the parameters
in Table 1, except for k0s ¼ k00s¼ ¼ 18 s�1, and setting aOO ¼ 1.5, aOI ¼1.5, aIO ¼ 2, aI0R ¼ 1, and aRR ¼ 1.
Ubiquinone-10 in Lipid Mixtures 137
humps, which overlap completely on the UQ oxidationpeak. In fact, at this pH, the midpoint potential E� shiftsby ~120 mV in the positive direction. Only the cyclic vol-tammetric behavior of UQ in pure DOPC and in purePSM was investigated. The reproducibility of the CVs atpH 7.5 is less than that at pH 9.5. On the whole, no cleartendency to an increase in the separation DEp between theoxidation and reduction peaks with an increase in UQconcentration was observed. A typical CV in pure DOPCat pH 7.5 is shown in Fig. 5. The CV in pure PSM is identicalwith that at pH 9.5 (see Fig. 3), apart from a positive shift ofthe peak potentials by 116 mV.
FIGURE 3 Cyclic voltammogram of 2.1 pmol cm�2 UQ incorporated in
a mercury-supported PSM monolayer immersed in a pH 9.5 aqueous solu-
tion of 0.1 M KCl. Scan rate¼ 50 mV s�1. (Dashed curve) Fit by the mech-
anism from Eq. 3a, calculated using the equilibrium parameters E0UQ=UQ�� ,
E0UQH�þ
2=UQH2
, pK3, and pK4 in Table 1 and ignoring lateral interactions.
In all lipid environments yielding irreversible UQ CVs,peak potentials vary linearly with the logarithm of thescan rate, as expected for irreversible electrode reactionsin the adsorbed state. This behavior is exemplified in theinset of Fig. 1 a, which refers to the CV of 1 pmol cm�2
UQ in pure DOPC.
DISCUSSION
The thermodynamic parameters of the UQ/UQH2 system inUQ films adsorbed on electrodes are somewhat uncertain.
FIGURE 5 Cyclic voltammogram of 1.4 pmol cm�2 UQ incorporated in
a mercury-supported DOPCmonolayer immersed in a pH 7.5 aqueous solu-
tion of 0.1 M KCl. Scan rate ¼ 50 mV s�1. (Dashed curve) Best fit by the
mechanism from Eq. 3a, calculated using the parameters in Table 1 and
setting aOO ¼ 1.1 and aRR ¼ 1.
Biophysical Journal 101(1) 134–143
138 Becucci et al.
The most reliable data are those obtained from plots of theformal potential, E0
UQ=UQH2, against pH. Monitored with
a thin mercury film electrode, the plots provided by UQfilms that either self-assembled on a HMDE (8) or spreadat the air/water interface (19), show two break pointsascribed to the passage from the UQ/UQH2 to the UQ/UQH� couple and from this to the UQ/UQ2� couple. ThepH values at the two break points yield directly the constantsfor the two consecutive deprotonation equilibria:
K1 ¼ �UQH���Hþ�=½UQH2�;
K2 ¼ �UQ2���Hþ�=�UQH��: (1)
Extrapolation of the linear section of the E0UQ=UQH2
versus pHplot with �60 mV/decade slope to pH ¼ 0 yields the formalpotential, E0;pH0
UQ=UQH2at unitary proton activity, whereas the
short horizontal section of the plot at the highest pH values
yields the formal potential, E0UQ=UQ2� , of the UQ/UQ2-
couple. Values of pK1, pK2, E0;pH0
UQ=UQH2, and E0
UQ=UQ2� of
12, 13.6, þ0.276 V, and �0.495 V were reported by Gor-dillo and Schiffrin (8), and of 13, 13.5, þ0.260 V, and�0.550 V by Sek and Bilewicz (19).
The other thermodynamic parameters reported in theliterature are less reliable. Gordillo and Schiffrin (8) esti-mated the formal potential, E0
Q=Q�� , of the UQ/UQ�� couple
upon ascribing the broadening of the UQ voltammetric peakat high pH values with respect to the reversible behavior tothe closeness of the formal potentials of the two consecutiveone-electron transfer reactions. This yields a E0
Q=Q�� value of–0.483 V. However, as also admitted by these authors, thisbroadening might also be due to lateral interactions betweenreaction partners. Adsorption of UQ on carbon electrodesseems to stabilize the semiubiquinone form over a relativelybroad pH range (6,7). From the resulting CVs, the formalpotential, E0
UQH�=UQH� , of the UQH�/UQH� couple was esti-
mated at –0.380 V by Ksenzhek et al. (6), and at –0.035 Vby Schrebler et al. (7). The latter authors also reporteda E0
Q=Q�� value of –0.170 Vand a pK1 value of 3.4. The lattervalue contrasts with the pK1 values, ranging from 10 to 12,reported in the literature for different p-benzoquinones (12).The pK3 value for the deprotonation constant of UQH�,
K3 ¼ �UQ����Hþ�=½UQH��; (2)
was estimated at 7.5 by Schrebler et al. (7) for a UQ filmadsorbed on pyrolytic graphite.
A detailed fitting of experimental CVs allowed us todiscriminate between two different electrode reaction mech-anisms, while extracting at the same time a whole set ofkinetic and thermodynamic parameters of the UQ/UQH2
redox couple in different membrane environments. No a pri-ori use of thermodynamic parameters available in the liter-ature was required for such a fitting.
After Eq. 3, two alternative reaction pathways wereconsidered:
Biophysical Journal 101(1) 134–143
UQþ e/k0s
UQ��; UQ�� þ Hþ/k1;f
k1;bUQH�: (3)
)
k2;fk00
UQH� þ Hþ/
)k2;b
UQH�þ2 ; UQH�þ
2 þ e/s
UQH2; (3a)
k00k2;f
UQH� þ e/s
UQH�; UQH� þ Hþ/
)k2;b
UQH2: (3b)
Lateral interaction factors between the different speciesinvolved in the two consecutive electron transfer steps wereincluded in the Butler-Volmer kinetic equations for thesesteps (see theAppendix).Under equilibriumconditions, theseequations are compatible with Frumkin adsorption isotherms(20). The interaction factors aOO, aOI, aIO, aII, aI0I0, aI0R, aRI0,and aRR measure lateral interactions between different pairsof species, where O, I, and R denote UQ, UQ��, and UQH2,and the second intermediate I0 denotes UQH2
�þ for themech-anism fromEq. 3a andUQH� for themechanism fromEq. 3b.These dimensionless Frumkin interaction factors are positiveif attractive and negative if repulsive.
In a preliminary data analysis, mechanisms from Eqs. 3aand 3b included the 2UQH� 4 UQ þ UQH2 disproportion-ation step, and the mechanism from Eq. 3a also included theadditional UQ�� þUQH2
�þ4UQþUQH2 disproportion-ation step. However, these disproportionations cause theoxidation and reduction peaks to come too close to each otherand to become particularly acute. Therefore, their inclusiondid not fit the experimental CVs and was disregarded.
The UQ/UQH2 system in pure DOPC
The CVs recorded at low UQ surface concentrations in pureDOPC are satisfactorily fitted by both mechanisms, asshown in Fig. 1 a. The parameters employed for the fittingare summarized in Table 1, where K4 denotes the deprotona-tion equilibrium involved in the mechanism from Eq. 3a:
K4 ¼ ½UQH���Hþ�=�UQH�þ2
�: (4)
The best fit to the CV in Fig. 1 a requires an attractive inter-action factor aRR ¼ 0.5 for the mechanism from Eq. 3a andaRR ¼ 1 for the mechanism from Eq. 3b, with all other inter-action factors being equal to zero. It should be noted that theshape of the calculated CVs depends critically upon thevalues of the parameters employed, and could hardly be pre-dicted with a different set of values.
Attractive interaction factors between molecules of thesame species cause the peaks to become more acute andto move away from the formal potential of the correspond-ing redox couple. Considering, as an example, the oxidationpeak, a positive (i.e., attractive) aRR interaction tends todisfavor R electrooxidation. When the incipient consump-tion of R starts to decrease the influence of this attractive
TABLE 1 Thermodynamic and kinetic parameters resulting from the fitting of the cyclic voltammogram in Fig. 1 a by the
interaction, the overpotential has already attained a valuepositive enough to cause an abrupt R electrooxidation,giving rise to a sharp oxidation peak. Conversely, an attrac-tive interaction factor between two molecules with differentoxidation states causes the peaks to become broader andflatter.
To understand this behavior, we may consider, as anexample, an attractive aI0R interaction factor. Clearly, itseffect is a maximum in the presence of a maximum differ-ence between the surface concentrations, of I0 and R.When [I0] and [R] are different, aI0R tends to increase thelower concentration at the expense of the higher one. There-fore, at potentials negative of the oxidation peak potential,where [R] is > [I0], R oxidation is favored by its interactionwith the resulting oxidation product I0. Conversely, at poten-tials positive of the oxidation peak potential, where [I0]is>[R], R’s further oxidation is disfavored by its interactionwith I0. Both effects cause a flattening and broadening of theoxidation peak. In practice, the effect of the small aRR valuein the fitting to the CV in Fig. 1 a, relative to a low UQconcentration, is modest.
It can be seen that the forward and backward rateconstants for the second protonation step are identical forthe mechanisms from Eqs. 3a and 3b, and that the formal
potentials, E0UQH�þ
2=UQH2
and E0UQH�=UQH� , for the second
electron transfer step in the two different mechanisms arevery close. The pK3 value of 7.8 is close to the value, 7.5,reported for UQ adsorbed on pyrolytic graphite (7). Itshould be noted that the forward and backward rateconstants for the two consecutive protonation steps in Table1 are just the minimum values allowing the best fit. They canall be increased by orders of magnitude while still obtainingthe same fit, provided the k1,b/k1,f ¼ K3 and k2,b/k2,f ¼ K4¼K1 ratios are kept constant. This implies that, under thepresent experimental conditions, the two protonation stepsare in quasiequilibrium, and that the rate-determining stepis any of the two electron transfer steps. The solid squaresin the inset of Fig. 1 a are peak potential values obtainedfrom the UQ CVs in pure DOPC calculated according tothe mechanism from Eq. 3a. Agreement is satisfactory, apartfrom a larger shift of the calculated oxidation peak potentialat the higher scan rates.
If we consider that the pK1 value estimated from theE0UQ=UQH2
versus pH plot is approximately equal to 12 and
that even many other p-benzoquinones have values of ~10(12), the mechanism from Eq. 3a is to be definitely preferredto the mechanism from Eq. 3b. Thus, if we equate pK1 to 12rather than to the 9.02 value providing the best fit accordingto the mechanism from Eq. 3b, then the oxidation peak isshifted by ~0.260 V in the positive direction whereas thereduction peak is practically unaltered, no matter the valuesascribed to k2,f and to k2,b¼ 10�12k2,f. This is due to the highpositive potential that would be required if the first step inthe positive potential scan were UQH2 deprotonation, asassumed by the mechanism from Eq. 3b. Because theseparation between the oxidation and reduction peak inthe experimental CV amounts to ~200 mV, it becomesimpossible to fit it using such a high pK1 value. Moreover,the typical UQ CV in pure DOPC at pH 7.5 in Fig. 5 canbe readily fitted by the mechanism from Eq. 3a upon settingaOO¼ 1.1 and aRR¼ 1, while leaving all other parameters inTable 1 unaltered, as shown by the dashed curve in Fig. 5.No satisfactory fitting was possible with the mechanismfrom Eq. 3b. Consequently, in what follows only the mech-anism from Eq. 3a will be retained. A straightforwardcombination of the thermodynamic parameters in Table 1
yields a E0;pH0
UQ=UQH2value of þ0.232 V, in fairly good agree-
ment with literature values, which range from þ0.248 Vto þ0.276 V (8).
The increase in the separation between the oxidation andreduction peak as observed with an increase in the UQsurface concentration can be explained by an increase inattractive lateral interactions. The fitting of the mechanismfrom Eq. 3a to the CV of 3.7 pmol cm�2 UQ in pureDOPC (Fig. 1 b) requires the positive interaction factorsaO ¼ 1.5, aOI ¼ 2, aIO ¼ 2, aI0R ¼ 1, and aRR ¼ 0.9, in addi-tion to all the thermodynamic and kinetic parameterssummarized in Table 1. During the positive and negativepotential scans, the calculated surface concentrations ofthe intermediate species UQH� and UQH2
�þ (i.e., I0) arevanishingly small with respect to those of UQ (O), UQ��
(I), and UQH2 (R). This is shown in Fig. 6, where themole fractions of the different species are plotted againstthe applied potential. For clarity, the mole fractions alongthe negative potential scan are conventionally ascribednegative values and are reported on the lower half-plane,whereas those along the positive potential scan are reportedon the upper half-plane. This explains, e.g., why UQH2
�þ
Biophysical Journal 101(1) 134–143
FIGURE 6 Calculated CV identical with that in Fig. 1 b (solid curve) and
mol % of UQ (dashed curve), UQ�� (dash-point curve), and UQH2 (dash-3
points curve) against the applied potential.
140 Becucci et al.
electroreduction is not affected by UQH2�þ-UQH2
�þ inter-actions, but only by UQH2
�þ-UQH2 interactions. Asa whole, lateral hetero-pair interactions are more attractivethan the homo-pair ones.
The UQ/UQH2 system in DOPC/PSM mixtures
The behavior of the UQ/UQH2 system in DOPC/PSMmixtures remains practically unaltered up to a (40:60) molarratio, when the separation between the oxidation and reduc-tion peaks starts decreasing. At low UQ surface concentra-tions, the UQ CV at this molar ratio can be satisfactorilyfitted using the parameters in Table 1, apart from the rateconstants k0s and k00s for the two electron-transfer steps,which increase from 5 to 15 s�1, as shown in Fig. 2 a. More-over, a minimum of nonzero lateral interaction factors isrequired for the fitting. As in the case of the higher DOPC/PSM molar ratios, an increase in the UQ surface concentra-tion induces an increase in the separation between the twopeaks, as shown by the CV in Fig. 2 b. This can be fitted bythe same kinetic parameters adopted for the lower UQconcentration and by attractive lateral interaction factorsclose to those adopted in Fig. 1 b for the higher UQ concen-tration in pure DOPC. In the DOPC/PSM (30:70) mixture,the UQ/UQH2 system exhibits a dual behavior. Finally, inDOPC/PSM mixtures of molar ratios % (20:80), the UQCVat 50 mV/s scan rate is completely reversible and practi-cally identical to that obtained with a pure UQ film self-assembled on mercury (8). The experimental UQ CV inpure PSM of Fig. 3 is compared with that calculated uponassuming all protonation and electron-transfer steps of themechanism from Eq. 3a in quasiequilibrium and using theequilibrium constants in Table 1. The experimental peaksare slightly narrower than the calculated ones, indicatingsome attractive lateral interactions.
Biophysical Journal 101(1) 134–143
The behavior of the UQ/UQH2 system in DOPC/PSMmixtures can be explained in light of the phase transitionsthat take place with varying the mixture composition.Both fluorescence microscopy measurements in giant vesi-cles (18) and differential capacity measurements in Hg-sup-ported lipid monolayers (9) indicate that a transition fromthe ld phase to a mixture of ld and so phases takes placeat ~30 mol % PSM. Finally, a transition from the ld þ sophase coexistence region to the so phase occurs at 60–65 mol % PSM. The fact that the UQ redox behavior isinsensitive to the ld to ld þ so phase transition indicatesthat the UQ molecules are located well inside the ld matrix,as long as it is present. When the ld matrix is about to disap-pear, UQ molecules still tend to intercalate into regionsricher in DOPC with respect to the average composition.The high PSM content increases the electron transfer rates.Finally, as the PSM mole fraction becomes R80%, the UQmolecules tend to segregate forming large pools of almostpure UQ; this explains the obtainment of reversible CVspractically identical with those provided by a pure UQmonolayer self-assembled on mercury (8).
The UQ/UQH2 system in DOPC/PSM/Cholmixtures
The membrane environment provided by the DOPC/PSM/Chol (59:15:26) mixture, consisting exclusively of lipidrafts immersed in an ld matrix, causes an appreciable changein the behavior of UQ CVs. The oxidation and reductionpeaks are both broad and rounded, and their shape andpeak separation do not change with an increase in the UQsurface concentration. The CVs are satisfactorily fitted bythe same forward and backward protonation rate constantsin Table 1, but with slightly lower electron transfer rateconstants (k0s ¼ 0.7 s�1; k00s ¼ 3 s�1), as shown in Fig. 4.Most importantly, the fitting requires exclusively the useof the two attractive hetero-pair interaction factors aIO andaI0R. This suggests that the presence of Chol imposesa higher order upon the UQ molecules.
In this connection, it should be noted that the Frumkininteraction factors are based on the use of the random mix-ing approximation, which amounts to assuming that thevarious particles are distributed randomly among theadsorption sites. Differently stated, the presence of a particleat a given site is not considered to favor the occupation ofnearest-neighbor sites by particles that interact with itmore attractively over the others. Conversely, in an orderedarray of molecules, a given species is expected to favor theoccupation of nearest-neighbor sites by species that interactwith it more attractively. Let us consider, as an example, UQelectroreduction during the negative potential scan, in viewof the observation that, in the absence of Chol, hetero-pairinteractions are more attractive than homo-pair ones. Atsufficiently positive potentials, UQ molecules are exclu-sively surrounded by identical UQ molecules. As the first
Ubiquinone-10 in Lipid Mixtures 141
UQ molecule is electroreduced to UQ��, the next UQ mole-cule will not be reduced at a nearest-neighbor site, but it willdo so at a site still completely surrounded by UQ molecules.By following this trend, dictated by local order, a maximumof UQ-UQ�� pairs will be attained in the proximity of themaximum of the reduction peak. In the framework of therandom mixing approximation, this behavior is interpretedas though the attractive hetero-pair interaction factor aIOdecidedly prevailed over the homo-pair interaction factoraOO.
In a previous work we showed that the edges of lipid raftsact as docking sites for the molecules of the dioctadecylvio-logen(II)/dioctadecylviologen(I) (DODV2þ/DODVþ) redoxsystem incorporated in the same Hg-supported lipid mixture(14). It is reasonable to postulate an analogous tendency ofthe UQ molecules to form a quasi-two-dimensional latticealong the edge of lipid rafts. It should also be noted that thefitting to the UQ CVs in the DOPC/PSM/Chol (59:15:26)mixture requires attractive hetero-pair interactions even atlow UQ surface concentrations, in contrast with the lackof appreciable lateral interactions in the absence of Chol.This explains why the peak potentials of the oxidation andreduction peaks remain substantially unaltered with anincrease in the UQ surface concentration, as opposed to thebehavior in the DOPC/PSM binary mixtures. This points toan ordering effect induced by lipid rafts even at low UQsurface concentrations. Molecules that specifically bind atthe boundary interface between the different lipid domains,thereby modifying the boundary properties while leavingthe bulk regions unaltered, are supposed to reduce the linetension (or energetic cost) of the one-dimensional boundaryinterface. For these molecules the name ‘‘linactants’’ hasbeen coined, in analogy with surfactants, which modify thesurface tension at an oil/water interface (21).
To gather further evidence in favor of the above explana-tion for the typical behavior of the CV in Fig. 4, the UQ/UQH2 system was examined in DOPC/PSM/Chol mixturesconsisting of 20 mol % Chol and different DOPC/PSMmolar ratios. According to the phase diagram of thePOPC/PSM/Chol lipid mixture (18), at 20 mol % Chol thetransition from the ld þ lo to the ld þ lo þ so phase coexis-tence region occurs at ~35 mol % PSM, whereas the transi-tion from the ld þ lo þ so to the lo þ so phase coexistenceregion occurs at ~55 mol % PSM. The UQ CVs recordedin DOPC/PSM/Chol mixtures containing 10, 20, and30 mol % PSM exhibit the same behavior as the CV inFig. 4, obtained in a lipid mixture lying in the middle ofthe ld þ lo phase coexistence region. In particular, thepeak potentials do not change with an increase in the UQsurface concentration. The tertiary mixture containing40 mol % PSM, which lies at the boundary between theld þ lo and the ld þ lo þ so phase coexistence regions, yieldsCVs exhibiting more acute peaks and an increase in DEp
with an increase in the UQ surface concentration (data notshown). At 50 mol % PSM, in the proximity of the transition
from the ld þ lo þ so to the lo þ so phase coexistence region,the CVs show a dual behavior similar to that observed in theDOPC/PSM (30:70) binary mixture. Finally, at 60 and70 mol % PSM, the CVs show an almost reversiblebehavior, with DEp values of ~15 mV. As a whole, theseresults indicate that local order of the UQ molecules occursat the edge of lo microdomains surrounded by an ld matrix,but not at the boundary between lo and so microdomains.
Location of the redox center of UQ molecules
At pH 9.5, the midpoint potential in all DOPC/PSM andDOPC/PSM/Chol mixtures lies at ~–0.300 V, which isalso the common peak potential of the two reversible vol-tammetric peaks of UQ in pure PSM. This behaviorcontrasts with that of the DODV2þ/DODVþ system inmercury-supported DOPC/PSM mixtures (14). Thus, themidpoint potential of the DODV2þ/DODVþ redox pairshifts linearly toward negative values with an increase inthe PSM mole fraction, decreasing by 200 mV in passingfrom pure DOPC to pure PSM. This decrease runs in parallelwith the decrease in the positive surface dipole potential clocated in the polar heads of the DOPC/PSM mixtures.The surface dipole potential of pure DOPC, as estimatedat DOPC-coated mercury from chronocoulometric measure-ments of the metal charge density during mercury dropexpansion (22), amounts toþ1455 10 mV, positive towardthe metal. Conversely, the c-value for a PSM monolayer ispractically equal to zero (14). It is generally accepted thatthe surface dipole potential of phosphoglycerides residesin the ester linkages to the glycerol backbone, which areclearly absent in sphingolipids such as PSM. This negativeshift in the midpoint potential was justified by assumingthat the potential difference across which electron transfertakes place is less than the potential difference across thewhole lipid bilayer by an amount equal to c. This amountsto assuming that the potential energy barrier for electrontransfer to DODV2þ extends over the whole length of thehydrocarbon tail region, with the exclusion of the polarhead region.
The midpoint potential of the UQ/UQH2 redox pair beingconstant in all DOPC/PSM and DOPC/PSM/Chol mixturesindicates that the redox center of the UQmolecules is locatedon the solution side with respect to the ester linkages tothe glycerol backbone of DOPC. This conclusion contrastswith Gordillo and Schiffrin’s suggestion (8) that the redoxcenter of the UQ molecules is buried in the hydrocarbontail region of Hg-supported DOPCmonolayers. Several indi-rect physical methods, such as fluorescence spectroscopy,electron-spin resonance, and nuclear magnetic resonancehave been used to localize UQ within lipid bilayers, yieldingcontradictory results. Some researchers have concludedthat UQ lies in the center of lipid bilayers (16,23), whereassome others have provided evidence in favor of the quinonemoiety being located in the polar head region (24). The long
Biophysical Journal 101(1) 134–143
142 Becucci et al.
polyisoprenoid chain of UQ is often thought to be located inthe center of the lipid bilayer of a biomembrane. However,the chain has sufficient flexibility to allow the benzoquinonegroup to penetrate to the aqueous interface.
CONCLUSION
1. A detailed analysis of UQ CVs in a lipid-coated mercuryelectrode over the pH range from 7.5 to 9.5 points toa mechanism consisting of an elementary electron trans-fer step followed by two protonation (or deprotonation)steps in quasiequilibrium and by a further electron trans-fer step.
2. In a lipid environment of so microdomains in a ld matrix,electron transport across the lipid monolayer takes placein the ld phase. In a pure so phase, UQ tends to segregateinto UQ-rich pools, exhibiting reversible electron trans-fer steps.
3. In a lipid environment consisting of lo microdomains(lipid rafts) in a ld matrix, UQ molecules tend to localizealong the edge of the lipid rafts. However, in a lipid envi-ronment consisting exclusively of lo and so microdo-mains, UQ molecules tend to segregate.
4. In all lipid environments, electron transport by UQ occurswith the quinone moiety localized on the solution sidewith respect to the ester linkages of the DOPCmolecules.
APPENDIX
The constancy of the number of UQ molecules present in the lipid matrix is
expressed by the equation
½UQ� þ �UQ���þ ½UQH�� þ �
UQH�þ2
�þ ½UQH2� ¼ G;
(A1)
where G is the overall UQ concentration. To simplify notation, let us set
h1 ¼ exphF�E� E0
UQ=UQ��
�.RT
i;
h2 ¼ exphF�E� E0
UQH�þ2
=UQH2
�.RT
i:
(A2)
qOh½UQ�=G; qIh�UQ����G; qINh½UQH��=G;
qI0h�UQH�þ
2
��G; qRh½UQH2�=G:
(A3)
Taking into account that the scan rate v is equal to –dE/dt, the kinetic equa-
tions for UQ electroreduction are
�dqO=dt ¼ vdqO=dE
¼ k0s�h�a1 expð � 2aOOqO � 2aOIqIÞqO
� h1�a1 expð � 2aIOqO � 2aIIqIÞqI
�; (A4)
�dqIN=dt ¼ vdqIN=dE
¼ k1;b qIN � k1;f�Hþ�qI þ k2;f
�Hþ�qIN � k2;b qI0 ;
(A5)
Biophysical Journal 101(1) 134–143
�dqI0=dt ¼ vdqI0=dE
¼ k00s�h�a2 expð � 2aI0I0qI0 � 2aI0RqRÞqI0
� h1�a2 expð � 2aRRqR � 2aRI0qI0 ÞqR
�þ k2;bqI0
� k2;f�Hþ�qIN;
(A6)
�dqR=dt ¼ vdqR=dE
¼ k00s�h1�a2 expð � 2aRRqR � 2aRI0qI0 ÞqR
� h�a2 expð � 2aI0I0qI0 � 2aI0RqRÞqI0
�: (A7)
Here, aOO, aOI, aIO, aII, aI0I0, aI0R, aRI0, and aRR are interaction factors that
measure lateral interactions between different pairs of species, where O,
I, and R denote UQ, UQ��, and UQH2, and the second intermediate I0
denotes UQH2�þ. Proceeding toward electroreduction, k0s and k00s are the
forward rate constants for the first and second electron-transfer step, respec-
tively, and a is the charge-transfer coefficient, assumed to be the same for
both steps; k1,f and k1,b are the forward and backward rate constants for the
first protonation step, whereas k2,f and k2,b are those for the second proton-
ation step (see Eq. 3a).
In view of Eqs. A4 and A7, the current density I is given by
I=ð2FGÞ ¼ dqO=dt � dqR=dt: (A8)
The five equations A1 and A4–A7 were solved numerically by the fourth-
order Runge-Kutta method with the initial condition qO ¼ 1, starting from
E¼ 0.0 Vand scanning the potential in the negative direction. The potential
was then reversed at a selected final potential and the whole operation was
repeated three times to obtain three consecutive CVs. In all cases the third
CV coincided with the second one. The charge transfer coefficient awas set
equal to 0.5 by assuming symmetric potential energy barriers.
Note that mutatis mutandis, an analogous approach, was used for the
mechanism from Eq. 3b and for both mechanisms from Eqs. 3a and 3b
with the inclusion of the disproportionation reactions.
The financial support by Ente Cassa di Risparmio di Firenze and that by the
Italian Ministero dell’Istruzione, dell’Universita e della Ricerca (MIUR)
through PRIN 20079Y9578, is gratefully acknowledged.
REFERENCES
1. Crane, F. L. 2001. Biochemical functions of coenzyme Q10. J. Am.Coll. Nutr. 20:591–598.
2. De Luca, T., D. M. Morre,., D. J. Morre. 2005. NADþ/NADH and/orCoQ/CoQH2 ratios from plasma membrane electron transport maydetermine ceramide and sphingosine-1-phosphate levels accompanyingG1 arrest and apoptosis. Biofactors. 25:43–60.
3. Morre, D. J., and D. M. Morre. 2004. Plasma membrane electron trans-port. A metabolic process deserving of renewed interest. Biofactors.20:183–187.
4. Niklowitz, P., A. Sonnenschein, ., T. Menke. 2007. Enrichment ofcoenzyme Q10 in plasma and blood cells: defense against oxidativedamage. Int. J. Biol. Sci. 3:257–262.
5. Navas, P., J. M. Villalba, and R. de Cabo. 2007. The importance ofplasma membrane coenzyme Q in aging and stress responses.Mitochondrion. 7 (Suppl ):S34–S40.
6. Ksenzhek, O. S., S. A. Petrova, and M. V. Kolodyazhy. 1982. Redoxproperties of ubiquinones in aqueous solutions. Bioelectrochem.Bioenerg. 9:167–174.
7. Schrebler, R. S., A. Arratia, ., N. Duran. 1990. Electron transport inbiological processes. Electrochemical behavior of ubiquinone Q-10
Ubiquinone-10 in Lipid Mixtures 143
adsorbed on a pyrolytic graphite electrode. Bioelectrochem. Bioenerg.23:81–91.
8. Gordillo, G. J., and D. J. Schiffrin. 1994. Redox properties of ubiqui-
none (UQ10) adsorbed on a mercury electrode. J. Chem. Soc. Faraday
Trans. 90:1913–1922.
9. Becucci, L., S. Martinuzzi, ., R. Guidelli. 2010. Electrochemical
impedance spectroscopy and fluorescence lifetime imaging of lipid
mixtures self-assembled on mercury. Soft Matter. 6:2733–2741.
10. Moncelli, M. R., L. Becucci, ., R. Guidelli. 1996. Electrochemical
modeling of electron and proton transfer to ubiquinone-10 in a self-
assembled phospholipid monolayer. Biophys. J. 70:2716–2726.
11. Moncelli, M. R., R. Herrero,., R. Guidelli. 1998. Kinetics of electron
and proton transfer to ubiquinone-10 and from ubiquinol-10 in a self-
12. Gordillo, G. J., and D. J. Schiffrin. 2000. The electrochemistry of
ubiquinone-10 in a phospholipid model membrane. Faraday Discuss.
116:89–107, Discussion 171–190.
13. Parasassi, T., A. M. Giusti, ., E. Gratton. 1995. Abrupt modifications
of phospholipid bilayer properties at critical cholesterol concentrations.
Biophys. J. 68:1895–1902.
14. Becucci, L., E. Lottini, and R. Guidelli. 2011. Influence of gel-phase
microdomains and lipid rafts in lipid monolayers on the electron trans-
fer of a lipophilic redox probe: dioctadecylviologen. Phys. Chem.
Chem. Phys. 13:3917–3924.
15. Moncelli, M. R., and L. Becucci. 1997. A novel model of the hanging
mercury drop electrode. J. Electroanal. Chem. 433:91–96.
16. Katsikas, H., and P. J. Quinn. 1982. The distribution of ubiquinone-10in phospholipid bilayers. A study using differential scanning calorim-etry. Eur. J. Biochem. 124:165–169.
17. Degli Esposti, M., E. Bertoli, ., G. Lenaz. 1981. Incorporation ofubiquinone homologs into lipid vesicles and mitochondrialmembranes. Arch. Biochem. Biophys. 210:21–32.
18. de Almeida, R. F. M., L. M. S. Loura, ., M. Prieto. 2005. Lipid raftshave different sizes depending on membrane composition: a time-resolved fluorescence resonance energy transfer study. J. Mol. Biol.346:1109–1120.
19. Sek, S., and R. Bilewicz. 1999. Voltammetric probing of molecularassemblies of ubiquinone-10 at the air-water interfaces. J. InclusPhenom. Microcycl. Chem. 35:55–62.
20. Laviron, E., and L. Roullier. 1980. General expression of the linearpotential sweep voltammogram for a surface redox reaction with inter-actions between the adsorbed molecules. J. Electroanal. Chem.115:65–74.
21. Schafer, L. V., and S. J. Marrink. 2010. Partitioning of lipids at domainboundaries in model membranes. Biophys. J. 99:L91–L93.
22. Becucci, L., M. R. Moncelli,., R. Guidelli. 2000. Dipole potentials ofmonolayers of phosphatidylcholine, phosphatidylserine and phospha-tidic acid on mercury. Langmuir. 16:7694–7700.
23. Hauss, T., S. Dante, ., N. A. Dencher. 2005. Localization of coen-zyme Q10 in the center of a deuterated lipid membrane by neutrondiffraction. Biochim. Biophys. Acta. 1710:57–62.
24. Afri, M., B. Ehrenberg, ., A. A. Frimer. 2004. Active oxygen chem-istry within the liposomal bilayer. Part III: locating vitamin E, ubiqui-nol and ubiquinone and their derivatives in the lipid bilayer. Chem.Phys. Lipids. 131:107–121.