Gender difference in pulmonary functions and lung parenchyma measurements: The use of propensity scores Jorge Le´ on Cruz Paula Rivera Torres University of Puerto Rico, Cayey, PR University of Puerto Rico, Humacao, PR July 27, 2011 (ISIB - T15-HL097622-01 NHLBI) The use of propensity scores July 27, 2011 1 / 38
Transcript
Gender difference in pulmonary functions and lungparenchyma measurements:The use of propensity scores
Jorge Leon CruzPaula Rivera Torres
University of Puerto Rico, Cayey, PRUniversity of Puerto Rico, Humacao, PR
July 27, 2011
(ISIB - T15-HL097622-01 NHLBI) The use of propensity scores July 27, 2011 1 / 38
OUTLINE
Talk Outline
Outline
Background
Goal
Method
Data Analysis / Results
Conclusion / Future Work / References
(ISIB - T15-HL097622-01 NHLBI) The use of propensity scores July 27, 2011 2 / 38
OUTLINE
Talk Outline
Outline
Background
Goal
Method
Data Analysis / Results
Conclusion / Future Work / References
(ISIB - T15-HL097622-01 NHLBI) The use of propensity scores July 27, 2011 2 / 38
OUTLINE
Talk Outline
Outline
Background
Goal
Method
Data Analysis / Results
Conclusion / Future Work / References
(ISIB - T15-HL097622-01 NHLBI) The use of propensity scores July 27, 2011 2 / 38
OUTLINE
Talk Outline
Outline
Background
Goal
Method
Data Analysis / Results
Conclusion / Future Work / References
(ISIB - T15-HL097622-01 NHLBI) The use of propensity scores July 27, 2011 2 / 38
OUTLINE
Talk Outline
Outline
Background
Goal
Method
Data Analysis / Results
Conclusion / Future Work / References
(ISIB - T15-HL097622-01 NHLBI) The use of propensity scores July 27, 2011 2 / 38
BACKGROUND
Background
(ISIB - T15-HL097622-01 NHLBI) The use of propensity scores July 27, 2011 3 / 38
BACKGROUND
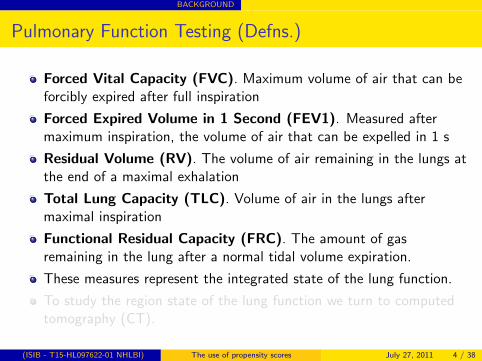
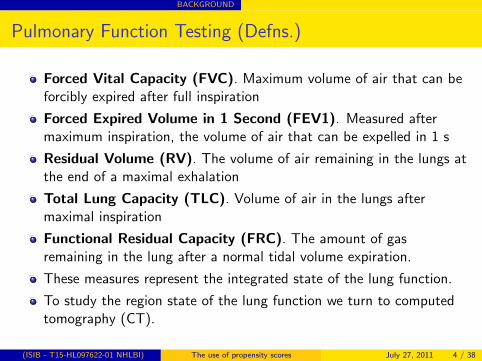
Pulmonary Function Testing (Defns.)
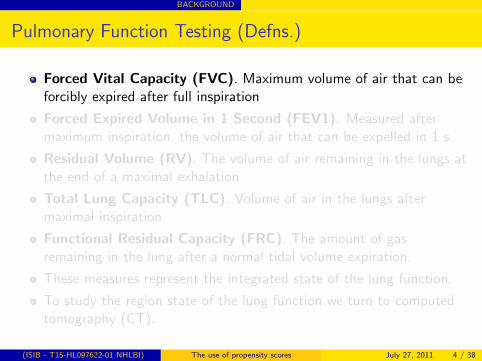
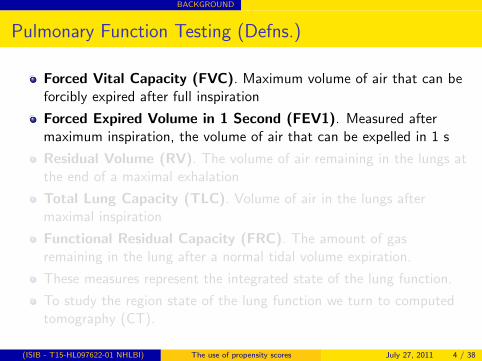
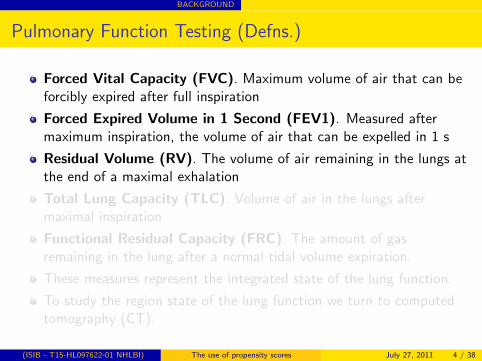
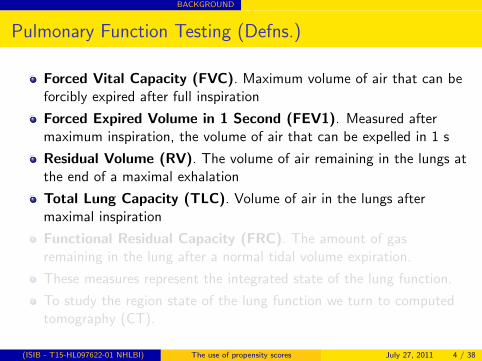
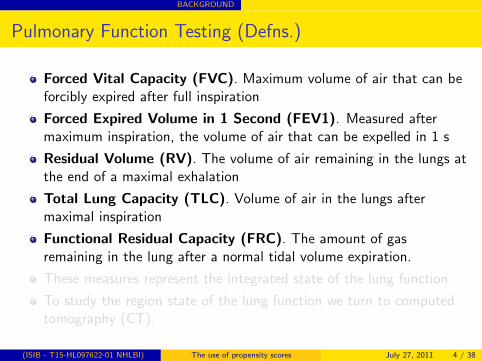
Forced Vital Capacity (FVC). Maximum volume of air that can beforcibly expired after full inspiration
Forced Expired Volume in 1 Second (FEV1). Measured aftermaximum inspiration, the volume of air that can be expelled in 1 s
Residual Volume (RV). The volume of air remaining in the lungs atthe end of a maximal exhalation
Total Lung Capacity (TLC). Volume of air in the lungs aftermaximal inspiration
Functional Residual Capacity (FRC). The amount of gasremaining in the lung after a normal tidal volume expiration.
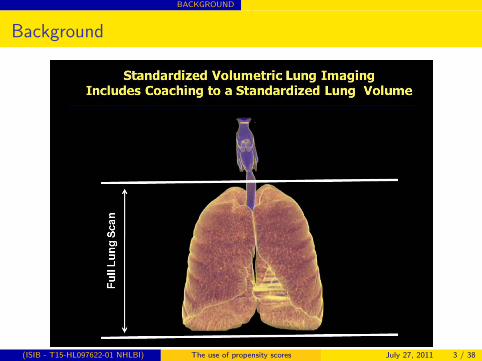
These measures represent the integrated state of the lung function.
To study the region state of the lung function we turn to computedtomography (CT).
(ISIB - T15-HL097622-01 NHLBI) The use of propensity scores July 27, 2011 4 / 38
BACKGROUND
Pulmonary Function Testing (Defns.)
Forced Vital Capacity (FVC). Maximum volume of air that can beforcibly expired after full inspiration
Forced Expired Volume in 1 Second (FEV1). Measured aftermaximum inspiration, the volume of air that can be expelled in 1 s
Residual Volume (RV). The volume of air remaining in the lungs atthe end of a maximal exhalation
Total Lung Capacity (TLC). Volume of air in the lungs aftermaximal inspiration
Functional Residual Capacity (FRC). The amount of gasremaining in the lung after a normal tidal volume expiration.
These measures represent the integrated state of the lung function.
To study the region state of the lung function we turn to computedtomography (CT).
(ISIB - T15-HL097622-01 NHLBI) The use of propensity scores July 27, 2011 4 / 38
BACKGROUND
Lung Parenchyma measurement
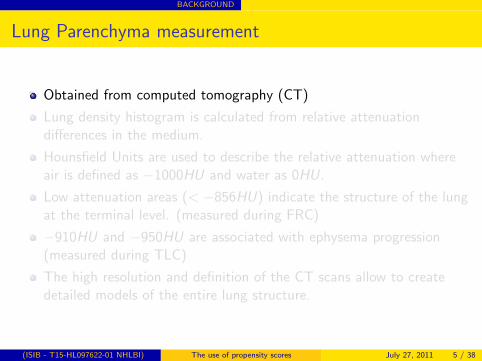
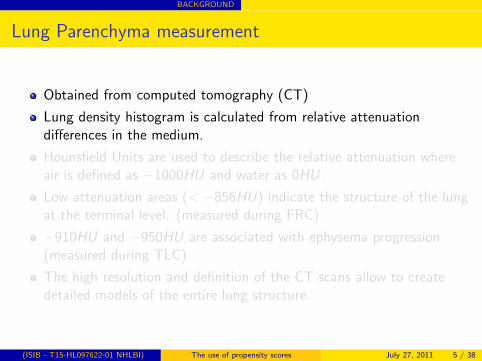
Obtained from computed tomography (CT)
Lung density histogram is calculated from relative attenuationdifferences in the medium.
Hounsfield Units are used to describe the relative attenuation whereair is defined as −1000HU and water as 0HU.
Low attenuation areas (< −856HU) indicate the structure of the lungat the terminal level. (measured during FRC)
−910HU and −950HU are associated with ephysema progression(measured during TLC)
The high resolution and definition of the CT scans allow to createdetailed models of the entire lung structure.
(ISIB - T15-HL097622-01 NHLBI) The use of propensity scores July 27, 2011 5 / 38
BACKGROUND
Lung Parenchyma measurement
Obtained from computed tomography (CT)
Lung density histogram is calculated from relative attenuationdifferences in the medium.
Hounsfield Units are used to describe the relative attenuation whereair is defined as −1000HU and water as 0HU.
Low attenuation areas (< −856HU) indicate the structure of the lungat the terminal level. (measured during FRC)
−910HU and −950HU are associated with ephysema progression(measured during TLC)
The high resolution and definition of the CT scans allow to createdetailed models of the entire lung structure.
(ISIB - T15-HL097622-01 NHLBI) The use of propensity scores July 27, 2011 5 / 38
BACKGROUND
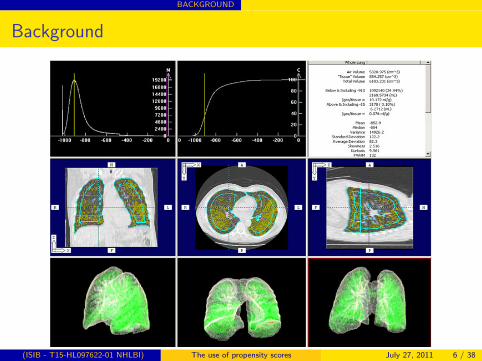
Background
(ISIB - T15-HL097622-01 NHLBI) The use of propensity scores July 27, 2011 6 / 38
BACKGROUND
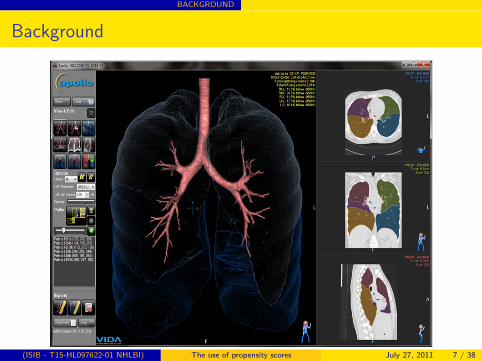
Background
(ISIB - T15-HL097622-01 NHLBI) The use of propensity scores July 27, 2011 7 / 38
BACKGROUND
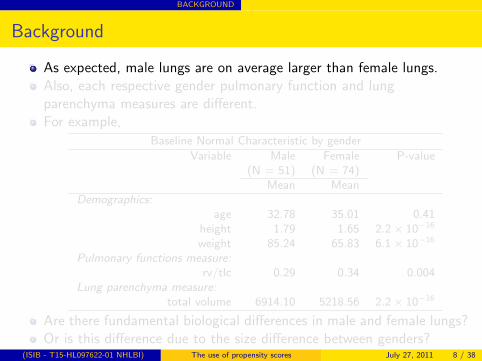
Background
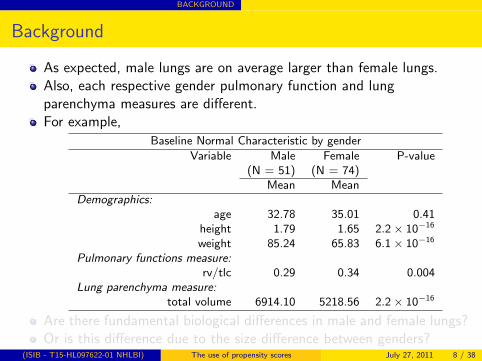
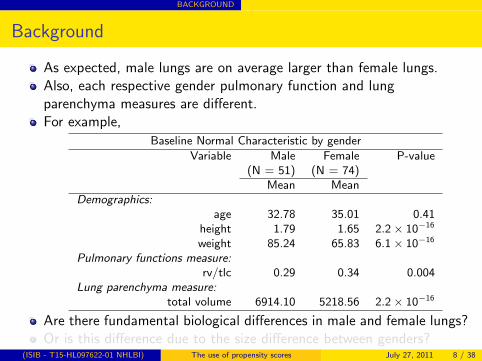
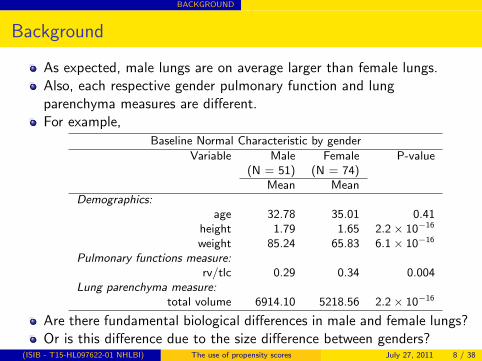
As expected, male lungs are on average larger than female lungs.Also, each respective gender pulmonary function and lungparenchyma measures are different.For example,
Are there fundamental biological differences in male and female lungs?Or is this difference due to the size difference between genders?
(ISIB - T15-HL097622-01 NHLBI) The use of propensity scores July 27, 2011 8 / 38
BACKGROUND
Background
As expected, male lungs are on average larger than female lungs.Also, each respective gender pulmonary function and lungparenchyma measures are different.For example,
Are there fundamental biological differences in male and female lungs?Or is this difference due to the size difference between genders?
(ISIB - T15-HL097622-01 NHLBI) The use of propensity scores July 27, 2011 8 / 38
GOAL
Goal
Goal
Our research project explores these differences to investigate whether sizeconfounds the gender differences or whether other biological variables maybe at stake. The project uses propensity scores for this exploration bymatching males and females based on physical characteristics to removepotential bias due to size, and assess gender differences in pulmonaryfunction and lung parenchyma on the matched subset.
(ISIB - T15-HL097622-01 NHLBI) The use of propensity scores July 27, 2011 9 / 38
METHOD
Propensity Score
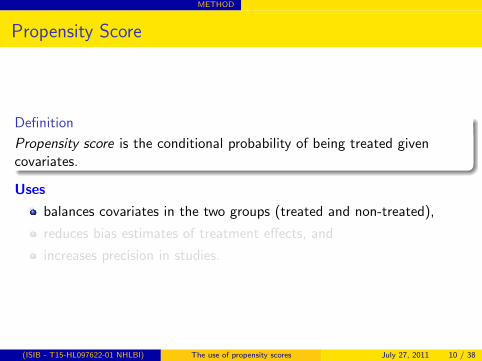
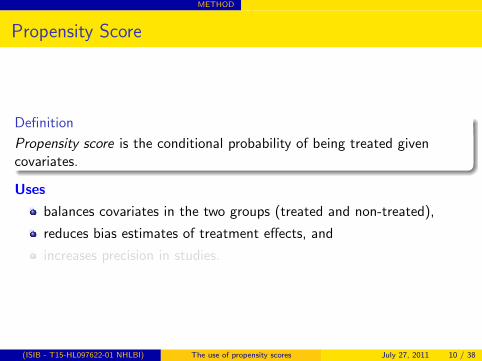
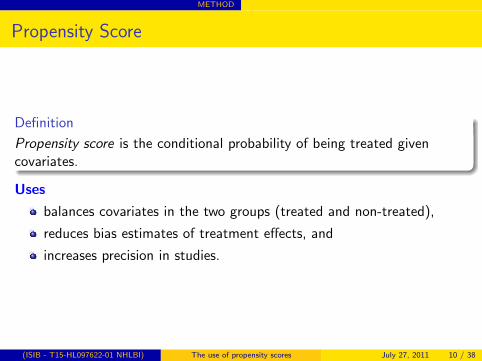
Definition
Propensity score is the conditional probability of being treated givencovariates.
Uses
balances covariates in the two groups (treated and non-treated),
reduces bias estimates of treatment effects, and
increases precision in studies.
(ISIB - T15-HL097622-01 NHLBI) The use of propensity scores July 27, 2011 10 / 38
METHOD
Propensity Score
Definition
Propensity score is the conditional probability of being treated givencovariates.
Uses
balances covariates in the two groups (treated and non-treated),
reduces bias estimates of treatment effects, and
increases precision in studies.
(ISIB - T15-HL097622-01 NHLBI) The use of propensity scores July 27, 2011 10 / 38
METHOD
Statistical Definition
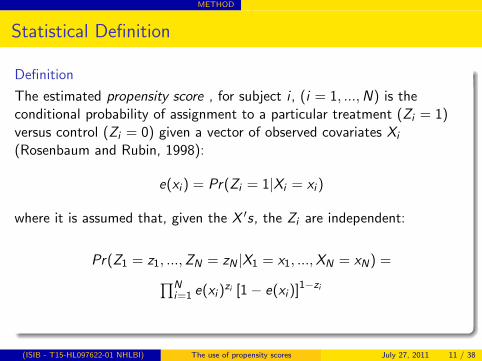
Definition
The estimated propensity score , for subject i , (i = 1, ...,N) is theconditional probability of assignment to a particular treatment (Zi = 1)versus control (Zi = 0) given a vector of observed covariates Xi
(Rosenbaum and Rubin, 1998):
e(xi ) = Pr(Zi = 1|Xi = xi )
where it is assumed that, given the X ′s, the Zi are independent:
(ISIB - T15-HL097622-01 NHLBI) The use of propensity scores July 27, 2011 11 / 38
METHOD
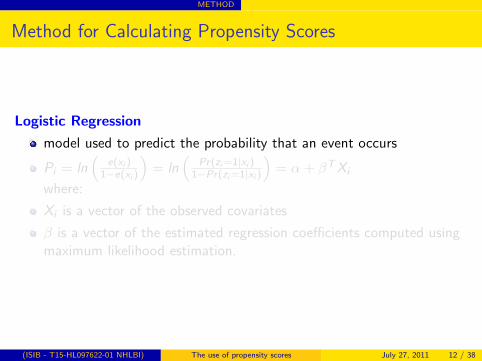
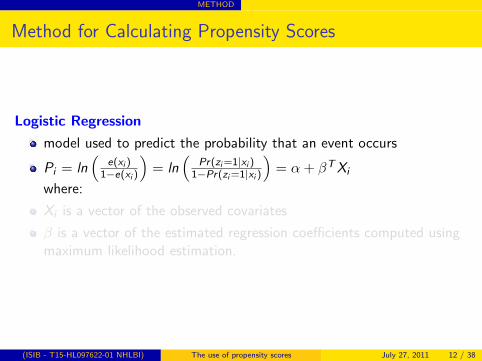
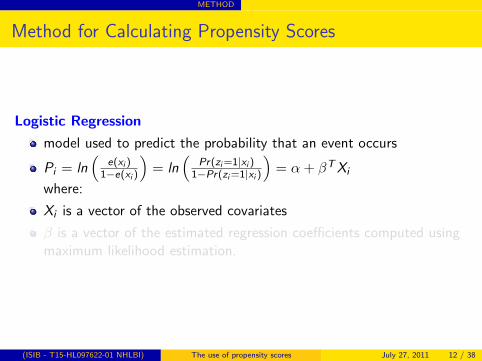
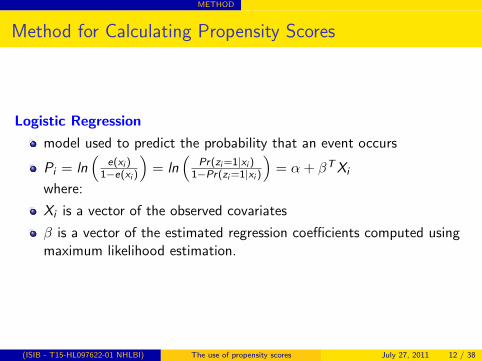
Method for Calculating Propensity Scores
Logistic Regression
model used to predict the probability that an event occurs
Pi = ln(
e(xi )1−e(xi )
)= ln
(Pr(zi=1|xi )
1−Pr(zi=1|xi )
)= α + βTXi
where:
Xi is a vector of the observed covariates
β is a vector of the estimated regression coefficients computed usingmaximum likelihood estimation.
(ISIB - T15-HL097622-01 NHLBI) The use of propensity scores July 27, 2011 12 / 38
METHOD
Method for Calculating Propensity Scores
Logistic Regression
model used to predict the probability that an event occurs
Pi = ln(
e(xi )1−e(xi )
)= ln
(Pr(zi=1|xi )
1−Pr(zi=1|xi )
)= α + βTXi
where:
Xi is a vector of the observed covariates
β is a vector of the estimated regression coefficients computed usingmaximum likelihood estimation.
(ISIB - T15-HL097622-01 NHLBI) The use of propensity scores July 27, 2011 12 / 38
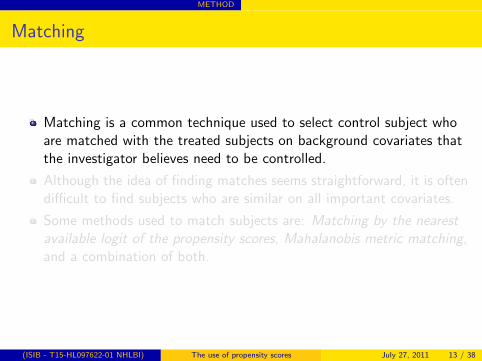
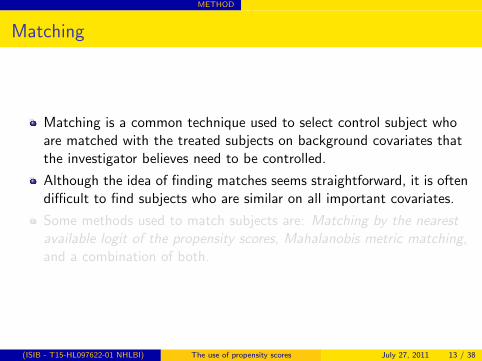
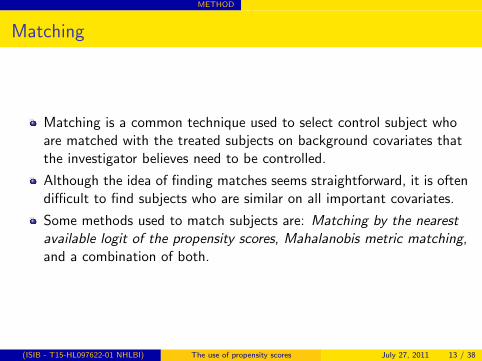
METHOD
Matching
Matching is a common technique used to select control subject whoare matched with the treated subjects on background covariates thatthe investigator believes need to be controlled.
Although the idea of finding matches seems straightforward, it is oftendifficult to find subjects who are similar on all important covariates.
Some methods used to match subjects are: Matching by the nearestavailable logit of the propensity scores, Mahalanobis metric matching,and a combination of both.
(ISIB - T15-HL097622-01 NHLBI) The use of propensity scores July 27, 2011 13 / 38
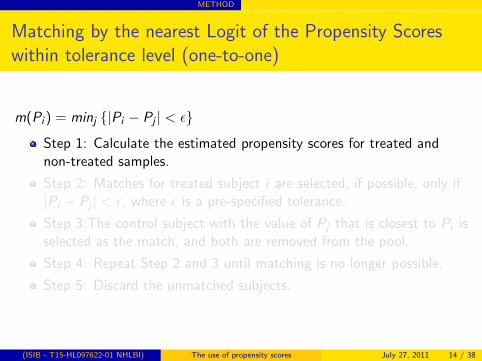
METHOD
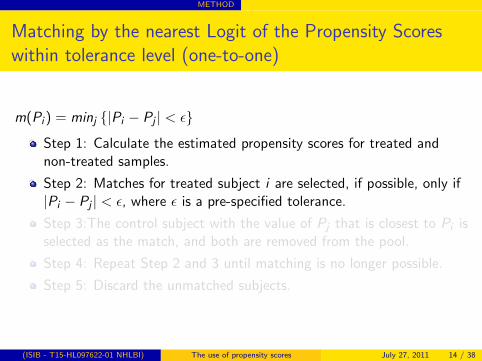
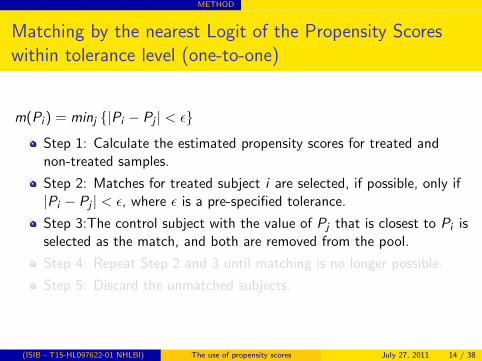
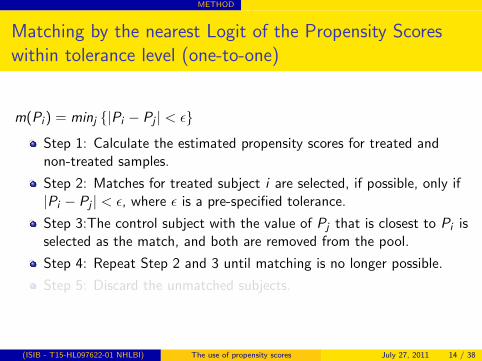
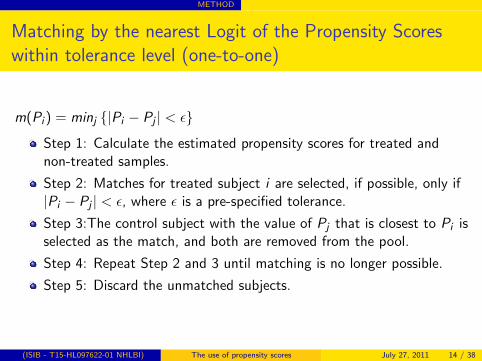
Matching by the nearest Logit of the Propensity Scoreswithin tolerance level (one-to-one)
m(Pi ) = minj {|Pi − Pj | < ε}
Step 1: Calculate the estimated propensity scores for treated andnon-treated samples.
Step 2: Matches for treated subject i are selected, if possible, only if|Pi − Pj | < ε, where ε is a pre-specified tolerance.
Step 3:The control subject with the value of Pj that is closest to Pi isselected as the match, and both are removed from the pool.
Step 4: Repeat Step 2 and 3 until matching is no longer possible.
Step 5: Discard the unmatched subjects.
(ISIB - T15-HL097622-01 NHLBI) The use of propensity scores July 27, 2011 14 / 38
METHOD
Matching by the nearest Logit of the Propensity Scoreswithin tolerance level (one-to-one)
m(Pi ) = minj {|Pi − Pj | < ε}
Step 1: Calculate the estimated propensity scores for treated andnon-treated samples.
Step 2: Matches for treated subject i are selected, if possible, only if|Pi − Pj | < ε, where ε is a pre-specified tolerance.
Step 3:The control subject with the value of Pj that is closest to Pi isselected as the match, and both are removed from the pool.
Step 4: Repeat Step 2 and 3 until matching is no longer possible.
Step 5: Discard the unmatched subjects.
(ISIB - T15-HL097622-01 NHLBI) The use of propensity scores July 27, 2011 14 / 38
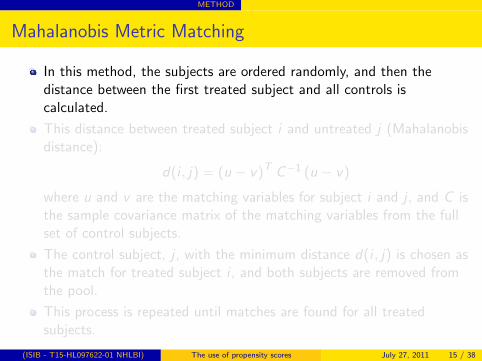
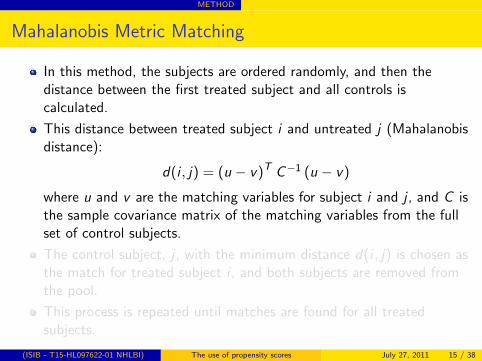
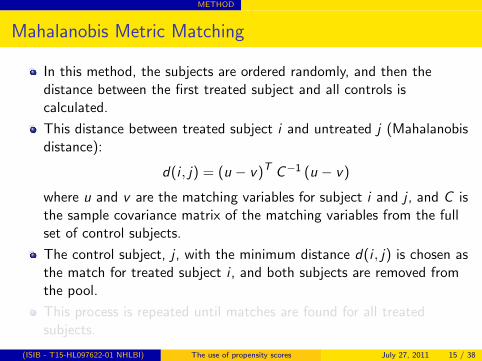
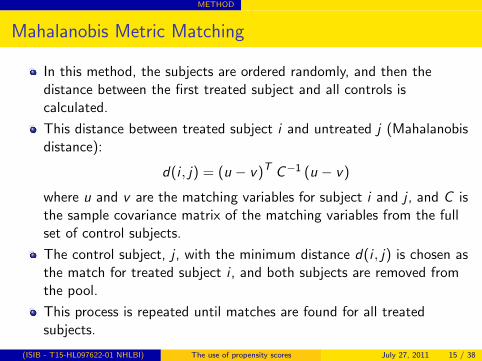
METHOD
Mahalanobis Metric Matching
In this method, the subjects are ordered randomly, and then thedistance between the first treated subject and all controls iscalculated.
This distance between treated subject i and untreated j (Mahalanobisdistance):
d(i , j) = (u − v)T C−1 (u − v)
where u and v are the matching variables for subject i and j , and C isthe sample covariance matrix of the matching variables from the fullset of control subjects.
The control subject, j , with the minimum distance d(i , j) is chosen asthe match for treated subject i , and both subjects are removed fromthe pool.
This process is repeated until matches are found for all treatedsubjects.
(ISIB - T15-HL097622-01 NHLBI) The use of propensity scores July 27, 2011 15 / 38
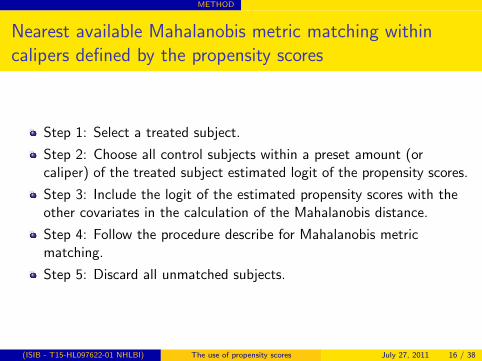
METHOD
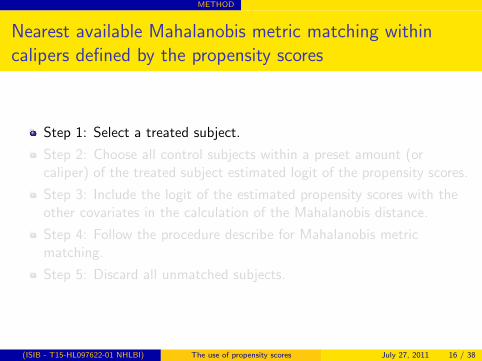
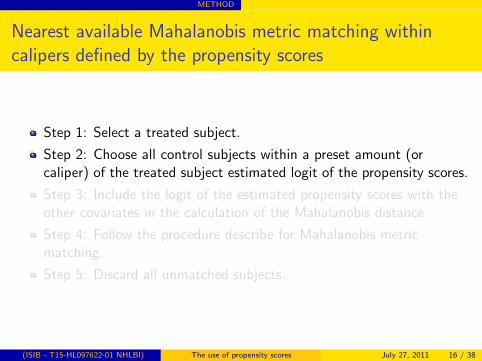
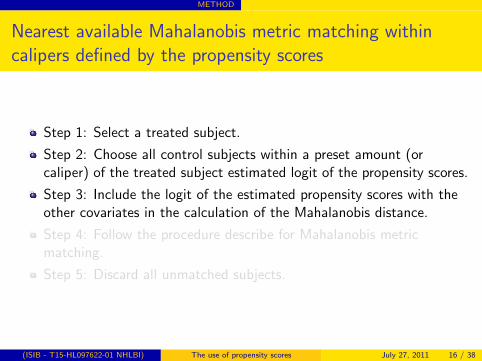
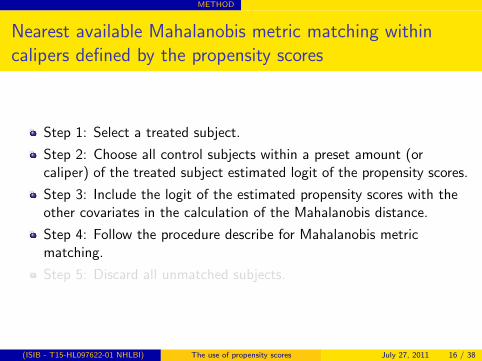
Nearest available Mahalanobis metric matching withincalipers defined by the propensity scores
Step 1: Select a treated subject.
Step 2: Choose all control subjects within a preset amount (orcaliper) of the treated subject estimated logit of the propensity scores.
Step 3: Include the logit of the estimated propensity scores with theother covariates in the calculation of the Mahalanobis distance.
Step 4: Follow the procedure describe for Mahalanobis metricmatching.
Step 5: Discard all unmatched subjects.
(ISIB - T15-HL097622-01 NHLBI) The use of propensity scores July 27, 2011 16 / 38
METHOD
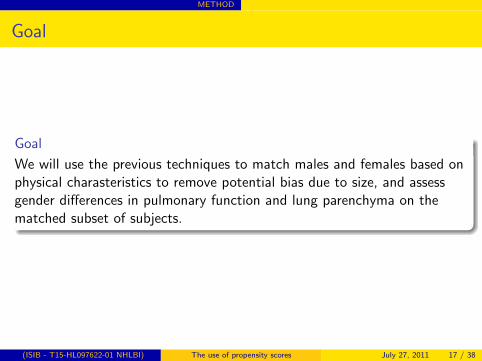
Goal
Goal
We will use the previous techniques to match males and females based onphysical charasteristics to remove potential bias due to size, and assessgender differences in pulmonary function and lung parenchyma on thematched subset of subjects.
(ISIB - T15-HL097622-01 NHLBI) The use of propensity scores July 27, 2011 17 / 38
DATA ANALYSIS / RESULTS
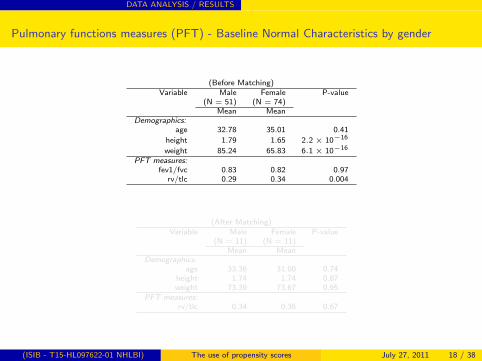
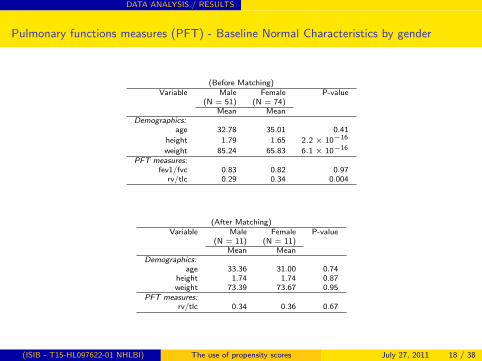
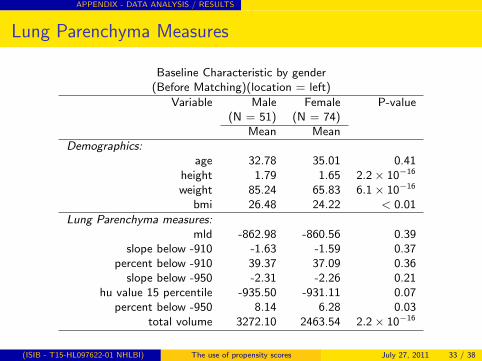
Pulmonary functions measures (PFT) - Baseline Normal Characteristics by gender
(Before Matching)Variable Male Female P-value
(N = 51) (N = 74)Mean Mean
Demographics:age 32.78 35.01 0.41
height 1.79 1.65 2.2 × 10⁻¹⁶
weight 85.24 65.83 6.1 × 10⁻¹⁶
PFT measures:fev1/fvc 0.83 0.82 0.97
rv/tlc 0.29 0.34 0.004
(After Matching)Variable Male Female P-value
(N = 11) (N = 11)Mean Mean
Demographics:age 33.36 31.00 0.74
height 1.74 1.74 0.87weight 73.39 73.67 0.95
PFT measures:rv/tlc 0.34 0.36 0.67
(ISIB - T15-HL097622-01 NHLBI) The use of propensity scores July 27, 2011 18 / 38
DATA ANALYSIS / RESULTS
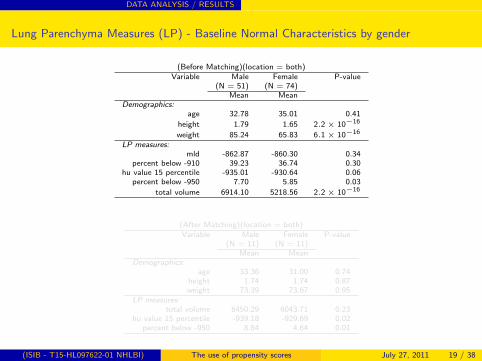
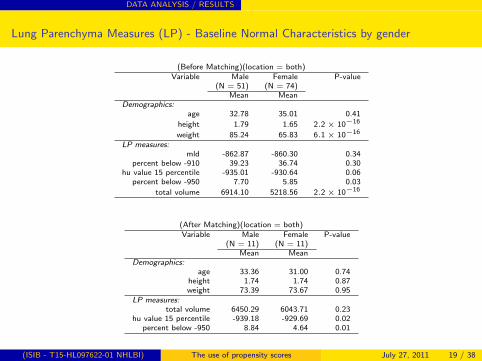
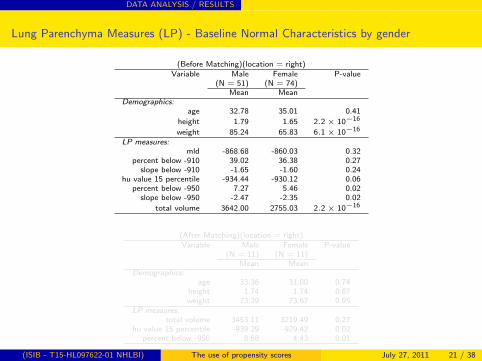
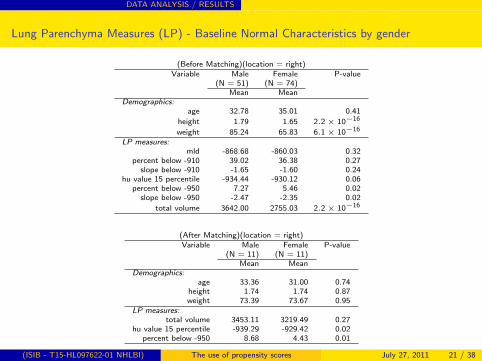
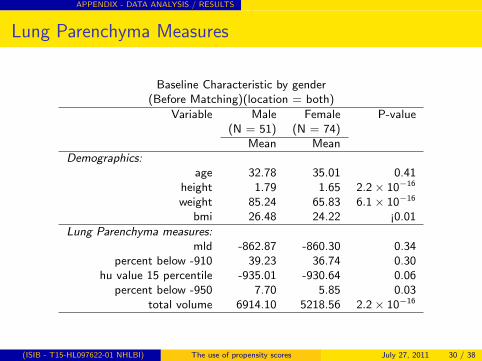
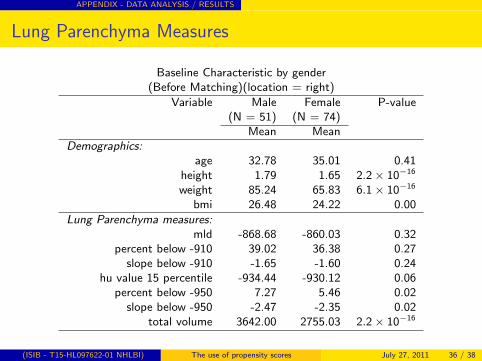
Lung Parenchyma Measures (LP) - Baseline Normal Characteristics by gender
(Before Matching)(location = both)Variable Male Female P-value
hu value 15 percentile -934.44 -930.12 0.06percent below -950 7.27 5.46 0.02
slope below -950 -2.47 -2.35 0.02
total volume 3642.00 2755.03 2.2 × 10⁻¹⁶
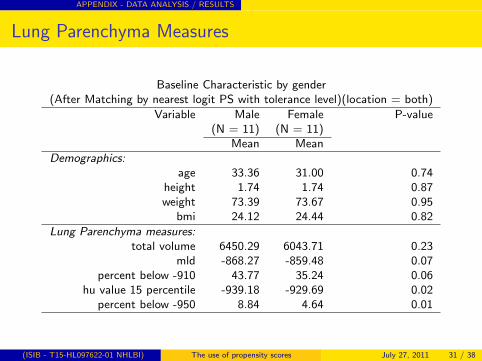
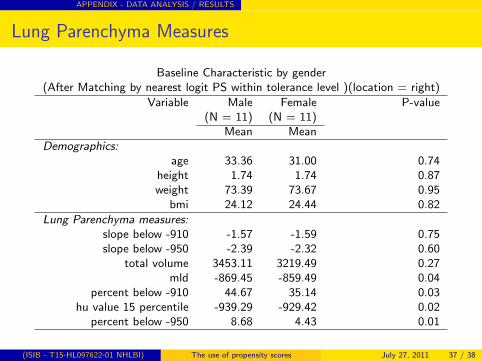
(After Matching)(location = right)Variable Male Female P-value
(N = 11) (N = 11)Mean Mean
Demographics:age 33.36 31.00 0.74
height 1.74 1.74 0.87weight 73.39 73.67 0.95
LP measures:total volume 3453.11 3219.49 0.27
hu value 15 percentile -939.29 -929.42 0.02percent below -950 8.68 4.43 0.01
(ISIB - T15-HL097622-01 NHLBI) The use of propensity scores July 27, 2011 21 / 38
CONCLUSION/ FUTURE WORK / REFERENCES
Conclusion
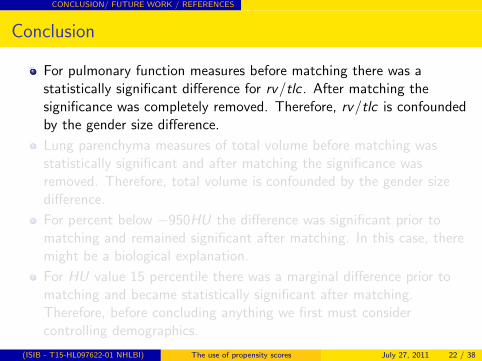
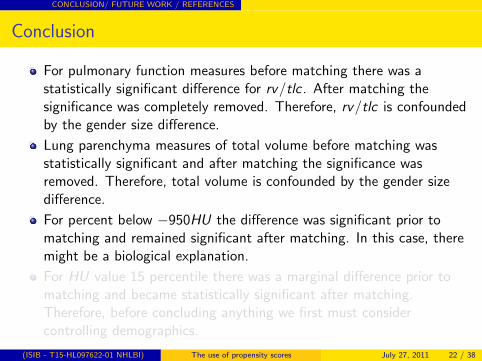
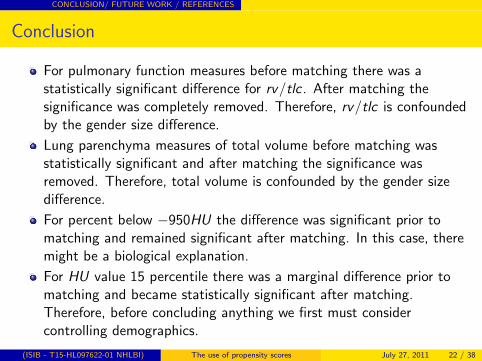
For pulmonary function measures before matching there was astatistically significant difference for rv/tlc . After matching thesignificance was completely removed. Therefore, rv/tlc is confoundedby the gender size difference.
Lung parenchyma measures of total volume before matching wasstatistically significant and after matching the significance wasremoved. Therefore, total volume is confounded by the gender sizedifference.
For percent below −950HU the difference was significant prior tomatching and remained significant after matching. In this case, theremight be a biological explanation.
For HU value 15 percentile there was a marginal difference prior tomatching and became statistically significant after matching.Therefore, before concluding anything we first must considercontrolling demographics.
(ISIB - T15-HL097622-01 NHLBI) The use of propensity scores July 27, 2011 22 / 38
CONCLUSION/ FUTURE WORK / REFERENCES
Conclusion
For pulmonary function measures before matching there was astatistically significant difference for rv/tlc . After matching thesignificance was completely removed. Therefore, rv/tlc is confoundedby the gender size difference.
Lung parenchyma measures of total volume before matching wasstatistically significant and after matching the significance wasremoved. Therefore, total volume is confounded by the gender sizedifference.
For percent below −950HU the difference was significant prior tomatching and remained significant after matching. In this case, theremight be a biological explanation.
For HU value 15 percentile there was a marginal difference prior tomatching and became statistically significant after matching.Therefore, before concluding anything we first must considercontrolling demographics.
(ISIB - T15-HL097622-01 NHLBI) The use of propensity scores July 27, 2011 22 / 38
CONCLUSION/ FUTURE WORK / REFERENCES
Future work
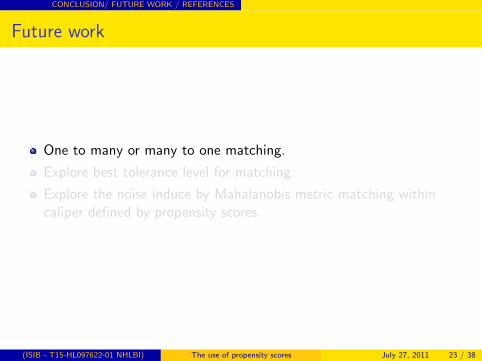
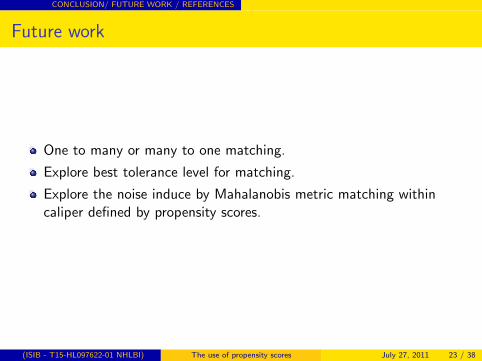
One to many or many to one matching.
Explore best tolerance level for matching.
Explore the noise induce by Mahalanobis metric matching withincaliper defined by propensity scores.
(ISIB - T15-HL097622-01 NHLBI) The use of propensity scores July 27, 2011 23 / 38
CONCLUSION/ FUTURE WORK / REFERENCES
Future work
One to many or many to one matching.
Explore best tolerance level for matching.
Explore the noise induce by Mahalanobis metric matching withincaliper defined by propensity scores.
(ISIB - T15-HL097622-01 NHLBI) The use of propensity scores July 27, 2011 23 / 38
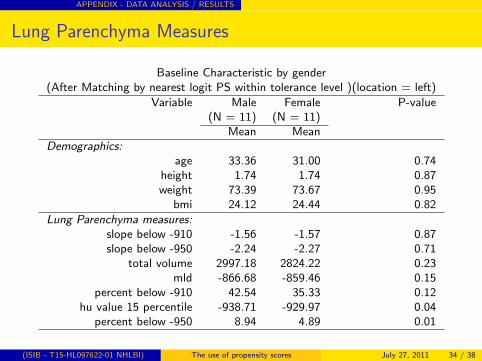
(ISIB - T15-HL097622-01 NHLBI) The use of propensity scores July 27, 2011 34 / 38
APPENDIX - DATA ANALYSIS / RESULTS
Lung Parenchyma Measures
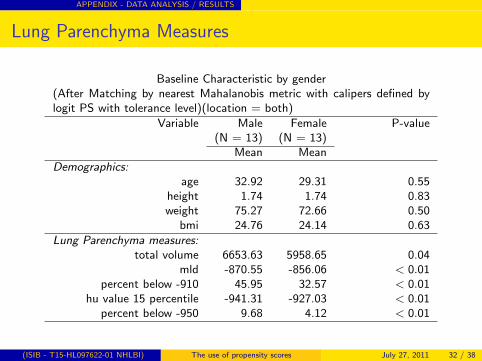
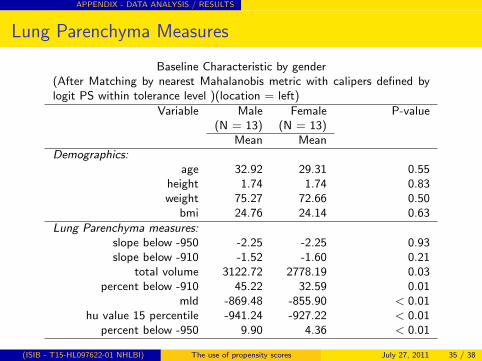
Baseline Characteristic by gender(After Matching by nearest Mahalanobis metric with calipers defined bylogit PS within tolerance level )(location = left)
Variable Male Female P-value(N = 13) (N = 13)
Mean MeanDemographics:
age 32.92 29.31 0.55height 1.74 1.74 0.83weight 75.27 72.66 0.50
(ISIB - T15-HL097622-01 NHLBI) The use of propensity scores July 27, 2011 37 / 38
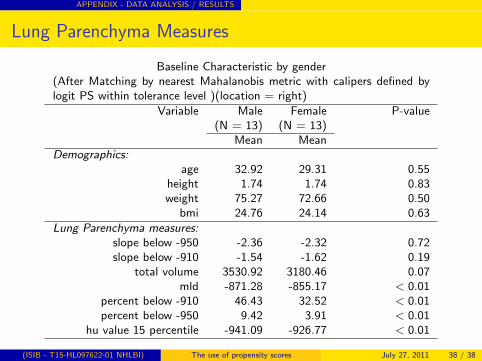
APPENDIX - DATA ANALYSIS / RESULTS
Lung Parenchyma Measures
Baseline Characteristic by gender(After Matching by nearest Mahalanobis metric with calipers defined bylogit PS within tolerance level )(location = right)
Variable Male Female P-value(N = 13) (N = 13)
Mean MeanDemographics:
age 32.92 29.31 0.55height 1.74 1.74 0.83weight 75.27 72.66 0.50