Page 1
WORLD DEVELOPMENT REPORT 2012 GENDER EQUALITY AND DEVELOPMENT BACKGROUND PAPER
GENDER DIFFERENCES IN EDUCATION, CAREER
CHOICES AND LABOR MARKET OUTCOMES ON A
SAMPLE OF OECD COUNTRIES
Flabbi, Luca
2011
This paper was prepared with the support of the
Organisation for Economic Co-operation and Development
The findings, interpretations, and conclusions expressed in this paper are entirely those of
the authors. They do not necessarily represent the views of the World Development Report
2012 team, the World Bank and its affiliated organizations, or those of the Executive
Directors of the World Bank or the governments they represent.
Page 2
2
GENDER DIFFERENCIALS IN EDUCATION, CAREER
CHOICES AND LABOR MARKET OUTCOMES ON A
SAMPLE OF OECD COUNTRIES
Luca Flabbi
(Georgetown University and IZA)
This Draft: March 10, 2011
First Draft: December 20, 2010
1. Introduction
In most OECD countries gender differentials in the labor market have experienced a
steady reduction in the 1970s and 1980s. Starting with the 1990s, however, the
convergence between the labor market performance of men and women has essentially
stopped. As a result, gender differentials in the labor market are still significant and
persistent.1 At the same time, differences in pre-labor market characteristics, in particular
education, have decreased and in most OECD countries women now acquire more
education than men.2 However, if the differences in the amount of education acquired by
men and women are small, the differences in the type of education (such as the field of
study, major or other characteristics of the study programme) are still large.3
This paper focuses on describing and analyzing gender asymmetries in the
interactions between labor market outcomes and education choices for a sample of OECD
countries. Within this general line of research, the paper focuses on:
1. Describing the main asymmetries by gender in education choices. The level of
education considered is the tertiary level since this is the level where majors and
fields of specialization have the strongest impact on labor market outcomes. A
1 For international comparisons, see Blau and Kahn (2003). For evidence of trends over time, see Flabbi
(2010) and Blau and Kahn (2006). 2 In the United States, starting with the cohort of individuals born after 1956, the proportion of women with
a College degree is higher than the proportion of men with a College degree. (Source: CPS data). Becker,
Hubbard, and Murphy (2009) show that the phenomenon is common to most median and high-income
countries starting with the generations born after 1970. OECD (2008) reports that women constitute more
than 50% of new entrants in Tertiary Education (OECD average is 54%, see Table A2.6). 3 See for example, Arcidiacono (2004) and Daymont and Andrisani (1984).
Page 3
3
description of the performance in education as measured by graduation rates and
grades obtained at the completion of the degree will also be provided.
2. Measuring which factors may explain the gender asymmetries in education
choices. The main explanatory variables considered are the characteristics of the
study programme, observable measures of ability and a concise description of
family backgrounds.
3. Measuring the contribution of education choices in explaining gender
differentials in the labor market. The main focus is on explaining gender
differentials in earnings since gender differentials in earnings and wages remain
the prominent issue in the study of gender differentials in the labor markets of
OECD countries.
4. Studying the correlation between education choices and occupation choices. The
choice of a field of study has a strong impact on the future occupation due to the
match between the skill required on the job and the ones acquired in school.
Conversely, a given occupation may have desirable characteristics that may
induce a specific choice of field of study. If the direction and the specific
mechanisms of the causation are difficult to disentangle in the data,4 providing
suggestive and descriptive evidence on this type of dynamic may help gauge the
magnitude of the effects and on how they differ by gender.
The paper is organized as follows. The next section briefly describes the data used in
the analysis. Section 3 provides descriptive evidence on gender differentials in education
choices. Section 4 estimates gender-specific determinants of education choices. Section 5
evaluates to what extent educational choices determine gender differentials in the labor
market. Section 6 provides descriptive evidence on the relation between the choice of
field of study and the choice of occupation. The last section concludes summarizing the
main results.
2. Data
The analysis requires a data set comparable across countries, containing detailed
information on the type of education acquired by the individuals and reporting some
measures of labor market performance.
The Flexible Professional in the Knowledge Society (REFLEX) data set is one of the
few available data set that satisfies these criteria. The REFLEX data set collects the result
4 Going beyond a descriptive evidence to provide causal implications is a notoriously difficult task. Some
works exist that tries to identify causation of at least one characteristic of the future occupation: expected
earnings. An example of a recent attempt in this research area is Beffy, Fougère and Maurel (2009).
Page 4
4
of a survey on graduates from higher education that have about 5 years of experience
since leaving higher education. They are graduates from an ISCED 5A level degree
(equivalent to a College B.A. or a Master in most countries) who got their degree in the
academic year 1999/2000. The project is carried out in 14 countries: Austria, Belgium
(only Flanders), Finland, France, Germany, Italy, the Netherlands, Norway, Spain, UK,
Czech Republic, Portugal, Japan and Estonia.
Since the focus on the project was to study "the Flexible Professional in the
Knowledge Society", the data set is extremely rich in variables describing the type of
education and skills acquired by the individuals and their mapping in occupation choices
and skills.5 The sample stratification should guarantee that the samples are representative
at the country level for this specific graduating cohort.6
3. Gender Differentials in Education Choices
In the description of the gender differentials in education choices, three outcomes are
considered: the level of education as measured by the proportion of individuals that
successfully graduate; the type of education as measured by the major or field of
specialization; and finally the performance in education as measured by the grade
obtained at graduation.
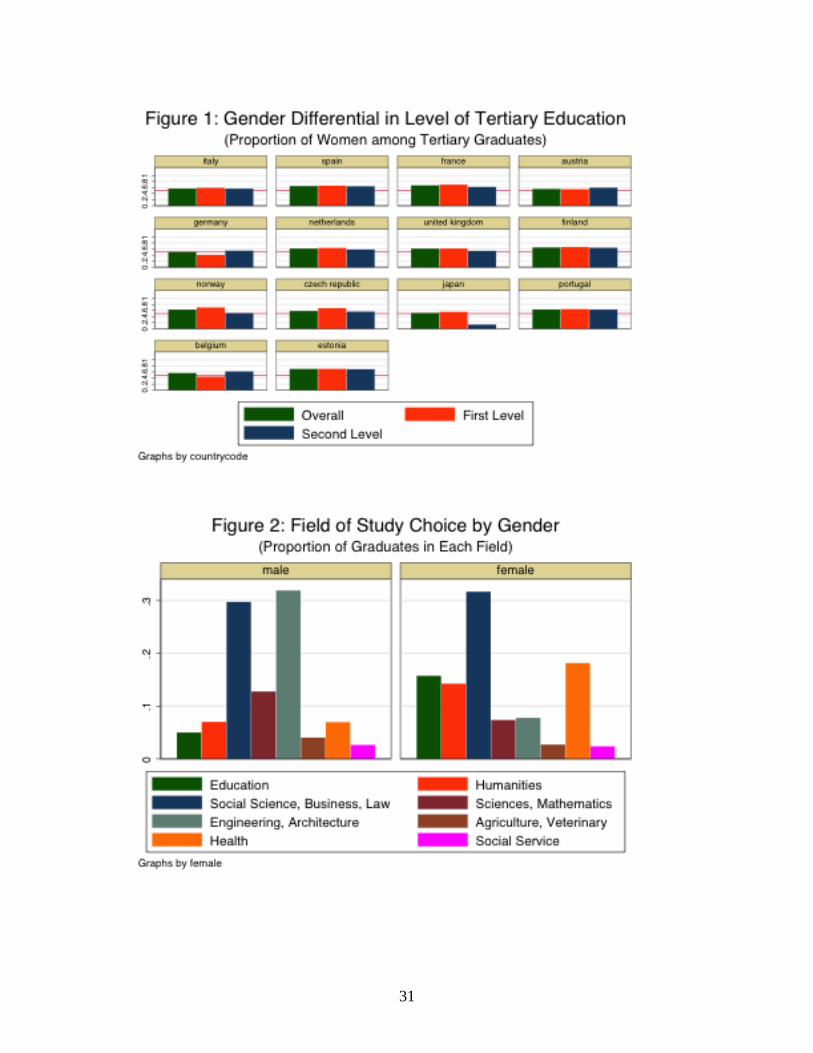
Figure 1 reports the proportion of women among graduates from a Tertiary level
degree (ISCED 5A level degree) by country. Women are the majority of graduates in
most countries with the exception of Germany and Japan where the proportion is almost
exactly 50/50. The results confirm that a positive differential in College education for
women is by now a common feature in OECD countries. The distribution between a first
level degree (such as a Bachelor degree in UK or a Maîtrise degree in France) and a
second level degree (such as a Master degree in UK or a DEA in France) shows a greater
concentration of women in first level degrees. This concentration is dramatic in Japan
where only less of 20% of the second level graduates are women.
Figure 2 starts to provide evidence on asymmetries in the choice of the type of
education acquired. Results are now for the pooled sample, i.e. computed on pooling all
the individual level observations for all countries together. The field of choice definition
5 Most of the papers using the REFLEX data focus on skills mismatch and overeducation: see for example
McGuinness and Sloane (2009). So far, no paper has specifically focused on gender differentials using
REFLEX data. 6 See Allen and van der Velden (2007) for a detailed description of the REFLEX project, including data
documentation and papers containing the main results. Additional and updated information is at
http://www.reflexproject.org.
Page 5
5
used has the objective to enable accurate coding of programmes into 3-digit ISCED fields
of training. A more aggregated field of choice definition is provided in the country-by-
country statistics.
Social Sciences, Business and Law are the favourite fields for women while the
favourite fields for men are Engineering and Architecture with Social Sciences, Business
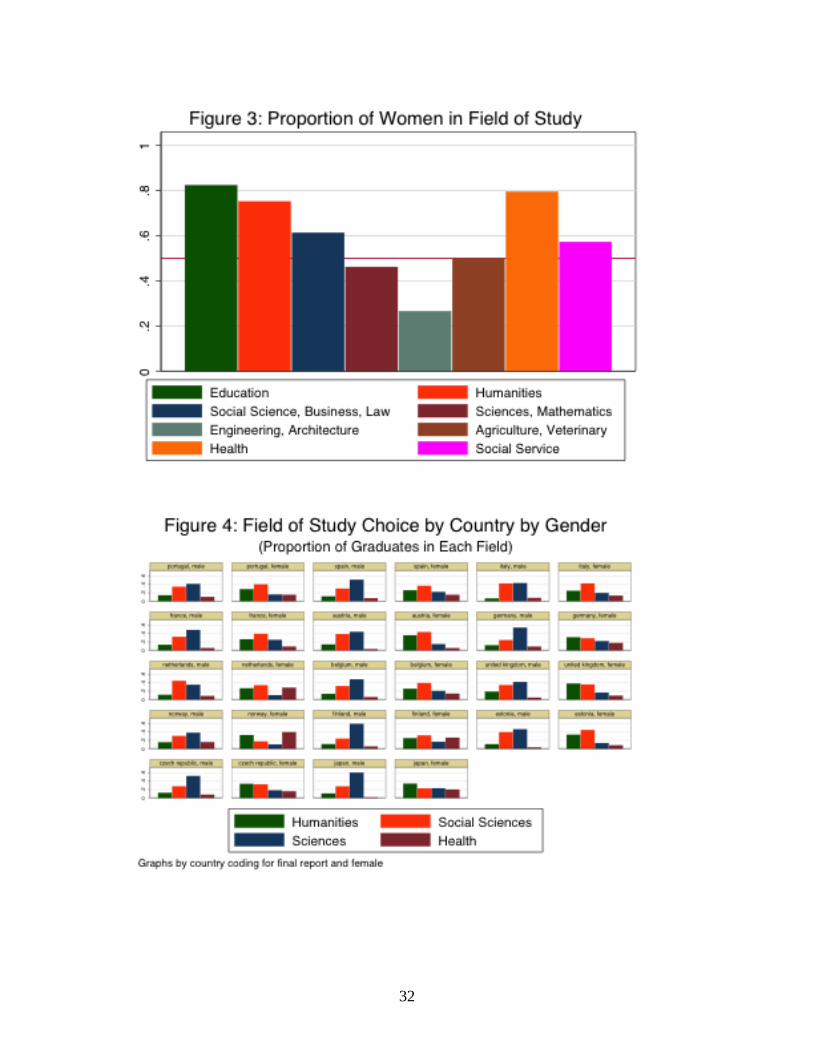
and Law scoring a close second place. Figure 3 organizes the same information in a
different way. The figure reports the proportion of women that have completed their
degree by field of study. The fields may be roughly aggregated in three groups: fields
where the majority of graduates are women (Education, Humanities, and Health), fields
where the proportion of women roughly corresponds to the proportion of women in the
overall sample (Social Sciences, Business and Law; Sciences and Mathematics;
Agriculture and Veterinary; Social Service), and fields where the majority of graduates
are men (Engineering and Architecture).
Figure 4 shows the distribution by aggregate field of study7 for each country. The
differences between countries are quite significant. However, the fact that men and
women make quite different field choices is common to all countries: men are more
concentrated in the Sciences, women in the Humanities while Social Sciences covers
about 30% of the choices for both men and women. The proportion of men and women
choosing Health is the one showing the largest differences between countries.
Overall, Figure 2 to 4 show that there are systematic differences between men and
women in the choice of field of study and that these differences are much larger than the
difference in the overall proportion of graduates.
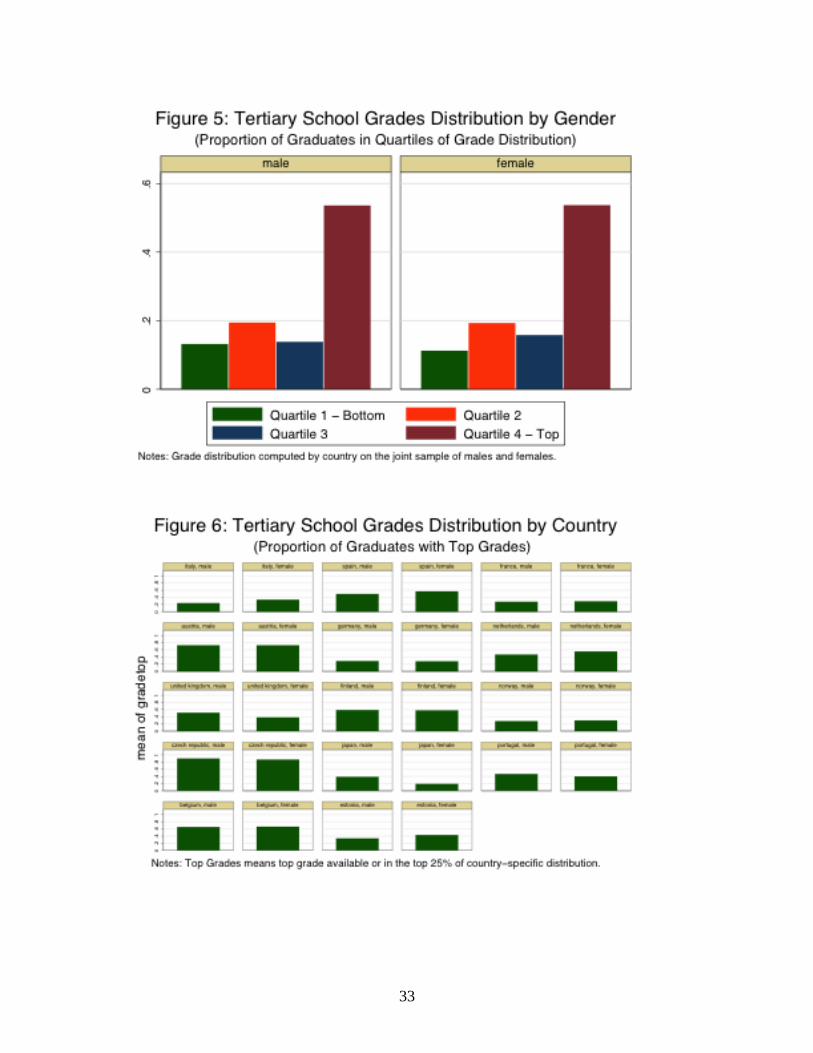
Figure 5 and 6 look at gender differences in performance at the Tertiary level.
Performance is measured by the grade received upon graduation (Tertiary School
Grades). To make the grades comparable across countries, all the Figures concerning the
grades present the distribution over quartile by gender where the distribution is computed
on the pooled sample of men and women for each country.8 Notice that the scale of the
final grade upon graduating from a tertiary level degree varies widely between countries.
Some countries use a very fine grid generating an almost continuous variable (for
example, Italy uses a score with a range from 60 to 110). On these countries, the number
of individuals in the top quartile roughly corresponds to a proportion of 25%. Other
countries use a very coarse grid with final grades assuming only an handful of values (for
example, Austria uses only four values). On these countries, the number of individuals in
7 A more aggregated definition of field is necessary to make the Table readable and also to perform some
discrete choice regression in the fourth section of the paper. The aggregation in four fields follows OECD
(2008), Chart A2.5. It merges Education and Humanities to generate the field Humanities; Social Sciences,
Business, Law, and Social Services to generate the field Social Sciences; Sciences, Mathematics,
Agriculture, Veterinary, Engineering, Architecture to generate the field Sciences. Finally, the field Health
remains unchanged. 8 Also Allen and van der Velden (2007) use relative grades to study the impact of grades on labor market
performance. They conclude that grades are a clear signal for future employers.
Page 6
6
the top quartile is frequently much higher than 25% because many individuals may
receive the top.
The graph does not show major differences in performance. Women fare a little better
since more of them are in the third quartile than in the first quartile with respect to men.
This lack of difference in performance on the pooled sample masks some important
differences at the country level. Figure 6 presents the proportion of graduates in the top
25% of the grade distribution or scoring the top grade available9 for each country. If
many countries confirm the lack of differential in performance, Japan and UK report a
worse performance for women while Italy, the Netherlands and Estonia show a better
performance for women than men.
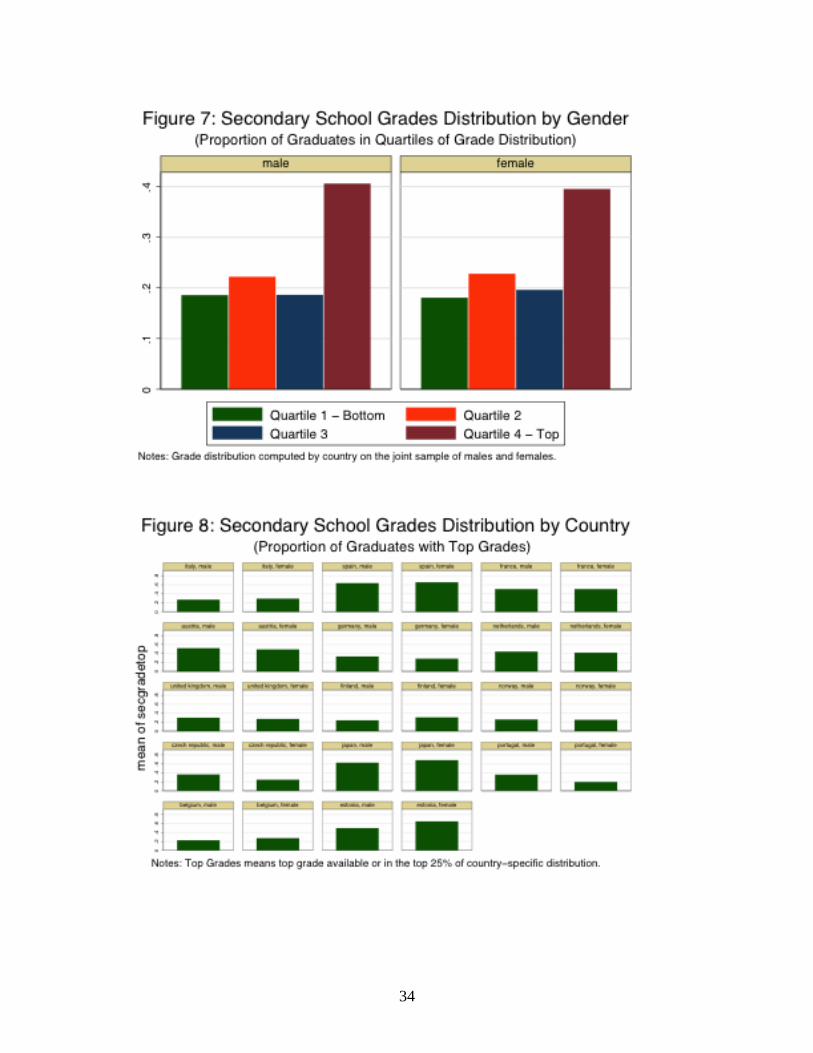
A next instructive step is checking if similar evidence about individuals' performance
was present at the entrance of the Tertiary level of education. Figures 7 and 8 present the
distribution computed on the grades obtained upon graduation from the Secondary level
of education. The figures essentially confirms the results obtained at the Tertiary level on
the pooled sample. At the country level, the differential in performance is a little smaller
on countries actually showing a differential. The striking exception is Japan where the
ranking in performance is reversed: At the entrance of the tertiary school level more
women than men hold top grades, at the exit of the tertiary school level more men than
women hold top grades.
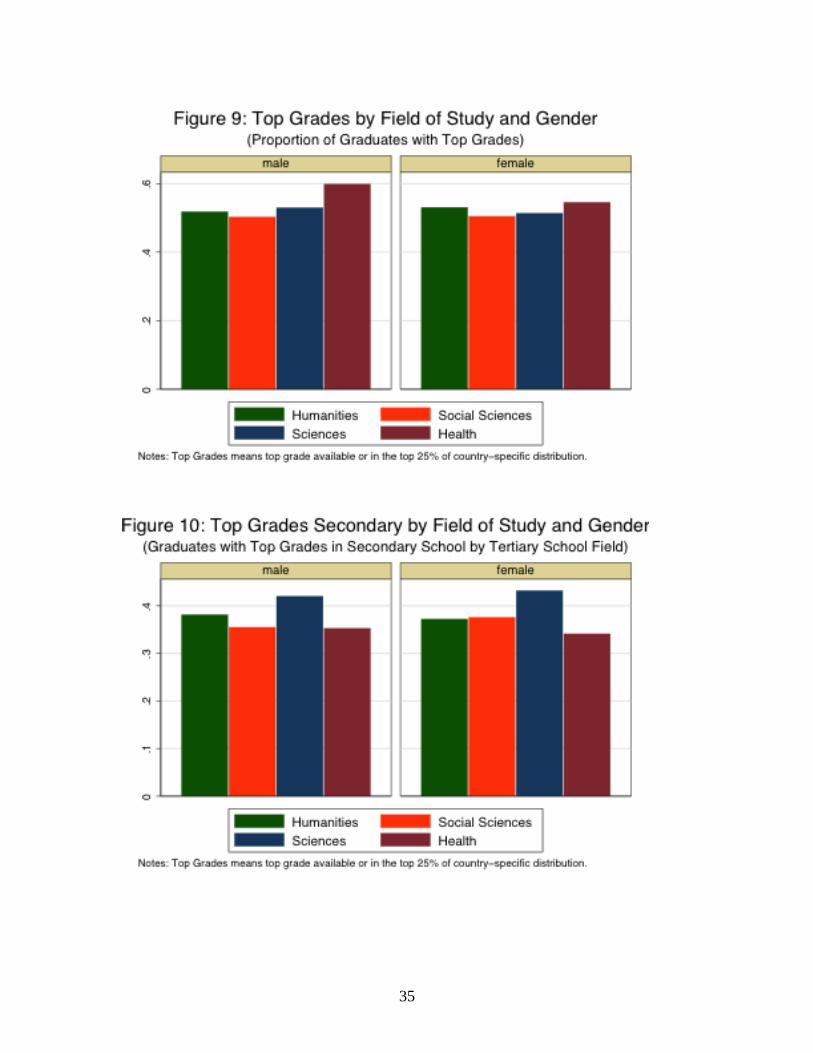
Grades are usually not homogeneous across fields and since we have seen major
differences in the choice of field by gender, it is interesting to present some evidence of
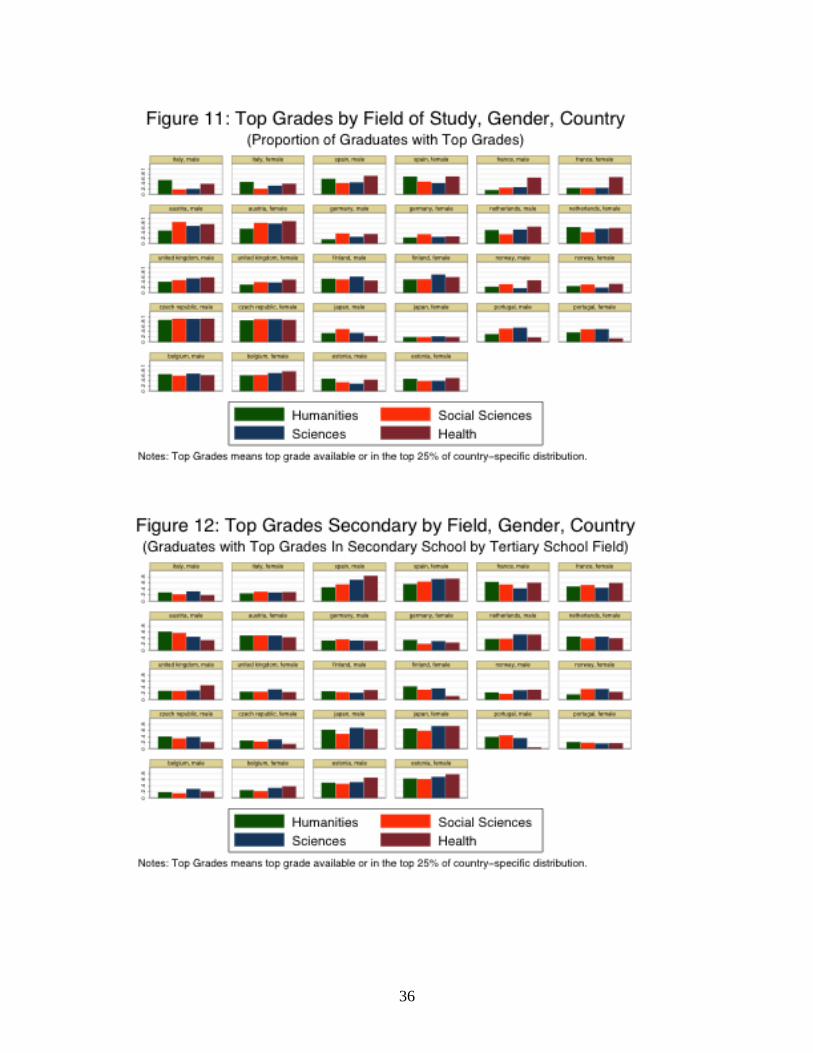
performance by field. Figures 9 and 10 present the proportion of graduates with top
grades upon graduating from, respectively, tertiary school and secondary school; Figures
11 and 12 present the same evidence by country.
Men and women have a very similar performance upon graduating from the tertiary
level in Sciences or in Social Sciences. In the Humanities women obtain a slightly better
performance but a substantially worse performance in Health. Probably the major
difference between men and women is that the proportion of top performer women is
very similar across fields while men show a little bit more variation.
The field Sciences attracts the highest proportion of top performing students in
secondary school both on the male and female sample. At the opposite, Health attracts the
lowest proportion of top performing students even if, upon graduation, Health is granting
the highest proportion of top grades. The evidence by country (Figures 11 and 12)
confirms the same evidence about Health. The evidence about Science is much more
differentiated by gender. Italy, Japan and Belgium confirm the positive selection (i.e.
Science attracts the highest proportion of top performing students) only on the male
9 As mentioned above, the fact that some countries use a very coarse grid implies that potentially much
more than 25% of the graduates receive a Top Grade.
Page 7
7
sample; the UK and the Czech Republic show a substantial positive selection only on the
female sample; the other countries report more mixed results. The evidence common to
all countries (possibly with the exception of the Czech Republic and Japan's female
sample) is that grade performance upon graduation varies widely across fields and that
the differences are not explained by sample selection at the entrance of the tertiary school
level programme. The low variation of performance across fields found on the pooled
sample was therefore in part due to aggregation effects.
Conclusion
The main differences in education choices between men and women are:
1. Women acquire a little more tertiary education than men but they are more
concentrated in the first level of tertiary education (e.g. B.A.) than in the second
level (e.g. Master).
2. The significant differences in the choice of field of study by gender can be
summarized as follows: women are the majority of graduates in Education,
Humanities, and Health; the proportion of women roughly corresponds to the
proportion of women in the overall sample among the graduates in Social
Sciences, Business and Law; Sciences and Mathematics; Agriculture and
Veterinary; Social Service; finally, the majority of graduates are men in the fields
of Engineering and Architecture.
3. Grade performance upon graduation varies widely across fields at the country
level but not at the aggregate level. The differences are not explained by sample
selection at the entrance of the tertiary school level.
4. Men and women have usually a similar performance in Sciences and in Social
Sciences while women perform better in the Humanities and men in the field
Health.
5. Overall, the main differences between men and women at the tertiary school level
of education are not in the total amount of education acquired or in the
performance obtained but in the field of study actually chosen.
4. Gender-Specific Determinants of Education Choices
Given that systematic differences exist in the education choices of men and women, it
is interesting to study the sources of this asymmetry. This section focuses on the
characteristic over which men and women experience the largest asymmetry: the choice
of field of study. In studying what factors may have an impact on the choice of field, the
focus is on characteristics of the study programme, ability, and family backgrounds
Page 8
8
controls. See footnote to Table 1 for a detailed description.10
The choice of the aggregate
field of study is the dependent variable in the econometric analysis.11
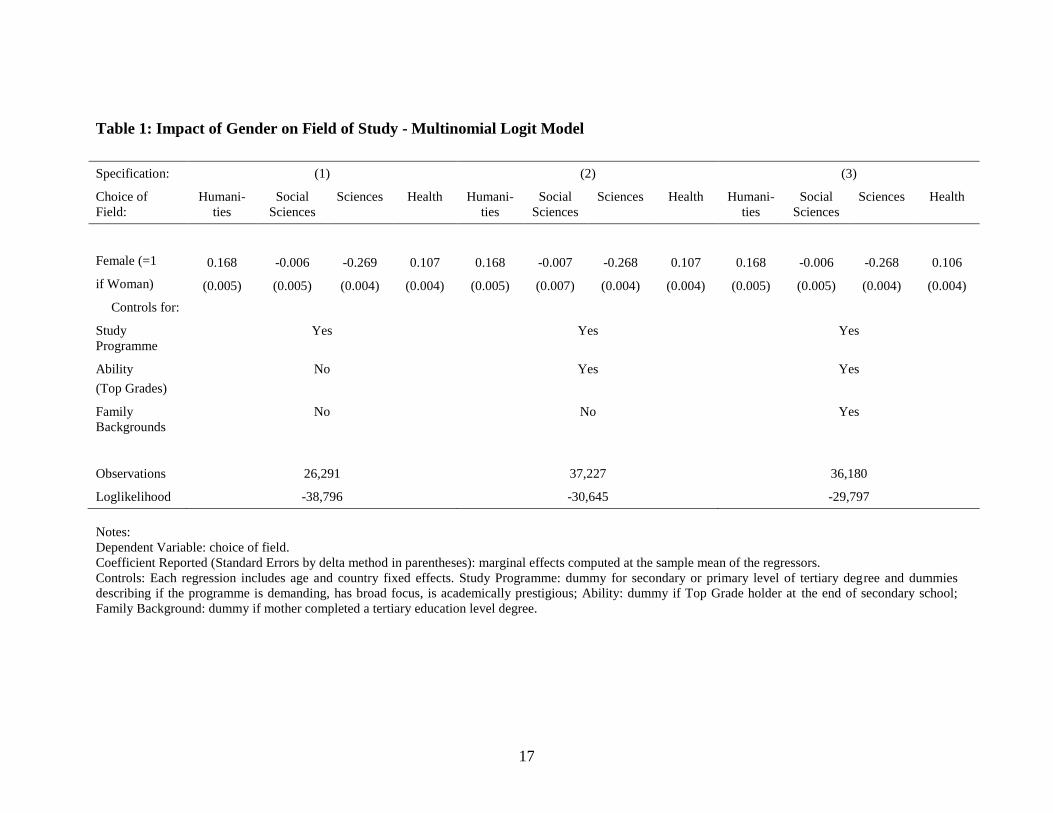
Table 1 reports the impact of gender on the choice of field of study based on a
Multinomial Logit model. Three specifications are presented depending on the inclusion
of controls for characteristics of the study programme (demanding, prestigious, with
broad focus), ability (as measured by grade at the end of Secondary school) and family
backgrounds (as measured by the mother's education level). Only the marginal effects of
the dummy female are reported in the Table. Notice that the introduction of controls
changes the sample size: this is due to missing values on the relative variables.12
Not surprisingly gender has a huge impact on the choice of the field of study: being
female - conditioning on controls - decreases the probability to choose Sciences by about
27 percentage points and increases the probability to choose Humanities by more than 16
percentage points. These effects are not sensitive to the addition of significant controls
for ability and family background. Moreover, they are not significantly different from the
point estimates obtained without any control (not reported). We can then conclude that
the impact of gender on the choice is not driven by selection on the other observable
individual characteristics.
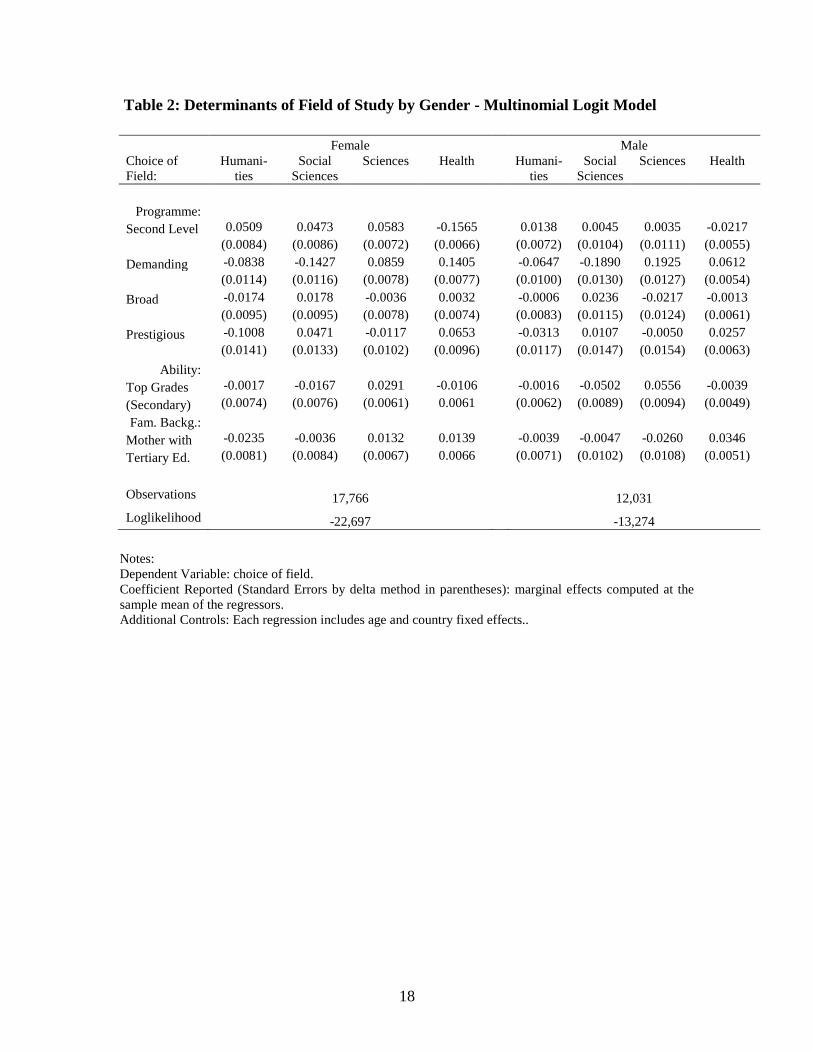
Table 2 reports results of the same model but estimated separately for men and
women. Only the richer specification (corresponding to specification (3) in Table 1) is
reported. For both men and women, a "demanding" programme has a positive impact on
choosing Sciences and Health but negative on choosing Humanities and Social Sciences.
Ability has a positive impact on choosing Sciences and the impact is much larger for men
than for women. Having a mother with College is correlated with a higher probability of
choosing Health for both genders and of choosing Sciences for women.
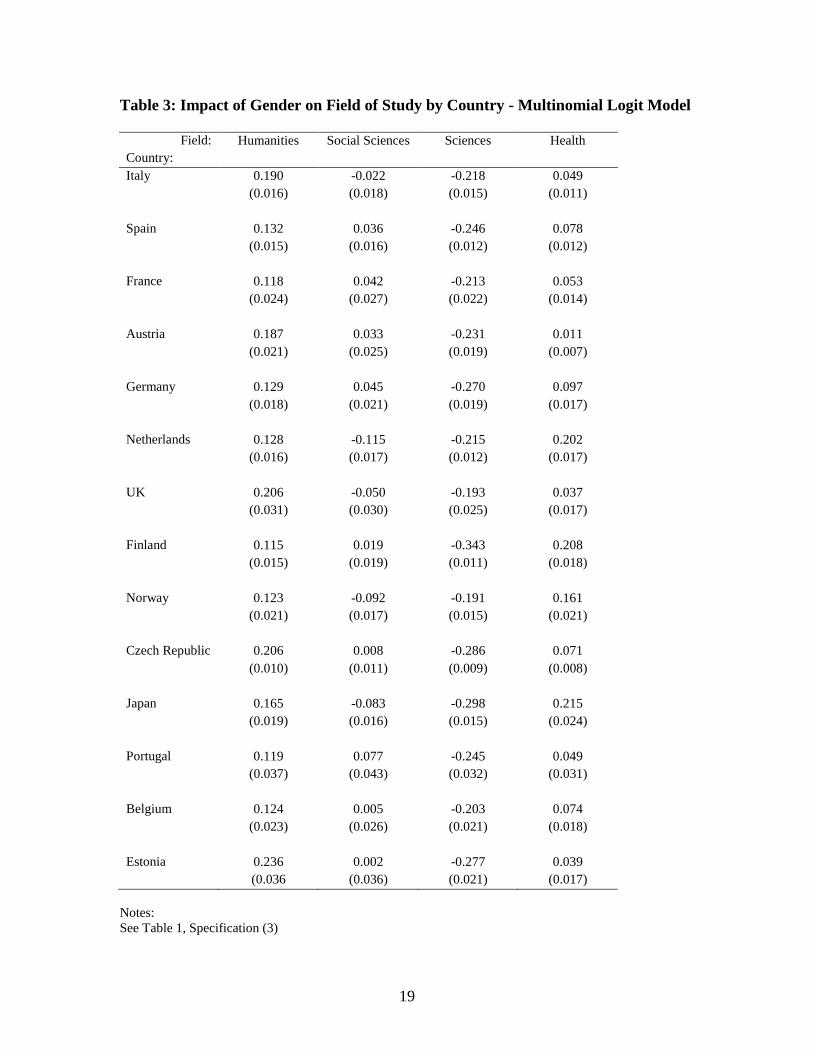
Table 3 reports some evidence at country level. The coefficients reported refer to a
multinomial logit regression run separately for each country. The specification includes
the full set of controls, i.e. it corresponds to same specification (3) in Table 1. Results are
10
Local labor market conditions are potentially important in this decision. However, they are not included
in the analysis because the REFLEX data set is sampling the same graduating cohort for a given country so
there is not enough information to identify any impact of labor market conditions. 11
The literature on the determinants of field of choice at the Tertiary level is extremely scarce due to lack
of data; one example is Arcidiacono (2004) using NLSY data for the US. A larger literature exists that look
at the determinant of acquiring an additional degree after Secondary education. This literature is developed
enough that works looking at gender differentials also exist, see for example Checchi and Flabbi (2007) and
Dustmann (2004) for evidence on Italy and Germany using PISA data. 12
The variables with the largest number of missing refer to the characteristics of the Programme. Also
variables relating to family background have a nontrivial number of missing: this is the reason why we use
only the mother education as control for family backgrounds. Using also the father education would have
reduced the sample size by a much larger margin, in particular on some countries (Czech Republic,
Estonia).
Page 9
9
strikingly similar across countries: being female - at same Programme characteristics,
ability, and family backgrounds - increases the probability to choose Humanities and
Health and decreases the probability to choose Sciences. This is the same result found on
the pooled sample. However, there are differences across countries with respect to the
sign of the impact on Social Sciences (either positive or negative depending on the
country) and with respect to the magnitudes of the effects. For example, the impact on
choosing the field Health ranges from a positive impact equal to about 21 percentage
points for Japan to a not significant impact for Portugal.
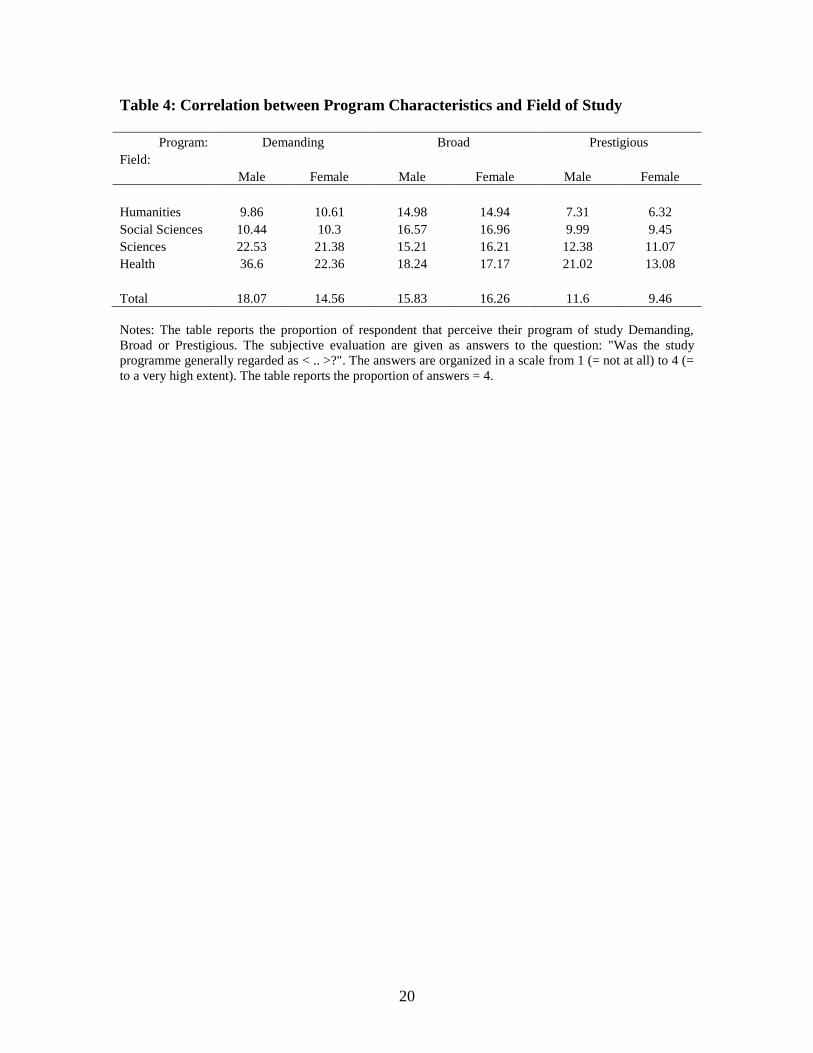
Since the perceived characteristics of the study programme seem to play a role in the
choice of the field and since they are a piece of information rarely available in large data
sets, Table 4 describes the correlation between the program characteristics and the field
of study. More than 20% of men and women regard study programmes in the field of
Sciences as very Demanding while only about 10% of the respondents express the same
judgment about study programmes in the field of Humanities. The same asymmetry is
reported with respect to judging a programme Prestigious while the judgement about the
Broad focus of a programme is more evenly distributed. If there are some asymmetries
across fields these asymmetries are not so large as to completing predict a field given a
program characteristics. Difference in judgment between genders are present but they are
not as large as to change the ranking of the fields, i.e. both men and women agree on
which fields are the most prestigious, demanding and broad.
Conclusion.
1. Gender is a significant determinant of the field of study: being female
increases the probability to choose Humanities and Health and decreases
the probability to choose Sciences and Social Sciences.
2. This result carries through also at the country-level.
3. The robustness of the impact across specifications suggests that the impact
of gender on the field choice is not driven by selection on the other
observable individual characteristics.
4. Looking at determinants by gender indicates that a "demanding"
Programme and a high grade in Secondary School are positively correlated
with choosing the field Sciences but negatively correlated with choosing
the field Humanities. Ability has a larger impact on men's decisions than
on women's decisions
Page 10
10
5. Gender Differentials in the Labor Market and Educational Choices
The next step of the analysis is studying if and to what extent educational choices
explain gender differentials in the labor market. The focus is on the most important
gender differential available in the data: the earnings differential. Preliminary to the
analysis on earnings, Figure 13 and 14 reports results on labor market status by gender.
Strong gender asymmetries in this respect may generate strong gender differences in the
selection of the samples of individual we observe working and therefore they should be
taken into account when comparing wages across genders. The large majority of both
men and women are employed at the time of the interview but gender asymmetries exist.
The proportion of graduates who are unemployed or out of the labor force is much larger
for women than men: about 4% of men are unemployed or out of the labor force as
opposed to about 10% of women. The same differential is present in all countries but the
magnitude is stronger on some countries than others. The differentials in participation
rates are particularly large in the Czech Republic, Austria, Germany, Finland and Japan.
Unemployment differentials are particularly large in Italy and Spain.
Table 5 reports the results of twelve log earnings regression. The first six regressions
are based on the current job and the last six on the first job after graduation. The only
coefficient reported is the one referring to the dummy female, i.e. the conditional
earnings differential between men and women. This first round of regressions has the
objective of studying the sensitivity of the differential with respect to the available and
relevant individual characteristics. On top of age, country fixed effects and the usual
controls for job characteristics (industry, occupation, self-employment, public sector) and
family background (education level of the parents), the model also includes controls for
ability based both on the secondary level and tertiary level degree grades and controls for
the field of study. The most interesting result is that the field of study implies a reduction
on the conditional differential on the current job. The conditional differential is about
10.3% when controlling for field but more than 12% when only age and country fixed
effects are present. Only controls for job characteristics imply an higher reduction in the
differentials. It is also important to notice that this wide range of controls explains a fair
amount of the overall earnings variation for the current job but much less of the variation
at the first job.
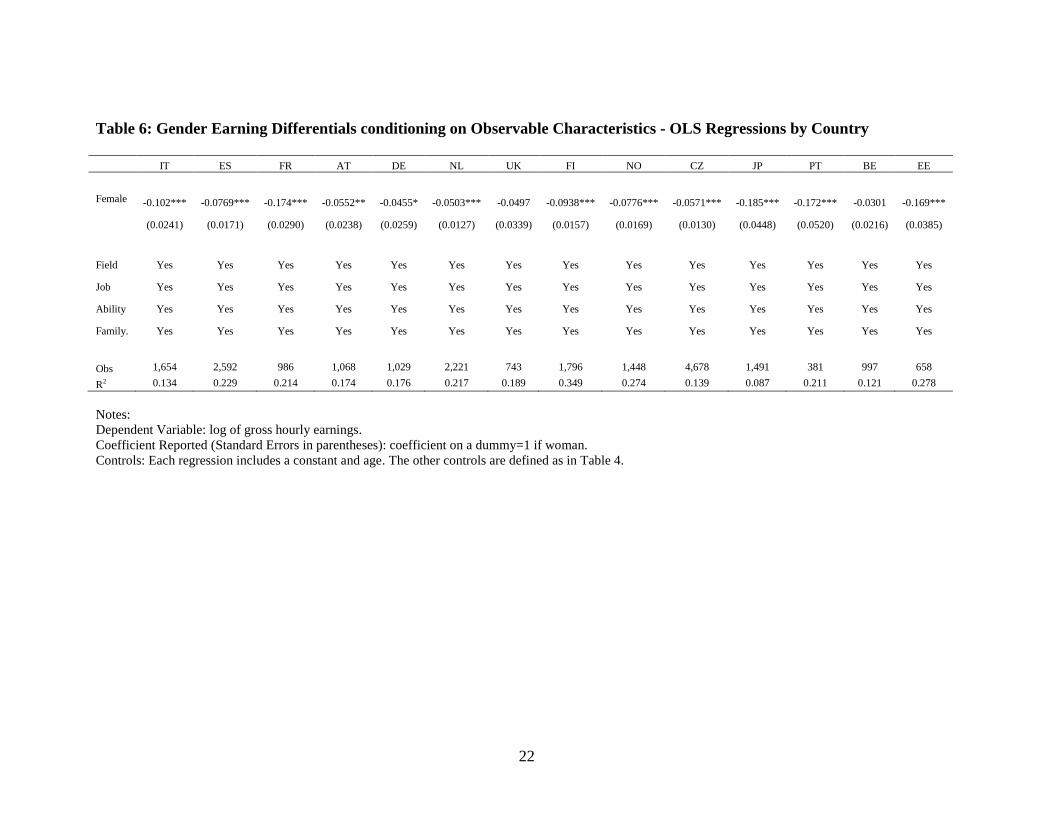
Table 6 reports results at country level; only the richer specification for the current
job is reported. Results show major differences across countries.13
If in all countries
13
This result is somewhat at odds with Allen and van der Velden (2007): they conclude their analysis
suggesting that across countries "similarities in outcomes are more striking than differences". Their
conclusion is in part driven by the fact that gender differentials do not take centre stage in their study.
Page 11
11
women earns less on average than men at same observable characteristics, the conditional
differentials ranges from about 18.5% for Portugal to 3% (and statistically not different
from zero) for Belgium.
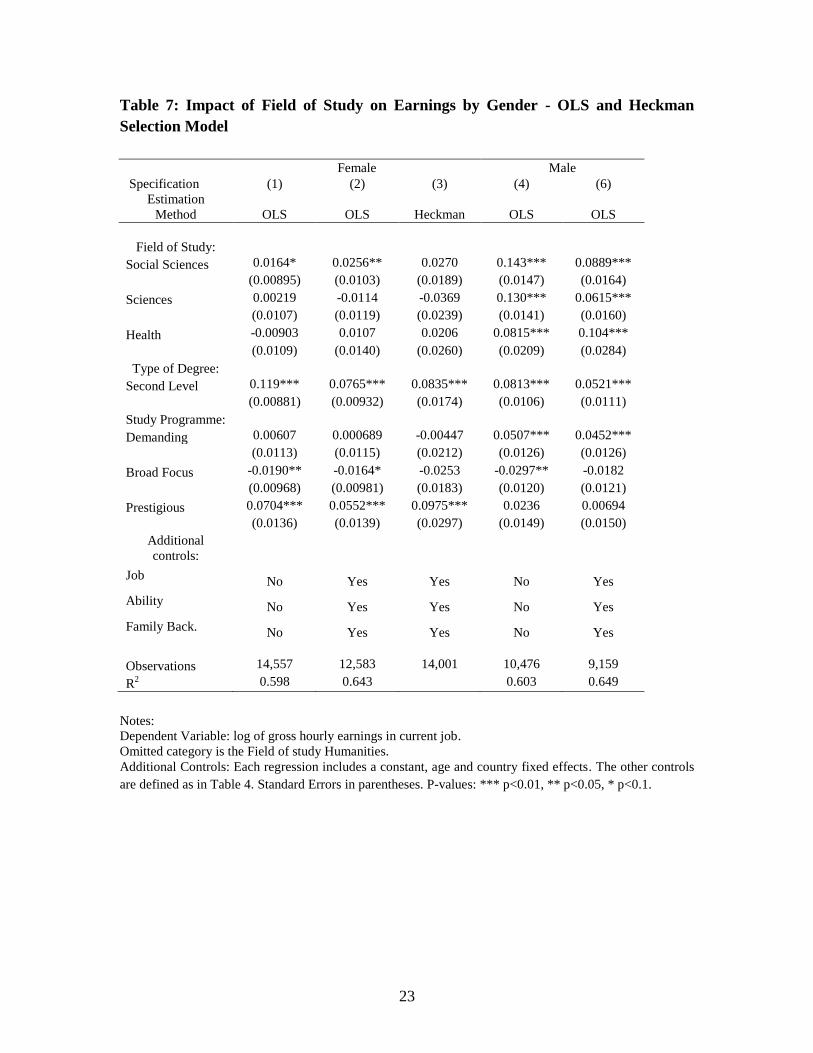
Table 7 reports results of the same log earnings regressions but estimated separately
for men and women. The results are very different between genders. On the male sample,
choosing any field which is not Humanities increases the wage of a significant amount,
from about 6% for Sciences to more than 10% for Health. On the female sample, only
social sciences significantly increase the wage with respect to Humanities, even if when
some sample selection bias correction is introduced (Heckman correction in column (3))
the difference becomes not statistically significant. Another asymmetry between man and
women refers to the characteristics of the Study programme: choosing a prestigious
programme has a positive and significant effect for women but not for men.
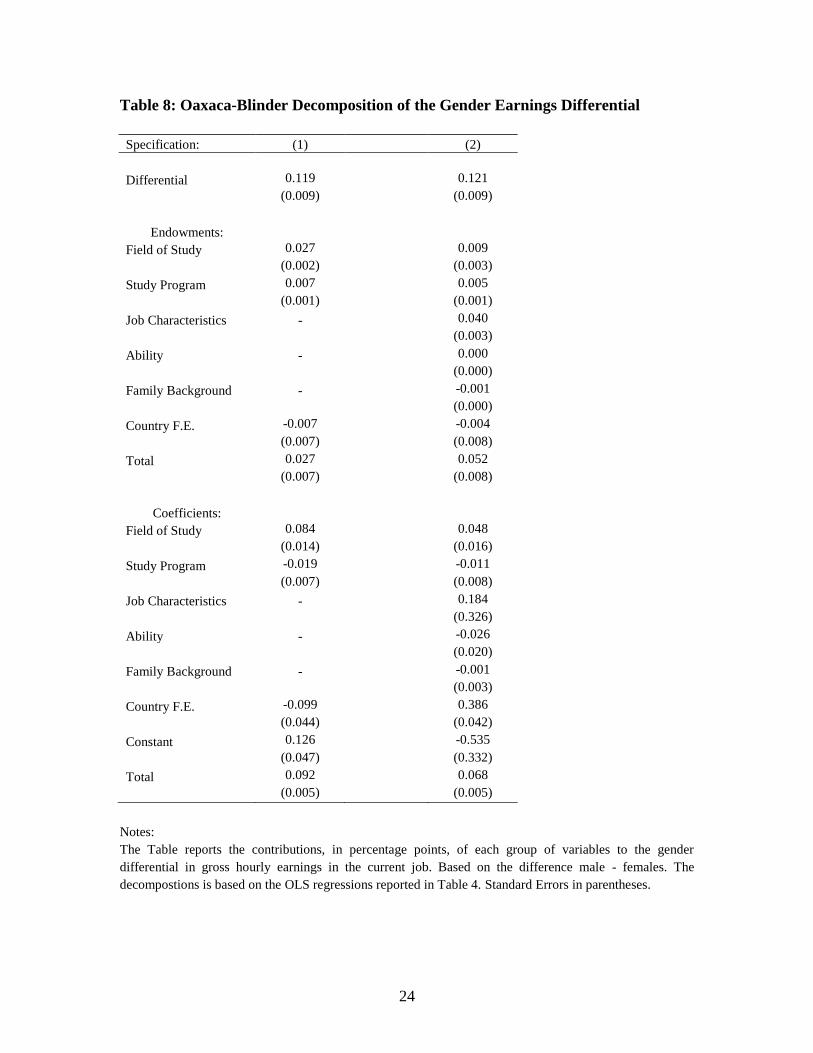
Table 8 reports an Oaxaca-Blinder decomposition based on the regressions in Table
5. The decomposition reports the contribution of each group of variables on the gender
differential as measured by the difference between the average earnings of men and the
average earning of women. The contribution of each group is split between the effect due
to the amount of the variable (the endowments) and the return on the variable (the
coefficients). The Table reports two specifications and the values are scaled to represent
percentage point. For example, looking at specification (1) we can conclude that most of
the differential is due to differences in returns: the coefficient explain 9.2 percentage
points out of the total 11.9 percentage points differential. The returns to the field of study
contribute a non-negligible amount to the differential, up to 4.8 percentage points in the
richer specification. The most important source of differential are the returns on job
characteristics, even though the large magnitude is very imprecisely estimated.
Conclusion.
1. The field of study is a significant but not major variable in explaining the earnings
gender differentials.
2. In all the measures presented - conditional earnings differentials, gender-specific
impact on earnings, Oaxaca-Blinder decomposition - the choice of field plays a
significant role but other factors, notably the returns on job characteristics play a
much more important role.
3. The estimates of gender-specific coefficients suggest that choosing a given field
has very different impacts on men and women.
4. Evidence at the country level shows a wide range of gender earnings differentials,
even if in all countries women experience a negative differential.
Page 12
12
6. The Relation between Choice of Field of Study and Choice of Occupation
Different occupations require different skills and different fields of study - even if at
exactly the same level of education - teach different skills. Finding and retaining a job,
therefore, is a matching process over multiple job characteristics and individual skills.
Not surprisingly, the analysis in the previous section has shown that the characteristics of
the job, described by occupation and industry dummies, are a significant determinant of
wages and that the returns on them may contribute about 18 percentage points to the
gender earnings differentials (see Table 8). If the choice of a field of study has a strong
impact on the future occupation, conversely a given occupation may have desirable
characteristics that induce a specific choice of field of study. This section of the paper
provides descriptive evidence on this dynamic and on how it differs by gender.
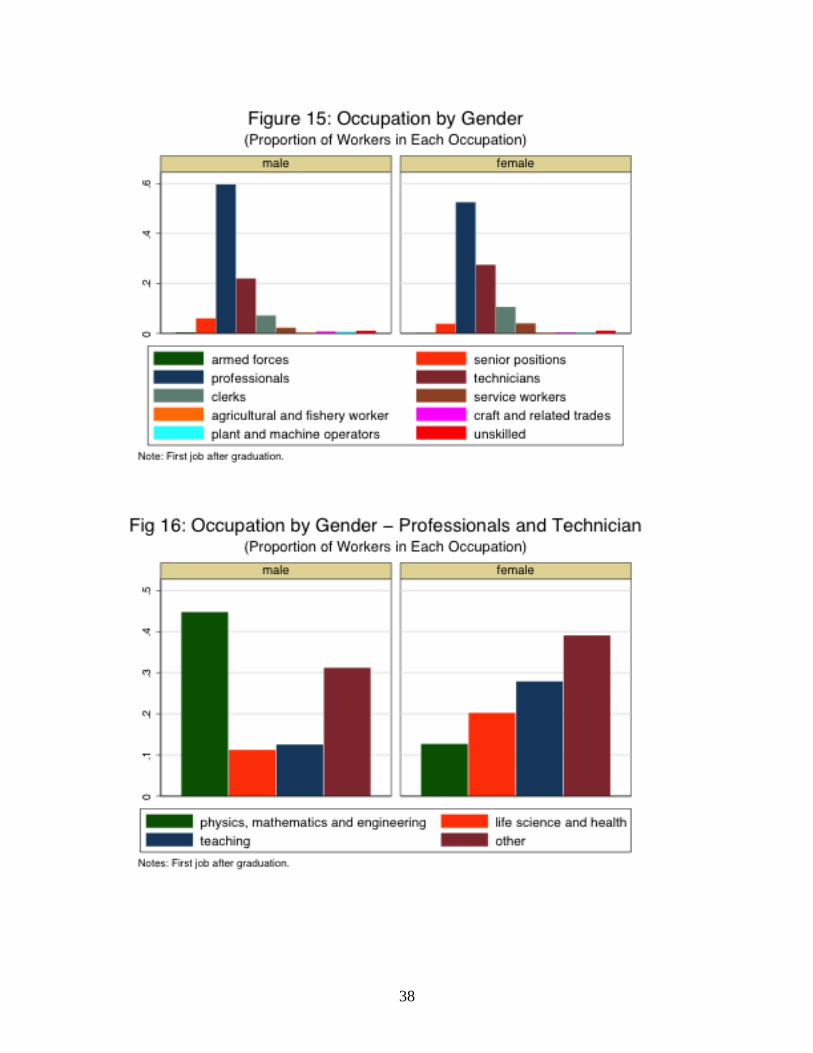
Figure 15 reports the distribution of male and female workers across occupations. The
occupations are defined following the major groups definitions from the International
Standard Classification of Occupations. Since the REFLEX sample includes only
individuals who graduated from a Tertiary level of education, we observe that the first
job they accept after graduation is usually in a skilled occupation: most of men and
women work as professionals or skilled technicians with a few holding less skilled
positions (mainly clerks) and a negligible minority more senior positions. Within these
four occupation choices, more men than women work in senior and professional positions
while more women than men work as technicians or clerks.
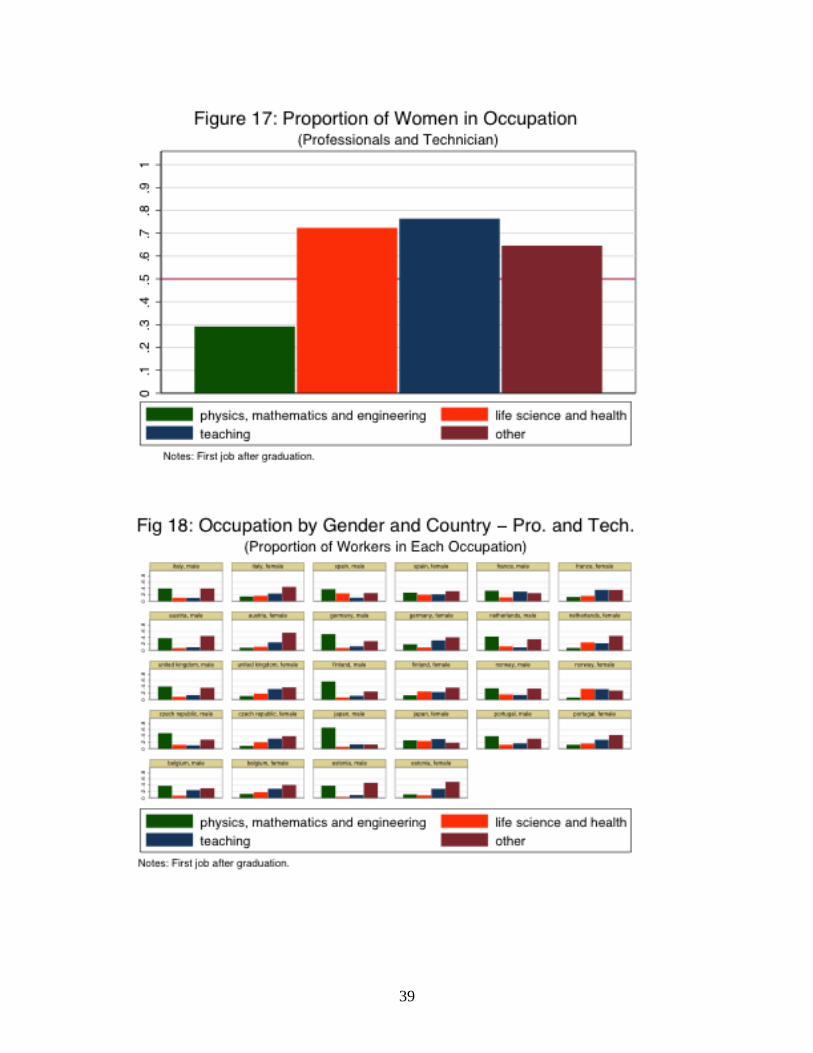
Since the occupations professionals and skilled technicians cover more than 80% the
occupational choices, Figure 16 and 17 focus only on these two categories. The Figures
report the distributions over occupations defined as sub-major groups from the
International Standard Classification of Occupations. At this level of aggregation the
gender asymmetry becomes stark. If more than 40% of men work in occupations related
to physics, mathematics and engineering only a little more than 10% of women do.
Women, instead, are concentrated in teaching occupations: almost 30% of women work
as teacher and more than 70% of teachers are women. A large proportion of both men
and women are employed in occupations labeled as other. The other category is very
heterogeneous and it includes jobs as different as creative writers and financial brokers.
Within this occupation, both men and women concentrate in jobs described as business,
legal, finance and administrative professionals.
Figure 18 presents some evidence at country-level. The Figure reports the same
evidence presented in Figure 16 on the pooled sample: distributions over occupations
defined as sub-major groups among the professionals and skilled technicians. All
countries show large differences by gender and confirm the results found on the pooled
Page 13
13
sample: men are concentrated in physics, mathematics and engineering and women in
teaching; the other category is chosen by a significant proportion of individuals of both
genders. Some countries experience particularly strong asymmetries: in Japan the
concentration of men in physics, mathematics and engineering reaches about 60%; in
France the proportion of women choosing a teaching profession reaches about 40%.
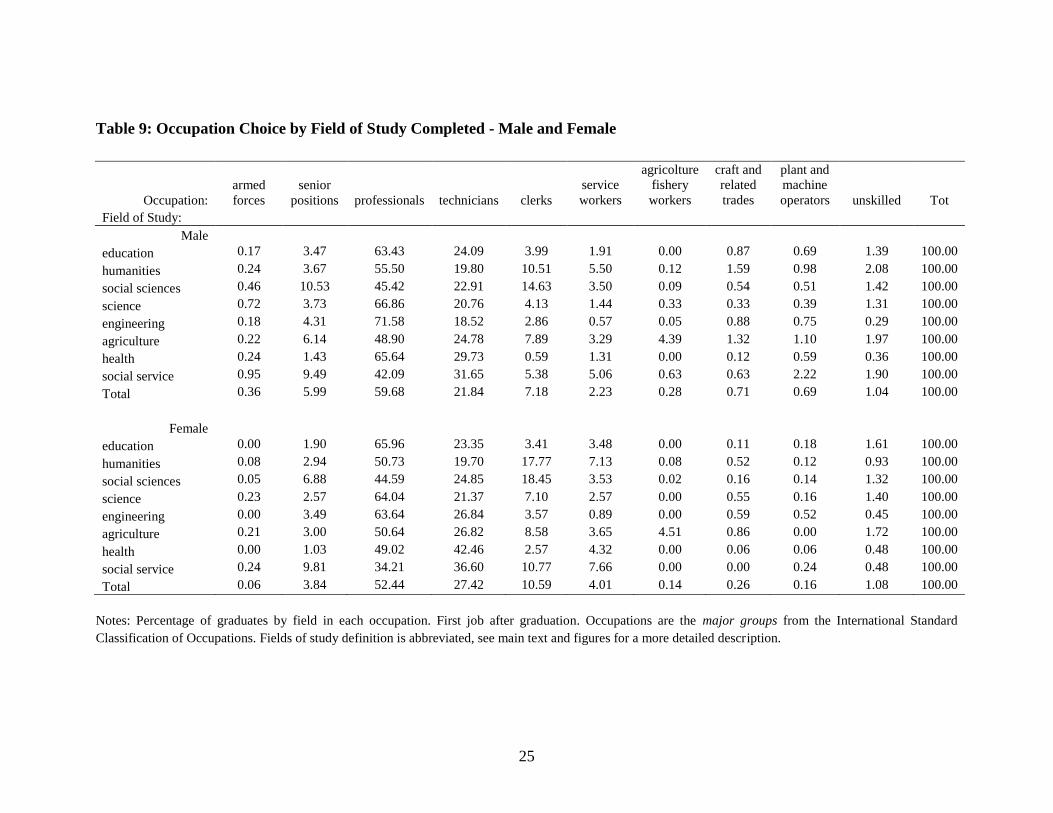
Table 9 concentrates on the mapping from Fields of Study to Occupation. Each row
reports how many graduates (in percentage) from a given field of education work in a
given occupation. The data refers to the first job after graduation. As in the previous
figures we observe a very high concentration in professionals and skilled technicians jobs
for both men and women. Engineering and science are the fields where most graduates
tend to work as professionals (about 60/70% of them) while humanities, social sciences
and social services are the fields where fewer graduates tend to work as professionals
(about 40/50%). This variation across fields suggests that there actually is an important
correlation between field of study and occupation but that this correlation is not dramatic
at this level of aggregation. Moreover, it does not seem to significantly differ by gender.
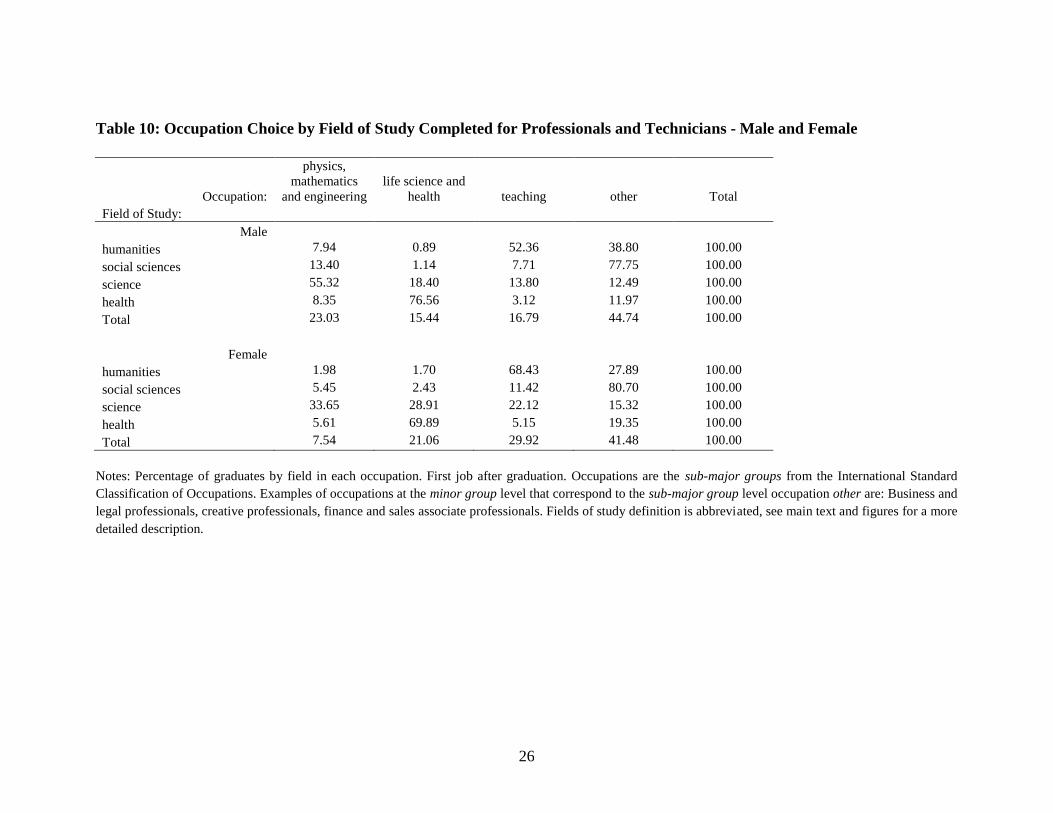
When we look only at professionals and technicians we start to observe starker
asymmetries by gender. Table 10 reports correlations between aggregate fields of study
and the four categories in which the occupations professionals and skilled technicians are
organized. Almost 70% of the female graduates from the field humanities work as
teachers compared to about 50% of the male graduates. The majority (about 55%) of the
male graduates from the science field work as professional in physics, mathematics and
engineering as opposed to 33% of the female graduates. Overall only 7.5% of women
work in these fields while physics, mathematics and engineering is the second favourite
field for men. Women, instead, are highly concentrated in teaching professions. This
level of disaggregation shows stronger differences by gender and stronger correlations
between field of study and occupations than those found at a more aggregate level in
Table 9.
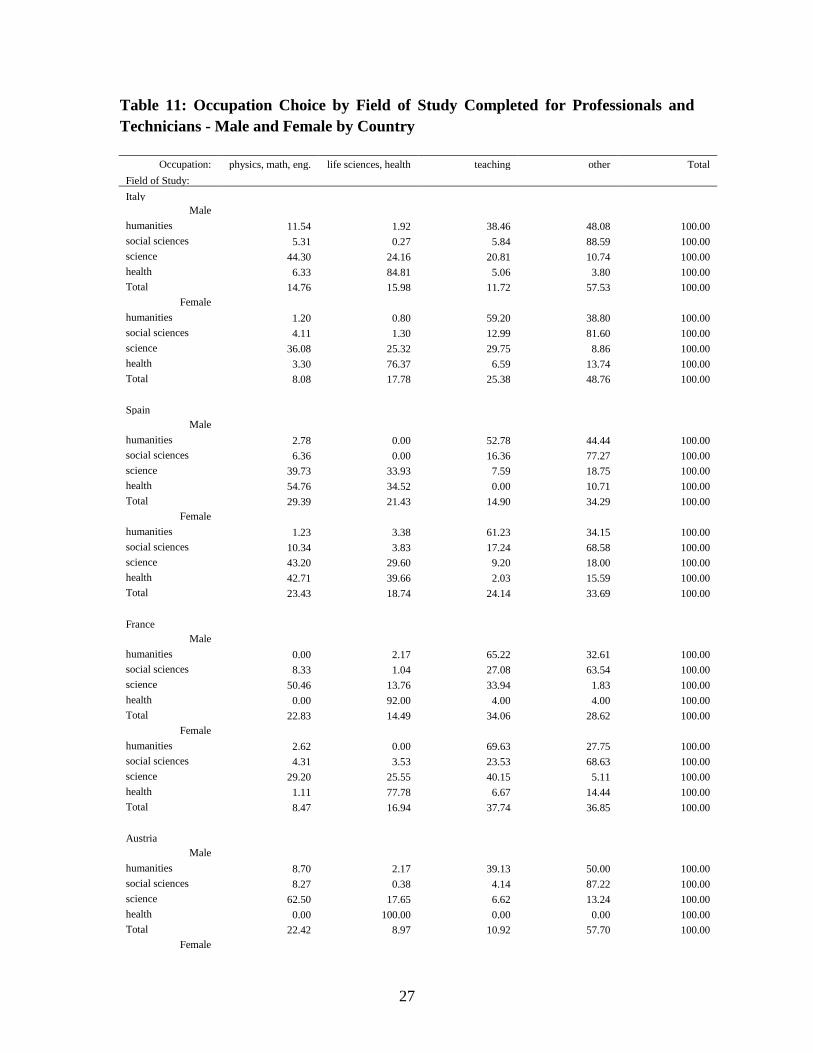
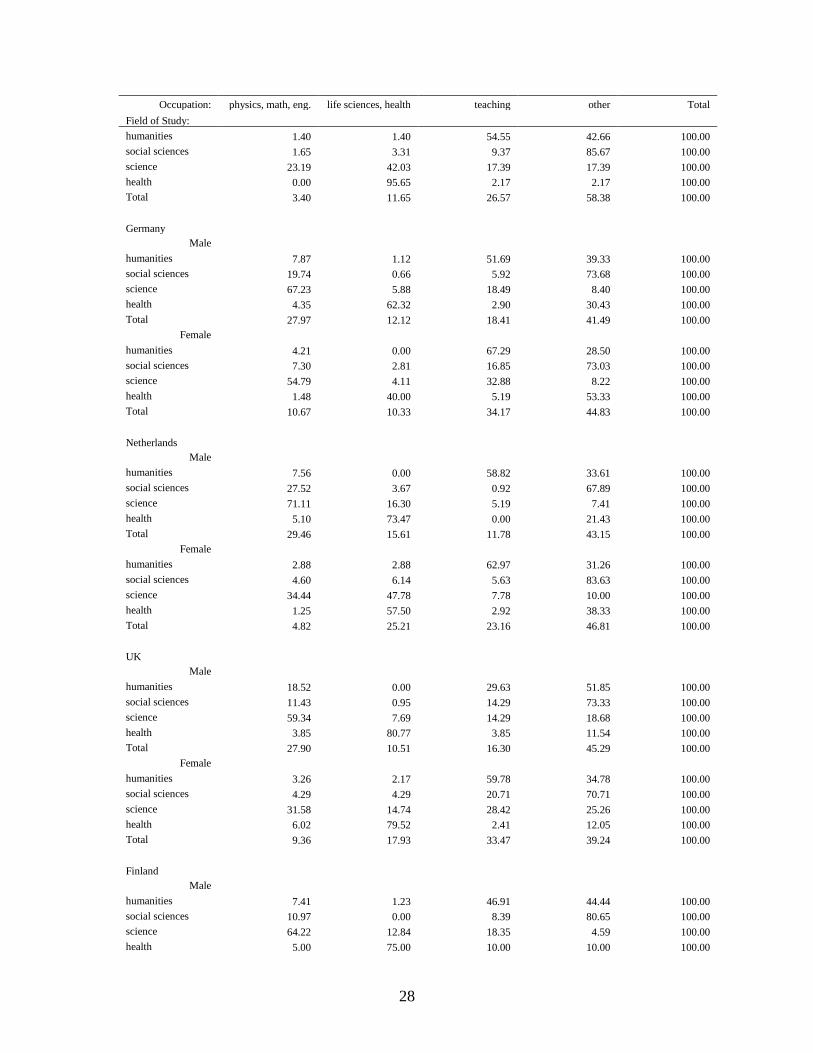
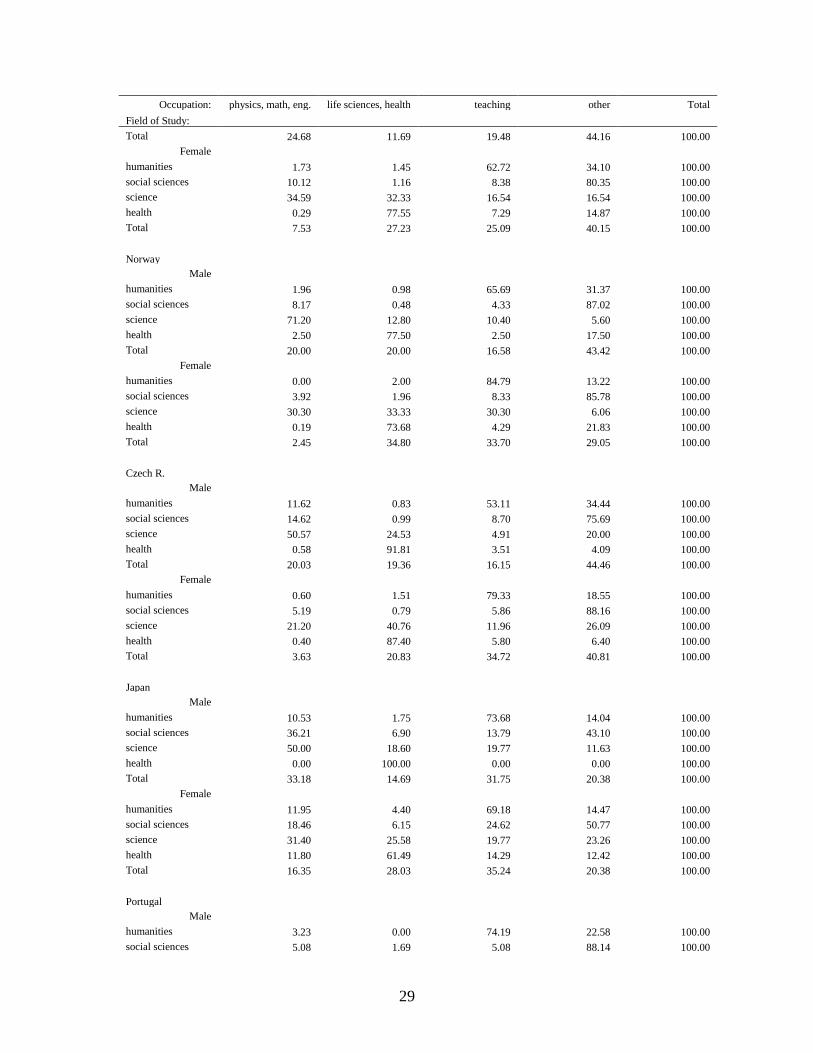
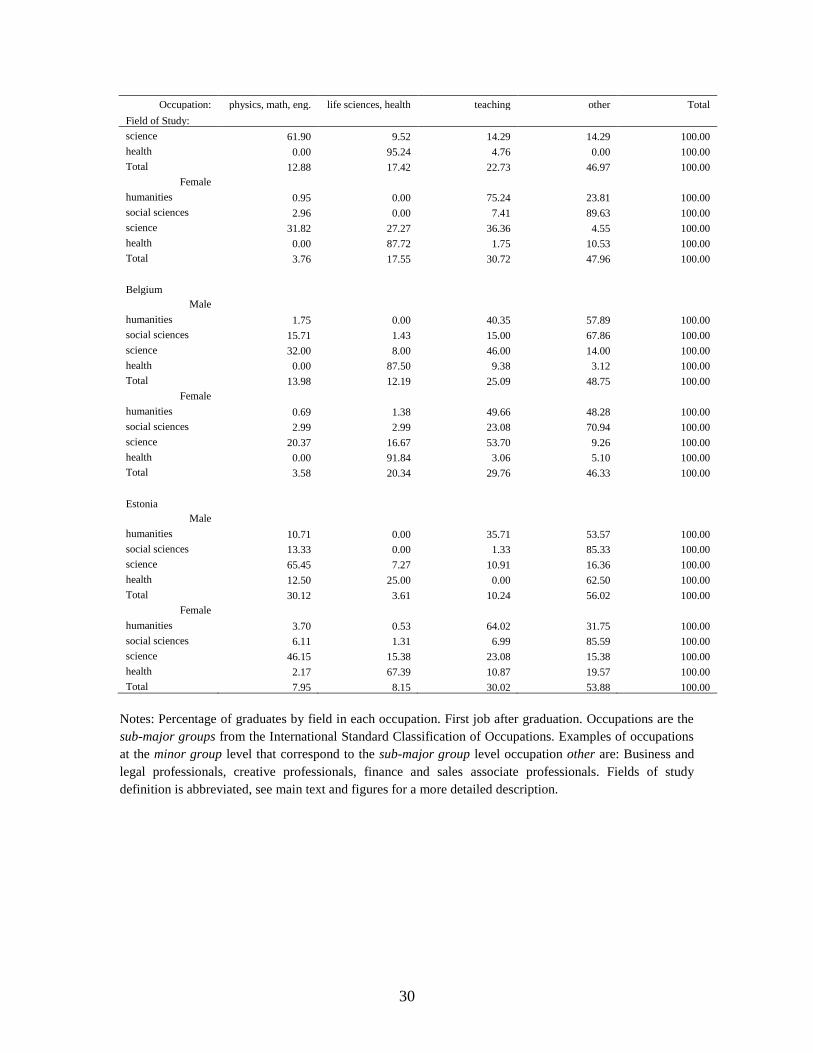
Table 11 reports evidence on each country at the same level of disaggregation of
Table 10. In all countries women are concentrated in teaching professions but in some
countries this is true on the male sample as well (Belgium and France). The concentration
of men in physics, mathematics and engineering occupations is also confirmed, with
some variation across countries: Japan reaches 33%, Belgium only 14%. The dimension
over which both the pooled samples and the country levels samples show similarities
across gender is the high proportion of individuals choosing the field other. This is a sort
of residual category in the sub-major group of occupations defined by the International
Standard Classification of Occupations (which is the standard used in the REFLEX
survey). It includes professions as different as Business and legal professionals, creative
Page 14
14
professionals, finance and sales associate professionals. This category is therefore likely
to mask additional asymmetries between genders.
Conclusion.
1. There are asymmetries in the occupation choices of men and women but they
become really stark and important at relative fine level of occupation
disaggregation.
2. Most of the differences concern teaching occupations and professions related to
physics, mathematics and engineering: almost 30% of women teach as a
profession as opposed to about 12% of men. As a result, more than 70% of
teachers are women. More than 40% of men work in physics, mathematics and
engineering professions as opposed to little more than 10% for women.
3. The correlation between field of study and occupation is not very strong at the
major group of occupation level since most of the graduates work as
professionals or technicians.
4. However, when we look within the professionals and technicians occupations, the
correlation between field of study and occupation becomes strong and significant.
5. The asymmetries by gender are also stronger when we look within the
professionals and technicians occupations. One possible interpretation of this
result is that the teaching professions are crowding-out all the other occupations in
the sample of women.
6. This overall evidence is substantially confirmed at the country level.
5. Conclusion
This paper focuses on describing and analyzing gender asymmetries in the
interactions between labor market outcomes and education choices for 14 OECD
countries: Austria, Belgium (only Flanders), Finland, France, Germany, Italy, the
Netherlands, Norway, Spain, UK, Czech Republic, Portugal, Japan and Estonia.
The analysis requires a data set comparable across countries and containing detailed
information on the type of education acquired by the individuals. The Flexible
Professional in the Knowledge Society (REFLEX) data set is one of the few available
data set that satisfies these criteria. The data set focuses on graduates from higher
education that have about 5 years of experience since completing their ISCED 5A level
degree (equivalent to a College B.A. or a Master in most countries) in 2000.
The main conclusions of the analysis are the following. They describe results that are
on average common to all the countries considered in the study.
Page 15
15
1. Gender Differentials in Education Choices. Women acquire a little more tertiary
education than men. There are significant differences in the choice of field of
study by gender: women are the majority of graduates in Education, Humanities,
and Health while men are the majority of graduates in the fields of Engineering
and Architecture. Grade performance upon graduation varies widely across fields:
men and women have a similar performance in Sciences and Social Sciences
while women perform better in the Humanities and men in the field Health.
2. Gender-Specific Determinants of Education Choices. Gender is a significant
determinant of the field of study even after controlling for detailed individuals
characteristics: being female increases the probability to choose Humanities and
Health and decreases the probability to choose Sciences and Social Sciences.
Ability has a larger impact on men's decisions about the field of study than on
women's decisions.
3. Gender Differentials in the Labor Market and Educational Choices. The field of
study is a significant but not major variable in explaining the earnings gender
differentials; other factors - notably, the returns on job characteristics - play a
much more important role. Choosing a given field has very different impacts on
men and women.
4. Relation between Choice of Field of Study and Choice of Occupation. Since job
characteristics may be a function of the field of study, the actual identification of
the causal impact of field of study on labor market gender differentials remains an
open question. However, providing descriptive evidence on the relation between
field of study and occupation may help to clarify the issue. I find that the
correlation between field of study and occupation is strong and significant only
within occupations defined as professionals and technicians. These occupations
employ more than 80% of Tertiary School graduates. With respect to occupation
choices most of the differences between men and women concern teaching
occupations and professions related to physics, mathematics and engineering.
Page 16
16
REFERENCES
Allen, J. and R. van der Velden (eds.) (2007), "The Flexible Professional in the
Knowledge Society: General Results of the REFLEX Project," Research Centre
for Education and the Labour Market, Maastricht University, The Netherlands.
Arcidiacono, P. (2004), "Ability sorting and the returns to college major," Journal of
Econometrics, 121: 343-375.
Becker, G., W. Hubbard, and K. Murphy (2009), "Explaining The Worldwide Boom in
Higher Education of Women", mimeo, University of Chicago.
Beffy, M., D. Fougère and A. Maurel (2009), "Choosing the Field of Study in Post-
Secondary Education: Do Expected Earnings Matter?", IZA Discussion Paper
4127.
Blau, F. and L. Kahn (2006), “The US Gender Pay Gap in the 1990s: Slowing
Convergence,” Industrial and Labor Relations Review.
Blau, F. and L. Kahn (2003), “Understanding International Differences in the Gender Pay
Gap,” Journal of Labor Economics.
Checchi, D. and L. Flabbi (2007), " Intergenerational Mobility and Schooling Decisions
in Germany and Italy: The Impact of Secondary School Tracks," IZA Discussion
Paper 2876.
Daymont, T. and Andrisani, P. (1984), "Job preferences, college major, and the gender
gap in earnings," Journal of Human Resources 19: 408–428.
Flabbi, L. (2010), "Prejudice and Gender Differentials in the U.S. Labor Market in the
Last Twenty Years," Journal of Econometrics, 156: 190-200.
McGuinness, S. and P. Sloane (2009), "Labour Market Mismatch Among UK Graduates:
An Analysis Using REFLEX Data," IZA Discussion Paper 4168.
OECD (2008), Education at a Glance 2008, OECD: Paris.
Page 17
17
Table 1: Impact of Gender on Field of Study - Multinomial Logit Model
Specification: (1) (2) (3)
Choice of
Field:
Humani-
ties
Social
Sciences
Sciences Health Humani-
ties
Social
Sciences
Sciences Health Humani-
ties
Social
Sciences
Sciences Health
Female (=1 0.168 -0.006 -0.269 0.107 0.168 -0.007 -0.268 0.107 0.168 -0.006 -0.268 0.106
if Woman) (0.005) (0.005) (0.004) (0.004) (0.005) (0.007) (0.004) (0.004) (0.005) (0.005) (0.004) (0.004)
Controls for:
Study
Programme
Yes Yes Yes
Ability
(Top Grades)
No Yes Yes
Family
Backgrounds
No No Yes
Observations 26,291 37,227 36,180
Loglikelihood -38,796 -30,645 -29,797
Notes:
Dependent Variable: choice of field.
Coefficient Reported (Standard Errors by delta method in parentheses): marginal effects computed at the sample mean of the regressors.
Controls: Each regression includes age and country fixed effects. Study Programme: dummy for secondary or primary level of tertiary degree and dummies
describing if the programme is demanding, has broad focus, is academically prestigious; Ability: dummy if Top Grade holder at the end of secondary school;
Family Background: dummy if mother completed a tertiary education level degree.
Page 18
18
Table 2: Determinants of Field of Study by Gender - Multinomial Logit Model
Female Male
Choice of
Field:
Humani-
ties
Social
Sciences
Sciences Health
Humani-
ties
Social
Sciences
Sciences Health
Programme:
Second Level 0.0509 0.0473 0.0583 -0.1565 0.0138 0.0045 0.0035 -0.0217
(0.0084) (0.0086) (0.0072) (0.0066) (0.0072) (0.0104) (0.0111) (0.0055)
Demanding -0.0838 -0.1427 0.0859 0.1405 -0.0647 -0.1890 0.1925 0.0612
(0.0114) (0.0116) (0.0078) (0.0077) (0.0100) (0.0130) (0.0127) (0.0054)
Broad -0.0174 0.0178 -0.0036 0.0032 -0.0006 0.0236 -0.0217 -0.0013
(0.0095) (0.0095) (0.0078) (0.0074) (0.0083) (0.0115) (0.0124) (0.0061)
Prestigious -0.1008 0.0471 -0.0117 0.0653 -0.0313 0.0107 -0.0050 0.0257
(0.0141) (0.0133) (0.0102) (0.0096) (0.0117) (0.0147) (0.0154) (0.0063)
Ability:
Top Grades -0.0017 -0.0167 0.0291 -0.0106 -0.0016 -0.0502 0.0556 -0.0039
(Secondary) (0.0074) (0.0076) (0.0061) 0.0061 (0.0062) (0.0089) (0.0094) (0.0049)
Fam. Backg.:
Mother with -0.0235 -0.0036 0.0132 0.0139 -0.0039 -0.0047 -0.0260 0.0346
Tertiary Ed. (0.0081) (0.0084) (0.0067) 0.0066 (0.0071) (0.0102) (0.0108) (0.0051)
Observations 17,766 12,031
Loglikelihood -22,697 -13,274
Notes:
Dependent Variable: choice of field.
Coefficient Reported (Standard Errors by delta method in parentheses): marginal effects computed at the
sample mean of the regressors.
Additional Controls: Each regression includes age and country fixed effects..
Page 19
19
Table 3: Impact of Gender on Field of Study by Country - Multinomial Logit Model
Field: Humanities Social Sciences Sciences Health
Country:
Italy 0.190 -0.022 -0.218 0.049
(0.016) (0.018) (0.015) (0.011)
Spain 0.132 0.036 -0.246 0.078
(0.015) (0.016) (0.012) (0.012)
France 0.118 0.042 -0.213 0.053
(0.024) (0.027) (0.022) (0.014)
Austria 0.187 0.033 -0.231 0.011
(0.021) (0.025) (0.019) (0.007)
Germany 0.129 0.045 -0.270 0.097
(0.018) (0.021) (0.019) (0.017)
Netherlands 0.128 -0.115 -0.215 0.202
(0.016) (0.017) (0.012) (0.017)
UK 0.206 -0.050 -0.193 0.037
(0.031) (0.030) (0.025) (0.017)
Finland 0.115 0.019 -0.343 0.208
(0.015) (0.019) (0.011) (0.018)
Norway 0.123 -0.092 -0.191 0.161
(0.021) (0.017) (0.015) (0.021)
Czech Republic 0.206 0.008 -0.286 0.071
(0.010) (0.011) (0.009) (0.008)
Japan 0.165 -0.083 -0.298 0.215
(0.019) (0.016) (0.015) (0.024)
Portugal 0.119 0.077 -0.245 0.049
(0.037) (0.043) (0.032) (0.031)
Belgium 0.124 0.005 -0.203 0.074
(0.023) (0.026) (0.021) (0.018)
Estonia 0.236 0.002 -0.277 0.039
(0.036 (0.036) (0.021) (0.017)
Notes:
See Table 1, Specification (3)
Page 20
20
Table 4: Correlation between Program Characteristics and Field of Study
Program: Demanding Broad Prestigious
Field:
Male Female Male Female Male Female
Humanities 9.86 10.61 14.98 14.94 7.31 6.32
Social Sciences 10.44 10.3 16.57 16.96 9.99 9.45
Sciences 22.53 21.38 15.21 16.21 12.38 11.07
Health 36.6 22.36 18.24 17.17 21.02 13.08
Total 18.07 14.56 15.83 16.26 11.6 9.46
Notes: The table reports the proportion of respondent that perceive their program of study Demanding,
Broad or Prestigious. The subjective evaluation are given as answers to the question: "Was the study
programme generally regarded as < .. >?". The answers are organized in a scale from 1 (= not at all) to 4 (=
to a very high extent). The table reports the proportion of answers = 4.
Page 21
21
Table 5: Sensitivity of Gender Earning Differentials with respect to Observable Characteristics - OLS Regressions
Current Job First Job
Specifications: (1) (2) (3) (4) (5) (6) (1) (2) (3) (4) (5) (6)
Female -0.122*** -0.103*** -0.0874*** -0.121*** -0.122*** -0.0833*** -0.104*** -0.0932*** -0.0919*** -0.103*** -0.107*** -0.0886***
(0.00552) (0.00600) (0.00568) (0.00568) (0.00558) (0.00618) (0.00914) (0.00995) (0.00967) (0.00949) (0.00931) (0.0107)
Controls:
Field of Study No Yes No No No Yes No Yes No No No Yes
Job No No Yes No No Yes No No Yes No No Yes
Ability No No No Yes No Yes No No No Yes No Yes
Family Back. No No No No Yes Yes No No No No Yes Yes
Observations 25,737 24,906 24,262 24,298 25,119 21,742 20,655 20,119 20,032 19,504 20,037 17,979
R2
0.599 0.604 0.640 0.600 0.603 0.644 0.356 0.358 0.371 0.353 0.355 0.367
Notes:
Dependent Variable: log of gross hourly earnings.
Coefficient Reported (Standard Errors in parentheses): coefficient on a dummy=1 if woman.
Controls: Each regression includes a constant, age and country fixed effects. The other controls are defined as follows. Field of Study: dummy for secondary or
primary level of tertiary degree, 4 dummies for aggregate field of study and dummies describing if the programme is demanding, has broad focus, is
academically prestigious; Job Characteristics : 8 dummies for occupation; 8 dummies for industry; dummy if self-emplyed; dummy if in Public sector; Ability:
dummy if top grades at the end secondary school, dummy for quartile of grade at the end of tertiary school; Family Background: dummy if mother has completed
tertiary education.
Page 22
22
Table 6: Gender Earning Differentials conditioning on Observable Characteristics - OLS Regressions by Country
IT ES FR AT DE NL UK FI NO CZ JP PT BE EE
Female -0.102*** -0.0769*** -0.174*** -0.0552** -0.0455* -0.0503*** -0.0497 -0.0938*** -0.0776*** -0.0571*** -0.185*** -0.172*** -0.0301 -0.169***
(0.0241) (0.0171) (0.0290) (0.0238) (0.0259) (0.0127) (0.0339) (0.0157) (0.0169) (0.0130) (0.0448) (0.0520) (0.0216) (0.0385)
Field Yes Yes Yes Yes Yes Yes Yes Yes Yes Yes Yes Yes Yes Yes
Job Yes Yes Yes Yes Yes Yes Yes Yes Yes Yes Yes Yes Yes Yes
Ability Yes Yes Yes Yes Yes Yes Yes Yes Yes Yes Yes Yes Yes Yes
Family. Yes Yes Yes Yes Yes Yes Yes Yes Yes Yes Yes Yes Yes Yes
Obs 1,654 2,592 986 1,068 1,029 2,221 743 1,796 1,448 4,678 1,491 381 997 658
R2 0.134 0.229 0.214 0.174 0.176 0.217 0.189 0.349 0.274 0.139 0.087 0.211 0.121 0.278
Notes:
Dependent Variable: log of gross hourly earnings.
Coefficient Reported (Standard Errors in parentheses): coefficient on a dummy=1 if woman.
Controls: Each regression includes a constant and age. The other controls are defined as in Table 4.
Page 23
23
Table 7: Impact of Field of Study on Earnings by Gender - OLS and Heckman
Selection Model
Female Male
Specification (1) (2) (3) (4) (6)
Estimation
Method OLS OLS Heckman OLS OLS
Field of Study:
Social Sciences 0.0164* 0.0256** 0.0270 0.143*** 0.0889***
(0.00895) (0.0103) (0.0189) (0.0147) (0.0164)
Sciences 0.00219 -0.0114 -0.0369 0.130*** 0.0615***
(0.0107) (0.0119) (0.0239) (0.0141) (0.0160)
Health -0.00903 0.0107 0.0206 0.0815*** 0.104***
(0.0109) (0.0140) (0.0260) (0.0209) (0.0284)
Type of Degree:
Second Level 0.119*** 0.0765*** 0.0835*** 0.0813*** 0.0521***
(0.00881) (0.00932) (0.0174) (0.0106) (0.0111)
Study Programme:
Demanding 0.00607 0.000689 -0.00447 0.0507*** 0.0452***
(0.0113) (0.0115) (0.0212) (0.0126) (0.0126)
Broad Focus -0.0190** -0.0164* -0.0253 -0.0297** -0.0182
(0.00968) (0.00981) (0.0183) (0.0120) (0.0121)
Prestigious 0.0704*** 0.0552*** 0.0975*** 0.0236 0.00694
(0.0136) (0.0139) (0.0297) (0.0149) (0.0150)
Additional
controls:
Job No Yes Yes No Yes
Ability No Yes Yes No Yes
Family Back. No Yes Yes No Yes
Observations 14,557 12,583 14,001 10,476 9,159
R2 0.598 0.643 0.603 0.649
Notes:
Dependent Variable: log of gross hourly earnings in current job.
Omitted category is the Field of study Humanities.
Additional Controls: Each regression includes a constant, age and country fixed effects. The other controls
are defined as in Table 4. Standard Errors in parentheses. P-values: *** p<0.01, ** p<0.05, * p<0.1.
Page 24
24
Table 8: Oaxaca-Blinder Decomposition of the Gender Earnings Differential
Specification: (1) (2)
Differential 0.119 0.121
(0.009) (0.009)
Endowments:
Field of Study 0.027 0.009
(0.002) (0.003)
Study Program 0.007 0.005
(0.001) (0.001)
Job Characteristics - 0.040
(0.003)
Ability - 0.000
(0.000)
Family Background - -0.001
(0.000)
Country F.E. -0.007 -0.004
(0.007) (0.008)
Total 0.027 0.052
(0.007) (0.008)
Coefficients:
Field of Study 0.084 0.048
(0.014) (0.016)
Study Program -0.019 -0.011
(0.007) (0.008)
Job Characteristics - 0.184
(0.326)
Ability - -0.026
(0.020)
Family Background - -0.001
(0.003)
Country F.E. -0.099 0.386
(0.044) (0.042)
Constant 0.126 -0.535
(0.047) (0.332)
Total 0.092 0.068
(0.005) (0.005)
Notes:
The Table reports the contributions, in percentage points, of each group of variables to the gender
differential in gross hourly earnings in the current job. Based on the difference male - females. The
decompostions is based on the OLS regressions reported in Table 4. Standard Errors in parentheses.
Page 25
25
Table 9: Occupation Choice by Field of Study Completed - Male and Female
Occupation:
armed
forces
senior
positions professionals technicians clerks
service
workers
agricolture
fishery
workers
craft and
related
trades
plant and
machine
operators unskilled Tot
Field of Study:
Male
education 0.17 3.47 63.43 24.09 3.99 1.91 0.00 0.87 0.69 1.39 100.00
humanities 0.24 3.67 55.50 19.80 10.51 5.50 0.12 1.59 0.98 2.08 100.00
social sciences 0.46 10.53 45.42 22.91 14.63 3.50 0.09 0.54 0.51 1.42 100.00
science 0.72 3.73 66.86 20.76 4.13 1.44 0.33 0.33 0.39 1.31 100.00
engineering 0.18 4.31 71.58 18.52 2.86 0.57 0.05 0.88 0.75 0.29 100.00
agriculture 0.22 6.14 48.90 24.78 7.89 3.29 4.39 1.32 1.10 1.97 100.00
health 0.24 1.43 65.64 29.73 0.59 1.31 0.00 0.12 0.59 0.36 100.00
social service 0.95 9.49 42.09 31.65 5.38 5.06 0.63 0.63 2.22 1.90 100.00
Total 0.36 5.99 59.68 21.84 7.18 2.23 0.28 0.71 0.69 1.04 100.00
Female
education 0.00 1.90 65.96 23.35 3.41 3.48 0.00 0.11 0.18 1.61 100.00
humanities 0.08 2.94 50.73 19.70 17.77 7.13 0.08 0.52 0.12 0.93 100.00
social sciences 0.05 6.88 44.59 24.85 18.45 3.53 0.02 0.16 0.14 1.32 100.00
science 0.23 2.57 64.04 21.37 7.10 2.57 0.00 0.55 0.16 1.40 100.00
engineering 0.00 3.49 63.64 26.84 3.57 0.89 0.00 0.59 0.52 0.45 100.00
agriculture 0.21 3.00 50.64 26.82 8.58 3.65 4.51 0.86 0.00 1.72 100.00
health 0.00 1.03 49.02 42.46 2.57 4.32 0.00 0.06 0.06 0.48 100.00
social service 0.24 9.81 34.21 36.60 10.77 7.66 0.00 0.00 0.24 0.48 100.00
Total 0.06 3.84 52.44 27.42 10.59 4.01 0.14 0.26 0.16 1.08 100.00
Notes: Percentage of graduates by field in each occupation. First job after graduation. Occupations are the major groups from the International Standard
Classification of Occupations. Fields of study definition is abbreviated, see main text and figures for a more detailed description.
Page 26
26
Table 10: Occupation Choice by Field of Study Completed for Professionals and Technicians - Male and Female
Occupation:
physics,
mathematics
and engineering
life science and
health teaching other Total
Field of Study:
Male
humanities 7.94 0.89 52.36 38.80 100.00
social sciences 13.40 1.14 7.71 77.75 100.00
science 55.32 18.40 13.80 12.49 100.00
health 8.35 76.56 3.12 11.97 100.00
Total 23.03 15.44 16.79 44.74 100.00
Female
humanities 1.98 1.70 68.43 27.89 100.00
social sciences 5.45 2.43 11.42 80.70 100.00
science 33.65 28.91 22.12 15.32 100.00
health 5.61 69.89 5.15 19.35 100.00
Total 7.54 21.06 29.92 41.48 100.00
Notes: Percentage of graduates by field in each occupation. First job after graduation. Occupations are the sub-major groups from the International Standard
Classification of Occupations. Examples of occupations at the minor group level that correspond to the sub-major group level occupation other are: Business and
legal professionals, creative professionals, finance and sales associate professionals. Fields of study definition is abbreviated, see main text and figures for a more
detailed description.
Page 27
27
Table 11: Occupation Choice by Field of Study Completed for Professionals and
Technicians - Male and Female by Country
Occupation: physics, math, eng. life sciences, health teaching other Total
Field of Study:
Italy
Male
humanities 11.54 1.92 38.46 48.08 100.00
social sciences 5.31 0.27 5.84 88.59 100.00
science 44.30 24.16 20.81 10.74 100.00
health 6.33 84.81 5.06 3.80 100.00
Total 14.76 15.98 11.72 57.53 100.00
Female
humanities 1.20 0.80 59.20 38.80 100.00
social sciences 4.11 1.30 12.99 81.60 100.00
science 36.08 25.32 29.75 8.86 100.00
health 3.30 76.37 6.59 13.74 100.00
Total 8.08 17.78 25.38 48.76 100.00
Spain
Male
humanities 2.78 0.00 52.78 44.44 100.00
social sciences 6.36 0.00 16.36 77.27 100.00
science 39.73 33.93 7.59 18.75 100.00
health 54.76 34.52 0.00 10.71 100.00
Total 29.39 21.43 14.90 34.29 100.00
Female
humanities 1.23 3.38 61.23 34.15 100.00
social sciences 10.34 3.83 17.24 68.58 100.00
science 43.20 29.60 9.20 18.00 100.00
health 42.71 39.66 2.03 15.59 100.00
Total 23.43 18.74 24.14 33.69 100.00
France
Male
humanities 0.00 2.17 65.22 32.61 100.00
social sciences 8.33 1.04 27.08 63.54 100.00
science 50.46 13.76 33.94 1.83 100.00
health 0.00 92.00 4.00 4.00 100.00
Total 22.83 14.49 34.06 28.62 100.00
Female
humanities 2.62 0.00 69.63 27.75 100.00
social sciences 4.31 3.53 23.53 68.63 100.00
science 29.20 25.55 40.15 5.11 100.00
health 1.11 77.78 6.67 14.44 100.00
Total 8.47 16.94 37.74 36.85 100.00
Austria
Male
humanities 8.70 2.17 39.13 50.00 100.00
social sciences 8.27 0.38 4.14 87.22 100.00
science 62.50 17.65 6.62 13.24 100.00
health 0.00 100.00 0.00 0.00 100.00
Total 22.42 8.97 10.92 57.70 100.00
Female
Page 28
28
Occupation: physics, math, eng. life sciences, health teaching other Total
Field of Study:
humanities 1.40 1.40 54.55 42.66 100.00
social sciences 1.65 3.31 9.37 85.67 100.00
science 23.19 42.03 17.39 17.39 100.00
health 0.00 95.65 2.17 2.17 100.00
Total 3.40 11.65 26.57 58.38 100.00
Germany
Male
humanities 7.87 1.12 51.69 39.33 100.00
social sciences 19.74 0.66 5.92 73.68 100.00
science 67.23 5.88 18.49 8.40 100.00
health 4.35 62.32 2.90 30.43 100.00
Total 27.97 12.12 18.41 41.49 100.00
Female
humanities 4.21 0.00 67.29 28.50 100.00
social sciences 7.30 2.81 16.85 73.03 100.00
science 54.79 4.11 32.88 8.22 100.00
health 1.48 40.00 5.19 53.33 100.00
Total 10.67 10.33 34.17 44.83 100.00
Netherlands
Male
humanities 7.56 0.00 58.82 33.61 100.00
social sciences 27.52 3.67 0.92 67.89 100.00
science 71.11 16.30 5.19 7.41 100.00
health 5.10 73.47 0.00 21.43 100.00
Total 29.46 15.61 11.78 43.15 100.00
Female
humanities 2.88 2.88 62.97 31.26 100.00
social sciences 4.60 6.14 5.63 83.63 100.00
science 34.44 47.78 7.78 10.00 100.00
health 1.25 57.50 2.92 38.33 100.00
Total 4.82 25.21 23.16 46.81 100.00
UK
Male
humanities 18.52 0.00 29.63 51.85 100.00
social sciences 11.43 0.95 14.29 73.33 100.00
science 59.34 7.69 14.29 18.68 100.00
health 3.85 80.77 3.85 11.54 100.00
Total 27.90 10.51 16.30 45.29 100.00
Female
humanities 3.26 2.17 59.78 34.78 100.00
social sciences 4.29 4.29 20.71 70.71 100.00
science 31.58 14.74 28.42 25.26 100.00
health 6.02 79.52 2.41 12.05 100.00
Total 9.36 17.93 33.47 39.24 100.00
Finland
Male
humanities 7.41 1.23 46.91 44.44 100.00
social sciences 10.97 0.00 8.39 80.65 100.00
science 64.22 12.84 18.35 4.59 100.00
health 5.00 75.00 10.00 10.00 100.00
Page 29
29
Occupation: physics, math, eng. life sciences, health teaching other Total
Field of Study:
Total 24.68 11.69 19.48 44.16 100.00
Female
humanities 1.73 1.45 62.72 34.10 100.00
social sciences 10.12 1.16 8.38 80.35 100.00
science 34.59 32.33 16.54 16.54 100.00
health 0.29 77.55 7.29 14.87 100.00
Total 7.53 27.23 25.09 40.15 100.00
Norway
Male
humanities 1.96 0.98 65.69 31.37 100.00
social sciences 8.17 0.48 4.33 87.02 100.00
science 71.20 12.80 10.40 5.60 100.00
health 2.50 77.50 2.50 17.50 100.00
Total 20.00 20.00 16.58 43.42 100.00
Female
humanities 0.00 2.00 84.79 13.22 100.00
social sciences 3.92 1.96 8.33 85.78 100.00
science 30.30 33.33 30.30 6.06 100.00
health 0.19 73.68 4.29 21.83 100.00
Total 2.45 34.80 33.70 29.05 100.00
Czech R.
Male
humanities 11.62 0.83 53.11 34.44 100.00
social sciences 14.62 0.99 8.70 75.69 100.00
science 50.57 24.53 4.91 20.00 100.00
health 0.58 91.81 3.51 4.09 100.00
Total 20.03 19.36 16.15 44.46 100.00
Female
humanities 0.60 1.51 79.33 18.55 100.00
social sciences 5.19 0.79 5.86 88.16 100.00
science 21.20 40.76 11.96 26.09 100.00
health 0.40 87.40 5.80 6.40 100.00
Total 3.63 20.83 34.72 40.81 100.00
Japan
Male
humanities 10.53 1.75 73.68 14.04 100.00
social sciences 36.21 6.90 13.79 43.10 100.00
science 50.00 18.60 19.77 11.63 100.00
health 0.00 100.00 0.00 0.00 100.00
Total 33.18 14.69 31.75 20.38 100.00
Female
humanities 11.95 4.40 69.18 14.47 100.00
social sciences 18.46 6.15 24.62 50.77 100.00
science 31.40 25.58 19.77 23.26 100.00
health 11.80 61.49 14.29 12.42 100.00
Total 16.35 28.03 35.24 20.38 100.00
Portugal
Male
humanities 3.23 0.00 74.19 22.58 100.00
social sciences 5.08 1.69 5.08 88.14 100.00
Page 30
30
Occupation: physics, math, eng. life sciences, health teaching other Total
Field of Study:
science 61.90 9.52 14.29 14.29 100.00
health 0.00 95.24 4.76 0.00 100.00
Total 12.88 17.42 22.73 46.97 100.00
Female
humanities 0.95 0.00 75.24 23.81 100.00
social sciences 2.96 0.00 7.41 89.63 100.00
science 31.82 27.27 36.36 4.55 100.00
health 0.00 87.72 1.75 10.53 100.00
Total 3.76 17.55 30.72 47.96 100.00
Belgium
Male
humanities 1.75 0.00 40.35 57.89 100.00
social sciences 15.71 1.43 15.00 67.86 100.00
science 32.00 8.00 46.00 14.00 100.00
health 0.00 87.50 9.38 3.12 100.00
Total 13.98 12.19 25.09 48.75 100.00
Female
humanities 0.69 1.38 49.66 48.28 100.00
social sciences 2.99 2.99 23.08 70.94 100.00
science 20.37 16.67 53.70 9.26 100.00
health 0.00 91.84 3.06 5.10 100.00
Total 3.58 20.34 29.76 46.33 100.00
Estonia
Male
humanities 10.71 0.00 35.71 53.57 100.00
social sciences 13.33 0.00 1.33 85.33 100.00
science 65.45 7.27 10.91 16.36 100.00
health 12.50 25.00 0.00 62.50 100.00
Total 30.12 3.61 10.24 56.02 100.00
Female
humanities 3.70 0.53 64.02 31.75 100.00
social sciences 6.11 1.31 6.99 85.59 100.00
science 46.15 15.38 23.08 15.38 100.00
health 2.17 67.39 10.87 19.57 100.00
Total 7.95 8.15 30.02 53.88 100.00
Notes: Percentage of graduates by field in each occupation. First job after graduation. Occupations are the
sub-major groups from the International Standard Classification of Occupations. Examples of occupations
at the minor group level that correspond to the sub-major group level occupation other are: Business and
legal professionals, creative professionals, finance and sales associate professionals. Fields of study
definition is abbreviated, see main text and figures for a more detailed description.