Gender Quotas and the Crisis of the MediocreMan: Theory and Evidence from Sweden∗
Timothy Besley, Olle Folke, Torsten Persson, and Johanna Rickne
January 2017
Abstract
We develop a model where party leaders choose the competence of politicians on the ballotto trade off electoral success against their own survival. The predicted correlation between thecompetence of party leaders and followers is strongly supported in Swedish data. We use a novelapproach, based on register data for the earnings of the whole population, to measure the compe-tence of all politicians in seven parties, 290 municipalities, and ten elections (1982-2014). We askhow competence was affected by a "zipper" quota, requiring local parties to alternate males andfemales on the ballot, implemented by the Social Democratic party in 1993. Far from being atodds with meritocracy, this quota raised the competence of male politicians where it raised femalerepresentation the most. We argue that resignations of mediocre male leaders was a key driver ofthis effect.
∗The authors thank the editor Marianne Bertrand, four anonymous referees, as well as seminar participants at Science-Po, Harvard, Stockholm University, Columbia University, SITE, Juan March Institute, LSE, PUC-Rio, MPSA, APSA,EEA, IEB, European Public Choice Society, NBER Summer Institute, CEPR Public Policy Symposium, CEU, GothenburgUniversity, WZB, Århus University, Raquel Fernandez, Fernanda Brollo, Christina Xydias, Inger Segelström, DrudeDahlerup, Lena Sommestad, Ola Nilsson, and Mona Lena Krook for helpful comments. They also thank Jonas Allerup,Johan Arntyr, Sirus Dehdari, and Elin Molin for expert research assistance, and the Swedish Research Council, CIFAR,ERC and the Torsten and Ragnar Söderberg Foundations for financial support.
1
1 Introduction
Representative democracies are frequently said to need competent men and women to function effec-
tively. However, this argument hinges on a range of premises, including how parties promote candidates
and how voters value them. For example, party leaders may be reluctant to promote talent in their
party if this threatens their own position. Such reluctance may create a vicious circle of mediocrity
where low-quality leaders select low-quality followers in order to cement their position. Cozy arrange-
ments between mediocre leaders and candidates can be shaken up in a variety of ways. One interesting
possibility, that we study in this paper, is the introduction of quotas on the gender composition of
candidates.
More than one hundred countries have introduced some form of gender quota in their electoral
systems. The merits of these policies remain hotly debated in the academic literature, as well as in
the public debate.1 Quota proponents see them primarily as a means to improve the representation of
women, while their opponents emphasize the potential threat to meritocratic selection.
In 1993, Sweden’s Social Democratic party centrally adopted a gender quota and imposed it on all
the local branches of that party (from here, we refer to these branches as local parties). Although their
primary aim was to improve the representation of women, proponents of the quota observed that the
reform had an impact on the competence of men. Inger Segelström —the chair of Social Democratic
Women in Sweden (S-Kvinnor) 1995-2003 —made this point succinctly in a personal communication:
"At the time, our party’s quota policy of mandatory alternation of male and female
names on all party lists became informally known as the crisis of the mediocre man ..."
We study the selection of municipal politicians in Sweden with regard to their competence, both
theoretically and empirically. Moreover, we exploit the Social Democratic quota as a shock to municipal
politics and ask how it altered the competence of that party’s elected politicians, men as well as women,
and leaders as well as followers.
An analysis of competence in politics needs to treat the selection of candidates as an important
aspect of political life. Following standard models of political selection, such as Banks and Sundaram
(1998), we suppose that competence of politicians is a valence issue, an assumption supported by surveys
of Swedish voters.2 We then develop a simple model where a party that puts forward more competent
candidates on its ballot stands a higher chance of winning an election. The party leader picks candidates
1Studies of the spread of reforms and their numeric impact on representation are discussed in Dahlerup (2006) andKrook (2009). Case studies of substantive and symbolic representation are included in e.g., Franceschet, Krook andPiscopo (2012). Effects on electoral outcomes for parties suggest that a strict quota may benefit parties with previousmale dominance (Casas-Arce and Saiz 2015), as well as to reduce negative bias against women’s leadership abilities(Beaman et al. 2009).
2When surveyed in 2000 about their reasons for choosing a party, voters ranked competence of the party’s politiciansas the most important reason, with 71 percent of respondents saying that parties should have "competent politicians thatcan handle the country’s affairs".
2
to trade off electoral success against his or her own survival, which is threatened by more competent
followers.3
The model predicts that less competent leaders pick less competent followers. To establish whether
such a correlation exists in the data requires a convincing measure of competence for a range of polities.4
We use individual data for all candidates on all party lists in all Swedish municipalities in all elections
from 1982 to 2014. To gauge the competence of these candidates, we develop a unique measure which
exploits variation in income, conditional on occupation, education, location, and age, and is estimated
on administrative micro data for the full Swedish population.5 Data from the Swedish military draft
show that (for men) our competence measure is strongly related to cognitive scores and leadership
abilities, as assessed by a trained psychologist. Our competence measure is also strongly related to
different aspects of political success as well as to different proxies for the quality of municipal policy.
Using this competence measure, we find a close correlation between the competence of political leaders
and followers in line with the simple model. We also show that shocks to the composition of followers
affect the probability of leader survival.
Next, we exploit the Social Democratic gender quota as a shock to the political equilibrium. Citizen-
candidate models, such as Besley and Coate (1997) and Osborne and Slivinski (1996), suggest that
representation should matter for policy if women have different policy priorities than men.6 The quota
may also have threatened the survival of incumbent leaders, who were predominantly male. We show
that competence increased following the introduction of the quota, and more so in municipalities where
the quota led to the biggest increase in the proportion of elected women. Contrary to the expectations
of quota sceptics, women’s competence did not to go down but stayed roughly constant. However, the
competence of the men went up significantly. This improvement was not limited to elected followers
further down the party ballot, but also occurred at the very top —i.e., among local party leaders. In fact,
a key channel seems to have run through removal of mediocre male leaders, and their more competent
successors picking more competent candidates.
As a final step, we extend our model to permit a formal interpretation of the empirical results on
the effect of the quota. First, we allow the survival of male leaders to be threatened not only by larger
shares of competent followers but also by a larger share of women. This modifies the trade-off between
leadership survival and party success, although the effect of a gender quota turns out to be ambiguous.
Mediocre leaders can respond to a quota by lowering the fraction of competent men and at the same
3This model is similar in spirit to Egorov and Sonin (2011) who show how quality and diversity may be compromisedby mediocre power-hungry leaders, and to Gagliarducci and Paserman (2011) who link leader survival to follower com-position. The focus on the tension between internal survival and external success is also similar to Caillaud and Tirole(2002). However, they study the choice of platform quality under plurality rule as opposed to candidate selection underproportional representation.
4Competence and its importance is sometimes measured indirectly as in Galasso and Nannicini (2011) who find thatparties place the most educated candidates in the most highly contested electoral districts in Italy.
5Our measure is conceptually similar to the measure proposed in Merlo et al. (2010).6Recent studies which all find such gender effects include Chattopadhya and Duflo (2004) for Indian villages, Rehavi
(2008) for U.S. states, and Svaleryd (2009) for Swedish municipalities, while no effects are found by Ferreira and Gyorko(2011) for U.S. cities and Campa (2011) for Spanish municipalities.
3
time appointing mediocre women to protect their survival. Second, we extend the model to allow
for the possibility of leader resignations. This allows us to reconcile the empirical evidence that links
the removal of mediocre leaders to the improvement in follower competence, in particular the fact that
removal seems to precede higher follower competence.
Although applied to a specific context, the ideas we develop have wider relevance in those polities
where there is a desire to increase the representation of women in politics. As we have already noted,
more than half of the world’s electoral systems have some form of gender quota. Although our model
focuses on PR-systems, the basic logic would apply equally well to majoritarian systems where leaders
influence candidate selection. The link between quotas and competence that we emphasize may also
be relevant outside of politics. It could be applied, for example, to private organizations such as
corporate boards, where similar considerations appear in the literature on female board members —see
the summary in Eckbo et al. (2016). The core ideas in our model(s) may also apply when studying the
effects of other types of representation reforms, such as limitations based on age, the number of terms,
or ethnic origins. The common denominator in these cases is that incumbent leaders are influential in
appointing followers but beholden to those followers for retaining their leadership position. As a result,
representation reforms are likely to disrupt the status quo.
The paper is related to a recent literature on female political representation. For example, Esteve-
Volart and Bagues (2012) suggest that a lack of political competition allow party organizations to recruit
fewer women compared to what voters prefer. Then a gender quota might increase voter welfare if it
is consistently implemented in all districts as indicated in Casas-Arce and Saiz (2015). Murray (2010)
finds that women who entered parliament after France’s quota law were equally active and effi cient as
male lawmakers. O’Brien (2012) finds no difference in quality between women in reserved and contested
seats in the parliament of Uganda. Baltrunaite et al. (2014) show that the educational attainment of
both male and female politicians increased with an Italian quota mandating each gender to make up at
least one third of the candidates on party ballots.
The remainder of the paper is organized as follows. In the next section, we provide some background
discussion on the empirical context. Section 3 lays out our simple model where party leaders select the
composition of the party list to trade off electoral success against their own survival. Section 4 discusses
our Swedish data, measurement, and confronts the main prediction from the simple model —that more
competent leaders select more competent followers —with the data. In Section 5, we analyze the Social
Democratic Party’s gender quota. We exploit the fact that the quota had a differential impact across
municipalities, depending on the initial fraction of women, in order to estimate its effect on politician
competence for men and women and for leaders and followers. Section 6 interprets the empirical findings
by extending the model from Section 3 in two directions while section 7 concludes. A Web Appendix
includes data definitions and auxiliary empirical material
4
2 Context
Sweden’s municipalities This section gives some background on local politics in Sweden’s 290 mu-
nicipal councils. Each of these municipalities use exactly the same system, where the council is appointed
by proportional representation (PR) elections, implemented through party lists. The majority party
or, most often, a majority coalition forms the government. Thus the municipal majority appoints the
chairperson of the local council board. This position, the mayor of the municipality, typically goes to
the first-ranked politician of the largest party in the governing coalition. Each municipality is effectively
a parliamentary system in microcosm, where each local party organization determines the composition
of its own electoral ballot.
Elections are held every four years (every three years prior to 1994) and by a PR system where
parties obtain seats in proportion to their vote shares. Municipal elections are synchronized with those
at the higher levels, with a 80-90 percent turnout among eligible voters. Party lists were traditionally
closed with the order of candidates decided by the local party.7
Municipalities have significant political autonomy and control budgets of 15-20 percent of GDP. They
also employ around 20 percent of the country’s labor force. The bulk of municipal revenue is raised
via a local income tax, set by the municipal council, which typically exceeds 20 percent. The Swedish
Instrument of Government stipulates that local authorities determine their own affairs. Moreover, under
the 1991 Local Government Act 2.1, local authorities are responsible for all public-interest matters
relevant to the municipality. Despite their substantial influence, only the chairperson of the municipal
council board receives a full-time salary, with the remainder of the municipal politicians being unpaid.
Municipalities differ widely in size —land area varies from 9 to 19,447 square kilometers and popu-
lation ranges from 2,442 to 925,934 inhabitants. Councils have between 31 and 101 members, with an
average of 46. Representation is not subject to an explicit electoral threshold, and seven major political
parties tend to be represented in each municipality. These fall into two main political blocks, with the
Social Democrats, the Left Party and the Green Party to the left, and the Christian Democrats, the
Center Party, the Liberal Party, and the Conservatives to the center-right.8
Local party leaders Given the party vote share, a candidate’s list rank determines whether s/he
is elected. Lists are composed in three steps. First, a selection committee administers selection of
potential candidates from the party membership by internal nominations (more common in the Left
party and the Social Democrats) or an internal primary among local party members (more common in
the other parties). Second, the committee uses the results to put together a preliminary list. Third,
7From 1998 onwards a flexible-list system with one optional preferential vote was introduced. Since more than nineout of ten preferential votes have been cast for politicians who would have been elected without them (due to high listrank), this system has only marginally changed the composition of those elected.
8In fact, the strength of the two blocks led Alesina et al. (1997) to classify Sweden as having a bipartisan politicalsystem. The Green party is sometimes considered independent as in Pettersson-Lidbom’s (2008) study. In addition to theparties in the two blocs, two anti-immigration parties have had a substantial presence in the municipal councils duringour time period, New Democracy in the 90s, and the Sweden Democrats in the 00s and 10s.
5
this list is subject to a vote in a party-member meeting. Local party leaders have a strong influence in
each step.
A strong norm in Swedish parties protects local autonomy in composing electoral ballots. Within
the local party, the leadership has a great deal of influence over this process. Local party leaders directly
or indirectly influence the selection committee, which administers the first selection step and determines
the list ranking at the second proposal step. Rank-and-file party members can support their preferred
candidate(s) in the internal nomination or primary, but nominations and votes are coordinated by the
leadership. Candidate lists are usually ranked by the committee, or set up with party lists from the
previous election as “guidance”, which is another avenue for the leadership’s influence (Soininen and
Etzler, 2006). Rank-and-file members also have little say at the member’s meeting, where few changes
are typically made.
Our model assumes that the leadership knows the competence of followers. This is reasonable given
how local parties are organized. Active citizens first enroll as members and participate in meetings in
one or more municipality-based party clubs. Surveys among elected councillors suggest that it takes
on average 7 years of participation prior to election. Thus the leadership has ample time to observe
potential candidates in party meetings and activities before their selection for the ballot.
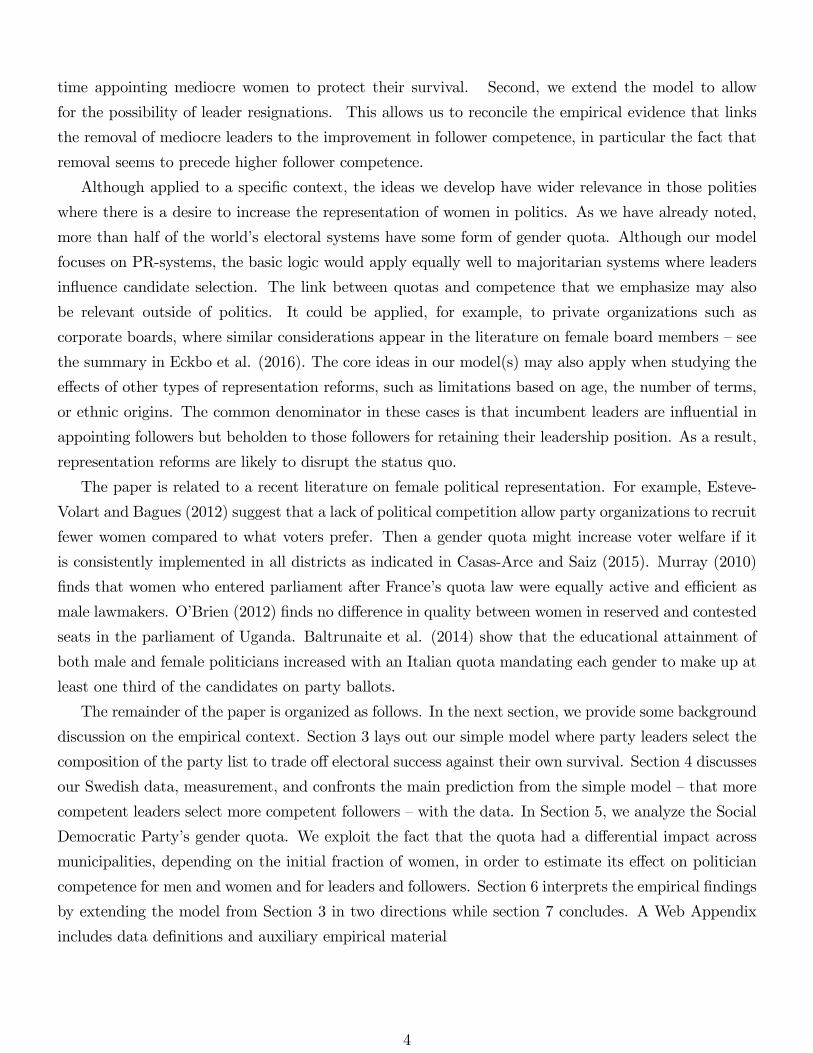
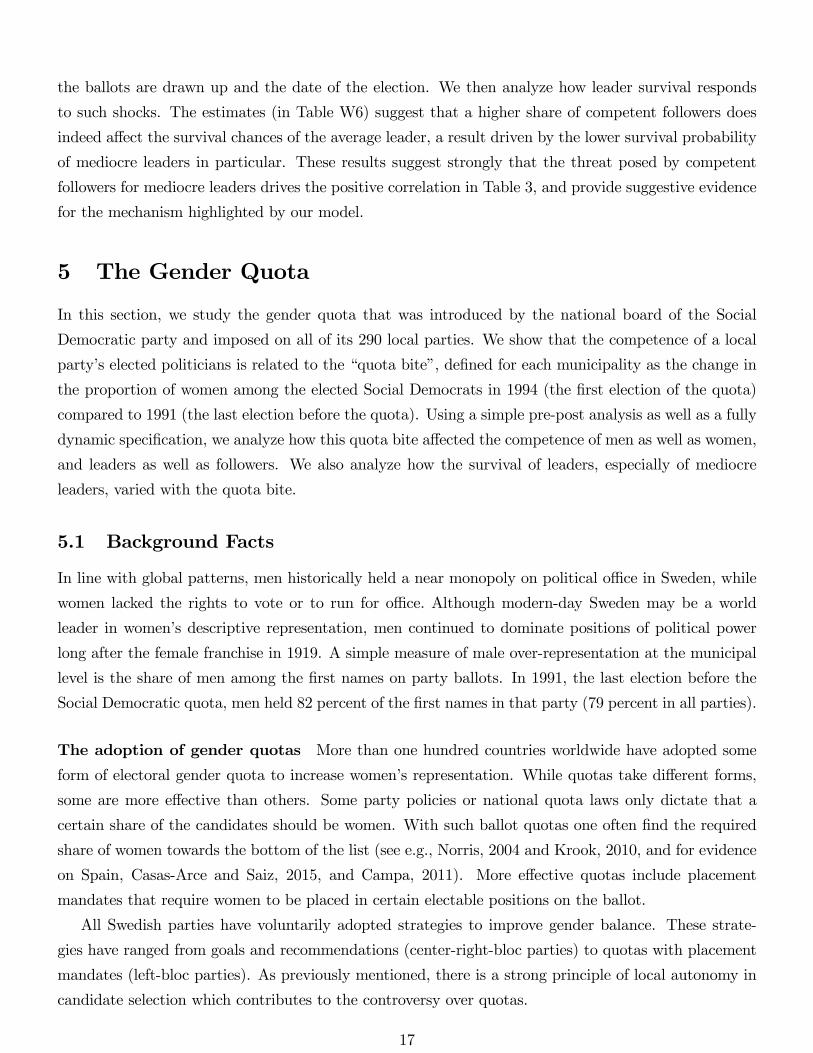
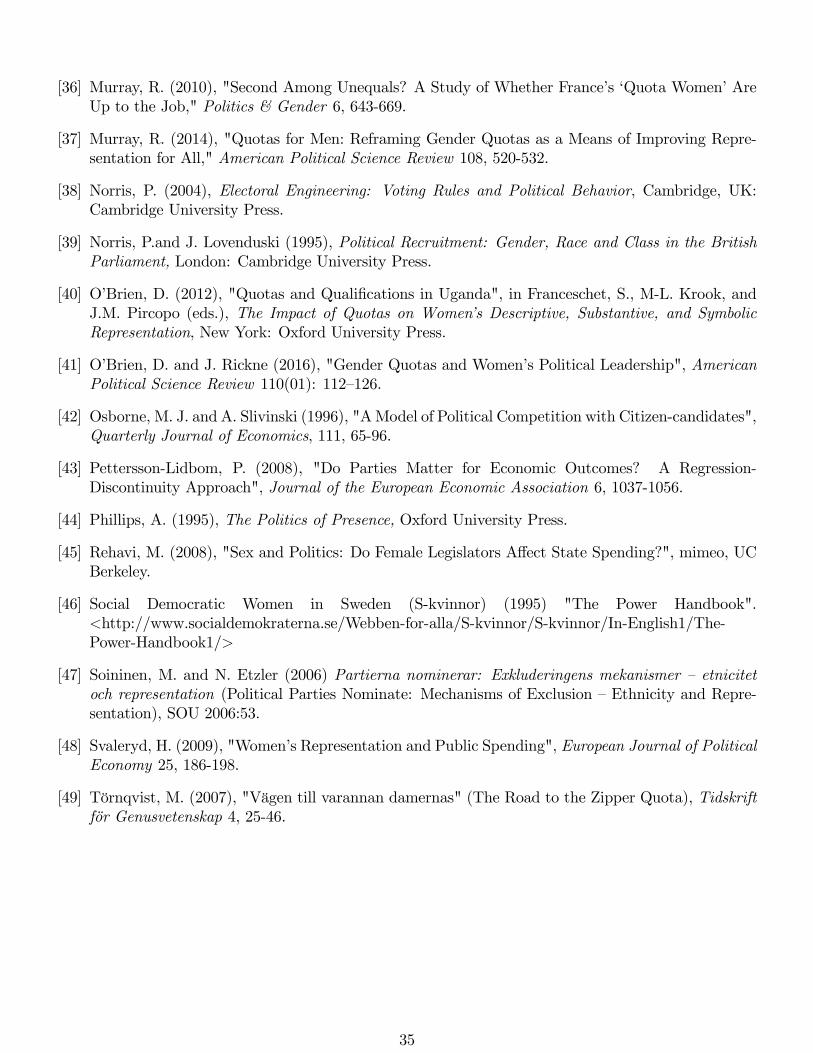
Figure 1 displays data from a large survey of municipal politicians on their influence over electoral-
ballot composition. It shows clearly that the party leadership is thought to be substantially more influ-
ential than elected representatives.
[Figure 1 here]
3 A Simple Model
To fix ideas, we lay out a model where leaders of two political parties in a PR election choose the
candidates to appear on party lists. Prospective candidates differ solely in their competence. Following
the general election, each party leader faces an internal leadership election among the party’s repre-
sentatives. This creates a trade-off in candidate selection: greater competence may please voters, but
threatens party leaders as more able candidates pose a greater internal threat.
Basic structure Two parties, labeled K = D,B (for Social Democrats and Bourgeois), participate
in a municipal-council election. Politicians come in two types: competent and mediocre. The utility
of voters is increasing in competence. We consider the special case when the proportion of competent
candidates rK on the party list is invariant to the number of seats won by the party. This is equivalent to
assuming that the fractions do not vary within the segment of the list where candidates have a realistic
election probability.
6
Each party has a leadership with competence lK ∈ [0, 1], a higher lK denoting greater competence.9
Below, we will assume that leader survival is stochastic, due to a “popularity shock”ε, but increasing
in the leader’s competence relative to his followers.
The party’s competence is a weighted average of the competence of its leader and its rank-and-file
representatives, such that
cK = αlK + (1− α)rK . (1)
Weight 0 < α < 1 could just mechanically reflect the leader’s share in the party’s total representation,
or allow for an additional weight on leaders due to their greater influence over policy.
Timing The model has the following sequence of events:
1. Each party K has a leader with competence lK .
2. Each incumbent leader chooses the share of competent followers rK .
3. The council election is held.
4. A (negative) popularity shock ε for each leader is realized, followed by a leadership contest in each
party where the leader’s chance of survival is increasing in lK − rK .
5. Payoffs are realized.
Stage 4: The leadership contest The leader survives if
rK − lK + ε < 0 .
Suppose that Q (·) is the c.d.f. of the popularity shock ε, which is symmetrically distributed aroundzero with log-concave density q (·). Since the popularity shock is not known at list-design stage 2, theprobability at that stage of the leader surviving is given by a “survival function”Q (lK − rK) .
While our main empirical analysis in Section 4 will treat rK as endogenous, we will also offer some
evidence for the impact of competence on survival of leaders based on an (arguably) exogenous shock to
rK .When doing so, we exploit that a negative popularity shock ε has the same impact on the probability
of survival as an increase in the share of competent followers, rK .
Stage 3: The council election Voters cast their ballots based on the policy utility of the elected
party, which is simply vK = cK . Competence is a valence issue; all voters like more competent candidates
in equal measure. Voters do not pay any attention to the survival power of leaders, beyond their
competence, as survival per se is not policy relevant. Preferences directly over elected politicians are
9In the empirical work to follow, we will interpret the leadership as three first people on the party list. For now, wewill use "the leader" in the interest of brevity.
7
consistent with a citizen-candidate model —as in Osborne and Slivinski (1996) or Besley and Coate
(1997) —where politician types map into policies.
We study competition for voters in a standard probabilistic voting model. This is summarized by an
increasing function for the probability that party D wins: P (vD − vB) where vD and vB are the utilities
offered by the two parties. Under some weak regularity conditions, the density p(·) of this function hasa single maximum at vD = vB.
Stage 2: List design The list is chosen by the incumbent party leader. To fix ideas, consider party
D. Since competence is a valence issue, and there are no representation issues, choosing competence
is equivalent to choosing vD = cD = αlD + (1− α) rD. We assume that the leader gets ego rents e
from holding the leadership, and utility E normalized to 1 from the party winning the election.10 His
expected payoff when choosing rD is thus
V (lD, rD) = Q (lD − rD) e+ P (αlD + (1− α) rD − vB) .
The first-order condition for an interior solution, given lD and a given value of vB, is
−q (lD − rD) e+ (1− α)p(vD − vB) = 0 . (2)
There is a trade off: a higher rD increases the chance of winning externally, but decreases the probability
of surviving internally. With a parallel condition for party B, we have:
Prediction In any political equilibrium, more competent leaders pick lists with more competent candi-
dates.
Proof. The second-order condition is
−q′ (lD − rD) e+ (1− α)2p′(vD − vB) < 0,
which is more likely to hold if rD < lD since this gives q′ (lD − rD) > 0. (An interior optimum may
10For simplicity, we focus on the case where the ego rent is independent of whether the party wins or loses, but thesame basic logic would hold in a more complex model with different values of e according to whether or not the leader’sparty wins.
8
require large enough e.) To see the effect of higher leader competence, use Cramer’s rule to get−q′ (lD − rD) e+
where yi,t is disposable income for person i in year t. Comparable labor-market experiences are con-
structed by interacting a range of binary indicators. We create indicators for age (five-year intervals),
education (a dummy for tertiary education or above), and employment sector (13 one-digit industrial
codes13). Function f captures the fact that the specification includes a fixed effect for each single
11See, for example, Merlo et al. (2010), Besley and Reynal-Querol (2011), Galasso and Nannicini (2011), and Baltrunaiteet al. (2014).12See e.g., Heckman (2006) for a discussion about Mincer earnings regressions.13These are the same as the European NACE code and international ICIC code, namely: "Agriculture, hunting and
forestry", "Fishing", "Mining and quarrying", "Manufacturing", "Electricity, gas and water supply", "Construction","Wholesale and retail trade; repair of motor vehicles, motorcycles and personal and household goods", " Hotels andrestaurant", "Transport, storage and communication", "Financial intermediation", "Real estate, renting and businessactivities", "Public administration and defense; compulsory social security", "Education", "Health and social work"and "Other community, social and personal service activities". Two categories, "Activities of households" and "Extra-
10
subgroup and for each possible (double and triple) interaction. Our earnings regression also includes
municipality fixed effects am to capture systematic income differences over regions or between urban and
rural areas. This flexible, fully-saturated, approach captures earnings-tenure profiles between sectors
and by education.14
To minimize the possibility of measurement error and endogeneity in this procedure, we drop ob-
servations for politicians in all years when they hold a full-time political appointment, and in all years
after they leave such posts.15 To avoid confounding competence with labor-market behavior driven by
gender norms or retirement, we estimate equation (3) separately on sub-samples of men, women, and
the retired (individuals aged over 65).16
A binary competence measure Having computed average residuals for each individual in the
population from the annual estimates of (3), we construct standardized z-scores for elected politicians
in each party. We differentiate by party since parties tend to recruit members and candidates from
different social strata which may not be captured fully by the control variables in the earnings regression.
Thus, our approach allows analyzes selection within parties.
In the empirical analysis, we measure the share of competent followers rK , and leadership competence
lK , based on a binary indicator of individual competence ci. This classifies politician i as competent if
her income residual is above the median residual of all elected politicians in her party, and as mediocre
otherwise. Leadership competence lK is the average of this binary indicator among the top-three politi-
cians on each party ballot.17 The share of competent followers rK is the average of the binary variable
over all elected politicians excluding the top three.
Apart from its consistency with the model, the binary measure is empirically attractive, since earn-
ings could have a different variance within age-education-employment sector cells. This variance could
territorial organization and bodies" contain fewer than 30 individual-year observations. Because of this, we add theformer to "Other community, social and personal service activities", and the latter to "Public administration and defense;compulsory social security".14One might argue that our competence measure should not net out the effects of education and industrial sector on
income, if voters prefer educated politicians or persons from certain sectors, or if education and occupation choices arethe results of competence. Using the (more volatile) residuals from a Mincer regression that leaves out education andoccupation results in point estimates that are similar to the baseline results in Table 4 and Figure 4 below, althoughsmaller in (absolute) value and a bit noisier.15We also exclude all earnings observations for politicians who move on to a seat in the national parliament.16More than 30% of the women who work, do so part time compared to less than 10% of the men. Women also take
larger share of parental leave and engage in care activities that drive an increase in the gender pay gap when couplesthat have children (Kleven et al. 2015). Estimating (3) for retirees is not straightforward. Even though pensions reflectan individual’s former earnings potential, we do not have a current employment sector. Thus, we compute their incomeresidual based on the sector in which they were employed during the majority of their working-life. For those who retiredbefore 1990 we do not have data on previous employment and thus cannot calculate the income residual.17While a cutoff of three is somewhat arbitrary, it may be a good proxy for the key decision-making group, commonly
referred to as the leadership "troika" in local Swedish politics. Also, as mentioned above, the computation of the com-petence measure excludes the incomes of full-time politicians during and after their time in offi ce. We thus remove theincome of the chairman of the council board who was already in offi ce in our first election year (1982) and for whom we lackpre-appointment observations of earnings. Because the Social Democrats holds this position in many municipalities, andthis party is the source of the gender quota, we need to measure leadership competence for more than a single politician.
11
be correlated with earnings levels, e.g., if highly educated individuals in the financial sector have greater
wage dispersion in the late 90s as some become CEOs. A continuous measure of competence would then
effectively reflect the level of the subject’s income and not only its deviation from the cell mean, which
we wish to avoid.18
To validate this competence measure, we show that it: (i) predicts political success for politicians,
(ii) correlates positively with the scores from ability tests in the Swedish military draft system (for male
politicians), and (iii) correlates with measures of policy success.
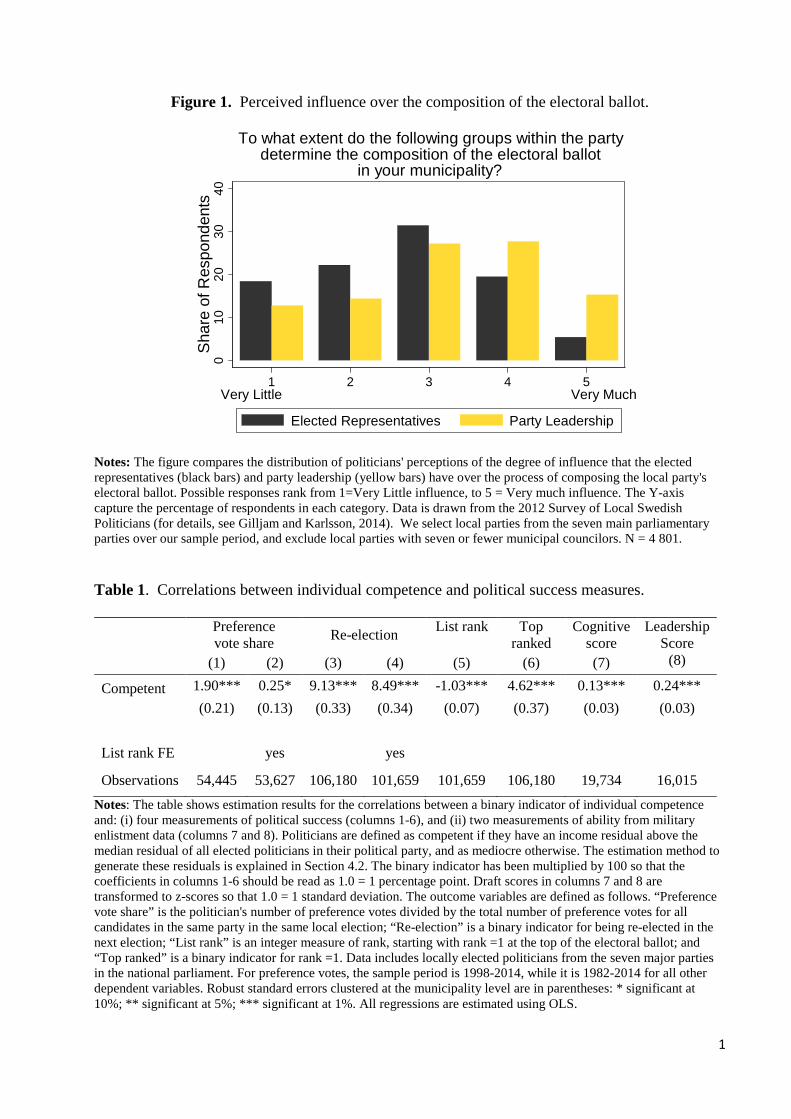
Validating competence using political success We use four measures of political success. The
first is voter support: the number of preference votes for each politician as a fraction of the local party’s
total. This data is available since 1998 when voters were allowed to cast a single and voluntary preference
vote for a person on their selected ballot. The second is a dummy variable for re-election in the next
election, a direct measure of career advancements via seniority (Folke and Rickne, 2016, motivate this
measure). The third is a continuous measure of a politician’s list rank, where lower numbers signify a
higher position on the ballot. The fourth measure of political success is a dummy variable for being the
top-ranked (#1) politician on the party ballot, a rank usually reserved for chairpersons of the municipal
council board, in majority parties, or party-group leaders in minority parties.19
We estimate the following regression:
xi,t = βci + φi,t + εi,t , (4)
where xi,t is one of our measures of political success. While political success is mostly measured in
election t (list rank, being top ranked, or preference vote share), re-election occurs at t+1. Parameter β
captures the correlation between our binary competence measure ci and the dependent variable. When
political success is the preference-vote share or re-election, we can compare specifications with and
without fixed effects for list rank, φi,t . This control is particularly important for preference votes, as
voters may cast such votes for top-ranked candidates by default (Montabes and Ortega, 2002, Folke,
Persson and Rickne, 2016), which could conflate our estimate of β due to the fact that income residuals
are positively correlated with list rank.
The results from running equation (4) appear in the first six columns of Table 1. We find positive and
statistically significant correlations between the competence measure and all four dependent variables,
correlations that survive controls for list-rank fixed effects. For preference votes in column (1), competent
politicians attract around 0.7 percentage points (0.47 standard deviations) more preference votes than
18As shown in Web Appendix Table W1, when we use a continuous measure of competence, the baseline estimates inTable 4 and Figure 4 below have the same signs as as with the binary measure, although they are noisier and somewhatsmaller in absolute value.19As further discussed in Folke, Persson, and Rickne (2016), data from a large mandatory survey of all post-election
appointments made by local parties in the 2006 and 2010 elections shows that the top-ranked politician on the largestmajority party’s ballot was appointed to the position of chairperson of the municipal council board (the equivalent ofmayor) in 9 out of 10 cases.
12
mediocre politicians. Holding list rank constant in column (2), reduces this estimate to 0.21 percentage
points (0.14 standard deviations). These estimates strongly indicate that our competence measure
predicts direct voter support, in line with our model’s core assumption.
The estimates in columns (3) and (4) show that our competence measure strongly predict a longer
political career. In Columns (5) and (6), we find that competent politicians have positions higher up
on the party list and are more likely to occupy the top slot. Being competent is associated with a 4
percentage points higher probability of becoming (or remaining) top ranked. Taken together, the results
in Table 1 show that our income residuals ci are relevant for politics as well as for market returns.20
[Table 1 here]
Validating competence using enlistment tests As another attempt at validation, we examine
how our competence measure ci correlates with ability-test scores conducted in the Swedish military-
draft system, which used to be mandatory for all 18-year old men. Two test scores are used. The first
is a written test that evaluates cognitive ability by combining tests of logical, verbal and spatial ability
into a general score from 1 to 9.21 This test is similar to the armed forces qualifying tests (AFQT) in
the US and is commonly perceived as a good measure of general intelligence (Carlstedt, 2000).
The second test is based on an interview with a trained psychologist, who follows a specific (though
secret) manual to decide which topics to discuss and how to grade responses. This interview is intended
to determine a conscript’s psychological capacity to hold a leadership position in the armed forces,
especially the ability to cope with stress and foster group cohesion. A conscript with a high score is
considered to be emotionally stable, persistent, socially outgoing, willing to assume responsibility, and
able to take initiatives. Motivation for military service is not considered. Grades on four different
sub-scales are turned into a discrete 1 through 9 scale. Besides the interview, this score is also based on
information about the conscript’s results on the tests of cognitive ability, physical endurance, muscular
strength, as well as grades from school and the answers on questions about friends, family, hobbies etc.
Previous studies have shown that the cognitive and non-cognitive tests are both excellent predictors of
labor-market performance (see e.g., Lindqvist and Vestman, 2011).
We use each enlistment variable as the dependent variable in regression (4) and estimate the corre-
lation in a sample of all men born between 1951 and 1979.22 Estimates in columns (7) and (8) of Table
1 show that men considered competent according to our ci measure have significantly higher average
scores on both tests, 0.26 points higher on the cognitive test and 0.39 points higher on the leadership
20Web Appendix Table W2 shows that this validation holds up when we split the sample of politicians into men andwomen. In fact, the association between competence and political success is a bit stronger for women than for men.21The design of the test was revised slightly in 1980, 1994 and 2000, but throughout the period it tests for the same four
underlying abilities and was always normalized to a 1-9 scale designed to give a normal distribution within each cohortof recruits.22For these cohorts, enlistment was mandatory and exceptions were only made for physically and mentally challenged
recruits. For cohorts after 1979, the draft was still mandatory de jure, but largely optional de facto. The mandatory draftwas abolished in 2010.
13
test. This corresponds to 14% of a (full-population) standard deviation for the cognitive score, and 23%
for the leadership score.
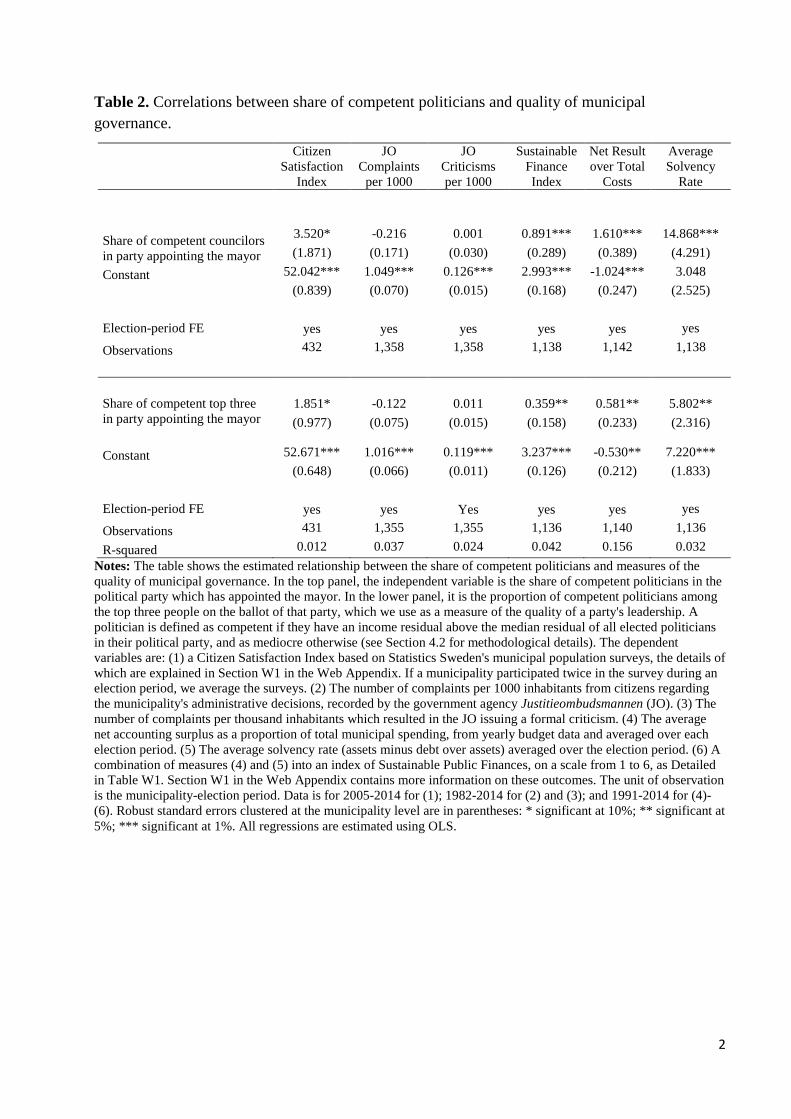
Validating competence using policy outcomes Another way to validate our competence measure
is to check whether it is correlated with improved policy outcomes (as assumed in the model of Section
3). To investigate this, we use three (sets of) variables, which together provide a broad picture of the
quality of municipal governance.23
The first variable is taken from surveys of customer satisfaction in local social services which are
available for the most recent elections. Specifically, the Citizen Satisfaction Index measures service
quality on a scale from 0 to 100 where higher scores denote greater satisfaction. It is based on three
questions: (1) “How happy are you with how your municipality handles its various responsibilities?”,
(2) “How well does your municipal government live up to your expectations?”, and (3) “Imagine a
municipality that perfectly handles its operations. How close to that ideal would you rank your own
municipality?”.
The second variable is based on complaints from citizens about administrative decisions made by
the municipality. These complaints are directed to Justitieombudsmannen (JO) —a national and inde-
pendent legal agency —and may, after investigation, lead to a formal criticism of the municipality. We
use two measures for each municipality and election period: (1) the total number of JO complaints by
citizens against the municipality, and (2) the total number of JO criticisms against the municipality,
scaling both by population (in 1000s). In this case, a lower number indicates a better-run municipality.
The third set of variables come from local public-finance outcomes available from 1991 and onwards.
As discussed in detail in Web Appendix Section W1, we calculate separate statistics for the stock and
flow aspects of municipality finances in a particular election period, specifically (i) the average net
accounting surplus as a proportion of total costs, and (ii) the average solvency rate (assets minus debt
over assets). We also combine these two variables into an index of Sustainable Public Finances, measured
on a scale from 1 to 6 (see Table W3). A higher value of this index denotes a more sustainable fiscal
policy.
In Table 2, we correlate these measures with the competence of municipal politicians.24 We report
results from two separate sets of regressions. The independent variables are the share of competent
elected councilors in the mayor’s party (top panel) and the share of top-three politicians on his party’s
list who are competent (bottom panel). All regressions include election-period fixed effects, and standard
errors are clustered at the level of the municipality.
The correlations for all six outcomes and two specifications —except for the number of JO complaints
—suggest that more competent politicians in the mayor’s party are associated with better policies. For
four out of the six measures, the correlations are statistically significant. Moreover, they are often
23See Section W1 in the Web Appendix for details.24Web Appendix Figure W1 shows the distributions of these policy measures, where the unit of observation is the
municipality-election period.
14
substantial in size. For example, the estimate in column (2) of the top panel suggests that all elected
politicians in the mayor’s party being competent rather than mediocre is associated with a budget
surplus of 0.6% rather than a deficit of 1%.
[Table 2 here]
4.3 Empirical Results on Competence
The model in Section 3 predicts a positive correlation between leadership competence, lK , and the
share of competent followers, rK . To examine this correlation, we consider all parties with more than
eight elected representatives in each election between 1982 and 2014. Nearly all (99%) of the Social
Democratic local parties meet this size restriction. For other parties, it excludes around 25% of the
observations. Although this threshold is somewhat arbitrary, looking at groups of eight and above gives
a meaningful distinction between political leaders and followers, which would make less sense for smaller
groups.
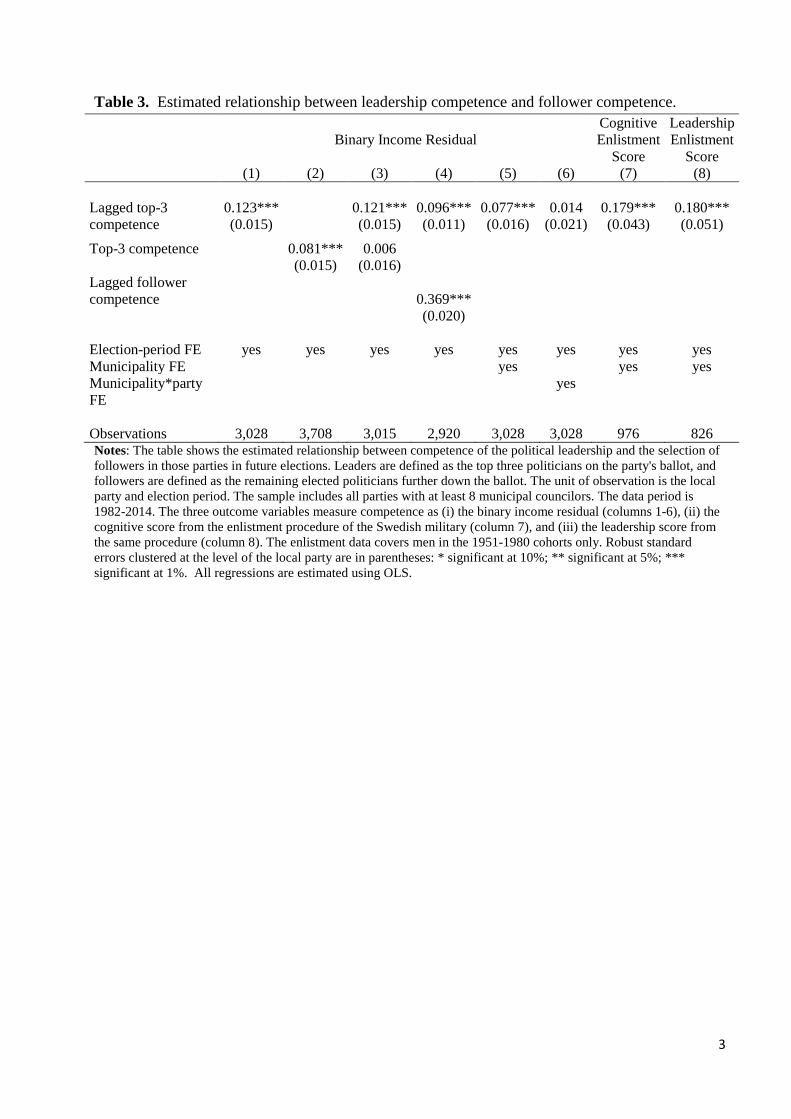
Leader competence and follower selection We use OLS regressions to relate selection of follower
competence to leadership competence. Guided by our model, we measure rK by the share of competent
candidates below the leaders —where leaders are the top-three candidates on the list —in the current
election. Our model says that rK is determined by lK , the average competence of the incumbent
leaders. In the spirit of our (static) model, an internal leadership contest will have taken place between
the current and the previous election. Depending on the timing and result of this contest, the current
slate of followers could thus have been chosen by the top-three people on the list, either in the previous
election or in the current election. Since our static theory does not provide further guidance, we allow
for both possibilities in the empirical specification.
Table 3 presents the resulting correlations. Column (1) shows a strong pair-wise correlation between
the competence of past leaders and current followers. In column (2), we instead regress follower compe-
tence on the average competence among the current top-three candidates on the list. This competence
correlation is also positive, although weaker than that between current followers and previous leaders.
This suggests that, on average, the leadership in the previous election exerts a stronger influence on list
composition.
[Table 3 here]
This is confirmed in column (3), where we include both the current and lagged leadership competence
measures. The lagged measure is more important, while current competence becomes statistically
insignificant with a point estimate close to zero. Column (4) shows that this correlation does not simply
reflect strong auto-correlation among the followers.
15
Column (5) addresses the natural concern that some omitted municipality characteristics, such as
education or urbanization, simultaneously drive the selection of leaders and followers. In this specifi-
cation, the correlation between lagged top-three competence and follower competence just reflects time
variation within municipalities. Importantly, our estimate survives this specification. However, it does
not survive an even more demanding specification in column (6), where we include interacted fixed
effects by party and municipality in the regression equation.
Further checks In columns (7) and (8), we use the same specification with municipality fixed effects
as in column (5), but replace the outcome variable by average follower competence measured by the
cognitive enlistment score and the leadership enlistment score, respectively. The estimated correlations
are equally strong for these alternative competence measures.
In the Web Appendix we provide two further tests to show that the Table 3 results are not driven by
candidate supply (i.e., competent leaders attract more competent party members). First, we create a
control variable for the proportion of competent politicians among nominated politicians on the list, i.e.,
non-elected people who may move up to higher list ranks in future periods. This could be considered a
measure of competent candidates in a pool from which leader(s) can choose the top part of the list.25
As a second test, we replace the outcome variable with the difference in the proportion of competent
politicians among the elected candidates and among the persons in this candidate pool. The two sets
of estimates in Tables W4 and W5 support the model. Controlling for the candidate pool available to
the leadership, mediocre leaders end up choosing relatively, and statistically significantly, worse people
than competent leaders.
Summary Taken together, the results in Table 3 demonstrate a strong correlation between the com-
petence of the party leadership and the competence of elected politicians further down the list. This
lines up with the prediction from our simple model which highlighted the trade-off between electoral
success governed by the function P (·) and leadership survival governed by the function Q (·).
Evidence for the model mechanism Without a source of exogenous variation, it is diffi cult to
rule out other reasons for competent leaders and followers to be positively correlated. For example,
there could be complementarities, due to the consequences of collaboration or to competent leaders
and followers enjoying to collaborate. Such complementarities would lead to a positive leader-follower
correlation unrelated to the trade-off posited by the model between electoral success and leadership
survival.
SectionW2 in theWeb Appendix presents some direct evidence that leaders selecting a larger number
of competent candidates face a tradeoff as highlighted by the model. This relies on plausibly exogenous
variation in rK derived from unanticipated shocks to the party’s vote share between the date at which
25In our data, we can verify that in the average election, nearly two thirds (60%) of freshmen councilors were listed ontheir party’s electoral ballot, but not elected, in the previous election.
16
the ballots are drawn up and the date of the election. We then analyze how leader survival responds
to such shocks. The estimates (in Table W6) suggest that a higher share of competent followers does
indeed affect the survival chances of the average leader, a result driven by the lower survival probability
of mediocre leaders in particular. These results suggest strongly that the threat posed by competent
followers for mediocre leaders drives the positive correlation in Table 3, and provide suggestive evidence
for the mechanism highlighted by our model.
5 The Gender Quota
In this section, we study the gender quota that was introduced by the national board of the Social
Democratic party and imposed on all of its 290 local parties. We show that the competence of a local
party’s elected politicians is related to the “quota bite”, defined for each municipality as the change in
the proportion of women among the elected Social Democrats in 1994 (the first election of the quota)
compared to 1991 (the last election before the quota). Using a simple pre-post analysis as well as a fully
dynamic specification, we analyze how this quota bite affected the competence of men as well as women,
and leaders as well as followers. We also analyze how the survival of leaders, especially of mediocre
leaders, varied with the quota bite.
5.1 Background Facts
In line with global patterns, men historically held a near monopoly on political offi ce in Sweden, while
women lacked the rights to vote or to run for offi ce. Although modern-day Sweden may be a world
leader in women’s descriptive representation, men continued to dominate positions of political power
long after the female franchise in 1919. A simple measure of male over-representation at the municipal
level is the share of men among the first names on party ballots. In 1991, the last election before the
Social Democratic quota, men held 82 percent of the first names in that party (79 percent in all parties).
The adoption of gender quotas More than one hundred countries worldwide have adopted some
form of electoral gender quota to increase women’s representation. While quotas take different forms,
some are more effective than others. Some party policies or national quota laws only dictate that a
certain share of the candidates should be women. With such ballot quotas one often find the required
share of women towards the bottom of the list (see e.g., Norris, 2004 and Krook, 2010, and for evidence
on Spain, Casas-Arce and Saiz, 2015, and Campa, 2011). More effective quotas include placement
mandates that require women to be placed in certain electable positions on the ballot.
All Swedish parties have voluntarily adopted strategies to improve gender balance. These strate-
gies have ranged from goals and recommendations (center-right-bloc parties) to quotas with placement
mandates (left-bloc parties). As previously mentioned, there is a strong principle of local autonomy in
candidate selection which contributes to the controversy over quotas.
17
The Social Democratic zipper quota The Social Democrats began by targeting the share of
women among its nominated politicians, with recommendations of 40 and 50 percent, respectively, for
the 1988 and 1991 elections. Only in 1993 — after a credible threat from an outside group to form
a feminist party, which would have claimed a fraction of both politicians and voters from the Social
Democrats —did the party adopt a placement mandate. The proposed feminist party, known as the
Support Stockings (Stödstrumporna), was a national-level network of mostly professional women from
the political right and the left formed in response to a five percentage-points drop in the proportion
of women elected to the Swedish parliament in 1991. This network demanded that political parties
adopt zipper quotas (Varannan Damernas) for their ballots. Moreover, any potential trade-off between
competence and gender was purposefully down-played in the political and public discussion, which
focused around fairness and collaboration between women and men (Törnqvist 2007).26
The actions by the Support Stockings pushed the Social Democratic party to adopt zipper quotas for
all of their electoral ballots and the decision about this quota was taken by the central party board which
imposed it on all local parties. Specifically, local parties were instructed to change their nomination
procedures to, first, make two separate candidates lists for men and women, and second, zip the two
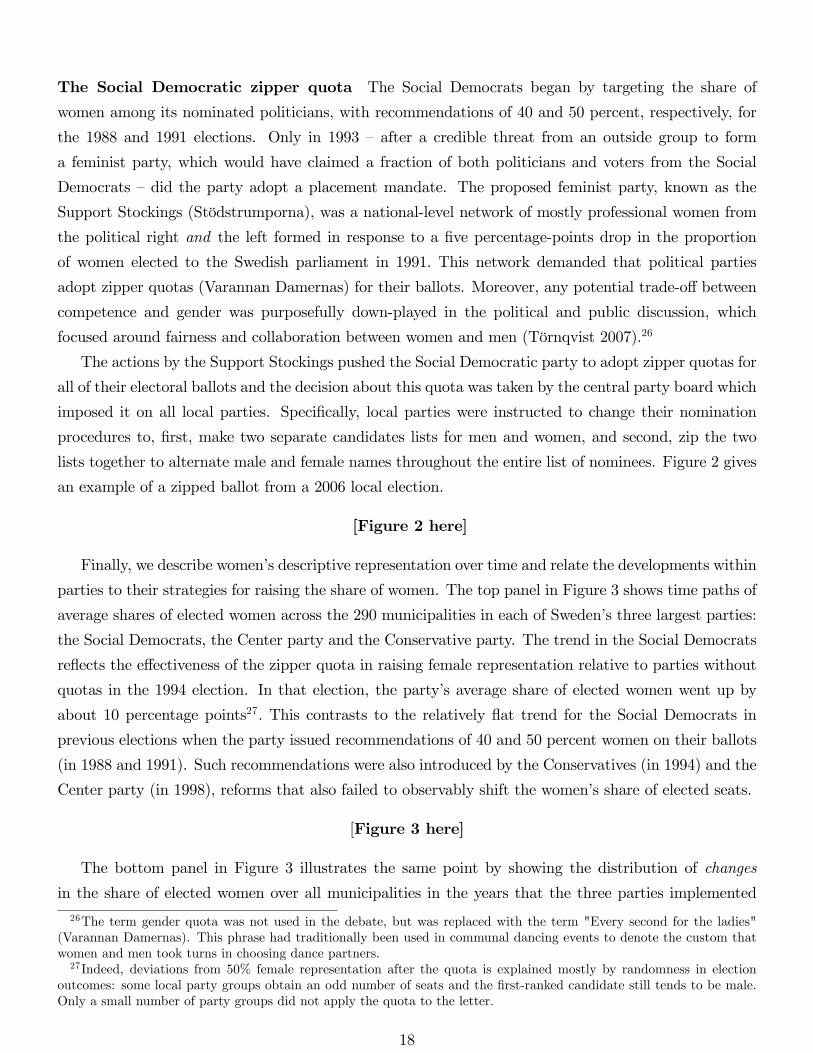
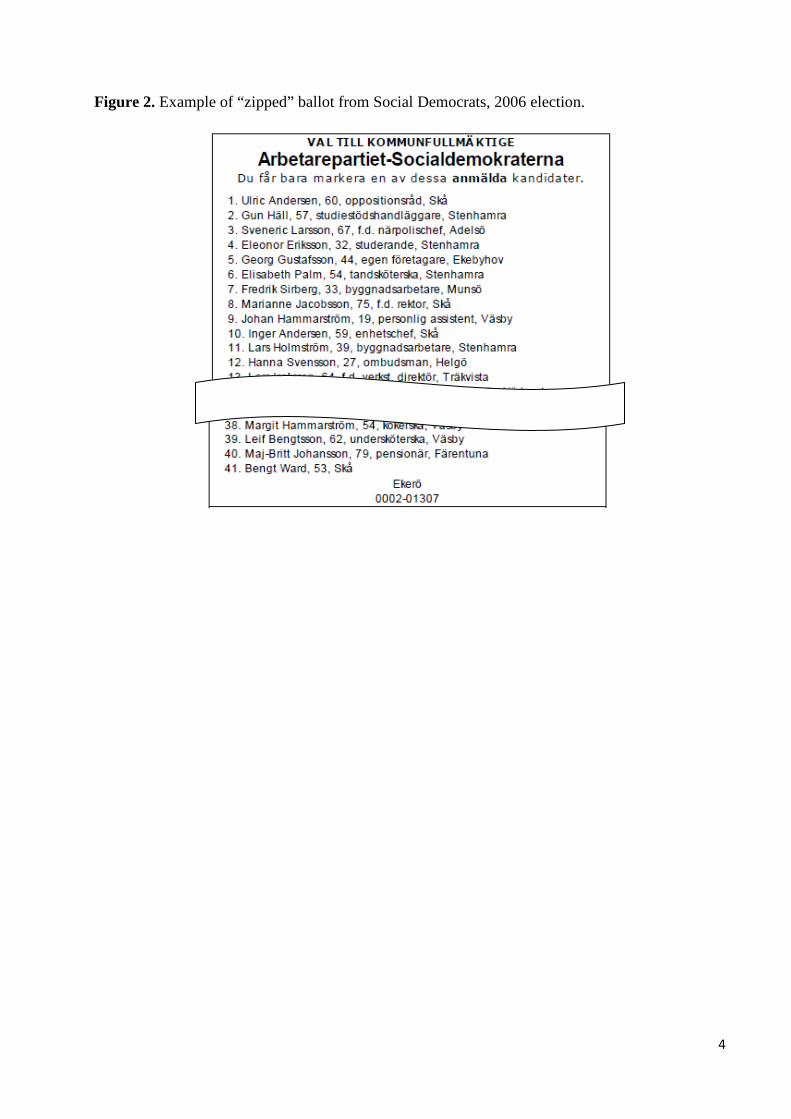
lists together to alternate male and female names throughout the entire list of nominees. Figure 2 gives
an example of a zipped ballot from a 2006 local election.
[Figure 2 here]
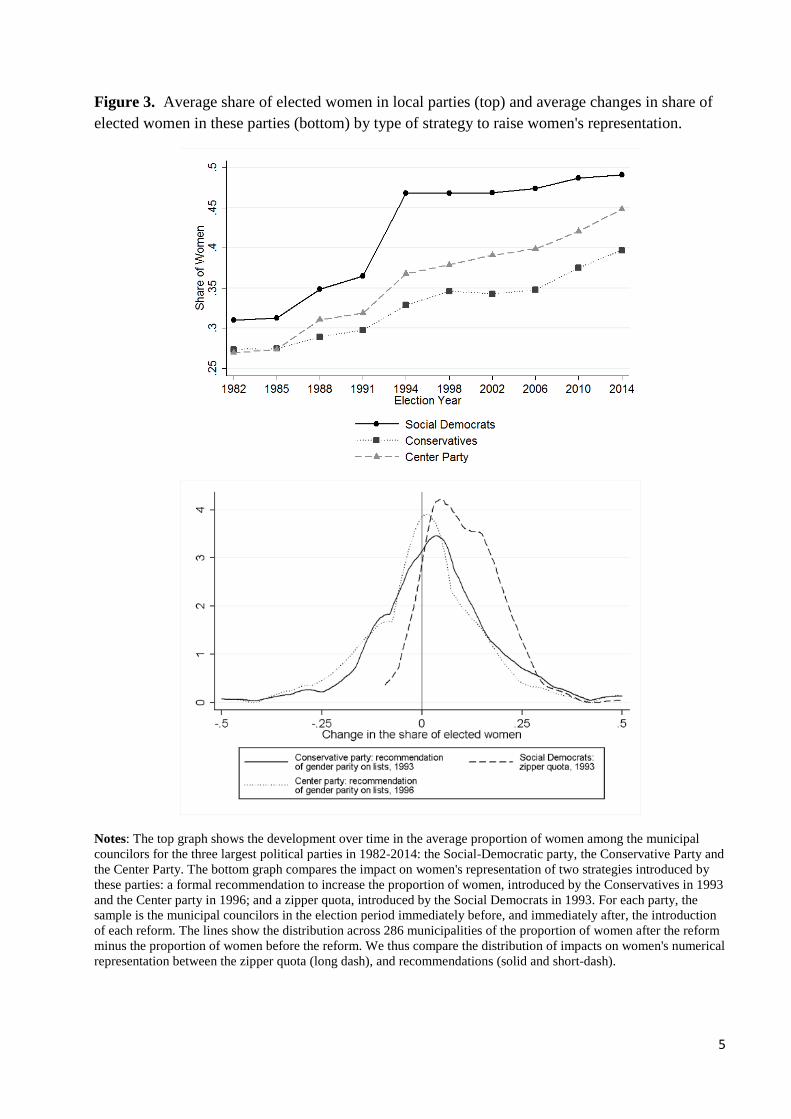
Finally, we describe women’s descriptive representation over time and relate the developments within
parties to their strategies for raising the share of women. The top panel in Figure 3 shows time paths of
average shares of elected women across the 290 municipalities in each of Sweden’s three largest parties:
the Social Democrats, the Center party and the Conservative party. The trend in the Social Democrats
reflects the effectiveness of the zipper quota in raising female representation relative to parties without
quotas in the 1994 election. In that election, the party’s average share of elected women went up by
about 10 percentage points27. This contrasts to the relatively flat trend for the Social Democrats in
previous elections when the party issued recommendations of 40 and 50 percent women on their ballots
(in 1988 and 1991). Such recommendations were also introduced by the Conservatives (in 1994) and the
Center party (in 1998), reforms that also failed to observably shift the women’s share of elected seats.
[Figure 3 here]
The bottom panel in Figure 3 illustrates the same point by showing the distribution of changes
in the share of elected women over all municipalities in the years that the three parties implemented
26The term gender quota was not used in the debate, but was replaced with the term "Every second for the ladies"(Varannan Damernas). This phrase had traditionally been used in communal dancing events to denote the custom thatwomen and men took turns in choosing dance partners.27Indeed, deviations from 50% female representation after the quota is explained mostly by randomness in election
outcomes: some local party groups obtain an odd number of seats and the first-ranked candidate still tends to be male.Only a small number of party groups did not apply the quota to the letter.
18
their gender policies. Clearly, the Social Democratic zipper quota was more effective than the recom-
mendations in the other two parties. Among the Social Democrats, the quota bite also varied across
municipalities: a few municipalities saw the share of women fall by a few percentage points, while some
saw it rise by as much as 30 percentage points. We use this variation in the Social Democratic quota
bite to analyze the impact on the selection of politicians.
5.2 The Impact of the Quota
The model in Section 3 ties the correlation evidence in Section 4 to the leader’s competence. But these
correlations might conceivably reflect common (time-varying) omitted factors driving both leadership
competence and the fraction of competent politicians. The Social Democratic quota can help reduce
these simultaneity concerns. In particular, it offers a sharper focus on the relationship between the
competence of leaders and followers: specifically, the “shock”of the new quota may have disrupted the
cosy dominance enjoyed by mediocre male leaders.
There are good reasons to think that the quota affected mediocre male leaders in particular.28 Sup-
port for such leaders may have dropped disproportionately when the quota was introduced. Moreover,
as argued by Murray (2014), a quota reduces the number of elected seats available for men. With fewer
seats to distribute, the quota may have limited the ability of mediocre leaders to nominate mediocre
followers to sustain their continued leadership. These disruptions are likely to have been larger where
the quota bite —measured as the change in the share of elected women from 1991 to 1994 —was larger.29
There may also have been more pressure on mediocre male leaders, if the pre-quota competence gap
between elected men and women was larger in the municipalities with mediocre leaders.30 Section W3
in the Web Appendix presents some evidence that this was indeed the case.
Finally, there is evidence that internal opposition to male leaders was organized in part along gender
lines. In particular, the Women’s Branch of the Social Democrats had lobbied for a gender quota ever
since the organization was created in the early 1900s, and was intent on making the most of this policy
when it was finally attained. A handbook was distributed to all local parties with guidelines on how
to transform “numbers”to “influence”. An important part of this strategy was to have women replace
men in positions of power.31
28As previously noted, 82 percent of the Social Democratic ballots had a man as the top-ranked candidate in 1991.Indeed, the lack of female leaders makes a potential analysis of the impact on follower selection under-powered in the thissub-sample of female-led municipalities.29The competence of male leaders is strongly positively correlated with the share of women prior to the introduction
of quota. Moving from all male leaders being competent rather than mediocre in 1988 was (statistically significantlyassociated) with an almost 5 percentage-point higher share of women in 1991.30We are grateful to a referee for this suggestion.31In one section, the handbook asks women to: "Analyze carefully the power structure of your council or organization.
Where are the most important decisions taken? Is there a shortage of women there? The answer to the latter questionis often yes. Make sure that women are introduced and nominated at that particular decision level. Draw up a clearstrategy for what power positions must be held by women and how women can most successfully be launched for thatparticular job. .... After careful consideration, select one or more candidates whom you wish to support. The selectionmust be realistic and the probability of winning must be fairly large. Launch your candidate in good time before the
19
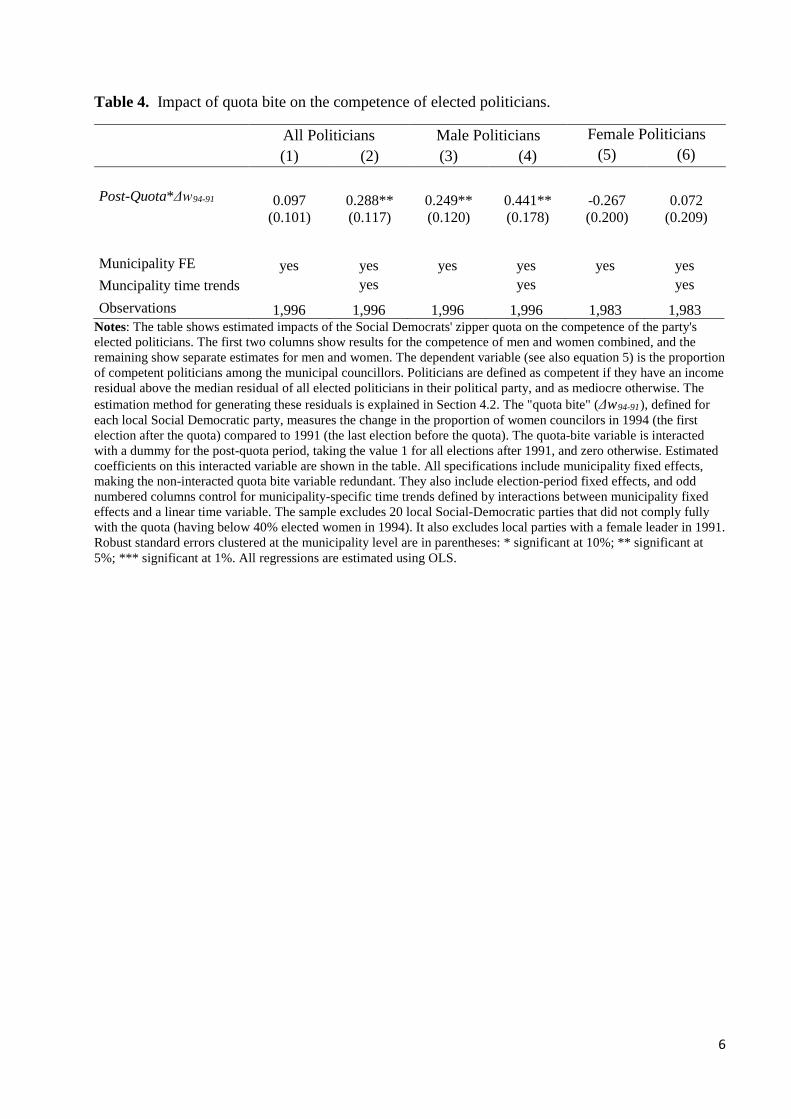
Simple difference-in-differences In Table 4, we examine the impact of the quota on average com-
petence as well as on competence by gender. It shows the results from simple difference-in-difference
regressions, where the bite of the quota is interacted with a dummy for the post-quota period (1994-
2014). Specifically, we estimate the following regression for all election years:
rm,t = ∆wm,94−91 × ρt + αm + εm,t . (5)
The dependent variable in (5), rm,t , is a measure of competence among one of three categories of
politicians in municipality m at election time t, namely (i) all elected Social Democrats; (ii) elected
male Social Democrats; or (iii) elected female Social Democrats. The quota bite variable ∆wm,94−91 is
interacted with dummy variable ρt, set equal to one for all elections after 1991. All regressions include
municipal fixed effects, αm. Thus we exploit the randomness in the quota reform, estimating the pre-post
selection difference within the same municipality as it relates to the quota bite. To make sure that we
capture the effect of the quota, rather than just a general time trends at the municipal level we include
municipality-specific (linear) time trends. For completeness, we also present the results without this
control. Finally, we cluster standard errors at the municipal level.
Focusing on municipalities with a male politician on top of the ballot in 1991 removes around 60
local parties (approximately 20% of the sample). We also exclude 20 local parties which did not comply
fully with the quota (having below 40% elected women in 1994), a restriction that reduces the sample
size by an additional 7%.32
[Table 4 here]
For the selection of all politicians in columns (1) and (2), the results show a positive impact of the
quota bite, which is significant once municipality time trends are accounted for. We also study the
effects by gender: columns (3) and (4) for men vs. (5) and (6) for women. These estimates show that
the overall effect mainly reflects an improvement in the selection of men. The coeffi cient in column
(4) means that a 10 percentage-point larger quota bite (just below the cross-sectional average for all
municipalities) raised the proportion of competent men by 4.4 percentage points. Given an average of
50 percent competent politicians in the average municipality (by definition, from the normalization),
this corresponds to a 9 percent increase in the share of competent men.
For women, we obtain a negative coeffi cient in the regression specification without municipality
trends, but a positive coeffi cient with trends. In neither case, however, is the estimate significantly
different from zero, suggesting that the quota neither raised nor cut the share of competent women.
meeting at which the decision on new members or chairperson is to be taken. ... Make sure women will be in the majorityat the meeting. If possible, seek male allies" (Social Democratic Women in Sweden, 1995). O’Brien and Rickne (2016)document that the quota indeed had a positive impact on the probability of female leadership in the local parties.32In the robustness analysis below, we show that our results hold up in the full, unrestricted, sample as well. Note that
a party can comply fully with the zipper mandate, but still have a share of women below 50% if the first name on the listis a man and the number of elected politicians is odd.
20
This is interesting in view of the meritocratic critique of gender quotas, namely that raising the share
of women through a quota must necessarily come at the price of lower competence among women.33
Dynamic difference-in-differences As our data covers a long time period after (and before) the
quota’s introduction, we can also examine the quota impact over time. For this purpose, we estimate:
This specification includes dummy variables for each election year, denoted by elect, and for each
municipality, denoted by αm. The coeffi cients of interest are now βt which capture the quota bite,
∆wm,94−91, in each specific election year t after (or before) the quota was introduced. We leave out
the 1991 interaction to make the immediate pre-quota election year the reference category — i.e., we
normalize β91 to 0. As we do not expect municipalities with a larger quota bite to experience any
effect on competence prior to the quota, the coeffi cients β82, β85 and β88 should be insignificant and
close to zero. By examining the estimates for the pre-quota periods, we can explicitly verify that pre-
existing trends in the outcomes were not correlated with the size of the quota bite. Coeffi cient β94gives the impact effect of the quota, and coeffi cients βt, for t > 1994, capture the effects in subsequent
periods. The latter would be similar in sign and magnitude to β94 if the zipper quota had a permanent
effect on selection. Allowing the effect to vary across elections also addresses the possibility that as
more time elapses after the quota introduction the estimates may get nosier as other changes occur in
municipalities.
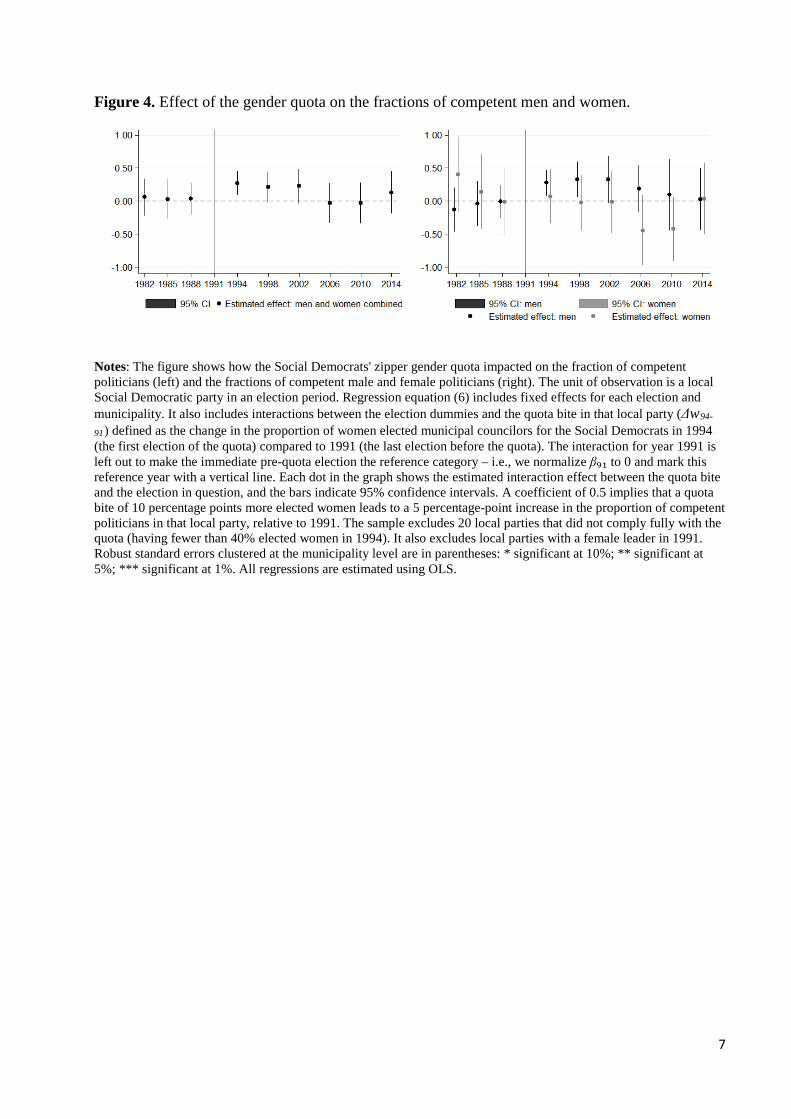
Our estimates are illustrated graphically in Figure 4, which examines men and women combined
(the left graph), as well as separately (the right graph). The plotted estimates of βt for the pre-quota
era —the 1982, 1985 and 1988 election periods —show that we need not be concerned about pre-trends.
The estimates are close to zero, lack statistical significance, and do not show any systematic temporal
pattern. This strongly suggests that our estimated effects are causal and not confounded by pre-trends
in the outcome variable(s).
Figure 4 also adds further insights about the effects of the quota. First, competence improved with
a larger quota bite immediately in 1994. The effect is statistically significant for two more elections
thereafter, a total period of 12 years. As the right graph shows, the improved selection derives mostly
from male politicians. This is in line with the simple pre-post difference-in-differences results in Table
4.
The coeffi cient on overall selection is close to zero for the last three elections. In the 2006 and 2010
elections, the overall zero appears to mask a gender difference, with positive but insignificant estimates
for men, and negative but insignificant estimates for women. However, in the 2014 election competence
33As suggested to us by a referee, the positive effect on overall competence may reflect a composition effect: if a largershare of women than men are competent, then raising the share of women will raise overall competence. In Section W3of the Web Appendix, we show that there may be such a composition effect, but that it can explain at most 15% of theincrease in overall competence after the quota.
21
among both men and women appear to have converged back to their initial levels. The reasons for this
deserve further exploration, something we leave for future research.34
[Figure 4 here].
Robustness checks We conduct a range of robustness checks on how the quota affected the selection
of politicians. First, the main results essentially remain when we drop the sample restrictions discussed
above (Table W7). Second, the results are robust to measuring the quota bite as the difference between
the share of women elected in 1991 and 0.5, rather than the difference between the share of women
elected in 1991 and 1994 (Table W8). Third, we attempt to rule out that our measure of the quota bite
is correlated with shocks to the demand for competent men. To do so, we show that the main results
hold up when we control for a number of economic and political municipal characteristics interacted
with all election-year dummies (Table W9). Fourth, we test for the confounding role of municipal
characteristics by using the share of competent politicians in the Conservative and Center Party in the
same municipalities as a placebo outcome (Table W10), finding no effect of the Social Democratic quota
on the selection in these parties. Fifth, we find that our main results are robust to using the cognitive
score and the leadership score from the military draft, rather than our measure based on the residuals
from the earnings regression, as the dependent variable (Tables W11 and W12).
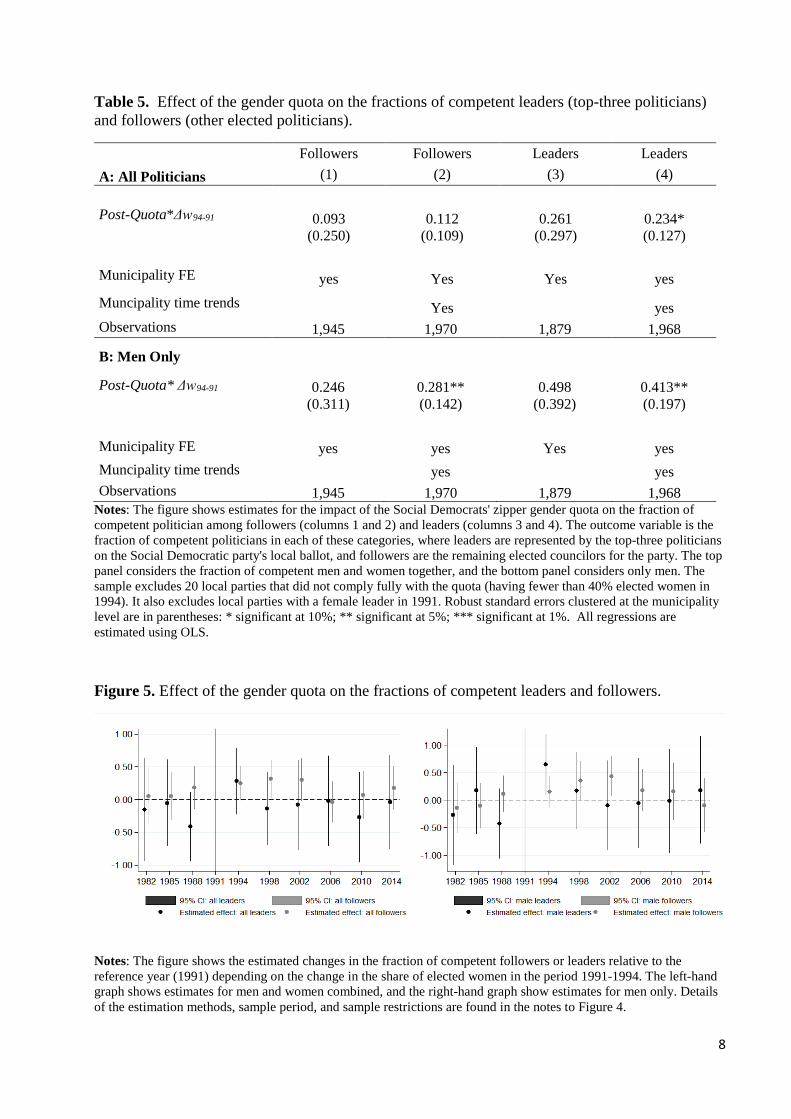
Leaders and followers To better understand the results so far, we examine whether the selection of
leaders and followers were differentially impacted by the quota. Given the results in Table 4 and Figure
4, we expect any effects to be dominated by the selection on male politicians. Table 5 largely confirms
this expectation. Here, we repeat the same simple difference-in-differences exercise as in Table 4, but
separately for politicians in the top-three slots on the ballot — leaders —and those below —followers.
Panel A shows the results for all politicians, while panel B shows them for men only.
The positive coeffi cients indicate that selection improved in both groups. However, for politicians
of both sexes, the only statistically significant estimate is that for followers in the specification with
municipality-level trends. For male politicians, again only one coeffi cient is statistically significant, but
this time it is the one for followers in the specification without municipality trends. This suggests a weak
tendency for a stricter quota to induce more competent politicians, especially among male followers.
[Table 5 here]
More can be learned from period-by-period estimation. In Figure 5, we use the same graphical
approach as in Figure 4, plotting the point estimates and their standard errors. Comparing the left and
right graphs, we see that the effects are driven by the impact on men. The figure paints a clear picture:
a positive impact of the quota bite on leaders as well as followers, but with a different temporal pattern.
34We pick this up in the theoretical discussion of dynamic effects in Section 6 below.
22
For leaders, we see a large positive impact in 1994, the first election with the quota. For followers, the
improved competence instead appears in the two subsequent elections in 1998 and 2002.35 In addition
—and similar to Figure 4 —both groups record smaller estimates that lack statistical significance in the
last three elections of the sample period.36
[Figure 5 here]
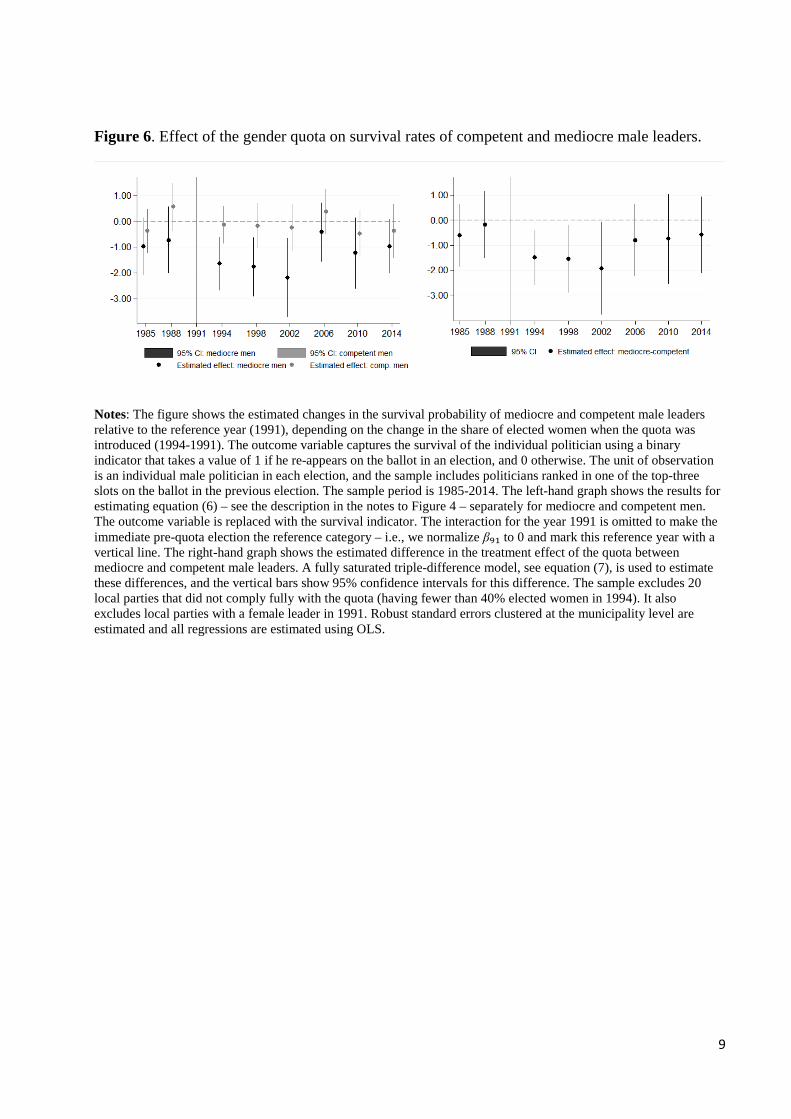
Leader survival It is intriguing that leader competence improved upon the introduction of the quota.
Since the higher competence among 1994 leaders is measured relative to 1991 leaders, it could potentially
reflect male mediocre leaders not surviving the introduction of the quota. To explain the results in Figure
5, this reduction in leadership survival would have to occur immediately after the quota introduction.
Therefore, we use period—by-period estimation to analyze leader survival.
The indicator of survival, denoted si,t, takes the value 1 if politician i, elected to the top-three on the
electoral ballot in period t− 1, re-appears on the list in election t. To examine whether male mediocre
leaders survive, we use an individual measure of mediocrity, a dummy variable denoted xi = 1 − ci,
which is equal to one if politician i has below median competence. We then run the following regression:
The mediocrity dummy, xi, is interacted with the quota bite, ∆wm,91−94, and the dummies for elections
periods, elect.We also include pair-wise interactions between these three variables. Of particular interest
is coeffi cient β94, which captures the survival of mediocre leaders relative to competent leaders in the
first election under the quota compared to the relative survival rate in the reference year, 1991. Thus, a
negative coeffi cient implies that a stricter quota decreases the relative survival probability of mediocre
leaders.
The results are illustrated graphically in Figure 6. The left-hand graph reports the coeffi cients βtfrom estimating equation (6) separately for mediocre and competent politicians. The right-hand graph
instead reports the coeffi cients βt from the triple-difference specification in equation (7).
[Figure 6 here]
A stricter gender quota does indeed decrease the survival rate of mediocre leaders in the three elections
following its implementation. The estimates in left-hand graph show that the quota reduced the survival
of mediocre leaders relative to competent leaders in the three election periods following the quota. These
differences in the effects on survival are statistically significant at the 5 percent level. In 1994, the point
35The differences in the timing across the two groups should be interpreted with some caution as the estimates aresomewhat imprecise.36A corresponding figure for the selection of female leaders and followers is shown in the Web Appendix (Figure W2).
23
estimate suggests that a 10 percentage point larger quota bite led to an 11 percentage point lower
survival probability for mediocre leaders compared to competent leaders. As shown in the right graph,
this difference is statistically significant for the first three elections following the quota.
Leader survival and follower competence That mediocre leaders do not survive (and were re-
placed by more competent ones) could help explain that the quota also led to higher follower competence.
The Web Appendix offers some evidence on this in the form of municipality-level correlations between
survival rates of mediocre leaders and the competence of followers. In a cross-municipality regression,
we relate the change in the share of competent followers via the quota bite to the average survival rate
of mediocre male leaders from the 1991 to the 1994 election in each particular local party. The results
(Table W11) indicate that the positive quota effect on follower competence is directly tied to the survival
of mediocre male leaders. Specifically, they suggest that the quota impact on follower competence was
roughly five times larger if no, rather than all mediocre leaders survived from 1991 to 1994.
Alternative explanations A “mechanical” explanation for our finding that the quota raised the
competence of men could emanate from a local-party ranking according to candidate competence. The
fact that the quota forced Social Democratic local parties to cut the number of male candidates to
make room for women might then have raised the share of competent men. To address this potential
concern, we repeat the analysis holding constant the number of elected men in each local party, either
at the same number of men post quota as pre quota (1991), or at the men with the three highest list
ranks post and pre quota. The results, found in Web Appendix Table W14, do not provide support for
this mechanical explanation. We can also rule out that the improvement in male competence reflects a
supply effect related to the quota bite (Table W13).37
Higher competence of leaders in the elections following the quota might also be due to pressure from
national Social Democratic leaders forcing mediocre leaders to resign. However, we do not believe that
this is the case given the strong norm in Swedish national parties to honor the autonomy of their local
parties. Recent work by Folke et al. (2016) reinforce that view by citing documents from national party
congress meetings.
Finally, we examine if the quota affected election outcomes, as might be expected from the model
and the fact that the quota raised competence. Altered election outcomes could either have reinforced,
or counteracted, the effect of the quota on male competence by affecting the number of seats won by
the party. We use three different electoral outcomes: the local party’s number of seats in the municipal
assembly, its seat share in the assembly, and its vote share in the local election, as alternative outcome
variable in equations (5) and (6). The results do not suggest that electoral effects explain our results
(Web Appendix Table W16). A likely reason for this is that gender quota was simultaneously introduced
on the Social-Democratic party’s national electoral lists. Because local and national elections are held on
37Here, we exploit the fact that the full list better reflects supply compared to elected politicians as in the sequentialrecruitment model of Norris and Lovenduski (1995). The effect on selection is smaller when we examine the full list.
24
the same day, reactions to the national-level quota may have obscured local responses. At the national
level, we may note that 1994 was the party’s most successful election in our (1982-2014) sample period
(see Figure W3).38
Summary We have shown that a larger bite of the Social Democratic gender quota raised the compe-
tence of elected candidates. This higher competence is due to the selection of male politicians, with no
significant change of female competence. A careful look at the time patterns among leaders and followers
reveals that the competence of male party leaders went up in the first election under the quota, while
the competence of elected male followers went up in the next few elections. Upon closer inspection,
the immediate improvement in leadership competence reflects a lower than usual survival rate among
mediocre leaders.
6 Making Sense of the Results
To interpret the empirical effects of the quota theoretically, we extend the model from Section 3 in
two ways. First, we allow candidate selection by gender as well as competence. This extension adds
to recent theoretical work on the selection of politicians. For example, compared to Julio and Tavares
(2010), Galasso and Nannicini (2011), or Casas-Arce and Saiz (2015), we explicitly model the trade-off
facing a political leadership which dominates list selection in a proportional representation (PR) system.
Second, we allow leaders to resign strategically “for the good of the party”before the election. The latter
gives an unambiguous prediction that a quota triggers a higher resignation rate for mediocre leaders
and hence offers a straightforward explanation for the empirical results in Section 5 on the competence
of male leaders and followers.
Step 1 extension: Male and female candidates Politicians now differ by gender as well as
competence. We denote the share of women on party D’s ballot by wD. We focus on how male leaders
chose wD and rD (the share of competent) at selection stage 2. Analogous to our assumption in the
core model, wD is unaffected by the number of seats won by party D. This way, we allow wD and
rD to be independently optimized by the leadership. Female candidates can thus be competent or
mediocre. In other words, we assume that only overall (rather than gender-specific) competence and
gender composition of candidates matter for electoral success as well as leader survival.
The representative voter has the following policy payoff from having party D in power:
vD = αlD + (1− α)rD + µ (wD) ,
where µ (·) is a concave function with a maximum at 1/2. Thus the average voter likes not only party
38Since the election-period fixed effects will pick up this national trend, and voters are more likely to react to nationallevel representation, additional effects from local variation would become hard to detect empirically.
25
competence but also gender equality.39 Throughout this section, we focus on a partial-equilibrium
analysis, where vB, the policy utility offered by party B, is held fixed. This theoretical simplification
allows us to focus on the role of the gender quota, absent political competition.40
Leadership survival Leadership survival now depends on the competence and gender composition
of the elected candidates. Specifically, the leadership now survives at stage 5 if
σ (wD, rD)− lD + ε < 0 ,
where σ (·) is a “threat function”increasing and convex in both arguments. Since our assumed startingpoint has a male leader in offi ce, more competent followers and more women followers both increase the
threat to the incumbent for given lD.41 The assumption that a higher share of women raises the threat
to a male leader is consistent with the (context-specific) translating-numbers-into-influence strategy
among Social Democratic women cited in the beginning of Section 5.2. It is also consistent with a
(general) gender-specific component in policy preferences.42 This threat function replaces the share of
competent candidates in the leader’s survival function in the leadership contest, such that the latter
becomes Q(lD − σ (wD, rD)). Function Q is thus decreasing in rD and wD. In this formulation, only
overall competence and gender balance matter for a leader’s survival as he picks a candidate portfolio.
Whether chosen women are competent or not does not matter per se.43
The optimal choice of r and w The leader chooses rD and wD at stage 2 to trade off his own
survival against the electoral success of the party. This gives first-order conditions:
where {r∗D, w∗D} denote optimal choices. The second condition determines optimal competence r∗D whichmirrors the trade-off between leadership survival and party victory of the model without gender.
39This is because the electorate comprises equal numbers of men and women.40It also makes sense in view of the empirical results in the Web Appendix that the introduction of the Social Democratic
quota had no effect on the selection in the other parties or on election results.41Over time, as the fraction of women leaders increases, the nature of this threat could change as we discuss further
when we consider multi-period implications below.42A large literature has argued that politicians’preferences are associated with their life experiences (Phillips, 1995),
with gender-based differences in such experiences being an important example. In Figure W4, we present results from asurvey sent to Social Democratic representatives, which supports this argument in our application.43It would be straightforward to extend the model to have the survival threat be a function of the size of the four
potential groups of followers differentiated by both gender and competence with separate effects on survival for eachgroup. This could, in principle, allow the model to analyze when the women chosen will be competent. However, specificpredictions would be highly dependent on the detailed properties of the threat function.
26
A similar trade-off shapes the optimal fraction of women w∗D. This first-order condition implies
that w∗D < 1/2 —as more women threaten his survival, σ1 > 0, the male leader chooses w∗D on the
upward-sloping part of function µ (·) such that µ′ (w∗D) > 0. This makes intuitive sense: a male leader
will not pursue gender parity even though voters want it, as long as women threaten his survival more
than men do.
A quota in party D Now consider a binding gender quota at 50%, i.e. wD = 1/2. Since we have
just shown that w∗D < 1/2, this quota must raise the fraction of women. How much the quota bites will,
however, vary with the municipality-specific competence of the initial leadership lD, the threat function
σ, and electoral competition p.
To derive the impact on competence for w ≥ w∗K , let us define RD (w) from
−σ2 (w,RD (w, lD)) q(lD − σ (w,RD (w, lD)))e+
p(αlD + (1− α)RD (w, lD) + µ (w)− vB)(1− α) = 0 .
The optimal choice of competence under a quota is given by RD (1/2, lD) and the pre-quota competence
level is RD (w∗D, lD). The change in competence due to a quota is given by
without more specific assumptions on the shapes of the threat function (and its cross derivative) and
the densities q (·) and p (·). Thus, whether a quota raises or cuts competence via this channel is notclear a priori. This makes intuitive sense as an incompetent leader may be motivated to reduce the
fraction of competent candidates if this decreases the marginal threat of being replaced at a higher
fraction of women. Even though the sign is ambiguous, equation (10) does justify modeling the effect
on competence from the introduction of a quota as proportional to the quota bite 12−w∗D. It thus offers
a theoretical rationale for the empirical specifications in Section 5.
However, if the only effect of a gender quota is to change the threat of leader survival, the extended
model does not offer a straightforward explanation of the empirical results. Indeed, a quota could make
a male leader defend himself by lowering candidate competence as the quota itself elevates the threat
to his survival.
In similar vein, we can look at the impact of a quota on leadership survival:
∆σ =
∫ 1/2
w∗D
dσ (w,RD (w, lD))
dwdw ∼=
dσ (w∗D, RD (w∗D))
dw
[1
2− w∗D
], (11)
27
which is also ambiguous in sign without making further assumptions on the shape of the threat function.
This reflects the fact that (10) is ambiguous in sign —with the possibility that a gender quota causes a
leader to reduce the fraction of competent candidates suffi ciently to nullify the threat of the quota. Once
again though, equation (11) does suggest an empirical specification with a changed threat proportional
to the quota bite.
Summarizing, when the fractions of competent followers and women both affect expected leader
survival, a quota will provoke a competence response. However, the equilibrium predictions for overall
competence and leadership survival are ambiguous. But this model extension ignores a possible strategic
response to the quota where the leader chooses to step down. Adding this realistic possibility generates
a more clear-cut prediction in line with the empirical findings.
Step 2 extension: Leader resignations To explore the possibility of strategic resignation, we add
a new decision between stages 1 and 2 in the model:
1. Party D has a leader with competence lD.
1.5 The incumbent male leader lD may choose to resign. If he does, a new male leader with competence
zD is drawn at random. Expected competence of a new leader is thus E(zD).
2. Whoever is the leader chooses the share of competent candidates rD and the share of women wD.
3. The council election is held.
4. A popularity shock ε for the leader is realized followed by a leadership contest in each party, where
the leader’s chance of survival is increasing in lD − σ (wD, rD) .
5. Payoffs are realized.
As above, we ignore inter-party competition, focusing exclusively on leader choices. The new force
driving the new result is that resignation is strategically forward-looking, i.e. leaders anticipate the
effects of resigning on the party’s fortune when a new leader selects the composition of the list. As
the competence of a new leader is randomly drawn, a mediocre (competent) incumbent anticipates an
incoming leader more (less) competent than himself. This enhances the chances of the party winning,
even though the leader loses his personal rent from holding offi ce.
To explore these issues formally, let the equilibrium maximized payoff of the leader with competence
where the expectation E is taken with respect to zD. We assume that ∂V (q, vB) /∂k ≥ 0 for all
k ∈ [0, 1/2] , which says that the expected probability of winning the general election is higher when a
leader faces a stricter gender quota. Moreover ∂V (lD,W (lD,k),vB)∂lD
> 0 for k ∈ [0, 1/2].
Equilibrium resignations The incumbent decides whether to resign at stage 1.5 by comparing the
continuation value without resignation V (lD,W (lD, k) , vB) from (12) with resignation VD (k, vB) from
(13). Define lD (k) implicitly by
V (lD (k) ,W(lD (k) , k
), vB) = VD (k, vB)
and suppose that lD (k) ∈ [0, 1] for all k ∈ [0, 1/2]. A leader with competence lD (k) is thus indifferent
to resigning, whereas leaders with lD < lD (k) resign. Moreover, for W (k, lD) < k,
∂lD (k)
∂k= −
[∂V (lD,W (k, lD) , vB)
∂k− VD (k, vB)
∂k
]/∂V (lD,W (k, lD) , vB)
∂lD> 0 .
This implies that lD (k) is increasing in the relevant range, so more leaders resign with a higher gender
quota. The reason is that a leader who stays in offi ce faces a greater threat to survival. Since mediocre
leaders face the largest threat, they are the first to resign.
44If wD = argmaxwD V (lD, wD, vB) , the envelope theorem assures that this is still the case.
29
Therefore, a gender quota will lead to more resignations of mediocre leaders. The shift in the resig-
nation point for leader competence is approximately given by:
l
(1
2
)− lD (0) ' ∂lD (0)
∂q
[1
2−W (0, lD)
],
such that mediocre leaders resign more frequently where the quota bite is larger. Following any resig-
nation, there is an expected increase in the competence of all politicians on the list.
We summarize the results as:
Prediction The introduction of a quota raises the resignation rate for mediocre leaders, with a larger
effect at a greater quota bite. The expected competence of politicians increases following such leader
resignations.
The model extension with leader resignations thus gives a clear-cut prediction which is consistent
with the empirical findings. Moreover, we find the underlying mechanism quite persuasive since such
strategic reactions are a realistic feature of political life. The extension can explain unambiguously why
followers become more competent following the introduction of a quota.
We have modeled resignations as purely voluntary. But there could also be social pressure within
a party to resign. This could most easily be thought of in terms of the model as diminishing the ego
rent from holding offi ce. If the local party could credibly commit to reducing ego rents e using social
pressure on a medicare leader who chooses to stay, then “resignations”could be a metaphor for more
coercive reasons for departure, a possibility which would reinforce the predictions of the model.
Dynamic considerations Our model only studies a single period where a quota is either introduced
or not. But the empirical findings span a number of elections. Our core ideas remain valid if the leader
at the end of the period becomes the incumbent leader at the beginning of the subsequent period. In
that case, it may take some time for the effects described here to manifest themselves depending on how
popularity shocks to leaders unfold. This will lead to municipality-specific dynamic paths.
A fully-fledged dynamic analysis is beyond the scope of this paper. However, in future developments,
a dynamic model might add some interesting features. First, the party could find ways of affecting the
competence of leaders so that lD evolves over time. Second, we would expect the influence of female
leaders to grow over time after a quota is introduced. If some of these leaders are mediocre, then pressures
to reduce competence among followers would reassert themselves even when leaders are women. Third,
we might expect cultural evolution in voter expectations, as they gradually see the impact of the quota
on policy and political representation. This evolution could go in different directions depending on what
voters perceive. For example, Beaman et al. (2009) report citizens in India raising their perceptions of
women’s competence when exposed to powerful women politicians.
Such dynamic responses to quotas would be interesting topics for further theoretical research. More
than that, the predictions would be ripe for empirical investigation in the Swedish context. Developing
30
the theory further would also be helpful in identifying exactly which conditions are needed for a combi-
nation of a gender quota and leader resignations to result in increased competence. It would also help
diagnose whether a quota policy might work, e.g., as part of a program to promote equal opportunity
in a developing country.
Summary The extensions of the simple model make clear why we should expect the effects of a gender
quota to be proportional to the quota bite. They also show that quotas have theoretically ambiguous
effects on competence, unless we consider departures of mediocre leaders through resignations. The
theoretical findings in this section offer perhaps the simplest interpretation of the empirical findings in
the previous section. Resignations of leaders appears to be an important selection mechanism for quotas
to improve competence.
7 Conclusion
A failure to recruit and select competent politicians remains a concern in many democracies. Some con-
tributors to academic and popular debates see the goals of representation and competence as conflicting.
When debating the merits of gender quotas, it is commonly claimed that supply constraints make quo-
tas counterproductive by replacing competent men with mediocre women. Based on first principles and
empirical evidence, we have claimed, to the contrary, that quotas can increase the competence of the
political class by reducing the share of mediocre men.
We have developed a model for selecting candidate competence in a PR list system. Mediocre party
leaders do not pick competent candidates due to a concern for their own survival. When the share of
women is increased by a mandatory quota, more women oppose male leaders due to differing policy
preferences. Male leaders could defensively respond by further reducing competence to counter this
increased threat to their power. However, they understand that this strategy may threaten the party’s
electoral success. Just like a CEO may prefer to resign and keep severance pay checks coming as the firm
avoids bankruptcy, a political leader may choose to resign to keep the party in power and his preferred
policy implemented. Such leadership resignation may raise candidate competence.
One of the main contributions of the paper is to suggest a new approach to measuring competence
based on the earnings of politicians outside of politics conditional on age, education, occupation, and
time. This newmeasure is systematically associated with political success, with leadership and cognitive-
ability scores from the military draft, and (for elected members of the governing party) with proxies for
a well-run municipality. With this measure in hand, we have explored the link between the competence
of leaders and candidates further down the list, finding a strong link between the two.
We have also studied the impact of a gender quota on selection, finding that a stricter quota raised
competence, especially among men. Our analysis uncovers a distinct temporal pattern in the impact on
leader and follower selection. The quota had an immediate effect on the competence of male leaders by
31
triggering a wave of resignations of mediocre leaders. Moreover, where mediocre men resign we find the
largest improvements in follower competence in the following election periods. In future work, it would
be interesting to see how far the quota can be exploited as an instrumental variable with politician
competence and policy outcomes as outcome variables.
Our paper is part of a wider agenda that emphasizes the importance of selection in politics.45 It
is important to understand selection in a broader context, especially the political motives to bring in
more competent candidates. Of course, a gender quota may be important in its own right to promote
equality in political representation. Our results suggest it may also help to disrupt some of the political
forces that maintain the dominance of a mediocre male elite.
45See Besley (2005) for background discussion and Dal Bo et al for Swedish evidence.
32
References
[1] Alesina, A., N. Roubini, and G. Cohen (1997), Political Cycles and the Macroeconomy, Cambridge,MA: MIT Press.
[2] Baltrunaite, A., P. Bello, A. Casarico, and P. Profeta (2014), "Gender Quotas and the Quality ofPoliticians", Journal of Public Economics 118, 62-74.
[3] Banks, J. and R. K. Sundaram, (1998), "Optimal Retention in Agency Models,”Journal of Eco-nomic Theory 82, 293—323.
[4] Beaman, L., R. Chattopadhyay, E. Duflo, R. Pande, and P. Topalova, (2009), “Powerful Women:Does Exposure Reduce Bias?”, Quarterly Journal of Economics, 124 (4), 1497-1540.
[5] Besley, T. (2005), “Political Selection.”Journal of Economic Perspectives, 19(3), pp. 43-60.
[6] Besley, T. and S. Coate (1997), "An Economic Model of Representative Democracy", QuarterlyJournal of Economics 112, 85-114.
[7] Besley, T. and M. Reynal-Querol (2011), "Do Democracies Select More Educated Leaders?", Amer-ican Political Science Review 105, 552-566.
[8] Caillaud, B. and J. Tirole (2002), "Parties as Political Intermediaries", Quarterly Journal of Eco-nomics 117, 1453-1489.
[9] Campa, P. (2011), "Gender Quotas, Female Politicians and Public Expenditures: Quasi-Experimental Evidence", mimeo, IIES.
[10] Carlstedt, B. (2000), Cognitive Abilities —Aspects of Structure, Process and Measurement, Disser-tation. University of Gothenburg: Gothenburg Studies in Educational Sciences.
[11] Carnes, N. (2013), White-collar Government: The Hidden Role of Class in Economic Policy Mak-ing, University of Chicago Press.
[12] Casas-Arce, P. and A. Saiz (2015), "Women and Power: Unpopular, Unwilling, or Held Back?",Journal of Political Economy 123, 641-669.
[13] Chattopadhyay, R. and E. Duflo (2004), "Women as Policy Makers: Evidence from a RandomizedPolicy Experiment in India", Econometrica 72, 1409-1443.
[14] Dahlerup, D. (2006), "The Story of the Theory of Critical Mass", Politics & Gender 2, 511-522.
[15] Dal Bo, E., F. Finan, O. Folke, T. Persson, and J. Rickne (2016), "Who Becomes a Politician?",mimeo, IIES.
[16] Egorov, G. and K. Sonin (2011), "Dictators and Their Viziers: Endogenizing the Loyalty—Competence Trade-Off," Journal of the European Economic Association 9, 903-930.
[17] Eckbo, B.E., K. Nygaard, and K.S. Thorburn (2016), "Does Gender-balancing the Board ReduceFirm Value?", mimeo, Tuck School of Business.
[18] Esteve-Volart, B. and M. Bagues (2012), "Are Women Pawns in the Political Game? Evidencefrom Elections to the Spanish Senate", Journal of Public Economics 96, 387-399.
33
[19] Ferreira, F. and J. Gyourko (2011), "Does Gender Matter for Political Leadership? The Case ofU.S. Mayors", NBER,Working Paper Series, No. 17671.
[20] Folke, O., L. Freidenvall, and J. Rickne (2015), "Gender Quotas and Ethnic Minority Represen-tation: Swedish Evidence from a Longitudinal Mixed Methods Study", Politics & Gender 11,345-381.
[21] Folke, O. and J. Rickne, (2016), "The Glass Ceiling in Politics: Formalization and Empirical Tests",Comparative Political Studies 49(5): 567-599.
[22] Folke, O., T. Persson, and J. Rickne (2016), "The Primary Effect: Preference Votes and PoliticalPromotions", American Political Science Review 110, 559-578.
[23] Folke, O. and J. Rickne (forthcoming), "Electoral Competition and Gender Differences in PoliticalCareers", Quarterly Journal of Political Science.
[24] Franceschet, S., M.L. Krook, and J. M. Piscopo (eds.) (2012), The Impact of Gender Quotas, NewYork: Oxford University Press.
[25] Gagliarducci, S. and D. Paserman (2012), "Gender Interactions within Hierarchies: Evidence fromthe Political Arena", Review of Economic Studies 79, 1021-1052
[26] Galasso, V. and T. Nannicini (2011), "Competing on Good Politicians", American Political ScienceReview 105, 79-99.
[27] Heckman, J.J. (2006), "Chapter 7, Earnings Functions, Rates of Return and Treatment Effects: TheMincer Equation and Beyond", in Hanushek, E. and F. Welch (eds.), Handbook of the Economicsof Education, Vol. 1, Amsterdam: Elsevier.
[28] Julio, P. and J. Tavares (2010), "The Good, the Bad, and the Different: Can Gender Quotas Raisethe Quality of Politicians?", CEPR Discussion paper 7917.
[29] Keane, M. and A. Merlo (2010), "Money, Political Ambition, and the Career Decisions of Politi-cians," American Economic Journal: Microeconomics 2, 186-215.
[30] Kleven, H, J., C. Landais, and J. Sogaard (2015), "Children and Gender Inequality: Evidence fromDenmark", mimeo, London School of Economics.
[31] Krook, M. L. (2010), "Women’s Representation in Parliament: A Qualitative Comparative Analy-sis", Political Studies 58, 886-908.
[32] Krook, M.L. (2009), Quotas for Women in Politics: Gender and Candidate Selection ReformWorldwide, New York, NY: Oxford University Press.
[33] Lindqvist, E. and R. Vestman (2011), "The Labor Market Returns to Cognitive and NoncognitiveAbility: Evidence from the Swedish Enlistment", American Economic Journal: Applied Economics3, 101-128.
[34] Merlo, A., V. Galasso, M. Landi, and A. Mattozzi (2010), "The Labour Market of Italian Politi-cians", in Boeri, T., A. Merlo, and A. Prat (eds.), The Ruling Class, New York: Oxford UniversityPress.
[35] Montabes, P. and C. Ortega Villodres (2002), "Position Effects and Party Nomination Strategiesunder the Limited Vote: The 2000 Spanish Senate Election", Representation 38, 304—316.
34
[36] Murray, R. (2010), "Second Among Unequals? A Study of Whether France’s ‘Quota Women’AreUp to the Job," Politics & Gender 6, 643-669.
[37] Murray, R. (2014), "Quotas for Men: Reframing Gender Quotas as a Means of Improving Repre-sentation for All," American Political Science Review 108, 520-532.
[38] Norris, P. (2004), Electoral Engineering: Voting Rules and Political Behavior, Cambridge, UK:Cambridge University Press.
[39] Norris, P.and J. Lovenduski (1995), Political Recruitment: Gender, Race and Class in the BritishParliament, London: Cambridge University Press.
[40] O’Brien, D. (2012), "Quotas and Qualifications in Uganda", in Franceschet, S., M-L. Krook, andJ.M. Pircopo (eds.), The Impact of Quotas on Women’s Descriptive, Substantive, and SymbolicRepresentation, New York: Oxford University Press.
[41] O’Brien, D. and J. Rickne (2016), "Gender Quotas and Women’s Political Leadership", AmericanPolitical Science Review 110(01): 112—126.
[42] Osborne, M. J. and A. Slivinski (1996), "AModel of Political Competition with Citizen-candidates",Quarterly Journal of Economics, 111, 65-96.
[43] Pettersson-Lidbom, P. (2008), "Do Parties Matter for Economic Outcomes? A Regression-Discontinuity Approach", Journal of the European Economic Association 6, 1037-1056.
[44] Phillips, A. (1995), The Politics of Presence, Oxford University Press.
[45] Rehavi, M. (2008), "Sex and Politics: Do Female Legislators Affect State Spending?", mimeo, UCBerkeley.
[46] Social Democratic Women in Sweden (S-kvinnor) (1995) "The Power Handbook".<http://www.socialdemokraterna.se/Webben-for-alla/S-kvinnor/S-kvinnor/In-English1/The-Power-Handbook1/>
[47] Soininen, M. and N. Etzler (2006) Partierna nominerar: Exkluderingens mekanismer — etnicitetoch representation (Political Parties Nominate: Mechanisms of Exclusion —Ethnicity and Repre-sentation), SOU 2006:53.
[48] Svaleryd, H. (2009), "Women’s Representation and Public Spending", European Journal of PoliticalEconomy 25, 186-198.
[49] Törnqvist, M. (2007), "Vägen till varannan damernas" (The Road to the Zipper Quota), Tidskriftför Genusvetenskap 4, 25-46.
35
1
Figure 1. Perceived influence over the composition of the electoral ballot.
Notes: The figure compares the distribution of politicians' perceptions of the degree of influence that the elected representatives (black bars) and party leadership (yellow bars) have over the process of composing the local party's electoral ballot. Possible responses rank from 1=Very Little influence, to 5 = Very much influence. The Y-axis capture the percentage of respondents in each category. Data is drawn from the 2012 Survey of Local Swedish Politicians (for details, see Gilljam and Karlsson, 2014). We select local parties from the seven main parliamentary parties over our sample period, and exclude local parties with seven or fewer municipal councilors. N = 4 801.
Table 1. Correlations between individual competence and political success measures.
Observations 54,445 53,627 106,180 101,659 101,659 106,180 19,734 16,015 Notes: The table shows estimation results for the correlations between a binary indicator of individual competence and: (i) four measurements of political success (columns 1-6), and (ii) two measurements of ability from military enlistment data (columns 7 and 8). Politicians are defined as competent if they have an income residual above the median residual of all elected politicians in their political party, and as mediocre otherwise. The estimation method to generate these residuals is explained in Section 4.2. The binary indicator has been multiplied by 100 so that the coefficients in columns 1-6 should be read as 1.0 = 1 percentage point. Draft scores in columns 7 and 8 are transformed to z-scores so that 1.0 = 1 standard deviation. The outcome variables are defined as follows. “Preference vote share” is the politician's number of preference votes divided by the total number of preference votes for all candidates in the same party in the same local election; “Re-election” is a binary indicator for being re-elected in the next election; “List rank” is an integer measure of rank, starting with rank =1 at the top of the electoral ballot; and “Top ranked” is a binary indicator for rank =1. Data includes locally elected politicians from the seven major parties in the national parliament. For preference votes, the sample period is 1998-2014, while it is 1982-2014 for all other dependent variables. Robust standard errors clustered at the municipality level are in parentheses: * significant at 10%; ** significant at 5%; *** significant at 1%. All regressions are estimated using OLS.
010
2030
40S
hare
of R
espo
nden
ts
1 2 3 4 5Very Little Very Much
Elected Representatives Party Leadership
To what extent do the following groups within the partydetermine the composition of the electoral ballot
in your municipality?
2
Table 2. Correlations between share of competent politicians and quality of municipal governance.
Citizen Satisfaction
Index
JO Complaints
per 1000
JO Criticisms per 1000
Sustainable Finance Index
Net Result over Total
Costs
Average Solvency
Rate
Share of competent councilors in party appointing the mayor
(0.648) (0.066) (0.011) (0.126) (0.212) (1.833) Election-period FE
yes yes Yes yes yes yes
Observations 431 1,355 1,355 1,136 1,140 1,136
R-squared 0.012 0.037 0.024 0.042 0.156 0.032 Notes: The table shows the estimated relationship between the share of competent politicians and measures of the quality of municipal governance. In the top panel, the independent variable is the share of competent politicians in the political party which has appointed the mayor. In the lower panel, it is the proportion of competent politicians among the top three people on the ballot of that party, which we use as a measure of the quality of a party's leadership. A politician is defined as competent if they have an income residual above the median residual of all elected politicians in their political party, and as mediocre otherwise (see Section 4.2 for methodological details). The dependent variables are: (1) a Citizen Satisfaction Index based on Statistics Sweden's municipal population surveys, the details of which are explained in Section W1 in the Web Appendix. If a municipality participated twice in the survey during an election period, we average the surveys. (2) The number of complaints per 1000 inhabitants from citizens regarding the municipality's administrative decisions, recorded by the government agency Justitieombudsmannen (JO). (3) The number of complaints per thousand inhabitants which resulted in the JO issuing a formal criticism. (4) The average net accounting surplus as a proportion of total municipal spending, from yearly budget data and averaged over each election period. (5) The average solvency rate (assets minus debt over assets) averaged over the election period. (6) A combination of measures (4) and (5) into an index of Sustainable Public Finances, on a scale from 1 to 6, as Detailed in Table W1. Section W1 in the Web Appendix contains more information on these outcomes. The unit of observation is the municipality-election period. Data is for 2005-2014 for (1); 1982-2014 for (2) and (3); and 1991-2014 for (4)-(6). Robust standard errors clustered at the municipality level are in parentheses: * significant at 10%; ** significant at 5%; *** significant at 1%. All regressions are estimated using OLS.
3
Table 3. Estimated relationship between leadership competence and follower competence.
Top-3 competence 0.081*** 0.006 (0.015) (0.016) Lagged follower competence 0.369*** (0.020) Election-period FE yes yes yes yes yes yes yes yes Municipality FE yes yes yes Municipality*party FE
yes
Observations 3,028 3,708 3,015 2,920 3,028 3,028 976 826 Notes: The table shows the estimated relationship between competence of the political leadership and the selection of followers in those parties in future elections. Leaders are defined as the top three politicians on the party's ballot, and followers are defined as the remaining elected politicians further down the ballot. The unit of observation is the local party and election period. The sample includes all parties with at least 8 municipal councilors. The data period is 1982-2014. The three outcome variables measure competence as (i) the binary income residual (columns 1-6), (ii) the cognitive score from the enlistment procedure of the Swedish military (column 7), and (iii) the leadership score from the same procedure (column 8). The enlistment data covers men in the 1951-1980 cohorts only. Robust standard errors clustered at the level of the local party are in parentheses: * significant at 10%; ** significant at 5%; *** significant at 1%. All regressions are estimated using OLS.
4
Figure 2. Example of “zipped” ballot from Social Democrats, 2006 election.
5
Figure 3. Average share of elected women in local parties (top) and average changes in share of elected women in these parties (bottom) by type of strategy to raise women's representation.
Notes: The top graph shows the development over time in the average proportion of women among the municipal councilors for the three largest political parties in 1982-2014: the Social-Democratic party, the Conservative Party and the Center Party. The bottom graph compares the impact on women's representation of two strategies introduced by these parties: a formal recommendation to increase the proportion of women, introduced by the Conservatives in 1993 and the Center party in 1996; and a zipper quota, introduced by the Social Democrats in 1993. For each party, the sample is the municipal councilors in the election period immediately before, and immediately after, the introduction of each reform. The lines show the distribution across 286 municipalities of the proportion of women after the reform minus the proportion of women before the reform. We thus compare the distribution of impacts on women's numerical representation between the zipper quota (long dash), and recommendations (solid and short-dash).
6
Table 4. Impact of quota bite on the competence of elected politicians.
All Politicians Male Politicians Female Politicians (1) (2) (3) (4) (5) (6)
Notes: The table shows estimated impacts of the Social Democrats' zipper quota on the competence of the party's elected politicians. The first two columns show results for the competence of men and women combined, and the remaining show separate estimates for men and women. The dependent variable (see also equation 5) is the proportion of competent politicians among the municipal councillors. Politicians are defined as competent if they have an income residual above the median residual of all elected politicians in their political party, and as mediocre otherwise. The estimation method for generating these residuals is explained in Section 4.2. The "quota bite" (Δw94-91), defined for each local Social Democratic party, measures the change in the proportion of women councilors in 1994 (the first election after the quota) compared to 1991 (the last election before the quota). The quota-bite variable is interacted with a dummy for the post-quota period, taking the value 1 for all elections after 1991, and zero otherwise. Estimated coefficients on this interacted variable are shown in the table. All specifications include municipality fixed effects, making the non-interacted quota bite variable redundant. They also include election-period fixed effects, and odd numbered columns control for municipality-specific time trends defined by interactions between municipality fixed effects and a linear time variable. The sample excludes 20 local Social-Democratic parties that did not comply fully with the quota (having below 40% elected women in 1994). It also excludes local parties with a female leader in 1991. Robust standard errors clustered at the municipality level are in parentheses: * significant at 10%; ** significant at 5%; *** significant at 1%. All regressions are estimated using OLS.
7
Figure 4. Effect of the gender quota on the fractions of competent men and women.
Notes: The figure shows how the Social Democrats' zipper gender quota impacted on the fraction of competent politicians (left) and the fractions of competent male and female politicians (right). The unit of observation is a local Social Democratic party in an election period. Regression equation (6) includes fixed effects for each election and municipality. It also includes interactions between the election dummies and the quota bite in that local party (Δw94-
91) defined as the change in the proportion of women elected municipal councilors for the Social Democrats in 1994 (the first election of the quota) compared to 1991 (the last election before the quota). The interaction for year 1991 is left out to make the immediate pre-quota election the reference category – i.e., we normalize β₉₁ to 0 and mark this reference year with a vertical line. Each dot in the graph shows the estimated interaction effect between the quota bite and the election in question, and the bars indicate 95% confidence intervals. A coefficient of 0.5 implies that a quota bite of 10 percentage points more elected women leads to a 5 percentage-point increase in the proportion of competent politicians in that local party, relative to 1991. The sample excludes 20 local parties that did not comply fully with the quota (having fewer than 40% elected women in 1994). It also excludes local parties with a female leader in 1991. Robust standard errors clustered at the municipality level are in parentheses: * significant at 10%; ** significant at 5%; *** significant at 1%. All regressions are estimated using OLS.
8
Table 5. Effect of the gender quota on the fractions of competent leaders (top-three politicians) and followers (other elected politicians).
A: All Politicians Followers Followers Leaders Leaders
Notes: The figure shows estimates for the impact of the Social Democrats' zipper gender quota on the fraction of competent politician among followers (columns 1 and 2) and leaders (columns 3 and 4). The outcome variable is the fraction of competent politicians in each of these categories, where leaders are represented by the top-three politicians on the Social Democratic party's local ballot, and followers are the remaining elected councilors for the party. The top panel considers the fraction of competent men and women together, and the bottom panel considers only men. The sample excludes 20 local parties that did not comply fully with the quota (having fewer than 40% elected women in 1994). It also excludes local parties with a female leader in 1991. Robust standard errors clustered at the municipality level are in parentheses: * significant at 10%; ** significant at 5%; *** significant at 1%. All regressions are estimated using OLS.
Figure 5. Effect of the gender quota on the fractions of competent leaders and followers.
Notes: The figure shows the estimated changes in the fraction of competent followers or leaders relative to the reference year (1991) depending on the change in the share of elected women in the period 1991-1994. The left-hand graph shows estimates for men and women combined, and the right-hand graph show estimates for men only. Details of the estimation methods, sample period, and sample restrictions are found in the notes to Figure 4.
9
Figure 6. Effect of the gender quota on survival rates of competent and mediocre male leaders.
Notes: The figure shows the estimated changes in the survival probability of mediocre and competent male leaders relative to the reference year (1991), depending on the change in the share of elected women when the quota was introduced (1994-1991). The outcome variable captures the survival of the individual politician using a binary indicator that takes a value of 1 if he re-appears on the ballot in an election, and 0 otherwise. The unit of observation is an individual male politician in each election, and the sample includes politicians ranked in one of the top-three slots on the ballot in the previous election. The sample period is 1985-2014. The left-hand graph shows the results for estimating equation (6) – see the description in the notes to Figure 4 – separately for mediocre and competent men. The outcome variable is replaced with the survival indicator. The interaction for the year 1991 is omitted to make the immediate pre-quota election the reference category – i.e., we normalize β₉₁ to 0 and mark this reference year with a vertical line. The right-hand graph shows the estimated difference in the treatment effect of the quota between mediocre and competent male leaders. A fully saturated triple-difference model, see equation (7), is used to estimate these differences, and the vertical bars show 95% confidence intervals for this difference. The sample excludes 20 local parties that did not comply fully with the quota (having fewer than 40% elected women in 1994). It also excludes local parties with a female leader in 1991. Robust standard errors clustered at the municipality level are estimated and all regressions are estimated using OLS.