30
Gene Expression Data Analysis Lab Session CAD course Jian Li 01.28. 2011
| Date post: | 02-Jan-2016 |
| Category: |
Documents |
| Upload: | buck-hicks |
| View: | 222 times |
| Download: | 0 times |
Gene Expression Data Analysis Lab Session
CAD course
Jian Li
01.28. 2011
Gene expression signatures
• Will be loosely defined here to mean a set of genes that are functionally associated with each other in some way.
• When using expression profiling to define genes, a gene expression signature consists of two things:– A set of genes going “up” (relative to
something).– A set of genes going “down” (relative to
something).
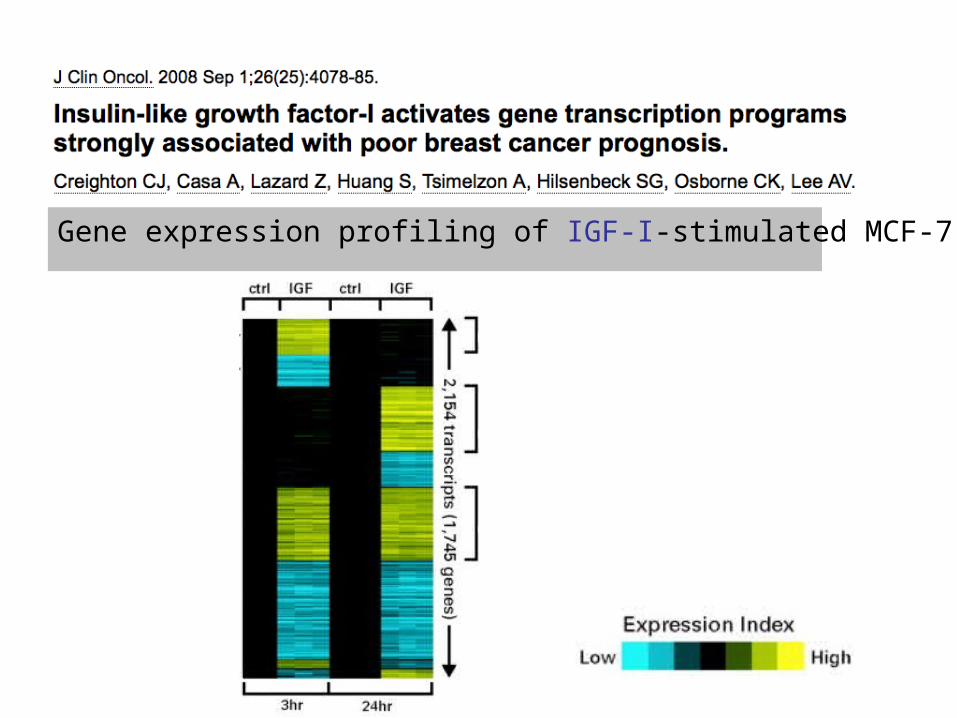
Gene expression profiling of IGF-I-stimulated MCF-7 cells
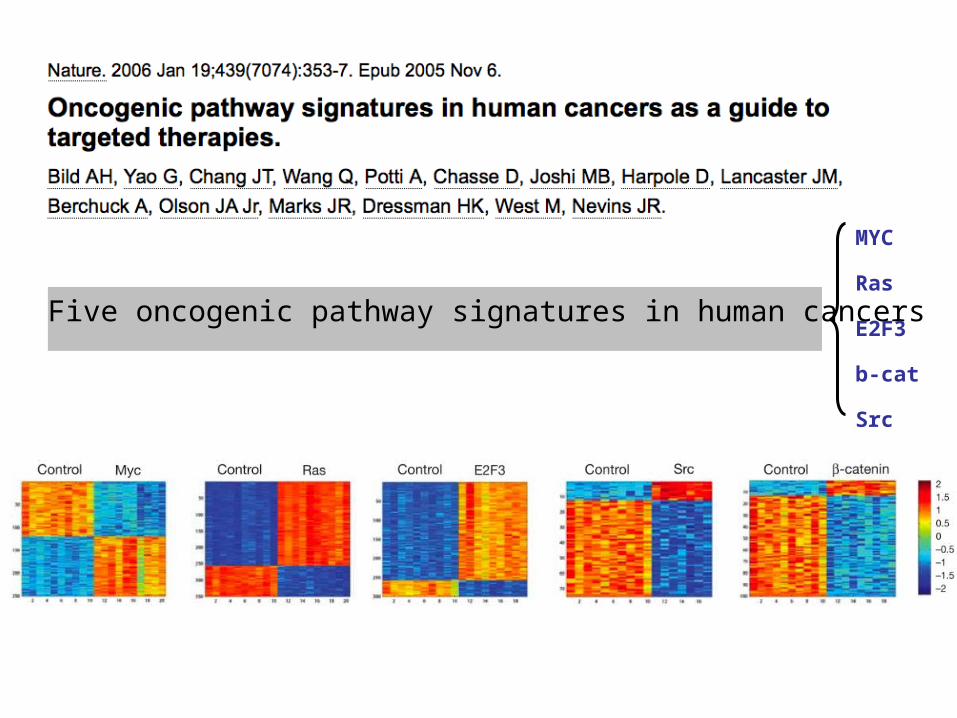
Five oncogenic pathway signatures in human cancers
MYC
Ras
E2F3
b-cat
Src
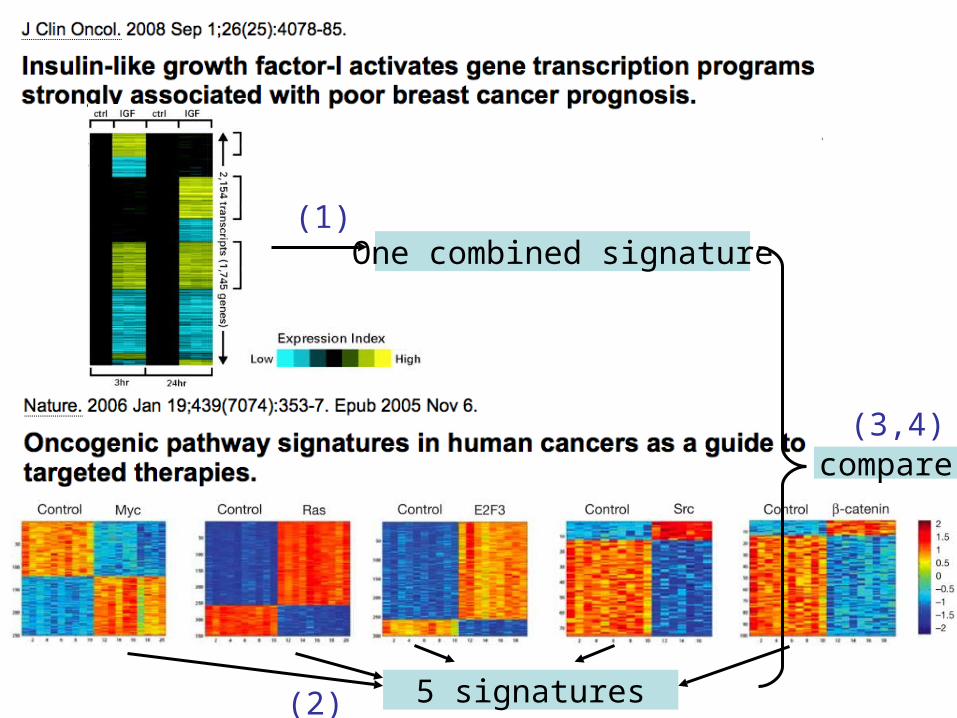
5 signatures
One combined signature(1)
(2)
(3,4)compare

• Course webpage
Excel functions/features you will need for the computational exercise
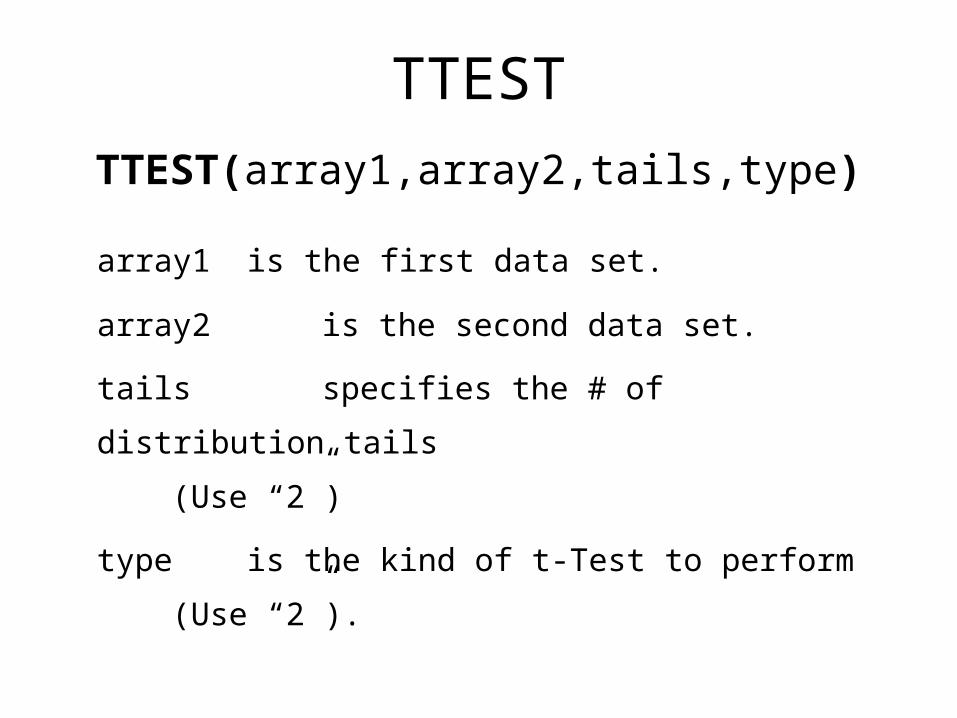
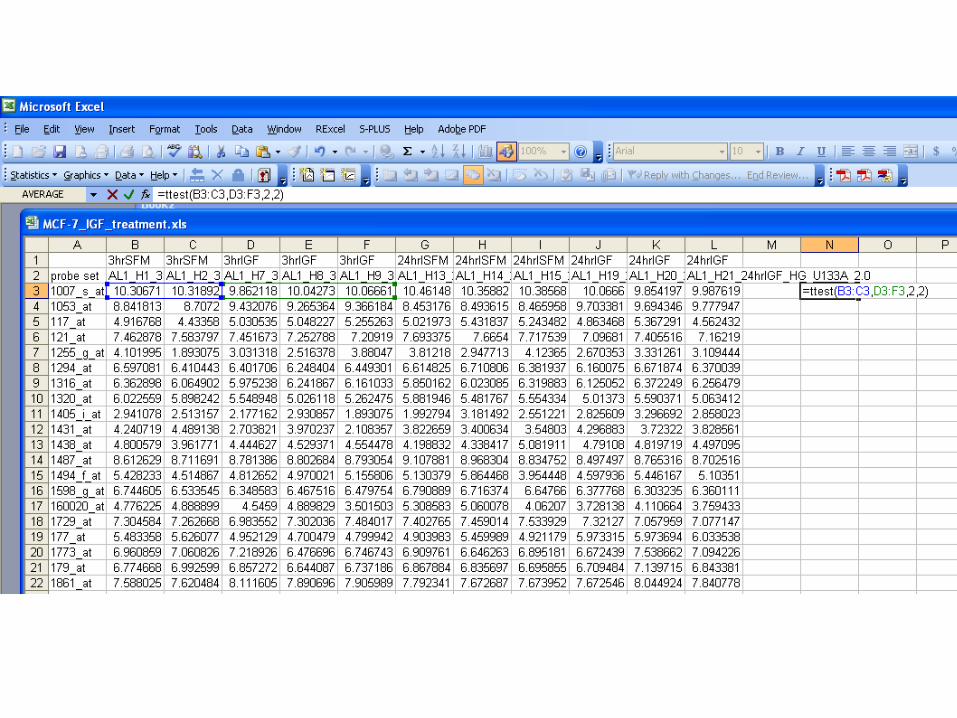
TTEST
array1 is the first data set.
array2 is the second data set.
tails specifies the # of distribution tails
(Use “2”)
type is the kind of t-Test to perform
(Use “2”).
TTEST(array1,array2,tails,type)
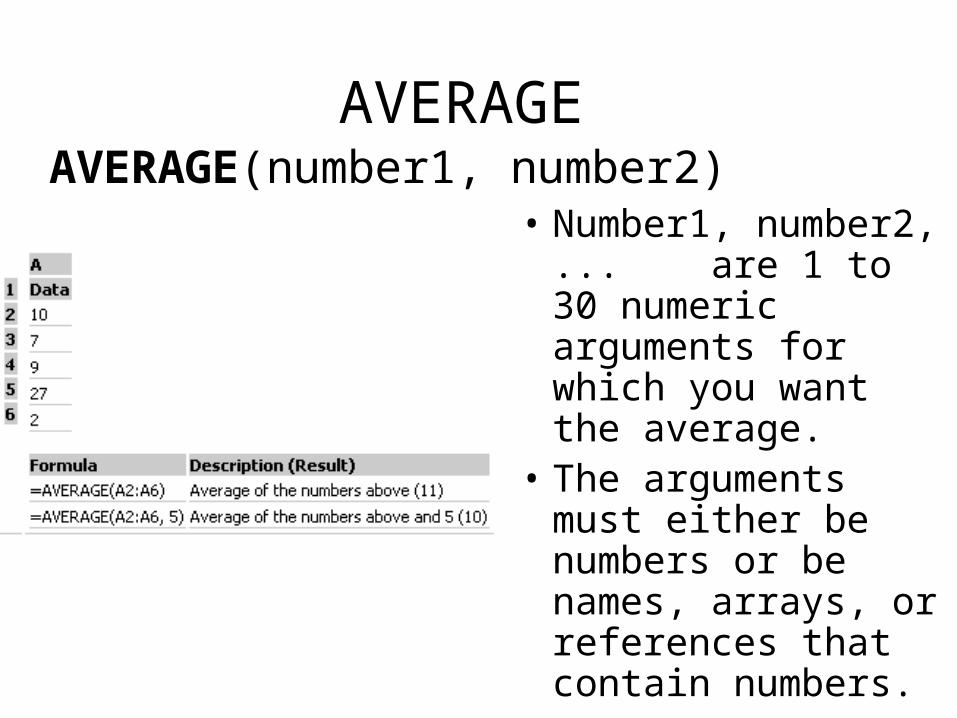
AVERAGE
• Number1, number2, ... are 1 to 30 numeric arguments for which you want the average.
• The arguments must either be numbers or be names, arrays, or references that contain numbers.
AVERAGE(number1, number2)
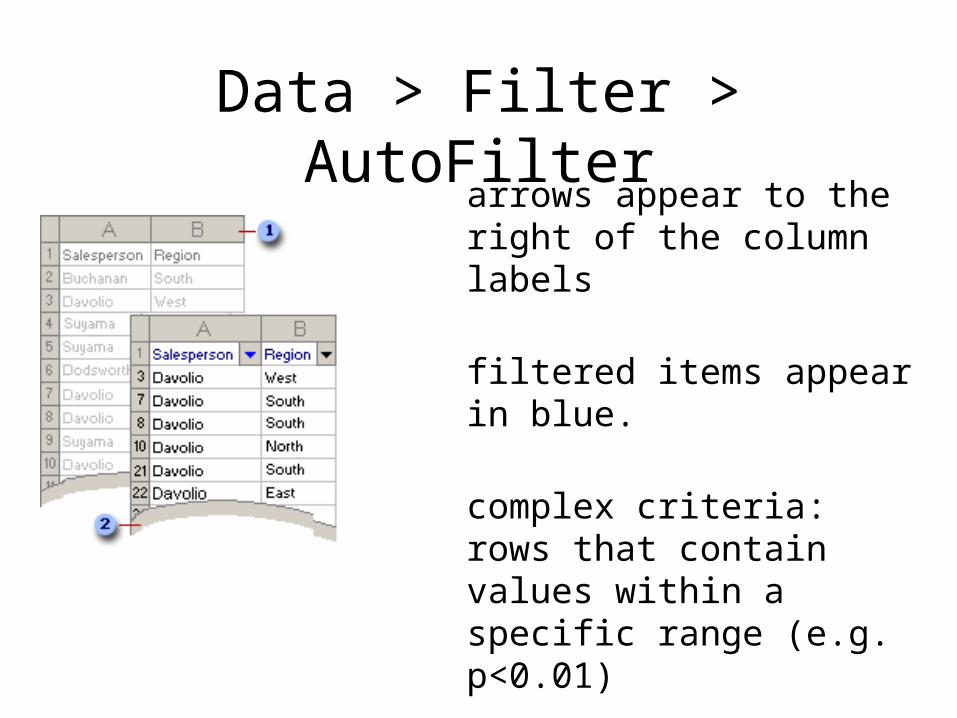
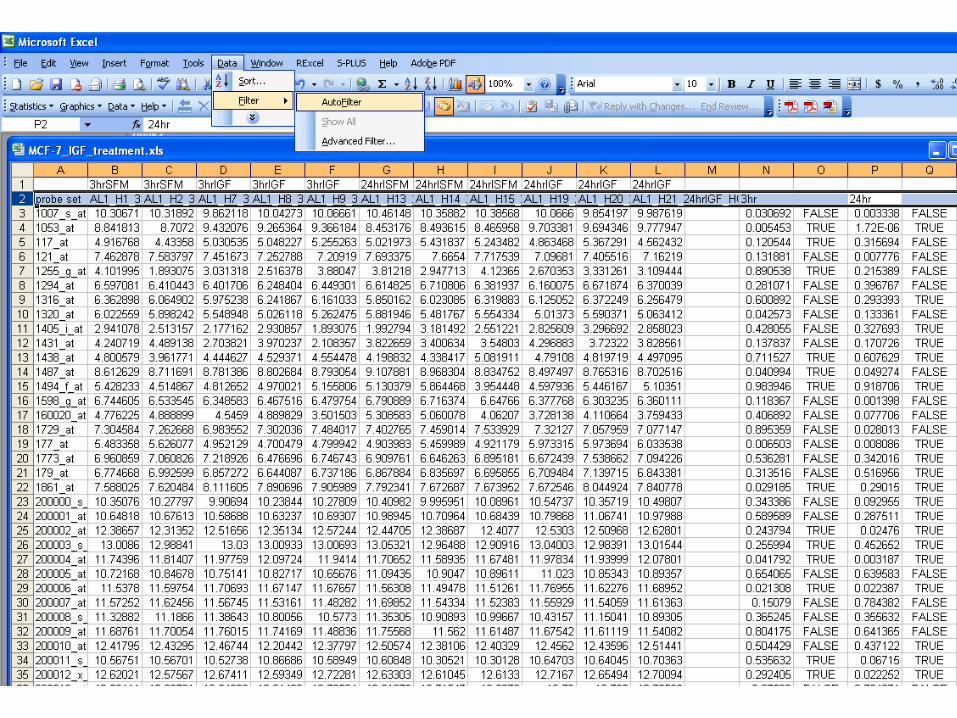
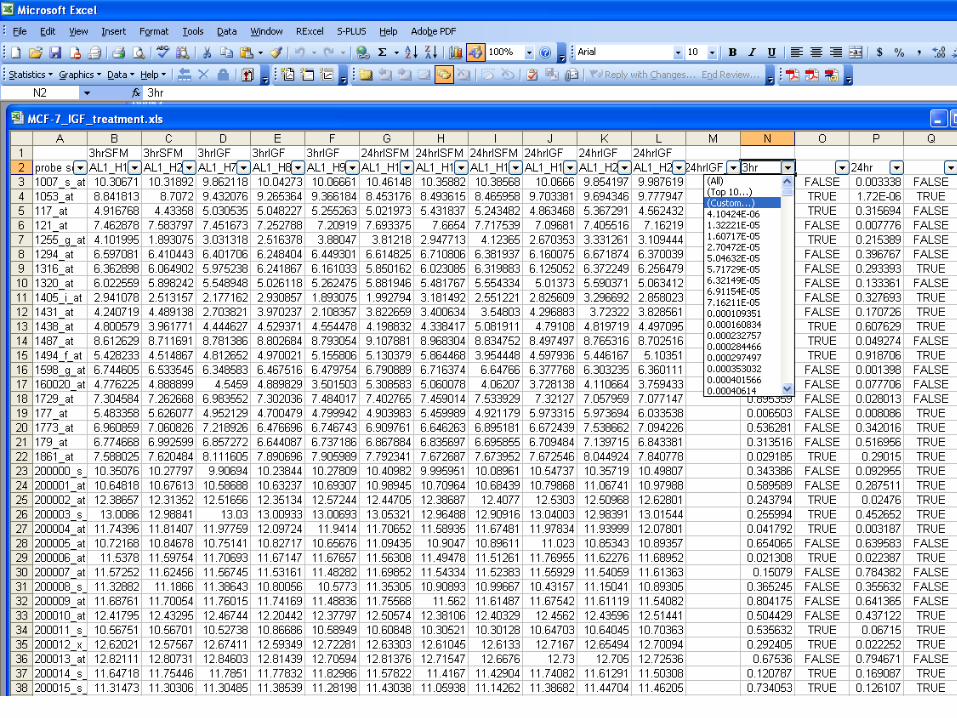
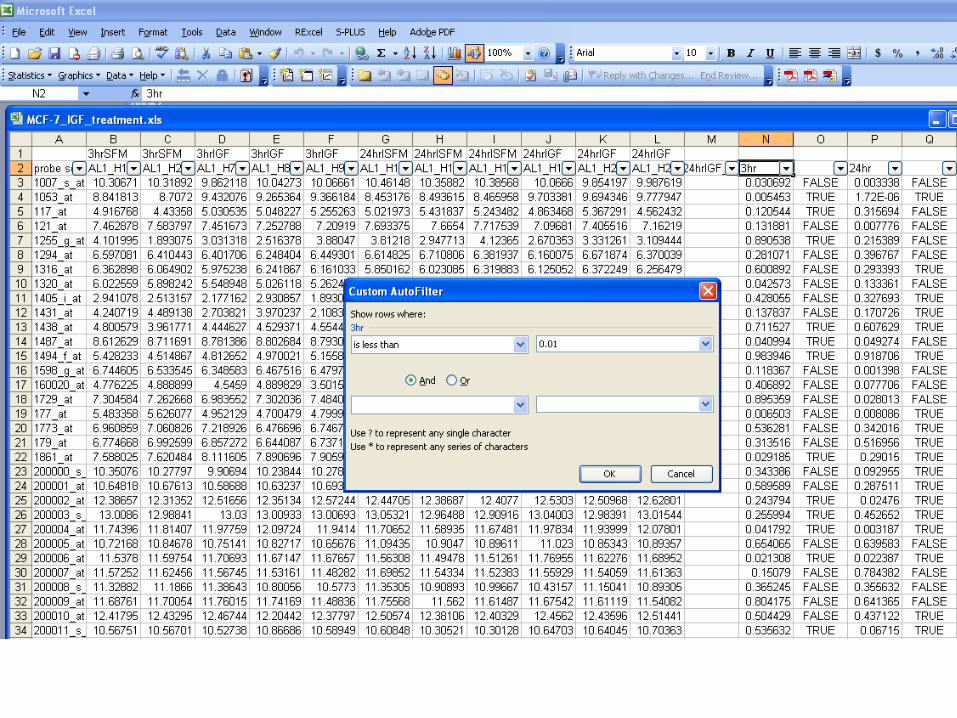
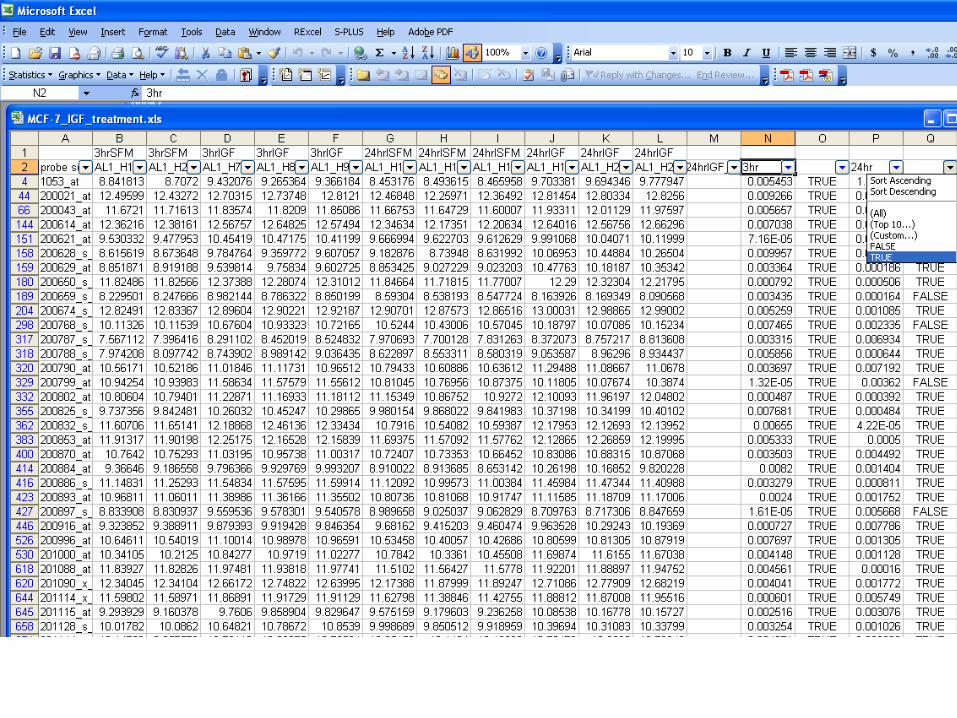
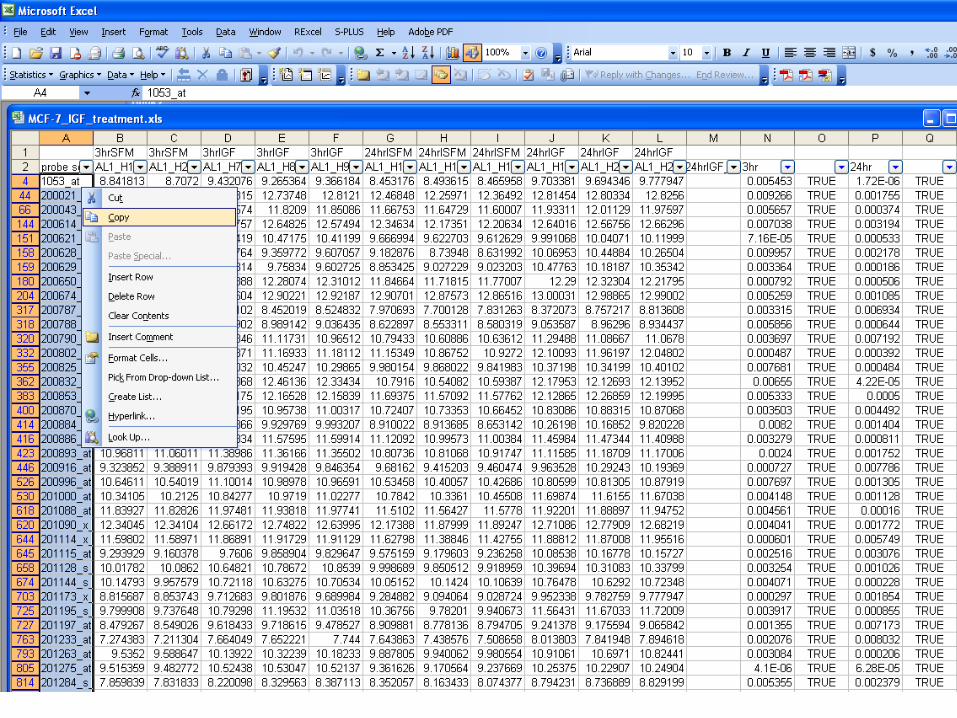
Data > Filter > AutoFilter arrows appear to the right
of the column labels
filtered items appear in blue.
complex criteria:rows that contain values within a specific range (e.g. p<0.01)
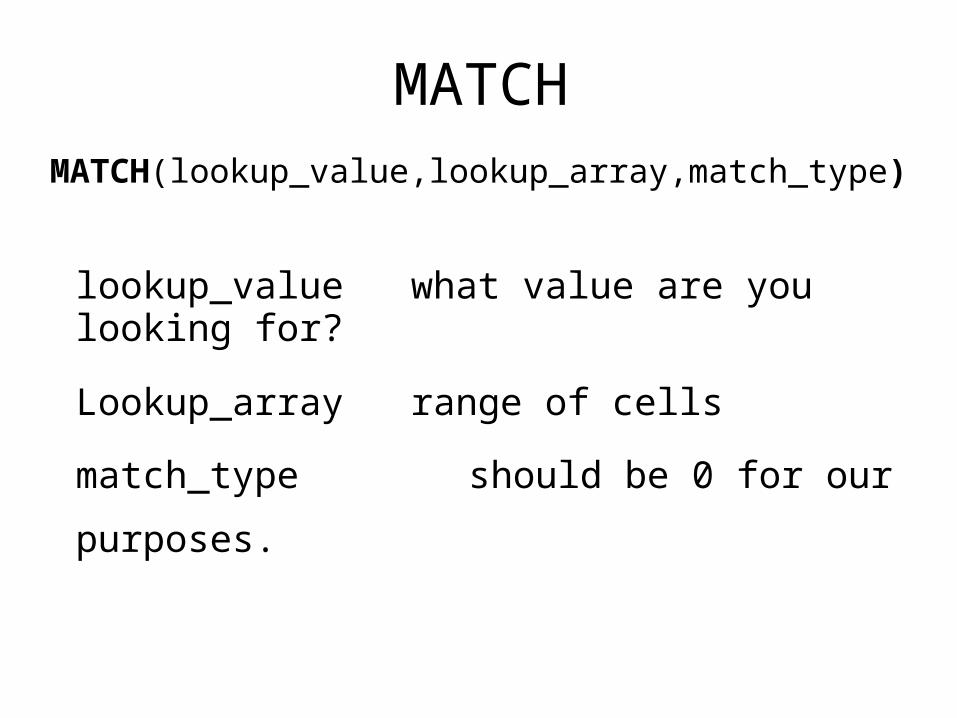
MATCH
lookup_value what value are you looking for?
Lookup_array range of cells
match_type should be 0 for our purposes.
MATCH(lookup_value,lookup_array,match_type)
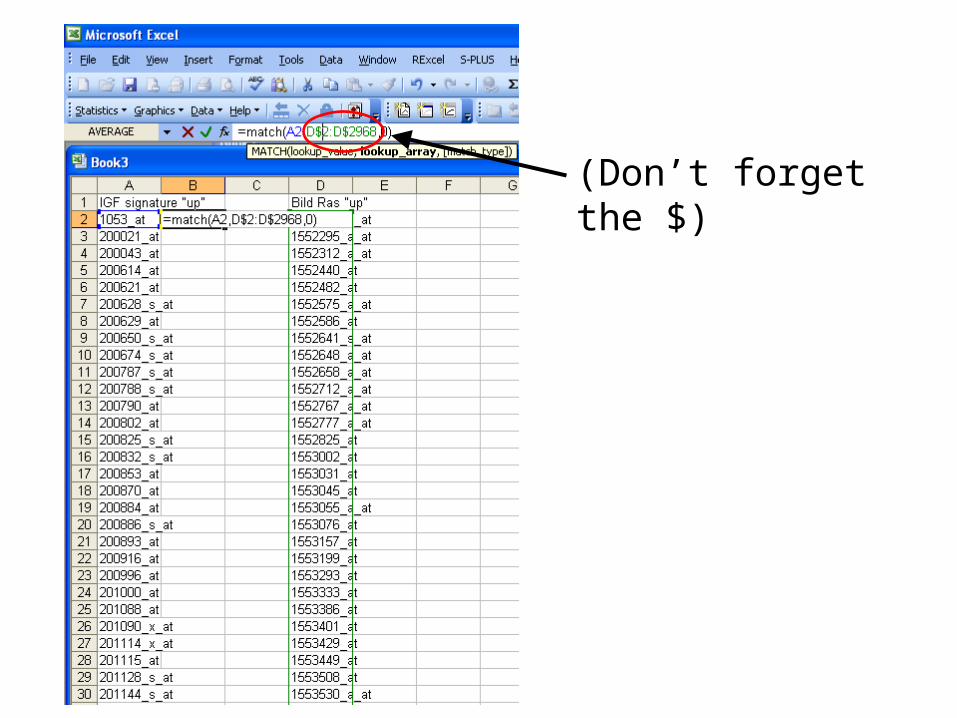
(Don’t forget the $)
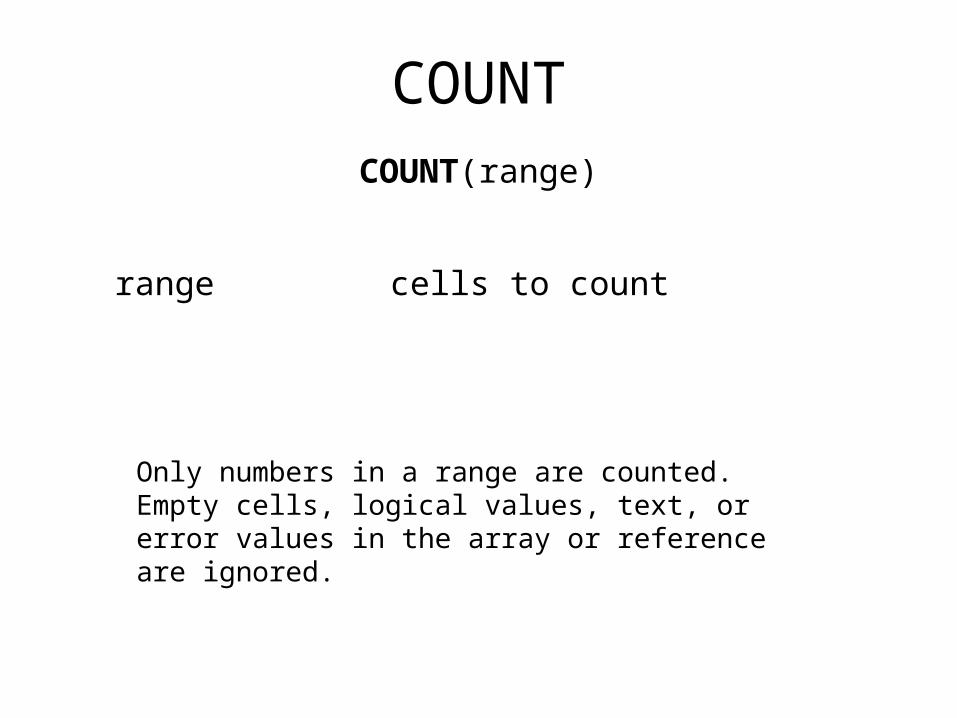
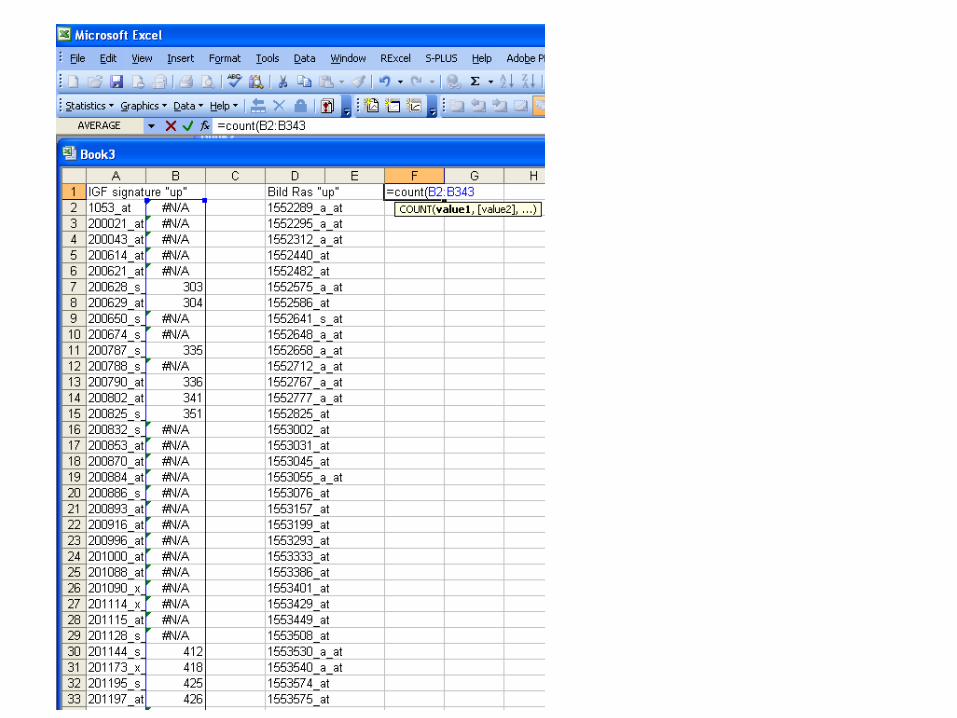
COUNT
Only numbers in a range are counted. Empty cells, logical values, text, or error values in the array or reference are ignored.
COUNT(range)
range cells to count
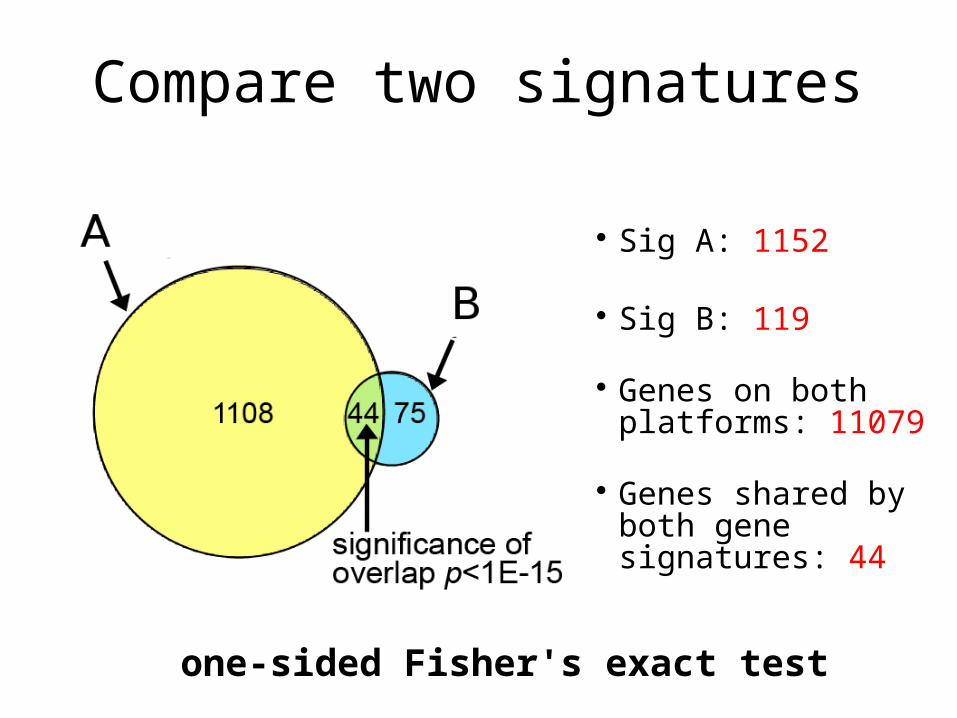
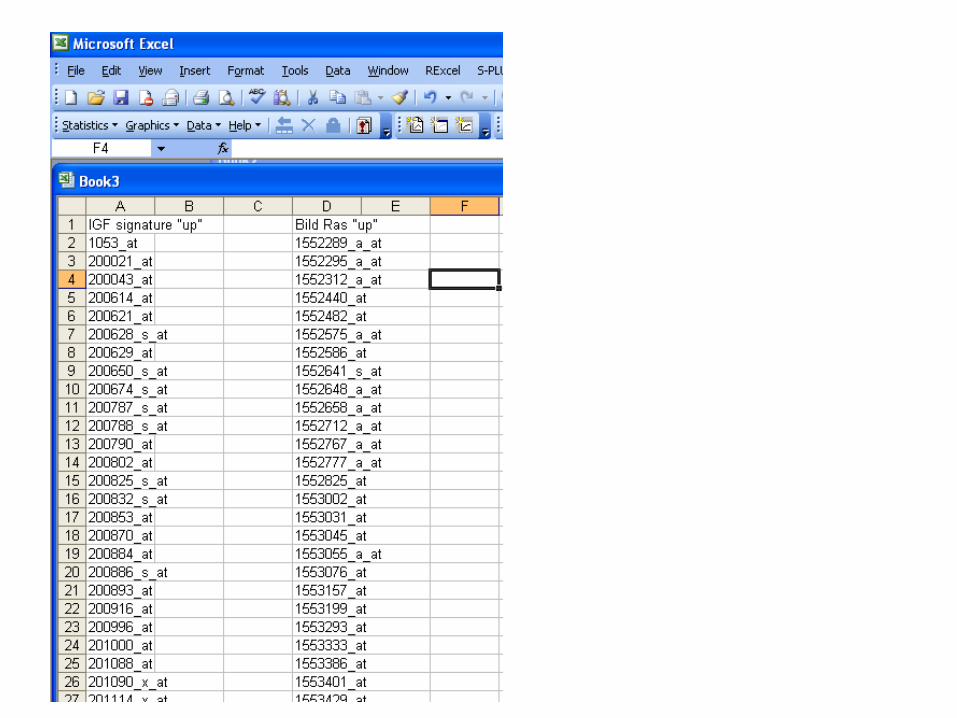
Compare two signatures
Sig A: 1152
Sig B: 119
Genes on both platforms: 11079
Genes shared by both gene signatures: 44
one-sided Fisher's exact test
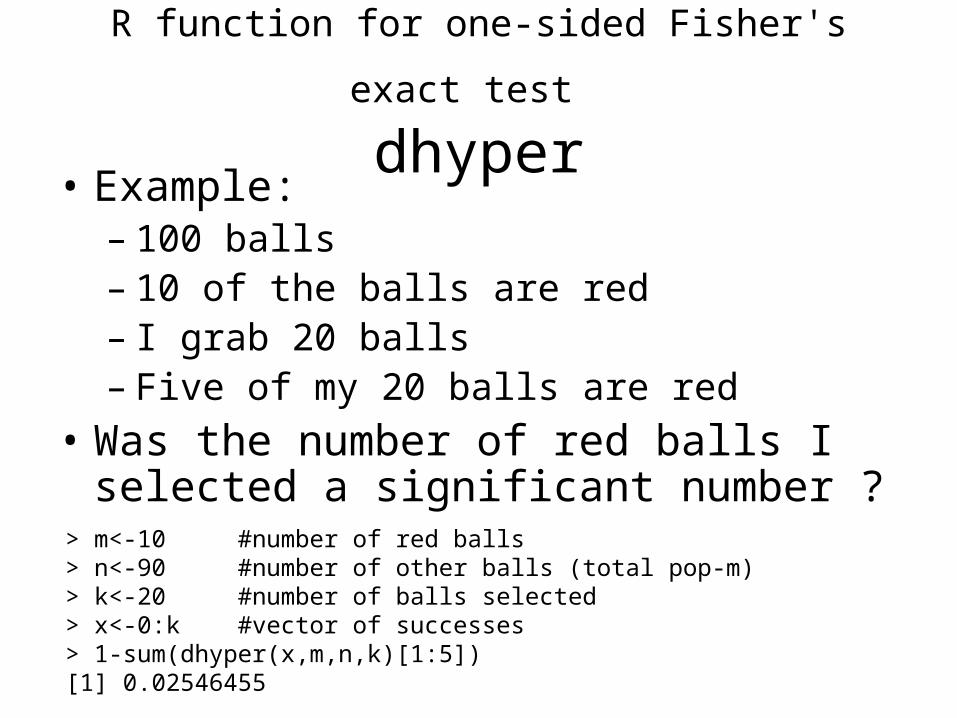
R function for one-sided Fisher's exact test dhyper
• Example:– 100 balls– 10 of the balls are red– I grab 20 balls– Five of my 20 balls are red
• Was the number of red balls I selected a significant number ?
> m<-10 #number of red balls> n<-90 #number of other balls (total pop-m)> k<-20 #number of balls selected> x<-0:k #vector of successes> 1-sum(dhyper(x,m,n,k)[1:5])[1] 0.02546455
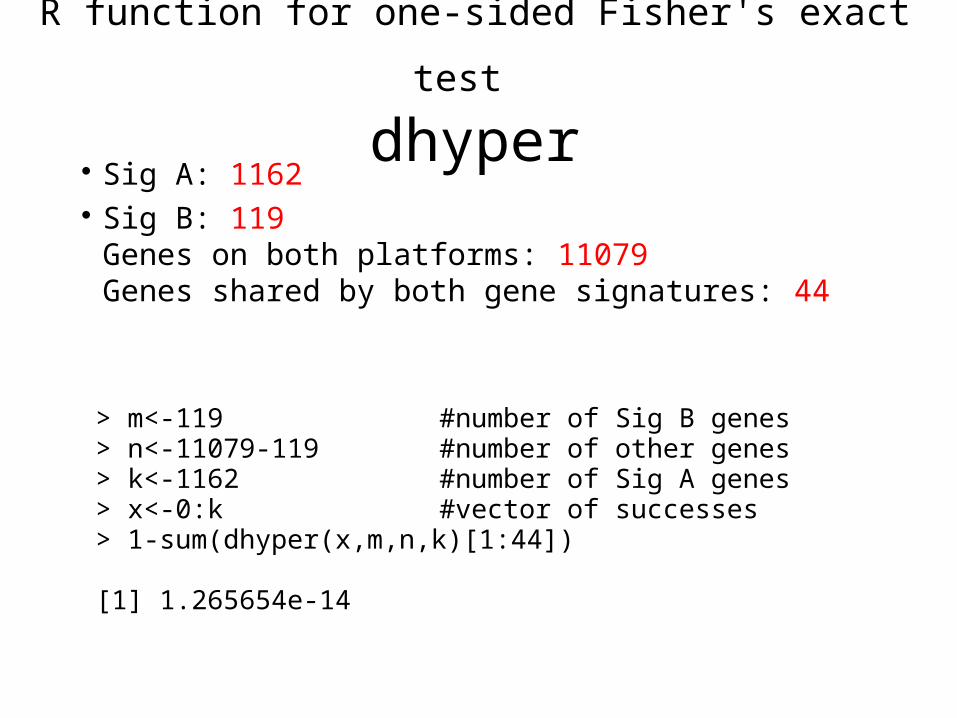
R function for one-sided Fisher's exact test dhyper
Sig A: 1162 Sig B: 119
Genes on both platforms: 11079Genes shared by both gene signatures: 44
> m<-119 #number of Sig B genes> n<-11079-119 #number of other genes> k<-1162 #number of Sig A genes> x<-0:k #vector of successes> 1-sum(dhyper(x,m,n,k)[1:44])
[1] 1.265654e-14
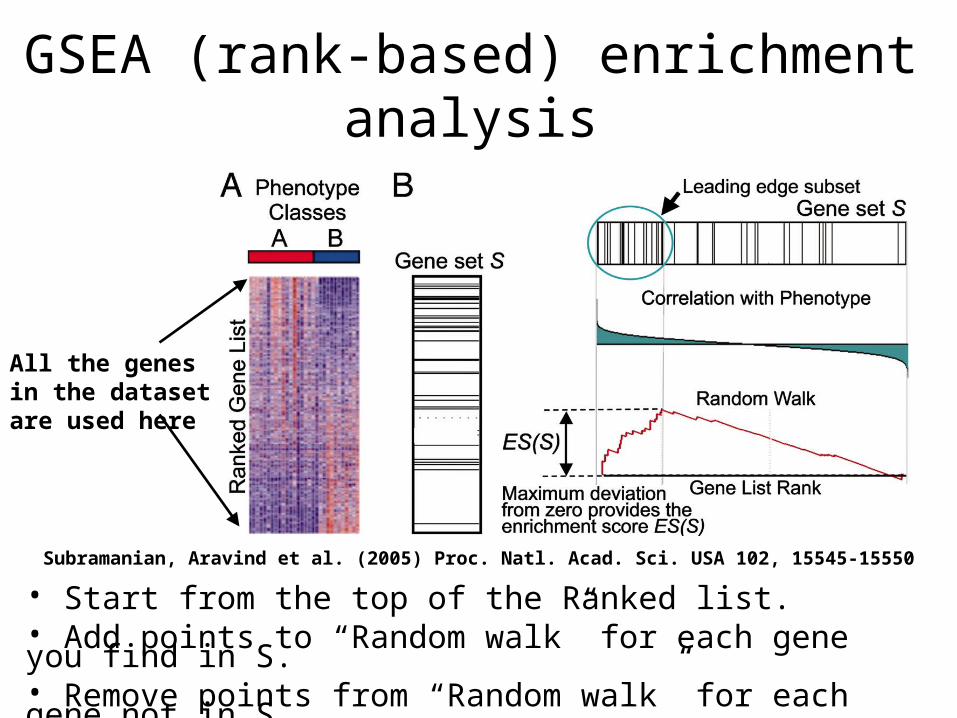
Subramanian, Aravind et al. (2005) Proc. Natl. Acad. Sci. USA 102, 15545-15550
GSEA (rank-based) enrichment analysis
All the genes in the dataset are used here
• Start from the top of the Ranked list.• Add points to “Random walk” for each gene you find in S.• Remove points from “Random walk” for each gene not in S.
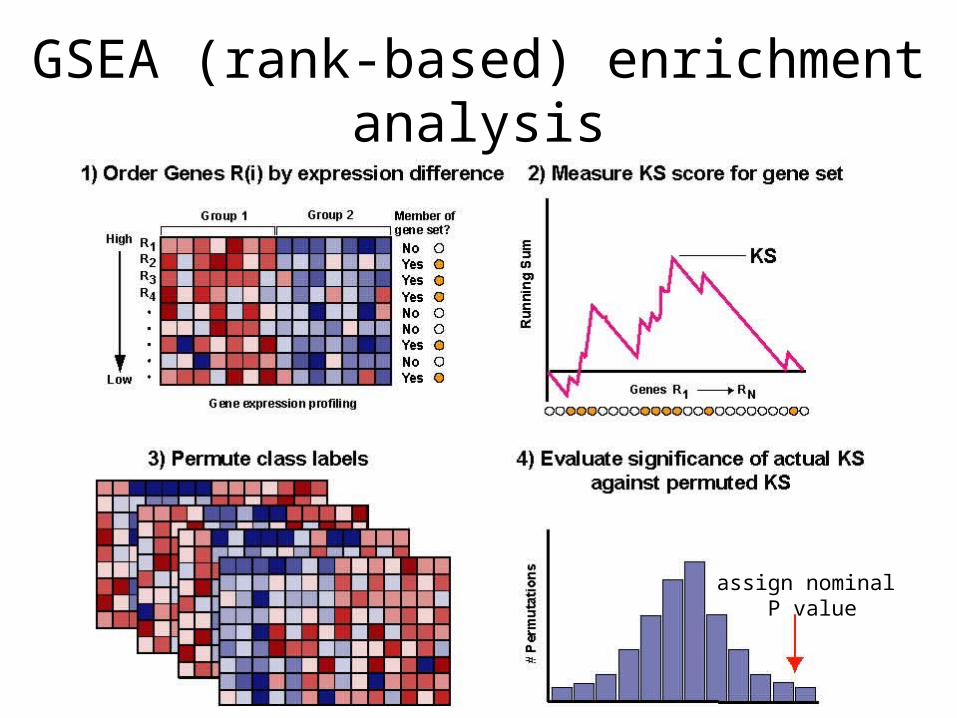
GSEA (rank-based) enrichment analysis
assign nominal P value
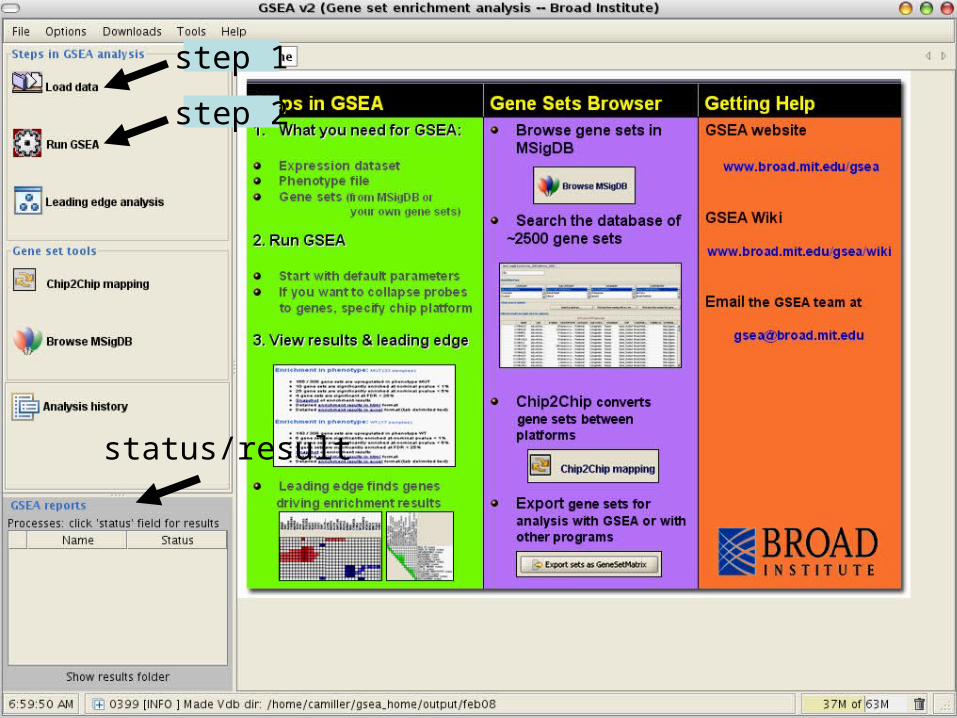
step 1
step 2
status/result
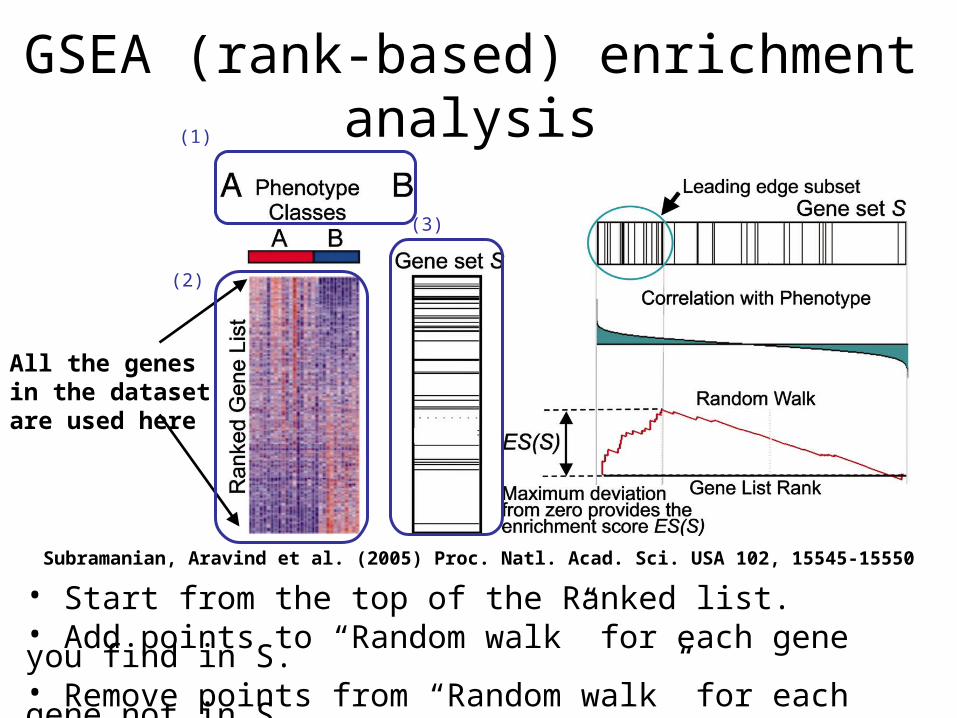
Subramanian, Aravind et al. (2005) Proc. Natl. Acad. Sci. USA 102, 15545-15550
GSEA (rank-based) enrichment analysis
All the genes in the dataset are used here
• Start from the top of the Ranked list.• Add points to “Random walk” for each gene you find in S.• Remove points from “Random walk” for each gene not in S.
(1)
(2)
(3)
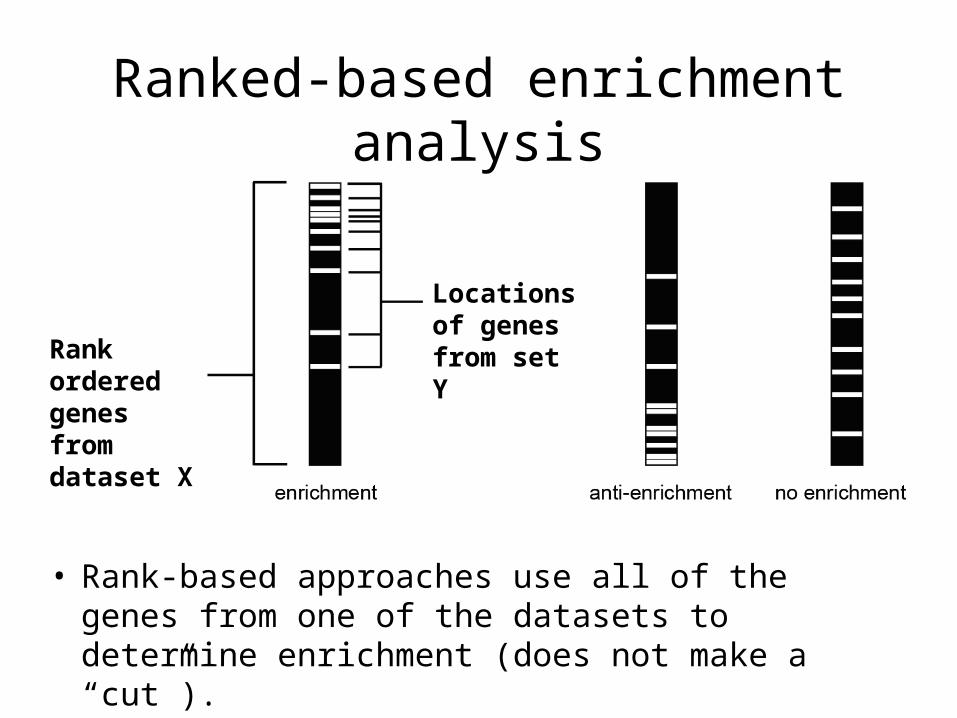
Ranked-based enrichment analysis
• Rank-based approaches use all of the genes from one of the datasets to determine enrichment (does not make a “cut”).
Rank ordered genes from dataset X
Locations of genes from set Y


