Proc. Natl. Acad. Sci. USA Vol. 93, pp. 3434-3438, April 1996 Physiology Obese gene expression: Reduction by fasting and stimulation by insulin and glucose in lean mice, and persistent elevation in acquired (diet-induced) and genetic (yellow agouti) obesity (leptin/mRNA/hyperinsulinemia/hyperglycemia/diabetes) TOORU M. MlZUNO*t, HUGO BERGENt, TOSHIYA FUNABASHI§, STEVEN P. KLEOPOULOS*t, YOU-GONG ZHONG1l, WILLIAM A. BAUMANT11, AND CHARLES V. MOBBS*t** *Fishberg Center for Neurobiology and Department of Geriatrics, and 'Department of Medicine, Mt. Sinai School of Medicine, New York, NY 10029; tDepartment of Anatomy, University of Manitoba, Winnipeg, MB, Canada R3E OW3; §Department of Physiology, Yokohama City University School of Medicine, Yokohama, 236, Japan; and tPathology and Diagnostic Laboratory and ItMedical Service, Veterans Affairs Medical Center, Bronx, NY 10468 Communicated by Rosalyn S. Yalow, Veterans Affairs Medical Center, Bronx, NY, December 21, 1995 ABSTRACT Mutations in the obese (ob) gene lead to obesity. This gene has been recently cloned, but the factors regulating its expression have not been elucidated. To address the regulation of the ob gene with regard to body weight and nutritional factors, Northern blot analysis was used to assess ob mRNA in adipose tissue from mice [lean, obese due to diet, or genetically (yellow agouti) obese] under different nutri- tional conditions. ob mRNA was elevated in both forms of obesity, compared to lean controls, correlated with elevations in plasma insulin and body weight, but not plasma glucose. In lean C57BL/6J mice, but not in mice with diet-induced obesity, ob mRNA decreased after a 48-hr fast. Similarly, in lean C57BL/6J controls, but not in obese yellow mice, i.p. glucose injection significantly increased ob mRNA. For up to 30 min after glucose injection, ob mRNA in lean mice signif- icantly correlated with plasma glucose, but not with plasma insulin. In a separate study with only lean mice, ob mRNA was inhibited >90% by fasting, and elevated -2-fold 30 min after i.p. injection of either glucose or insulin. These results suggest that in lean animals glucose and insulin enhance ob gene expression. In contrast to our results in lean mice, in obese animals ob mRNA is elevated and relatively insensitive to nutritional state, possibly due to chronic exposure to elevated plasma insulin and/or glucose. Obesity is a major disorder associated with excessive mortality (1). However, mechanisms leading to different forms of obe- sity are not well understood. Mutations in the obese (ob) gene result in obesity and hyperinsulinemia (2). Parabiosis studies have suggested that the ob gene codes for a satiety factor (3). The ob gene, recently isolated by positional cloning, codes for a product produced in and secreted by adipose tissue (4). Injection of the ob gene product leptin reduced food intake, body weight, plasma glucose, and plasma insulin (5-7). In a recent report, Maffei et al. (8) stated that "identification of the molecules that regulate expression of the ob gene in adipo- cytes ... will greatly enhance our understanding of the phys- iological mechanisms that regulate body weight". On the basis of the above observations, we hypothesized that glucose and/or insulin would stimulate expression of the ob gene. Studies demonstrating that leptin injections reduce body weight in obese mice (5-7) have suggested that some forms of obesity, like the ob/ob mouse, may be due to insufficient leptin production, and thus, like other hormone-deficient states, may be treatable by replacement therapy. On the other hand, if obesity is generally characterized by overexpression of the ob gene, as in db/db mice (8), insensitivity to leptin, rather than The publication costs of this article were defrayed in part by page charge payment. This article must therefore be hereby marked "advertisement" in accordance with 18 U.S.C. §1734 solely to indicate this fact. insufficient leptin production, may be a more common im- pairment, and efficacy of leptin may be limited. The yellow allele (AY) of the agouti gene is, like mutant alleles of the ob gene, associated with obesity, hyperinsulinemia, and hyperpha- gia (9). The agouti gene has also been characterized, and its product appears to inhibit the action of melanocyte- stimulating hormone on its receptor (10). We have therefore examined expression of ob mRNA in a model of environmen- tally acquired obesity, due to a high-calorie diet, and in a model of genetic obesity, the yellow agouti mouse. We have further- more examined the relationship between ob gene expression and plasma glucose and insulin, in lean and obese mice. MATERIALS AND METHODS Animals. Male C57BL/6J mice, heterozygous lethal yellow obese mice (C57BL/6J-AY), and CBA mice were purchased at 2 mo of age from The Jackson Laboratory. Mice were housed with free access to feed and water under 12/12 hr light-dark cycle (lights on at 07:00 hr). All studies had been approved by the appropriate Institutional Animal Review Board. To study effects of diet-induced obesity on ob mRNA, normal C57BL/6J mice were placed for 14 weeks on a high-fat, high-carbohydrate diet (diet no. F2685, BioServe, Frenchtown, NJ); normal caloric intake was produced by access to mouse chow. After 14 weeks on their respective diets, half of each diet group was sacrificed just before lights out after a 48-hr fast (acutely nutritionally deprived). To produce an equivalent state of acute nutritional stimulation in mice of each diet, food was removed 7 hr before lights out (during which mice normally eat almost nothing even when food is available), then mice were sacrificed 30 min after an i.p. injection of glucose (2 mg/g of body wt) just before lights out. To study effects of genetic obesity and glucose injection on ob mRNA, wild-type lean a/a or obese yellow AY/a mice (both on the C57BL/6J background) were fasted for 7 hr, then sacrificed (just before lights out) 0, 15, or 30 min after i.p. glucose injection (2 mg/g body wt; n = 5 per group). To further define nutritional factors regulating the ob gene, lean CBA mice were sacrificed just before lights out after division into four groups (n = 4-12 per group): 7-hr daytime fast, sacrificed 30 min after i.p. injection of saline; 7-hr fast, sacrificed 30 min after i.p. injection of glucose (2 mg/g of body wt.); 7-hr fast, sacrificed 30 min after i.p. injection of insulin (33 milliunits/g of body wt.); or 72 hr after food was removed and 30 min after i.p. injection of saline. The nutritional manipulations (prolonged fasting, high calorie- diet, or injection of glucose or insulin) produced no apparent ill effects: there was no mortality, and apart from weight change, the animals appeared healthy. Mice were sacrificed by **To whom reprint requests should be addressed. 3434
Transcript
Proc. Natl. Acad. Sci. USAVol. 93, pp. 3434-3438, April 1996Physiology
Obese gene expression: Reduction by fasting and stimulation byinsulin and glucose in lean mice, and persistent elevation inacquired (diet-induced) and genetic (yellow agouti) obesity
TOORU M. MlZUNO*t, HUGO BERGENt, TOSHIYA FUNABASHI§, STEVEN P. KLEOPOULOS*t, YOU-GONG ZHONG1l,WILLIAM A. BAUMANT11, AND CHARLES V. MOBBS*t***Fishberg Center for Neurobiology and Department of Geriatrics, and 'Department of Medicine, Mt. Sinai School of Medicine, New York, NY 10029;tDepartment of Anatomy, University of Manitoba, Winnipeg, MB, Canada R3E OW3; §Department of Physiology, Yokohama City University School of Medicine,Yokohama, 236, Japan; and tPathology and Diagnostic Laboratory and ItMedical Service, Veterans Affairs Medical Center, Bronx, NY 10468
Communicated by Rosalyn S. Yalow, Veterans Affairs Medical Center, Bronx, NY, December 21, 1995
ABSTRACT Mutations in the obese (ob) gene lead toobesity. This gene has been recently cloned, but the factorsregulating its expression have not been elucidated. To addressthe regulation of the ob gene with regard to body weight andnutritional factors, Northern blot analysis was used to assessob mRNA in adipose tissue from mice [lean, obese due to diet,or genetically (yellow agouti) obese] under different nutri-tional conditions. ob mRNA was elevated in both forms ofobesity, compared to lean controls, correlated with elevationsin plasma insulin and body weight, but not plasma glucose. Inlean C57BL/6J mice, but not in mice with diet-inducedobesity, ob mRNA decreased after a 48-hr fast. Similarly, inlean C57BL/6J controls, but not in obese yellow mice, i.p.glucose injection significantly increased ob mRNA. For up to30 min after glucose injection, ob mRNA in lean mice signif-icantly correlated with plasma glucose, but not with plasmainsulin. In a separate study with only lean mice, ob mRNA wasinhibited >90% by fasting, and elevated -2-fold 30 min afteri.p. injection of either glucose or insulin. These results suggestthat in lean animals glucose and insulin enhance ob geneexpression. In contrast to our results in lean mice, in obeseanimals ob mRNA is elevated and relatively insensitive tonutritional state, possibly due to chronic exposure to elevatedplasma insulin and/or glucose.
Obesity is a major disorder associated with excessive mortality(1). However, mechanisms leading to different forms of obe-sity are not well understood. Mutations in the obese (ob) generesult in obesity and hyperinsulinemia (2). Parabiosis studieshave suggested that the ob gene codes for a satiety factor (3).The ob gene, recently isolated by positional cloning, codes fora product produced in and secreted by adipose tissue (4).Injection of the ob gene product leptin reduced food intake,body weight, plasma glucose, and plasma insulin (5-7). In arecent report, Maffei et al. (8) stated that "identification of themolecules that regulate expression of the ob gene in adipo-cytes ... will greatly enhance our understanding of the phys-iological mechanisms that regulate body weight". On the basisof the above observations, we hypothesized that glucoseand/or insulin would stimulate expression of the ob gene.
Studies demonstrating that leptin injections reduce bodyweight in obese mice (5-7) have suggested that some forms ofobesity, like the ob/ob mouse, may be due to insufficient leptinproduction, and thus, like other hormone-deficient states, maybe treatable by replacement therapy. On the other hand, ifobesity is generally characterized by overexpression of the obgene, as in db/db mice (8), insensitivity to leptin, rather than
The publication costs of this article were defrayed in part by page chargepayment. This article must therefore be hereby marked "advertisement" inaccordance with 18 U.S.C. §1734 solely to indicate this fact.
insufficient leptin production, may be a more common im-pairment, and efficacy of leptin may be limited. The yellowallele (AY) of the agouti gene is, like mutant alleles of the obgene, associated with obesity, hyperinsulinemia, and hyperpha-gia (9). The agouti gene has also been characterized, and itsproduct appears to inhibit the action of melanocyte-stimulating hormone on its receptor (10). We have thereforeexamined expression of ob mRNA in a model of environmen-tally acquired obesity, due to a high-calorie diet, and in a modelof genetic obesity, the yellow agouti mouse. We have further-more examined the relationship between ob gene expressionand plasma glucose and insulin, in lean and obese mice.
MATERIALS AND METHODSAnimals. Male C57BL/6J mice, heterozygous lethal yellow
obese mice (C57BL/6J-AY), and CBA mice were purchased at2 mo of age from The Jackson Laboratory. Mice were housedwith free access to feed and water under 12/12 hr light-darkcycle (lights on at 07:00 hr). All studies had been approved bythe appropriate Institutional Animal Review Board. To studyeffects of diet-induced obesity on ob mRNA, normalC57BL/6J mice were placed for 14 weeks on a high-fat,high-carbohydrate diet (diet no. F2685, BioServe, Frenchtown,NJ); normal caloric intake was produced by access to mousechow. After 14 weeks on their respective diets, half of each dietgroup was sacrificed just before lights out after a 48-hr fast(acutely nutritionally deprived). To produce an equivalentstate of acute nutritional stimulation in mice of each diet, foodwas removed 7 hr before lights out (during which micenormally eat almost nothing even when food is available), thenmice were sacrificed 30 min after an i.p. injection of glucose (2mg/g of body wt) just before lights out. To study effects ofgenetic obesity and glucose injection on ob mRNA, wild-typelean a/a or obese yellow AY/a mice (both on the C57BL/6Jbackground) were fasted for 7 hr, then sacrificed (just beforelights out) 0, 15, or 30 min after i.p. glucose injection (2 mg/gbody wt; n = 5 per group). To further define nutritional factorsregulating the ob gene, lean CBA mice were sacrificed justbefore lights out after division into four groups (n = 4-12 pergroup): 7-hr daytime fast, sacrificed 30 min after i.p. injectionof saline; 7-hr fast, sacrificed 30 min after i.p. injection ofglucose (2 mg/g of body wt.); 7-hr fast, sacrificed 30 min afteri.p. injection of insulin (33 milliunits/g of body wt.); or 72 hrafter food was removed and 30 min after i.p. injection of saline.The nutritional manipulations (prolonged fasting, high calorie-diet, or injection of glucose or insulin) produced no apparentill effects: there was no mortality, and apart from weightchange, the animals appeared healthy. Mice were sacrificed by
**To whom reprint requests should be addressed.
3434
Proc. Natl. Acad. Sci. USA 93 (1996) 3435
exposure to carbon dioxide for -5 min, followed by cardiacpuncture and decapitation between 16:00 and 18:00 hr. Freshwhite adipose tissue from the gonadal fat pad was removed,frozen on dry ice, and stored at -70°C until use. Glucose wasmeasured by a Lifescan One-Touch II glucose meter (Johnson& Johnson). Insulin was measured by a species-nonspecificRIA (11) using rat insulin as a standard.RNA Extraction and Northern Blot Analysis. Total RNA
from '100 mg of adipose tissue (from gonadal fat pad) wasextracted in RNAzol B (Tel-Test, Friendswood, TX). Pelletwas resuspended in 15-20 ,tl of diethylpyrocarbonate (DEPC)-treated water. The quantity and integrity of RNA isolated wasdetermined for each sample by using both UV absorbance(260/280) as well as by agarose electrophoresis, visualizing theintact ribosomal RNA bands with ethidium bromide. Approx-imately 7 Atg of total RNA from each sample was denatured byincubating with glyoxal and dimethyl sulfoxide for 1 hr at 50°C,loaded into 1.5% agarose gel, and then separated by electro-phoresis at 80 V for 2.5 hr. RNA was transferred to ImmobilonS (Millipore) by capillary elution in 20x standard saline citrate(SSC) (1 x SSC is 0.15 M NaCl/15 mM sodium citrate, pH 7.0).After being washed with 6x SSC, membranes were baked at80°C for 1 hr and exposed to UV light to fix RNA. Themembranes were prehybridized in a solution containing 25mM NaPO4 (pH 7.0), 4x SSC, 5 mM EDTA, 5x Denhardt'ssolution, 0.5% (vol/vol) SDS, 50% (vol/vol) deionized form-amide, and denatured salmon sperm DNA at 100 ,tg/ml (5Prime -> 3 Prime, Inc.) at 42°C overnight. Hybridization wasdone in the same buffer containing 10% (wt/vol) dextransulfate and 32P-labeled ob gene probe at 1.6 ,uCi/ml (1 Ci =
37 GBq; 1.4 ng/ml) at 42°C overnight. The membranes werewashed twice in lx SSC, 0.1% SDS for 20 min at roomtemperature, followed by two washes in 0.1 x SSC/0.1% SDSfor 15 min at room temperature. Subsequently, the membraneswere washed in 0.1 x SSC, 0.1% SDS for 3 hr at 55°C and thenexposed to autoradiography film between intensifying screensfor 1 to 72 hr at -70°C. To monitor RNA loading, membraneswere reprobed and hybridized with 32P-labeled probe encoding18S ribosomal RNA. The total integrated densities of hybrid-ization signals were determined by computerized densitomet-ric scanning (MCID Systems, St. Catherine's, ON).Template Production and Probe Labeling. A template for a
single-stranded complementary DNA (cDNA) probe for theob gene was produced from RNA of lean mouse adipose tissueby using a reverse transcriptase-polymerase chain reaction(RT-PCR). A mixture of 1 ,ug of total adipose RNA, 1 x PCRbuffer, 5 mM MgCl2, 1 mM dNTPs, 20 units of RNaseinhibitor, 50 units of reverse transcriptase, and 2.5 ,tM randomhexamers in a total volume of 20 ,tl was incubated at roomtemperature for 10 min to allow for the hybridization of thehexameric primer. Subsequently, reverse transcription wascarried out using the following sequence of conditions: 42°C(15 min), 99.9°C (5 min), and 4°C (5 min). The product of thereverse transcription was mixed with IX PCR buffer, 2 mMMgCl2, 2.5 units of Taq polymerase, 50 pmol of ob geneN-terminal primer: 5'-CTGCAAGGTGCAAGAAGAAG-3'(Oligos Etc., Portland, OR), and 50 pmol of ob gene C-terminal primer: 5'-TCGGAGATTCTCCAGGTCAT-3', in afinal volume of 100 tul. Amplification conditions were asfollows: 94°C (1 min), 58°C (2 min), and 72°C (3 min) for 30cycles. The amplified fragments were separated on a low-melting-point agarose gel, and the appropriate band (352 bp)was cut out, purified, diluted to 50 ng/,ul, and stored at -20°Cfor labeling as described below. The identity of the purifiedtemplate of ob gene was confirmed by direct sequencing, andthe sequence was almost completely complementary to mouseob gene bases 78-430, as numbered in ref. 4. The 18Sribosomal RNA probe was generated in an analogous fashion.
Single-stranded internally labeled DNA probes were pro-duced by amplified primer extension labeling (12), which
produces single-stranded cDNA probes with high specificactivity analogous to RNA probes, but which produces lessnonspecific binding than RNA probes. The reaction mixturecontained 50 ng of template cDNA, 1 x PCR buffer, 1.5 mMMgCl2, deoxy G, A, and T (0.2 mM each), 150 ,tCi of[32P]dCTP (800 Ci/mmol, DuPont), 50 pmol of C-terminalprimer, and 2.5 units of Taq polymerase in a total 50-,tl vol.Amplification was done in a thermal cycler by using thefollowing sequence: 94°C (30 sec), 60°C (30 sec), and 72°C (30sec) for 50 cycles. Labeled probes were purified from unin-corporated nucleotides and excess primers by G-50 spin col-umns (5 Prime -> 3 Prime) and stored at -70°C until use.
Statistical Analysis. Statistical analysis was performed usingJMP software (SAS), entailing a two-way analysis of variance(ANOVA) followed by Tukey-Kramer honestly significantdifference (HSD) pair-wise comparisons, or linear regression,unless otherwise specified.
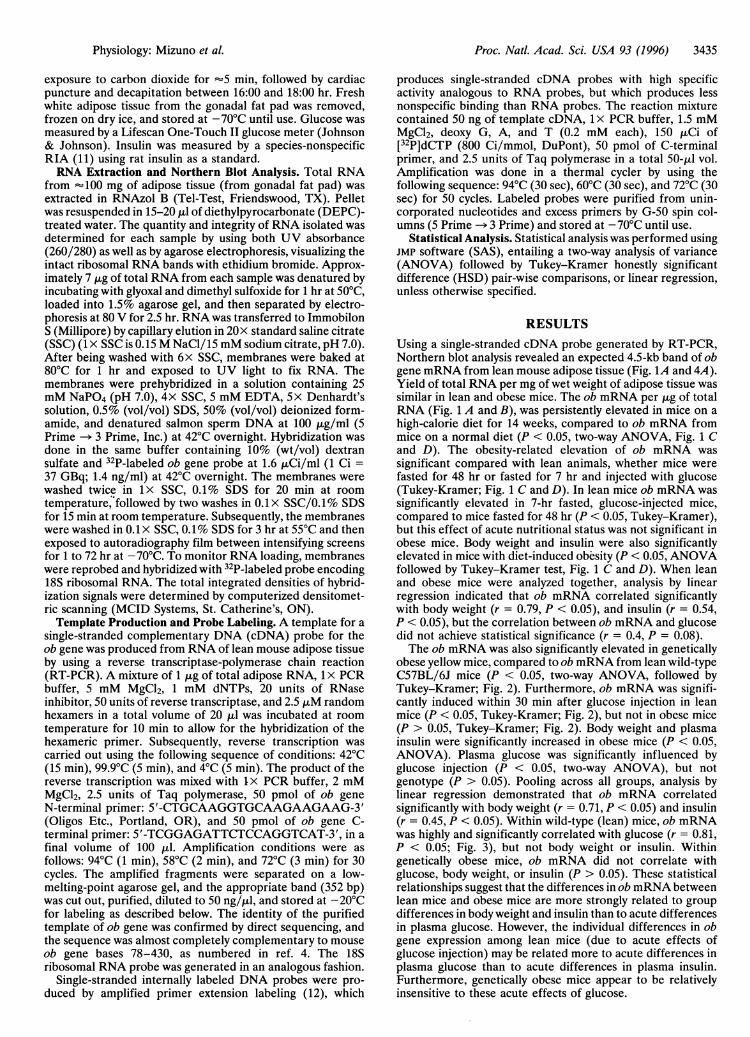
RESULTSUsing a single-stranded cDNA probe generated by RT-PCR,Northern blot analysis revealed an expected 4.5-kb band of obgene mRNA from lean mouse adipose tissue (Fig. 1A and 4A).Yield of total RNA per mg of wet weight of adipose tissue wassimilar in lean and obese mice. The ob mRNA per ,tg of totalRNA (Fig. 1 A and B), was persistently elevated in mice on ahigh-calorie diet for 14 weeks, compared to ob mRNA frommice on a normal diet (P < 0.05, two-way ANOVA, Fig. 1 Cand D). The obesity-related elevation of ob mRNA wassignificant compared with lean animals, whether mice werefasted for 48 hr or fasted for 7 hr and injected with glucose(Tukey-Kramer; Fig. 1 C and D). In lean mice ob mRNA wassignificantly elevated in 7-hr fasted, glucose-injected mice,compared to mice fasted for 48 hr (P < 0.05, Tukey-Kramer),but this effect of acute nutritional status was not significant inobese mice. Body weight and insulin were also significantlyelevated in mice with diet-induced obesity (P < 0.05, ANOVAfollowed by Tukey-Kramer test, Fig. 1 C and D). When leanand obese mice were analyzed together, analysis by linearregression indicated that ob mRNA correlated significantlywith body weight (r = 0.79, P < 0.05), and insulin (r = 0.54,P < 0.05), but the correlation between ob mRNA and glucosedid not achieve statistical significance (r = 0.4, P = 0.08).The ob mRNA was also significantly elevated in genetically
obese yellow mice, compared to ob mRNA from lean wild-typeC57BL/6J mice (P < 0.05, two-way ANOVA, followed byTukey-Kramer; Fig. 2). Furthermore, ob mRNA was signifi-cantly induced within 30 min after glucose injection in leanmice (P < 0.05, Tukey-Kramer; Fig. 2), but not in obese mice(P > 0.05, Tukey-Kramer; Fig. 2). Body weight and plasmainsulin were significantly increased in obese mice (P < 0.05,ANOVA). Plasma glucose was significantly influenced byglucose injection (P < 0.05, two-way ANOVA), but notgenotype (P > 0.05). Pooling across all groups, analysis bylinear regression demonstrated that ob mRNA correlatedsignificantly with body weight (r = 0.71, P < 0.05) and insulin(r = 0.45, P < 0.05). Within wild-type (lean) mice, ob mRNAwas highly and significantly correlated with glucose (r = 0.81,P < 0.05; Fig. 3), but not body weight or insulin. Withingenetically obese mice, ob mRNA did not correlate withglucose, body weight, or insulin (P > 0.05). These statisticalrelationships suggest that the differences in ob mRNA betweenlean mice and obese mice are more strongly related to groupdifferences in body weight and insulin than to acute differencesin plasma glucose. However, the individual differences in obgene expression among lean mice (due to acute effects ofglucose injection) may be related more to acute differences inplasma glucose than to acute differences in plasma insulin.Furthermore, genetically obese mice appear to be relativelyinsensitive to these acute effects of glucose.
Physiology: Mizuno et aL.
Proc. Natl. Acad. Sci. USA 93 (1996)
A obese gene product28S(4.7 Kb)
4.5 Kb_ ......
B 18S ribosomal RNA
18S(1.9 Kb)
48h Fast 48h Fast 7h Fast 7h Fast
Chow Hi Cal. Chow Hi Cal.
C 48-h fast100
ae
0
a
.0L.
zcr
Eo
80-
60-
40-
20-
0 -LJ-Diet: Chow
B.W. (g):Insulin (pU/ml):
Glucose (mg/dl):
T
Hi Cal.
23.6 + 0.3 38.7+2.30.5 + 0.0 6.6 + 2.9
98 + 1 106 +4
D 7-h fast + glucose100-
CO* 80-
0
>, 60-
.0
X 40-<:zccE 20-
0
0-
Diet:
B.W. (g):Insulin (LU/ml):
Glucose (mg/dl):
Chow Hi Cal.
29.5 + 0.7 48.7 + 2.1
2.4 +0.7 28.2+6.0
220+27 303+34
FIG. 1. Chronic and acute nutritional stimulation of ob geneexpression. (A) Representative Northern blot of ob gene mRNA (4.5kb) isolated from adipose tissue. Seven micrograms of total RNA was
applied to each lane. (B) Same blot as inA but reprobed with a cDNAfor 18S ribosomal RNA. 48h Fast + Chow, food removed 48 hr beforesacrifice (just before lights out) of male C57BL/6J mice on a standardPurina mouse chow diet; 48h Fast + Hi Cal, food removed 48 hr beforesacrifice of mice maintained for 14 weeks on a high-calorie (high-fat,high-carbohydrate) diet; 7h Fast + Chow, food removed 7 hr, thenmice sacrificed 30 min after i.p. injection with glucose (2 mg/g bodywt); mice maintained on a chow diet. 7h Fast + Hi Cal, food removed7 hr, then mice sacrificed 30 min after i.p. injection with glucose (2
50-
An-
* U
Z a 30-
0
X 10-
Obese
Lean
0 15 30Time after glucose inj. (min)
FIG. 2. Effect of genetic obesity (yellow agouti) and glucoseinjection on ob mRNA. Lean, male C57BL/6J (a/a); Obese, yellowagouti heterozygous (AY/a on C57BL/6J background) obese. Valuesare means ± SEM (n = 5 per group). Food was removed 7 hr beforesacrifice; then mice were sacrificed 0, 15, and 30 min after i.p. injectionwith glucose (2 mg/g of body wt). ob mRNA was significantlyinfluenced by both genotype and glucose injection (P < 0.05, two-wayANOVA). *, Significantly higher than lean mice at correspondingtime-point (P < 0.05, Tukey-Kramer). §, Significantly higher thangroup of same genotype at 0 min (P < 0.05, Tukey-Kramer test).
Controlling for effects of the injection procedure, mice weresacrificed 30 minutes after an i.p. injection of saline, glucose,or insulin, after a 7-hr fast, or 30 min after an i.p. injection ofsaline after a 72-hr fast. In normal lean mice, ob mRNA was
significantly influenced by these acute nutritional manipula-tions (P < 0.05, ANOVA). The ob mRNA in mice fasted for7 hr was -10-fold higher than ob mRNA in mice fasted for 72hr (P < 0.05, ANOVA followed by Tukey-Kramer test; Fig. 4).Furthermore, in mice fasted for 7 hr, i.p. injection of eitherglucose or insulin resulted in -2-fold increase in ob mRNA 30min after injection (P < 0.05, Tukey-Kramer, Fig. 4).
DISCUSSIONThe product of the obese gene, leptin, is hypothesized toconstitute a satiety factor, because absence of a functionalobese gene in ob/ob mice leads to hyperphagia and obesity (2),and injection of leptin reduces feeding and body weight inob/ob mice (5-7). It was of particular interest that at thehighest doses of leptin, mice with diet-induced obesity also lostweight (7). These results raised the possibility that, regardlessof etiology, obesity might entail impaired production of leptinand might be reversible by injection of leptin. However, in thepresent study, we report that both diet-induced obesity andobesity due to the yellow agouti mutation were associated withdramatically elevated levels of ob mRNA. Because the expres-sion of ob mRNA was normalized per mg of total RNA, theactual amount of total (presumably secreted) ob gene productin obese mice is even greater because obese animals also havea greater mass of adipose tissue, and the yield of total RNA permg ofwet weight adipose tissue in the present study was at leastas great in obese animals as in lean animals. Therefore,
mg/g of body wt); mice maintained on a high-calorie (high-fat,high-carbohydrate) diet. (C and D) quantification of ob gene mRNA(arbitrary OD units) in adipose tissue, of mice fasted for 48 hr, orfasted 7 hr and then sacrificed 30 min after glucose injection. Valuesare means ± SEM. B.W., body weight in g at time of sacrifice. obmRNA, body weight, and insulin were significantly influenced by bothdiet and acute nutritional manipulation (fasting/glucose injection) (P< 0.05, two-way ANOVA). *Group on high-calorie diet higher thancorresponding (48-hr or 7-hr fast) chow diet group (P < 0.05,Tukey-Kramer test).
c
3436 PhsooyMiuoeal
Proc. Natl. Acad. Sci. USA 93 (1996) 3437
200 250 300 350 400Blood glucose (mg/dl)
A obese gene product28S..:(4.7 Kb) _ *
4.5 Kb - *
B 18S ribosomal RNA
(1.9 Kb) .' -.
7h Fast 72h Fast 7h Fast 7h Fast+ + + +
Saline Saline Insulin Glucose
C50
FIG. 3. Correlation between ob mRNA and blood glucose in leanmice from Fig. 2, pooling 0, 15, and 30 min after i.p. injection ofglucose. ob mRNA was highly correlated with glucose in lean animals(r = 0.81, P < 0.05), but not in genetically obese AY/y animals (datanot shown).
consistent with other recent reports (8, 13), obesity may begenerally associated with elevated expression of the obese gene.
Elevated expression of the leptin gene in association withmany forms of obesity suggests that obesity may generally becharacterized by a relative insensitivity to leptin, rather thaninsufficient leptin production. Consistent with this hypothesis,5-fold to 10-fold greater doses of leptin were required toproduce an equivalent weight loss in mice with diet-inducedobesity, compared to ob/ob mice (7). Thus, simply consuminga high-fat, high-carbohydrate diet appears to be associatedwith a remarkable loss of leptin sensitivity. Similarly, leptininsensitivity appears to be one of the effects of the yellowagouti mutation, whose obesity appears to be due to ectopicexpression of an antagonist to melanocyte-stimulating hor-mone (10), the relationship of which to leptin action, if any,remains undefined. The general association of obesity withinsensitivity to leptin may therefore limit the clinical efficacyof leptin in the treatment of human obesity.The hypothesis that leptin constitutes a physiological satiety
factor suggests that leptin might be induced by nutritionalfactors that produce satiety. The present studies indicate thatob gene expression is highly sensitive to nutritional status. Bothchronic (high-calorie diet) and acute (i.p. injection of glucose)nutritional stimulation lead to elevated ob mRNA, whereasacute nutritional deprivation (48-hr or 72-hr fast) dramaticallyreduced ob mRNA. When comparing across groups withdifferent body weights, ob mRNA (per mg of adipose RNA)was highly and positively correlated with body weight. On theother hand, it may be revealing that fasting and i.p. glucoseinjection did not significantly influence ob mRNA in obesemice, suggesting that in obesity sensitivity of ob gene expres-sion to nutritional status may be attenuated. These datasuggest that an insensitivity of the ob gene to nutritional statusmay contribute to the maintenance of the obese state.Although ob mRNA was highly correlated with body weight,
the mechanism that links ob mRNA with total adiposity isunclear. However, the observation that nutritional stimulationenhances expression of the ob gene suggests that the anabolicprocesses that lead to increased body weight (hyperphagia,hyperinsulinemia, and hyperglycemia) may concomitantly en-hance expression of the ob gene. Thus, ob gene expression andbody weight would be positively correlated because of a thirdfactor that stimulates both body weight and ob mRNA. Thepresent studies addressed the hypothesis that nutritional stim-ulation of ob mRNA may be mediated by elevations in glucose
FIG. 4. Effect of fasting or injection of insulin or glucose on obmRNA. (A) Representative Northern blot of ob gene mRNA (4.5 kb)isolated from adipose tissue. Seven micrograms of total RNAwas appliedto each lane. (B) Same blot as in A, but reprobed with a cDNAcomplementary to 18S ribosomal RNA. 7h-Fast + Saline, food removed7 hr before sacrifice (during lights on), then sacrificed (just before lightsout) 30 min after i.p. injection with saline; 72-h Fast + Saline, foodremoved 72 hr before sacrifice and then sacrificed 30 min after i.p.injection of saline; 7h-Fast + Insulin, food removed 7 hr before sacrificeand then sacrificed 30 min after i.p. with insulin (33 mU/g body wt);7h-Fast + Glucose, food removed 7 hr before sacrifice and then sacrificed30 min after i.p. injection with glucose (2 mg/g of body wt.). (C)Quantification of ob gene mRNA (arbitrary OD units) in adipose tissue.Values are means ± SEM (n = 4-12). Groups with different letters arestatistically different (P < 0.05, ANOVA followed by Tukey-Kramer).
or insulin. When analyzed across groups of animals withdifferent body weights (due to obesity or fasting), ob mRNAwas significantly correlated with both body weight and insulin,but not with glucose. Furthermore, acute injection of insulinsignificantly increased ob mRNA. Therefore hyperinsulinemiacould plausibly constitute a common signal that causes bothincreased body weight and increased ob mRNA during thedevelopment of obesity.
Nevertheless, in normal lean mice, glucose may be at leastas important as insulin in mediating acute effects of nutritionon ob mRNA. As described in the present report, in twodifferent studies with lean mice, ob mRNA was induced within30 min after i.p. injection of glucose. Furthermore, after i.p.glucose injection in normal lean mice, ob mRNA highlycorrelated with plasma glucose but not with plasma insulin.Furthermore, the levels of insulin after injection of the phar-macological doses used in these studies were far higher thanthe physiological levels produced by glucose injection. Wetherefore suggest that glucose and insulin may each have
Physiology: Mizuno et al.
Proc. Natl. Acad. Sci. USA 93 (1996)
independent effects on ob mRNA, similar to the independenteffects of insulin and glucose on liver function (14) and geneexpression (15). The statistical relationships in the presentstudy suggest that insulin is more important for chronicregulation of ob gene expression and glucose is more impor-tant for acute regulation. The inhibition of ob mRNA in fastedmice may be due to the decreased plasma glucose as well asdecreased plasma insulin, which are characteristic of the fastedstate. A common glucose response element (GIRE), respon-sible for the transcriptional response to carbohydrates andhormones, has been characterized in several genes that areregulated by insulin and glucose (15). It will be of interest toexamine the promoter of the ob gene for these elements.The wild-type allele of the obese gene is, of course, more
properly thought of as an anti-obese gene because the absenceof this gene product produces obesity. (In contrast, the [ec-topic] expression of the yellow allele of the agouti geneproduces obesity). A critical question is, therefore, what me-diates the anti-obesity effect of the wild-type obese gene allele?One of the earliest detectable differences between ob/ob mice(which lack functional ob gene product) and wild-type controls(which produce the ob gene product) is an elevation of plasmainsulin in ob/ob mice before the development of obesity.Fourteen days after birth, plasma insulin is elevated in ob/obmice, compared to wild-type controls (16), whereas at this ageneither food intake nor body weight differs between ob/ob andwild-type mice (17). Such results suggest that an early effect ofleptin is to inhibit insulin secretion, independent of its effectson feeding. The present studies suggest that integrated orchronic insulin levels are positively correlated with ob mRNAand that insulin injection can stimulate ob mRNA. Thus theelevation of ob mRNA in both acquired and genetic obesity(refs. 8, 13, present studies) is plausibly related to the hyper-insulinemia that is associated with obesity. Therefore wehypothesize that insulin and leptin constitute a negative feed-back loop, in which insulin (with glucose) stimulates leptin, andleptin inhibits insulin secretion, at least partly independent ofits effects on feeding. The hypothesis that "ob mRNA wasincreased [in ob/ob mice] as part of a possible feedback loop"(4) could thus be explained as a failure in ob/ob mice to inhibitinsulin secretion, in the absence of ob gene product. Con-versely, the anti-obesity effect of the wild-type obese geneallele could be understood as being mediated, at least in part, byits effects in inhibiting insulin secretion. Further studies will be
needed to address whether leptin acts at the pancreas to inhibitinsulin secretion and whether blocking hyperinsulinemia in obe-sity will prevent the elevation of ob mRNA associated withobesity.
These studies were supported by the American Diabetes Associa-tion, the Diabetes Action and Research Foundation, the EasternParalyzed Veterans Association, the Manitoba Health ResearchCouncil, the National Institutes of Health (DK 50110-01), and theGlenn Foundation, of which C.V.M. was a fellow.
1. Consensus Conference Statement (1985) Ann. Int. Med. 103,1073-1077.
2. Coleman, D. L. (1982) Diabetes 31, Suppl., 1-6.3. Coleman, D. L. (1973) Diabetologia 9, 294-298.4. Zhang, Y., Proenca, R., Maffei, M., Barone, M., Leopold, L. &
Friedman, J. (1994) Nature (London) 372, 425-431.5. Halaas, J. L., Gajiwlala, K. S., Maffei, M., Cohen, S. L., Chait,
B. T., Rabinowitz, D., Lallone, R. L., Burley, S. K. & Friedman,J. M. (1995) Science 269, 543-546.
6. Pelleymounter, M. A., Cullen, M. J., Baker, M. B., Hecht, R.,Winters, D., Boone, T. & Collins, F. (1995) Science 269,540-543.
7. Campfield, L. A., Smith, F. J., Guisez, Y., Devos, R. & Burn, P.(1995) Science 269, 546-549.
8. Maffei, M., Fei, H., Lee, G.-H., Dani, C., Leroy, P., Zhang, Y.,Proenca, R., Negrel, R., Ailhaud, G. & Friedman, J. (1995) Proc.Natl. Acad. Sci. USA 92, 6957-6960.
9. Yen, T. T., Gill, A. M., Frigeri, L. G., Barsch, G. S. & Wolff,G. L. (1994) FASEB J. 8, 479-488.
10. Lu, D., Willard, D., Patel, I. R., Kadwell, S., Overton, L., Kost,T., Luther, M., Chen, W., Woychik, R. P., Wilkison, W. 0. &Cone, R. D. (1994) Nature (London) 371, 799-801.
11. Yalow, R. S. & Berson, S. A. (1973) in Methods in Investigativeand Diagnostic Endocrinology, eds. Berson, S. A. & Yalow, R. S.(North-Holland, Amsterdam, The Netherlands), Vol. 2, pp.864-870.
12. Brooks, P. J., Kaplitt, M. G., Kleopoulos, S. P., Funabashi, T.,Mobbs, C. V. & Pfaff, D. W. (1993) J. Histochem. Cytochem. 41,1761-1766.
13. Considine, R. V., Considine, E. L;, Williams, C. J., Nyce, M. R.,Manosin, S. A., Bauer, T. L., Roato, E. L., Colberg, J. & Caro,J. F. (1995) J. Clin. Invest. 95, 2986-2988.
14. Liu, Z., Gardner, L. B. & Barrett, E. J. (1993) Metabolism 42,1546-1551.
15. Vaulont, S. & Kahn, A. (1994) FASEB J. 8, 28-35.16. Chen, N.-G. & Romsos, E. R. (1995)Endocrinology 136,505-511.17. Rath, E. & Thenen, S. W. (1979) J. Nutr. 109, 840-847.