+ All Categories
Home > Documents > Gene Level Expression Profiling Using Affymetrix Exon Arrays Alan Williams, Ph.D. Director Chip...

Gene Level Expression Profiling Using Affymetrix Exon Arrays Alan Williams, Ph.D. Director Chip...

Date post: 01-Jan-2016
Category:
Upload: george-horn
View: 231 times
Download: 1 times
Share this document with a friend
Popular Tags:
27
Gene Level Expression Profiling Using Gene Level Expression Profiling Using Affymetrix Exon Arrays Affymetrix Exon Arrays Alan Williams, Ph.D. Alan Williams, Ph.D. Director Chip Design Director Chip Design Affymetrix, Inc. Affymetrix, Inc.
Transcript

Gene Level Expression Profiling Using Gene Level Expression Profiling Using Affymetrix Exon ArraysAffymetrix Exon Arrays

Alan Williams, Ph.D.Alan Williams, Ph.D.Director Chip DesignDirector Chip Design

Affymetrix, Inc.Affymetrix, Inc.

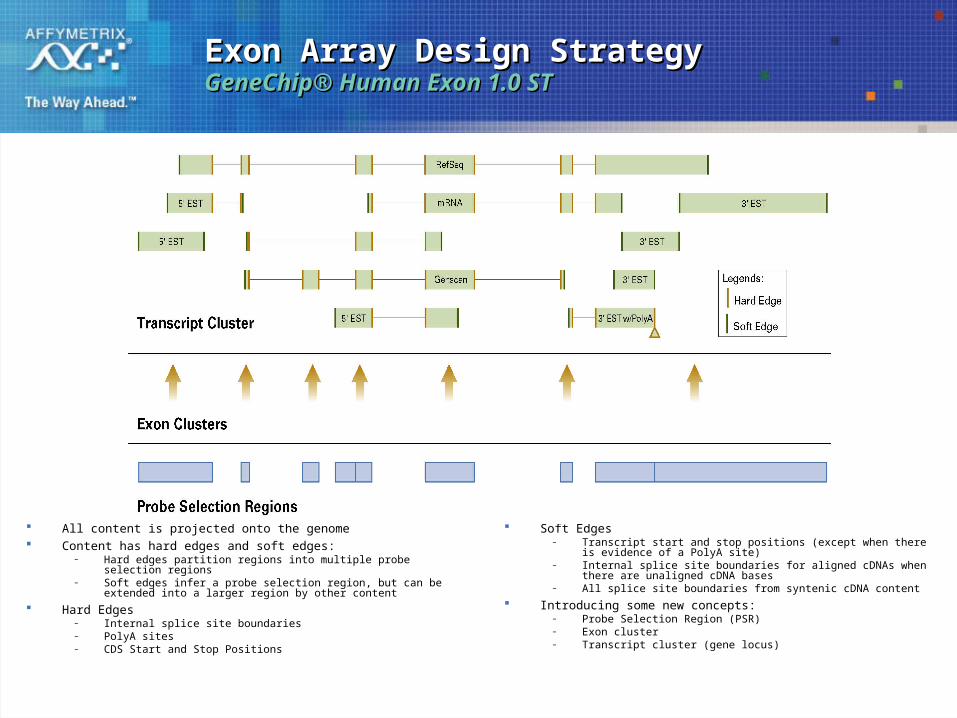
Exon Array Design StrategyExon Array Design StrategyGeneChipGeneChip® Human Exon 1.0 ST® Human Exon 1.0 ST

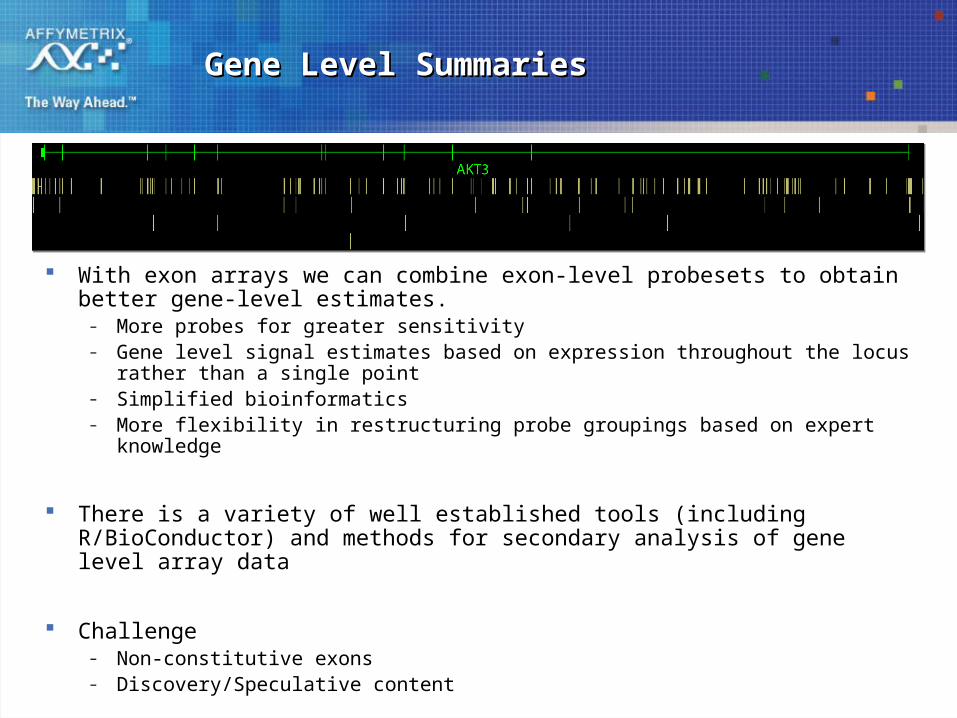
All content is projected onto the genome Content has hard edges and soft edges:

– Hard edges partition regions into multiple probe selection regions– Soft edges infer a probe selection region, but can be extended into a

larger region by other content

Hard Edges– Internal splice site boundaries– PolyA sites– CDS Start and Stop Positions

Soft Edges– Transcript start and stop positions (except when there is evidence of a

PolyA site)– Internal splice site boundaries for aligned cDNAs when there are

unaligned cDNA bases– All splice site boundaries from syntenic cDNA content

Introducing some new concepts:– Probe Selection Region (PSR)– Exon cluster– Transcript cluster (gene locus)

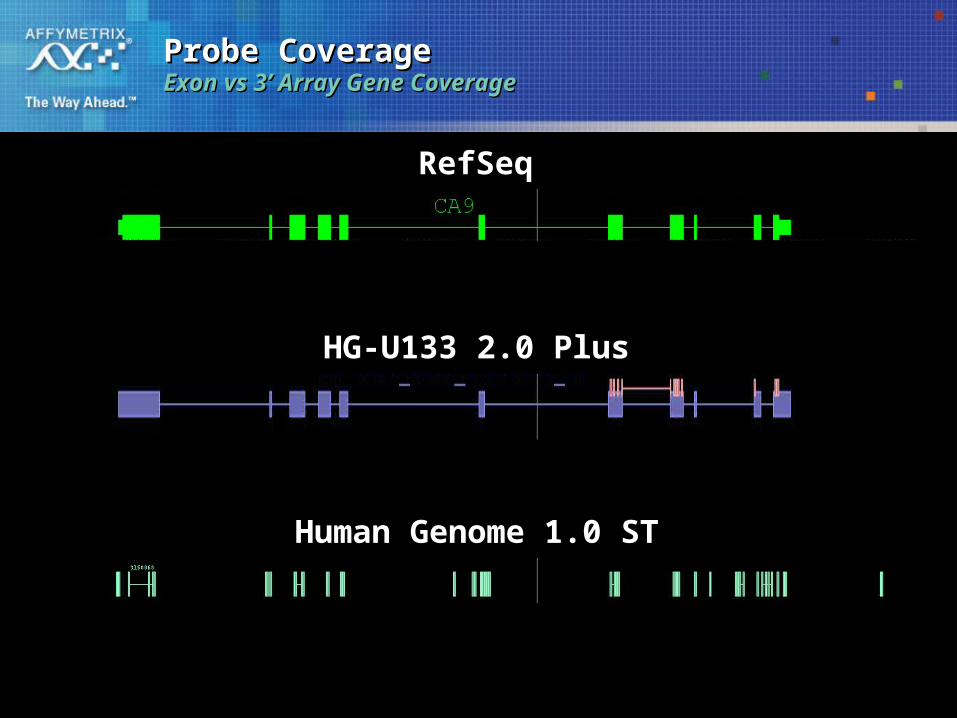
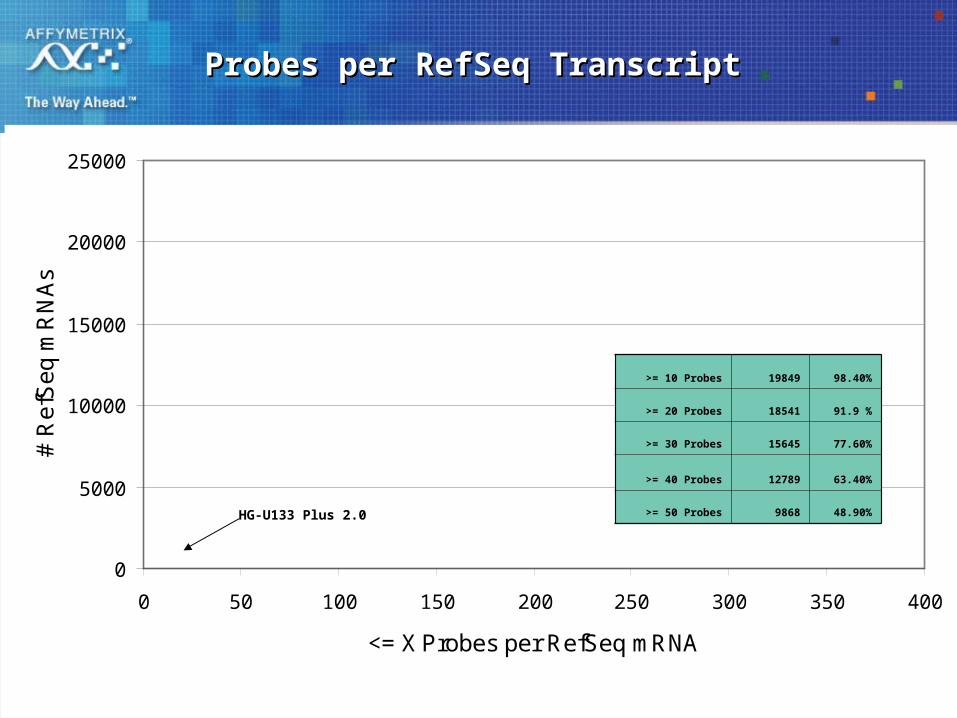
Probe Coverage Probe Coverage Exon vs 3’ Array Gene CoverageExon vs 3’ Array Gene Coverage

RefSeqRefSeq

HG-U133 2.0 PlusHG-U133 2.0 Plus

Human Genome 1.0 STHuman Genome 1.0 ST

Content Sources Content Sources GeneChipGeneChip® Human Exon 1.0 ST® Human Exon 1.0 ST

Core Gene Annotations– RefSeq alignments– GenBank annotated full length

alignments

Extended Gene Annotations– cDNA alignments– Ensembl annotations (Hubbard,

T. et al.)– Mapped syntenic mRNA from

rat and mouse– microRNA annotations– MitoMAP annotations– Vegagene (The HAVANA group,

Hillier et al., Heilig et al.)– VegaPseudogene (The

HAVANA group, Hillier et al., Heilig et al.)

Full Gene Annotations– Geneid (Grup de Recerca en

Informàtica Biomèdica)– Genscan (Burge, C. et al.)– GenscanSubopt (Burge, C. et

al.)– Exoniphy (Siepel et al.)– RNAgene (Sean Eddy Lab)– SgpGene (Grup de Recerca

en Informàtica Biomèdica)– Twinscan (Korf, I. et al.)

Probes per RefSeq TranscriptProbes per RefSeq Transcript

0

5000

10000

15000

20000

25000

0 50 100 150 200 250 300 350 400

<= X Probes per RefSeq mRNA

# R

efS

eq

mR

NA

s

>= 10 Probes 19849 98.40%

>= 20 Probes 18541 91.9 %

>= 30 Probes 15645 77.60%

>= 40 Probes 12789 63.40%

>= 50 Probes 9868 48.90%HG-U133 Plus 2.0

Gene Level SummariesGene Level Summaries

With exon arrays we can combine exon-level probesets to obtain better gene-level estimates.

– More probes for greater sensitivity– Gene level signal estimates based on expression throughout the locus rather than a

single point– Simplified bioinformatics– More flexibility in restructuring probe groupings based on expert knowledge

There is a variety of well established tools (including R/BioConductor) and methods for secondary analysis of gene level array data

Challenge– Non-constitutive exons– Discovery/Speculative content

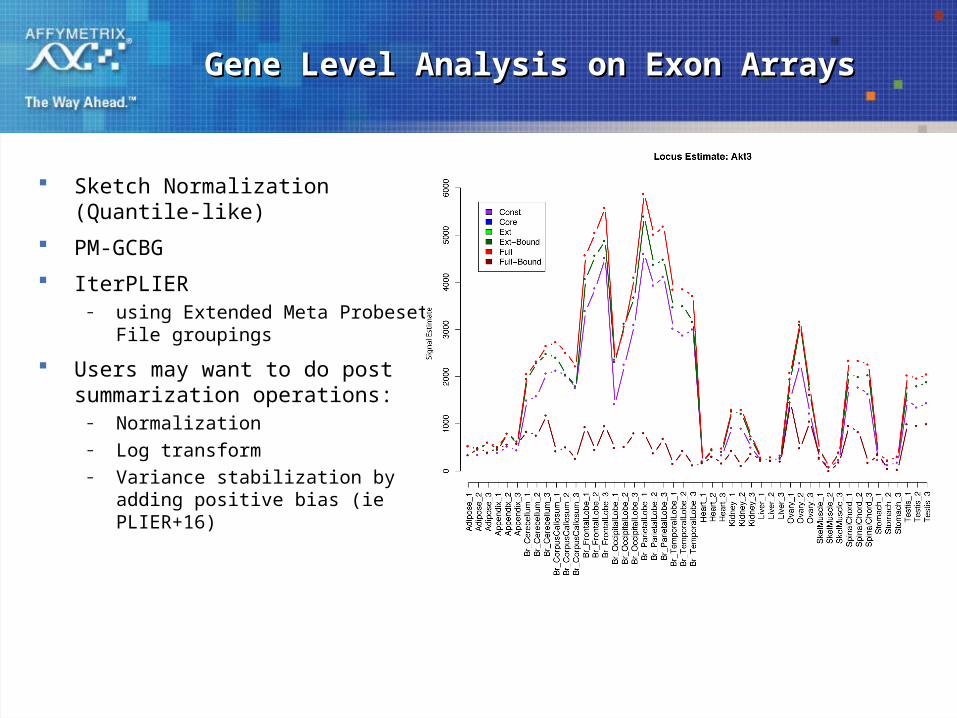
Gene Level Analysis on Exon ArraysGene Level Analysis on Exon Arrays

Sketch Normalization (Quantile-like)

PM-GCBG

IterPLIER– using Extended Meta Probeset File

groupings

Users may want to do post summarization operations:

– Normalization– Log transform– Variance stabilization by adding positive

bias (ie PLIER+16)

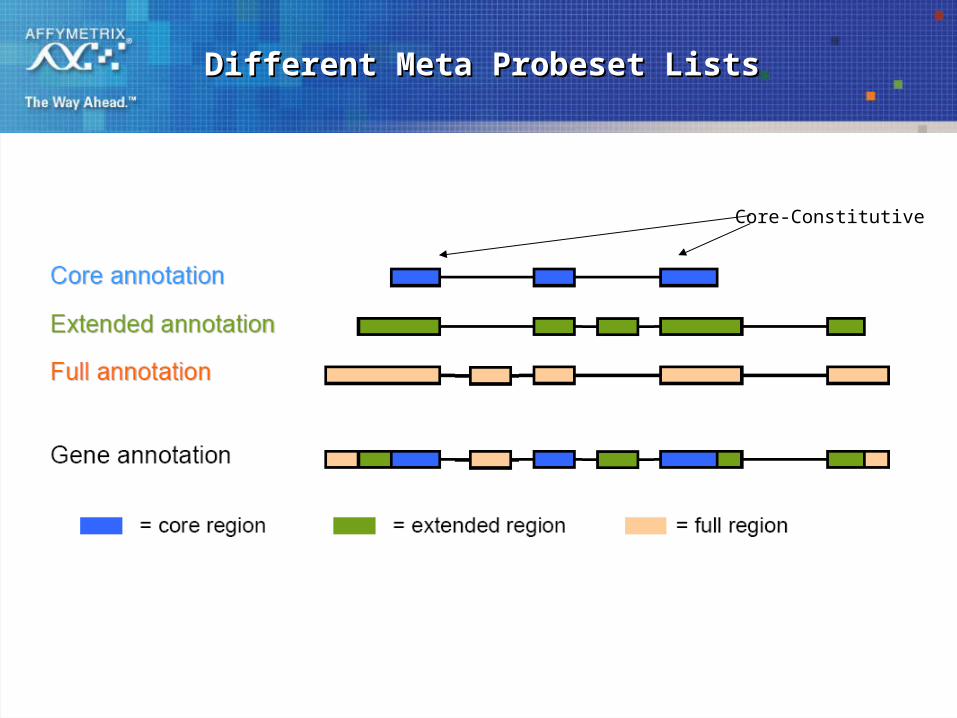
Different Meta Probeset ListsDifferent Meta Probeset Lists

Core-Constitutive

IterPLIERIterPLIER

Start by generating PLIER signal estimate using all the probes

Pick 22 probes which are best correlated to the PLIER signal

Run PLIER on just the 22 probes

Pick 11 probes which are best correlated to the PLIER signal

Generate a final PLIER estimate with the 11 probes

Corollary:– If the meta probeset has 11 or fewer probes, then only 1 run of

PLIER is performed and the result is equal to a regular PLIER result

– If the meta probeset has more than 11 but 22 or fewer probes, then PLIER is run twice: once on the full set of probes and once on the best 11

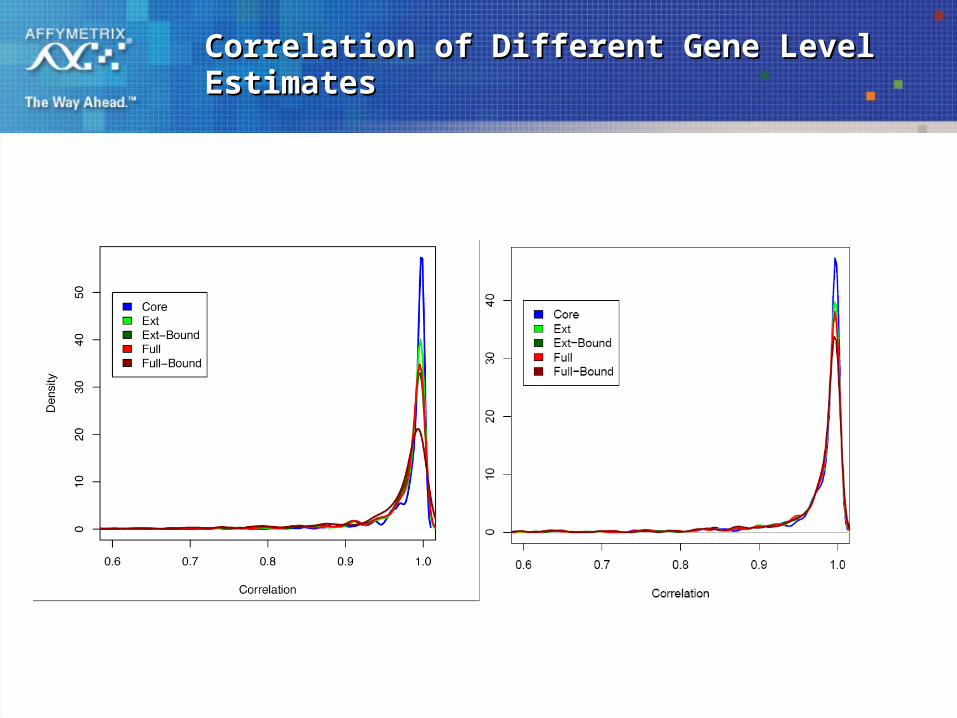
Correlation of Different Gene Level EstimatesCorrelation of Different Gene Level Estimates

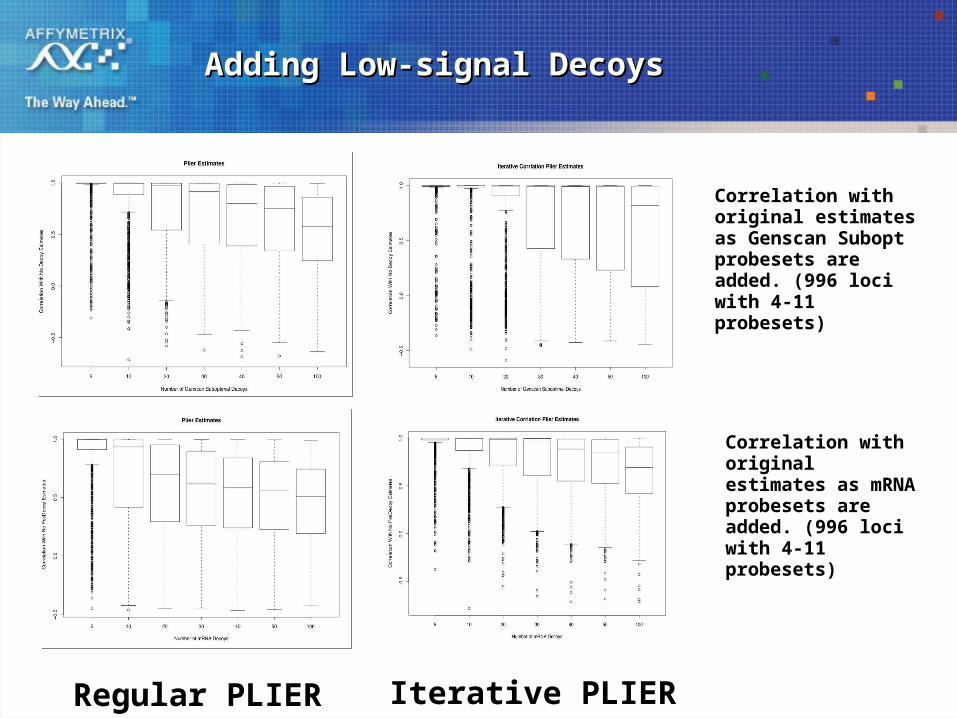
Adding Low-signal DecoysAdding Low-signal Decoys

Correlation with original estimates as Genscan Subopt probesets are added. (996 loci with 4-11 probesets)

Regular PLIER Iterative PLIER

Correlation with original estimates as mRNA probesets are added. (996 loci with 4-11 probesets)

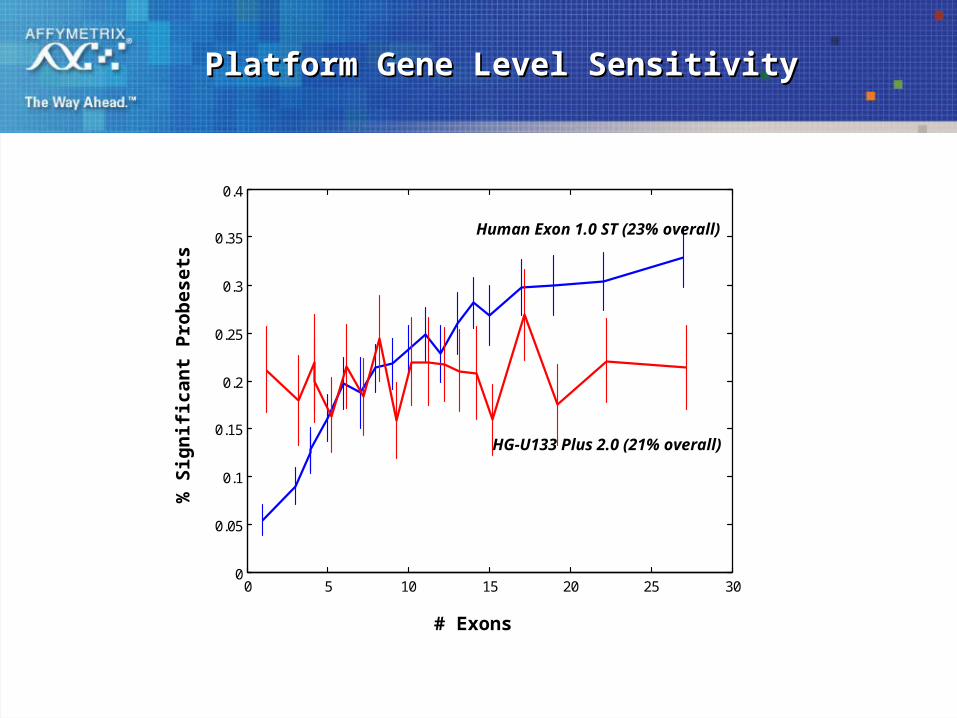
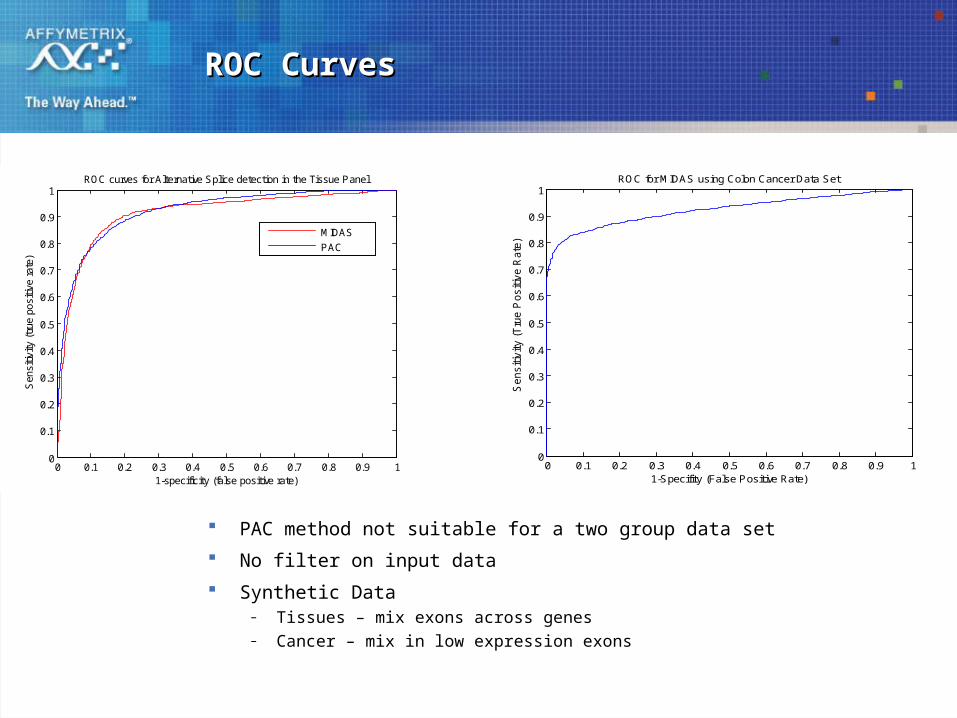
Gene Level PerformanceGene Level Performance

HuEx 1.0 ST vs HG-U133 Plus 2.0HuEx 1.0 ST vs HG-U133 Plus 2.0

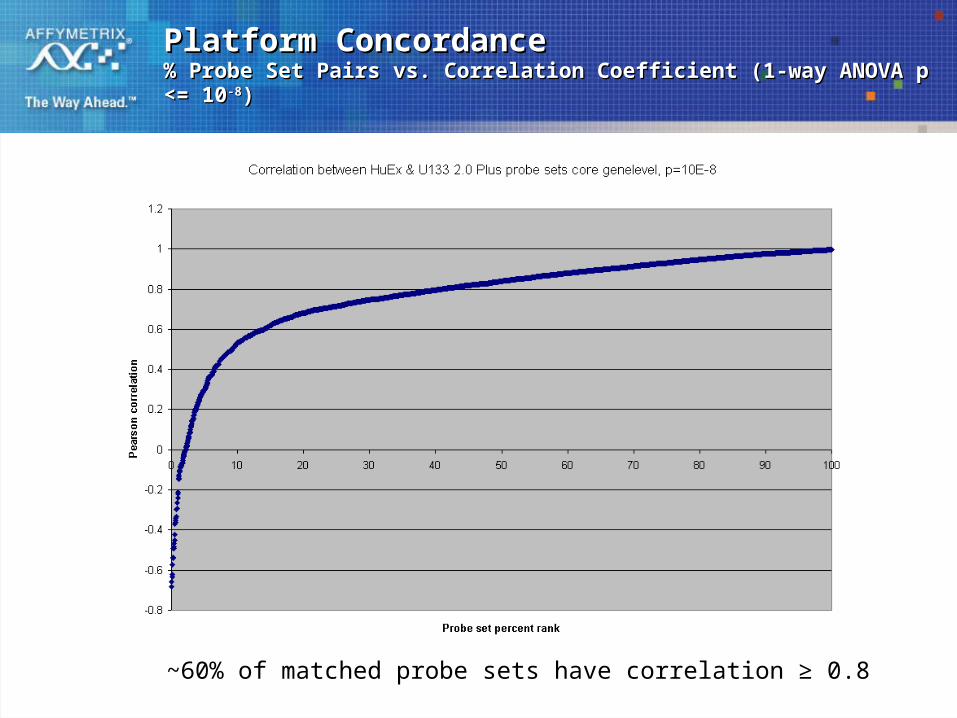
Platform ConcordancePlatform Concordance% Probe Set Pairs vs. Correlation Coefficient (1-way ANOVA p <= 10% Probe Set Pairs vs. Correlation Coefficient (1-way ANOVA p <= 10 -8-8))

~60% of matched probe sets have correlation ≥ 0.8

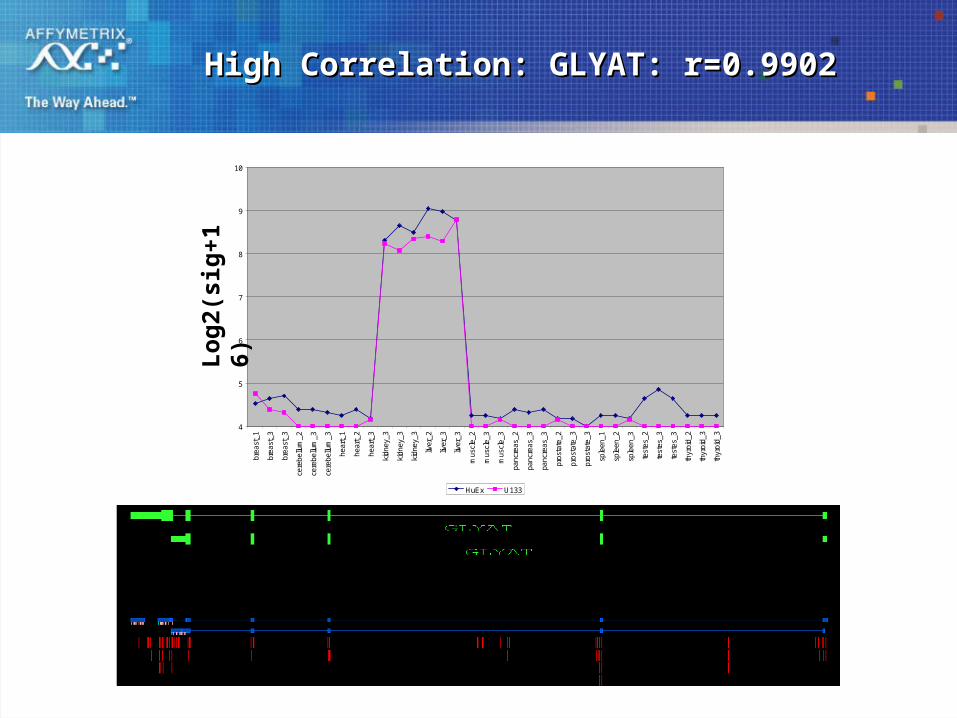
High Correlation: GLYAT: r=0.9902High Correlation: GLYAT: r=0.9902

4

5

6

7

8

9

10

brea

st_1

brea

st_3

brea

st_3

cere

bellu

m_2

cere

bellu

m_3

cere

bellu

m_3

hear

t_1

hear

t_2

hear

t_3

kidn

ey_3

kidn

ey_3

kidn

ey_3

liver

_2

liver

_3

liver

_3

mus

cle_

2

mus

cle_

3

mus

cle_

3

panc

reas

_2

panc

reas

_3

panc

reas

_3

pros

tate

_2

pros

tate

_3

pros

tate

_3

sple

en_1

sple

en_2

sple

en_3

test

es_2

test

es_3

test

es_3

thyr

oid_

2

thyr

oid_

3

thyr

oid_

3

HuEx U133

Lo

g2(

sig

+16

)

Moderate Correlation: TSN: r=0.6575Moderate Correlation: TSN: r=0.6575

4

4.5

5

5.5

6

6.5

7

7.5

8

8.5

bre

ast

_1

bre

ast

_3

bre

ast

_3

cere

be

llum

_2

cere

be

llum

_3

cere

be

llum

_3

he

art

_1

he

art

_2

he

art

_3

kid

ne

y_3

kid

ne

y_3

kid

ne

y_3

live

r_2

live

r_3

live

r_3

mu

scle

_2

mu

scle

_3

mu

scle

_3

pa

ncr

ea

s_2

pa

ncr

ea

s_3

pa

ncr

ea

s_3

pro

sta

te_

2

pro

sta

te_

3

pro

sta

te_

3

sple

en

_1

sple

en

_2

sple

en

_3

test

es_

2

test

es_

3

test

es_

3

thyr

oid

_2

thyr

oid

_3

thyr

oid

_3

HuEx U133

Poor Correlation: SREBF1: r=0.0482Poor Correlation: SREBF1: r=0.0482

4

5

6

7

8

9

10

brea

st_1

brea

st_3

brea

st_3

cere

bellu

m_2

cere

bellu

m_3

cere

bellu

m_3

hear

t_1

hear

t_2

hear

t_3

kidn

ey_3

kidn

ey_3

kidn

ey_3

liver

_2

liver

_3

liver

_3

mus

cle_

2

mus

cle_

3

mus

cle_

3

panc

reas

_2

panc

reas

_3

panc

reas

_3

pros

tate

_2

pros

tate

_3

pros

tate

_3

sple

en_1

sple

en_2

sple

en_3

test

es_2

test

es_3

test

es_3

thyr

oid_

2

thyr

oid_

3

thyr

oid_

3

HuEx U133

Platform Gene Level SensitivityPlatform Gene Level Sensitivity

0 5 10 15 20 25 300

0.05

0.1

0.15

0.2

0.25

0.3

0.35

0.4

# Exons

% S

ign

ific

ant

Pro

bes

ets

HG-U133 Plus 2.0 (21% overall)

Human Exon 1.0 ST (23% overall)

One Array, Two functionsOne Array, Two functions

Gene Level Expression and Transcript DiversityGene Level Expression and Transcript Diversity

TPM2TPM2

Heart

Muscle

Data Courtesy of Millennium

Data Courtesy of Millennium

““Splicing Index” definedSplicing Index” defined

Splicing Index ExamplesSplicing Index Examples

Alternative Splicing DetectionAlternative Splicing Detection

PAttern basedCorrelation (PAC)

– Test whether exonscorrelate with eachother

ANOVA based(MiDAS)

– Test a log-linearmodel

For more information see the Alternative Transcript Analysis Methods for Exon Arrays whitepaper:

– http://www.affymetrix.com/support/technical/whitepapers/exon_alt_transcript_analysis_whitepaper.pdf

,

k

,

i.e., exon tracks gene level estimates across tissues

( ) is vector of sample gene estimates (Plier), should be robust

( ) is vector of sample exon estimate, (Plier) should also

ii k k

i i k

e a i k

e e

be robust

Exon robust PAC): ( , )icorr e

, , , , , ,log( ) log( )i j k j k i k i j ke g

ei,j,k = exon signal for ith probeset, k tissue, j gene

gi,k = gene signal for k tissue and j gene

ai,k = log coupling for exon and gene signals

ROC CurvesROC Curves

PAC method not suitable for a two group data set

No filter on input data

Synthetic Data– Tissues – mix exons across genes– Cancer – mix in low expression exons

0 0.1 0.2 0.3 0.4 0.5 0.6 0.7 0.8 0.9 10

0.1

0.2

0.3

0.4

0.5

0.6

0.7

0.8

0.9

1

1-specificity (false positive rate)

Sen

sitiv

ity (

true

pos

itive

rat

e)

ROC curves for Alternative Splice detection in the Tissue Panel

MIDAS

PAC

0 0.1 0.2 0.3 0.4 0.5 0.6 0.7 0.8 0.9 10

0.1

0.2

0.3

0.4

0.5

0.6

0.7

0.8

0.9

1

1-Specifity (False Positive Rate)

Sensitiv

ity (

Tru

e P

ositiv

e R

ate

)

ROC for MIDAS using Colon Cancer Data Set

Alternative Splicing DetectionAlternative Splicing DetectionActive Area of ResearchActive Area of Research

Exon Array Workshop– 45 attendees– 11 presentations– New alternative splicing

algorithms– New confidence in using Exon

Arrays for Gene-Level expression profiling

– New directions for filtering data for more robust results

http://www.affymetrix.com/corporate/events/2006_exon_tiling_workshop.affx

ResourcesResources

Human, Mouse, & Rat array content and annotation information– Array Support Page on Affymetrix.com

Various Analysis Whitepapers– Array Support Page on Affymetrix.com

Sample Data Sets– Sample Data section under Support– Colon cancer data set with 10 paired samples– Tissue data set

11 tissues in triplicate 4 different mixture levels for 3 tissues Includes HG-U133 Plus 2.0 and Human Exon 1.0 ST

Analysis Software– Affymetrix Power Tools (APT)– ExACT


Recommended