+ All Categories
Home > Documents > Gener al Situ ation - Minister of Economy, Trade and … al Situ ation I. Survey T ables on E n...

Gener al Situ ation - Minister of Economy, Trade and … al Situ ation I. Survey T ables on E n...

Date post: 04-May-2018
Category:
Upload: doankien
View: 221 times
Download: 3 times
Share this document with a friend
75
General Situation I. Survey Tables on Enterprises The survey tables on enterprises observes activities of establishments engaged in manufacturing industry with 4 or more employees by replacing each establishment to enterprise unit to which the establishment belongs. 1. Enterprises holding an establishment with 4 or more employees The number of establishments engaged in manufacturing industry with 4 or more employees in 2002 was 290,848 (down 7.3% compared to the previous year). Replacing these establishments to enterprise unit, the number of enterprises was 265,120 (down 7.5% id.) (Table 1, Figure 1). (1) Number of enterprises (i) Looking at the number of enterprises (265,120) by legal status, the number of corporations was 218,466 (down 6.0% compared to the previous year), accounting for 82.4% of all enterprises. The number of associations and others was 2,239 (down 4.6% id.), accounting for 0.8% and that of individual enterprises was 44,415 (down 14.2% id.), accounting 16.8% (Table 1, Figure 1). Figure 1 Transition in the number of enterprises by legal status 60 70 80 90 100 110 1997 1998 1999 2000 2001 2002 Corporations Association and others Individual enterprises 1997 = 100 Table 1 Transition in the number of enterprises Total Corporations Associations and others Individual enterprises (Enterprises) Y/Y (%) (Enterprises) Y/Y (%) (Enterprises) Y/Y (%) (Enterprises) Y/Y (%) 1997 328,144 257,130 2,639 69,375 1998 343,018 -1.9 268,182 -1.7 2,790 -3.2 72,046 -2.3 1999 315,614 -8.0 252,108 -6.0 2,606 -6.6 60,900 -15.5 2000 312,341 -1.0 248,603 -1.4 2,568 -1.5 61,170 0.4 2001 288,802 -7.5 234,494 -5.7 2,407 -6.3 51,901 -15.2 2002 265,120 -7.5 218,466 -6.0 2,239 -4.6 44,415 -14.2 Note 1: The year-on-year comparison in 1997 is unidentified because of replacement of establishments with 4 or more employees to enterprise unit. Note 2: Because of the adjustment of establishments in the 1998 survey, the year-on-year comparison is based on a time series. Note 3: Because of the revision of the Japan Standard Industrial Classification in the 2002 survey, the year-on-year comparison is calculated by incorporating the classification of 2001 into that of 2002. 1
Transcript

General Situation I. Survey Tables on Enterprises The survey tables on enterprises observes activities of establishments engaged in manufacturing industry with 4 or more employees by replacing each establishment to enterprise unit to which the establishment belongs. 1. Enterprises holding an establishment with 4 or more employees The number of establishments engaged in manufacturing industry with 4 or more employees in 2002 was 290,848 (down 7.3% compared to the previous year). Replacing these establishments to enterprise unit, the number of enterprises was 265,120 (down 7.5% id.) (Table 1, Figure 1). (1) Number of enterprises

(i) Looking at the number of enterprises (265,120) by legal status, the number of corporations was 218,466 (down 6.0% compared to the previous year), accounting for 82.4% of all enterprises. The number of associations and others was 2,239 (down 4.6% id.), accounting for 0.8% and that of individual enterprises was 44,415 (down 14.2% id.), accounting 16.8% (Table 1, Figure 1).

Figure 1 Transition in the number of enterprises by legal status

60

70

80

90

100

110

1997 1998 1999 2000 2001 2002

CorporationsAssociation and othersIndividual enterprises

1997 = 100

Table 1 Transition in the number of enterprises

Total

Corporations Associations and others Individual enterprises (Enterprises) Y/Y (%) (Enterprises) Y/Y (%) (Enterprises) Y/Y (%) (Enterprises) Y/Y (%)

1997 328,144 … 257,130 … 2,639 … 69,375 …1998 343,018 -1.9 268,182 -1.7 2,790 -3.2 72,046 -2.31999 315,614 -8.0 252,108 -6.0 2,606 -6.6 60,900 -15.52000 312,341 -1.0 248,603 -1.4 2,568 -1.5 61,170 0.42001 288,802 -7.5 234,494 -5.7 2,407 -6.3 51,901 -15.22002 265,120 -7.5 218,466 -6.0 2,239 -4.6 44,415 -14.2

Note 1: The year-on-year comparison in 1997 is unidentified because of replacement of establishments with 4 or more employees to enterprise unit.

Note 2: Because of the adjustment of establishments in the 1998 survey, the year-on-year comparison is based on a time series. Note 3: Because of the revision of the Japan Standard Industrial Classification in the 2002 survey, the year-on-year comparison is calculated

by incorporating the classification of 2001 into that of 2002.

1

Furthermore, of all enterprises (265,120), the number of enterprises with 1 establishment was 248,482 (down 7.5% compared to the previous year), accounting for 93.7% which was the most of all enterprises. The number of enterprises with 2 or more establishments was 16,638 (down 6.3% id.), accounting for 6.3% (Table 2).

Table 2 Number of establishments and enterprises by legal status and size of capital

Number of establishments Total number of enterprises

Y/Y Composition ratio by organization Y/Y Composition ratio

by organizationBy legal status and size of capital

(%) (%) (%) (%) Total 290,848 -7.3 100.0 265,120 -7.5 100.0

Companies (total) 243,554 -6.0 83.7 218,466 -6.0 82.4Capital less than 10 million yen 79,414 -8.0 27.3 78,148 -8.0 29.5Capital 10 to less than 30 million yen 114,459 -5.9 39.4 106,756 -5.7 40.3Capital 30 to less than 50 million yen 18,171 -3.1 6.2 14,828 -2.6 5.6Capital 50 to less than 100 million yen 13,407 -1.8 4.6 9,788 -1.6 3.7Capital 100 to less than 300 million yen 5,952 -3.1 2.0 3,898 -1.8 1.5Capital 300 million to less than 1 billion yen 4,694 -0.5 1.6 2,610 -1.1 1.0Capital 1 to less than 10 billion yen 4,493 -2.2 1.5 1,893 -0.9 0.7Capital 10 billion yen or more 2,964 -4.8 1.0 545 -1.1 0.2

Associations and others 2,746 -4.8 0.9 2,239 -4.6 0.8Individual enterprises 44,548 -14.3 15.3 44,415 -14.2 16.8

Number of enterprises with 1 establishment Number of enterprises with 2 or more

establishments

Y/Y

Composition ratio by

organization

Composition ratio by

number of establishments

Y/Y Composition

ratio by organization

Composition ratio by

number of establishments

By legal status and size of capital

(%) (%) (%) (%) (%) (%) Total 248,482 -7.5 100.0 93.7 16,638 -6.3 100.0 6.3

Companies (total) 202,157 -6.0 81.4 92.5 16,309 -6.1 98.0 7.5Capital less than 10 million yen 76,995 -7.9 31.0 98.5 1,153 -13.0 6.9 1.5Capital 10 to less than 30 million yen 100,241 -5.5 40.3 93.9 6,515 -8.9 39.2 6.1Capital 30 to less than 50 million yen 12,323 -2.2 5.0 83.1 2,505 -4.9 15.1 16.9Capital 50 to less than 100 million yen 7,354 -1.4 3.0 75.1 2,434 -2.4 14.6 24.9Capital 100 to less than 300 million yen 2,691 -1.1 1.1 69.0 1,207 -3.5 7.3 31.0Capital 300 million to less than 1 billion yen 1,605 -1.7 0.6 61.5 1,005 -0.2 6.0 38.5Capital 1 to less than 10 billion yen 840 0.6 0.3 44.4 1,053 -2.0 6.3 55.6Capital 10 billion yen or more 108 -3.6 0.0 19.8 437 -0.5 2.6 80.2

Associations and others 2,038 -4.4 0.8 91.0 201 -6.5 1.2 9.0Individual enterprises 44,287 -14.2 17.8 99.7 128 -26.0 0.8 0.3Note 1: Because of the revision of the Japan Standard Industrial Classification in the 2002 survey, the year-on-year comparison is calculated

by incorporating the classification of 2001 into that of 2002. Note 2: Composition ratio by organization refers to composition ratio of enterprises by legal status and size of capital. Composition ratio by

number of enterprises refers to composition ratio of enterprises with 1 establishment or with 2 or more establishments.

2

(ii) Looking at corporations (218,466) by size of capital or investment (hereinafter referred to as “capital”) (Figure 2), enterprises with capital 10 to less than 30 million yen totaled 106,756 (composition ratio in corporations 48.9%), accounting for nearly the half, followed by 78,148 enterprises with capital less than 10 million yen (35.8% id.), 14,828 enterprises with capital 30 to less than 50 million yen (6.8% id.), 9,788 enterprises with capital 50 to less than 100 million yen (4.5% id.), 3,898 enterprises with capital 100 to less than 300 million yen (1.8% id.), 2,610 enterprises with capital 300 million to less than 1 billion yen (1.2% id.), 1,893 enterprises with capital 1 to less than 10 billion yen (0.9% id.) and 545 enterprises with capital 10 billion yen or more (0.2% id.). In the year-on-year comparison ratio

(iii) Observing the number of enterprise

he year-on-year comparison ratio in

35.8%

6.8%

48.9%

1.8%

0.9%

0.2%1.2%

4.5%Capital less than10 million yen

Capital 10 to lessthan 30 million

Capital 30 to lessthan 50 million yen

Capital 50 to lessthan 100 million

yen

Capital 100 to less than300 million yen

Capital 300 million to less than 1 billion yen

Capital 1 to less than10 billion yen

Capital 10 billion yen or more

Number ofcorporations

in 2002

218,466

Figure 2 Composition ratio of the number of corporations by size of capital

of the number of enterprises by size of capital, it decreased in all sizes. The smaller the size is, the higher the reduction rate is.

s(265,120) by size of employees (Figure 3), enterprises with less than 30 persons account for 84.5% of the total at 224,104. Enterprises with 30 to 99 persons take up 29,023 (composition ratio in all enterprises 10.9%), 100 to 299 persons 8,974 (3.4% id.), 300 to 999 persons 2,422 (0.9% id.) and 1,000 or more persons 597 (0.2% id.). Tthis number reduced in all size categories including enterprises with less than 30 persons (down 8.1% compared to the previous year), 30 to 99 persons (down 4.1% id.), 100 to 299 persons (down 3.7% id.), 300 to 999 persons (down 0.8% id.) and 1,000 or more persons (down 3.6% id.).

3.4%

0.9% 0.2%

10.9%

84.5%less than 30 persons

30 to 99 persons

100 to 299 persons1000 or more persons

Number of e

265,120

nterprises in2002

Figure 3 Composition ratio of the number of enterprises by size of employees

300 to 999 persons

3

(2) Number of employees

(i) The total number of employees was 8,323,589 (down 4.9% compared to the previous year). By legal status, that number in corporations was 7,969,060 (down 4.6% id.), accounting for 95.7%. Associations and others take up 0.8% at 64,565 (down 4.3% id.) and individual enterprises account for 3.5% (down 12.7% id.) at 289,964 (Table 3, Figure 4).

Figure 4 Transition in the number of employees by legal status

60

70

80

90

100

110

1997 1998 1999 2000 2001 2002

CorporationsAssociation and othersIndividual enterprises

1997 = 100

Table 3 Transition in the number of employees by legal status

Total Corporations Associations and others Individual (Persons) Y/Y (%) (Persons) Y/Y (%) (Persons) Y/Y (%) (Persons) Y/Y (%)

1997 9,937,330 … 9,419,653 … 77,342 … 440,335 …1998 9,837,464 -4.1 9,312,553 -4.0 76,852 -6.4 448,059 -5.71999 9,377,750 -4.7 8,917,429 -4.2 74,134 -3.5 386,187 -13.82000 9,183,833 -2.1 8,731,498 -2.1 73,530 -0.8 378,805 -1.92001 8,866,220 -3.5 8,462,528 -3.1 70,751 -3.8 332,941 -12.12002 8,323,589 -4.9 7,969,060 -4.6 64,565 -4.3 289,964 -12.7

Note 1: The year-on-year comparison in 1997 is unidentified because of replacement of establishments with 4 or more employees to enterprise unit.

Note 2: Because of the adjustment of establishments in the 1998 survey, the year-on-year comparison is based on a time series.

Note 3: Because of the revision of the Japan Standard Industrial Classification in the 2002 survey, the year-on-year comparison is calculated by incorporating the classification of 2001 into that of 2002.

Furthermore, the number of employees in enterprises with 1 establishment was 4,644,406 (composition ratio in all enterprises 55.8%), down 5.1% compared to the previous year and that number in enterprises with 2 or more establishments was 3,679,183 (44.2% id.), down 4.6% id., leading to a decline in both categories. Looking at the composition ratio by size of capital, most of corporations with capital less than 10 million yen have 1 establishment (composition ratio in all enterprises with capital less than 10 million yen 95.2%) and the ratio in corporations with capital more than 10 billion yen and have 2 or more establishments was 96.0%, which was extremely high (Table 4).

4

Table 4 Number of employees by legal status and size of capital

Total number of enterprises

Number of enterprises with 1

establishment Number of enterprises with 2 or

more establishments

Y/Y

Com

posi

tion

ratio

by

org

aniz

atio

n

Y/Y

Com

posi

tion

ratio

by

org

aniz

atio

n

Com

posi

tion

ratio

by

num

ber o

f es

tabl

ishm

ents

Y/Y

Com

posi

tion

ratio

by

org

aniz

atio

n

Com

posi

tion

ratio

by

num

ber o

f es

tabl

ishm

ents

By legal status and size of capital

(Persons) (%) (%) (Persons) (%) (%) (%) (Persons) (%) (%) (%)Total 8,323,589 -4.9 100.0 4,644,406 -5.1 100.0 55.8 3,679,183 -4.6 100.0 44.2

Companies (total) 7,969,060 -4.6 95.7 4,314,583 -4.6 92.9 54.1 3,654,477 -4.6 99.3 45.9Capital less than 10 million yen 761,031 -6.4 9.1 724,211 -6.2 15.6 95.2 36,820 -10.9 1.0 4.8Capital 10 to less than 30 million yen 2,190,575 -5.6 26.3 1,818,568 -5.1 39.2 83.0 372,007 -8.1 10.1 17.0Capital 30 to less than 50 million yen 744,048 -3.6 8.9 495,554 -2.9 10.7 66.6 248,494 -5.0 6.8 33.4Capital 50 to less than 100 million yen 844,341 -1.5 10.1 480,579 -1.6 10.3 56.9 363,762 -1.3 9.9 43.1Capital 100 to less than 300 million yen 540,760 -4.2 6.5 268,681 -1.9 5.8 49.7 272,079 -6.3 7.4 50.3Capital 300 million to less than 1 billion yen 594,082 -1.9 7.1 258,229 -5.5 5.6 43.5 335,853 1.1 9.1 56.5Capital 1 to less than 10 billion yen 861,012 -2.7 10.3 210,872 -5.5 4.5 24.5 650,140 -1.7 17.7 75.5Capital 10 billion yen or more 1,433,211 -6.6 17.2 57,889 -9.7 1.2 4.0 1,375,322 -6.4 37.4 96.0

Associations and others 64,565 -4.3 0.8 42,962 -3.1 0.9 66.5 21,603 -6.5 0.6 33.5Individual enterprises 289,964 -12.7 3.5 286,861 -12.6 6.2 98.9 3,103 -20.7 0.1 1.1Note 1: Because of the revision of the Japan Standard Industrial Classification in the 2002 survey, the year-on-year comparison is calculated

by incorporating the classification of 2001 into that of 2002. Note 2: Composition ratio by organization refers to composition ratio of enterprises by legal status and size of capital. Composition ratio by

number of enterprises refers to composition ratio of enterprises with 1 establishment or with 2 or more establishments.

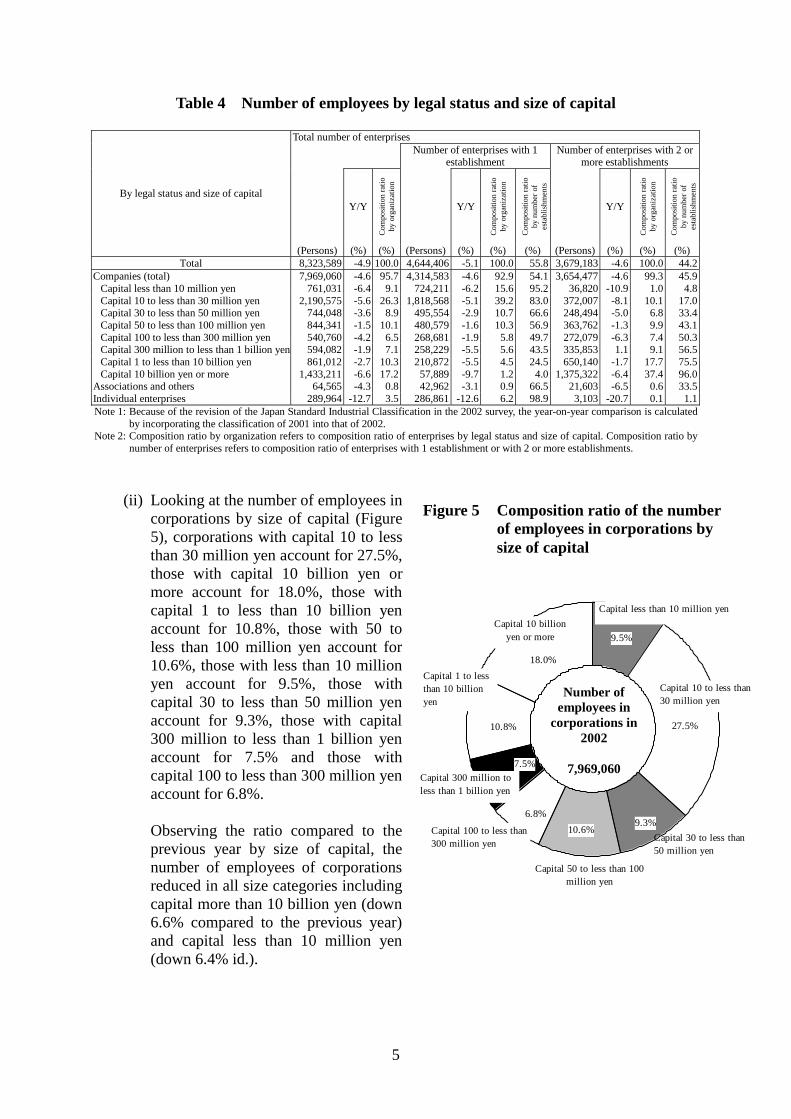
(ii) Looking at the number of employees in corporations by size of capital (Figure 5), corporations with capital 10 to less than 30 million yen account for 27.5%, those with capital 10 billion yen or more account for 18.0%, those with capital 1 to less than 10 billion yen account for 10.8%, those with 50 to less than 100 million yen account for 10.6%, those with less than 10 million yen account for 9.5%, those with capital 30 to less than 50 million yen account for 9.3%, those with capital 300 million to less than 1 billion yen account for 7.5% and those with capital 100 to less than 300 million yen account for 6.8%. Observing the ratio compared to the previous year by size of capital, the number of employees of corporations reduced in all size categories including capital more than 10 billion yen (down 6.6% compared to the previous year) and capital less than 10 million yen (down 6.4% id.).

9.5%

9.3%10.6%

7.5%

18.0%

10.8%

6.8%

27.5%

Capital less than 10 million yen

Capital 10 to less than30 million yen

Capital 30 to less than50 million yen

Capital 50 to less than 100million yen

Capital 100 to less than300 million yen

Capital 300 million toless than 1 billion yen

Capital 1 to lessthan 10 billionyen

Capital 10 billionyen or more

Figure 5 Composition ratio of the number of employees in corporations by size of capital

Number of employees in

corporations in 2002

7,969,060

5

(iii) Observing the number of employees (8,323,589) by size of employees (Figure 6), it was 2,293,755 in enterprises with less than 30 persons, which accounts for 27.6%, 1,546,002 in enterprises with 30 to 99 persons (composition ratio in all enterprises 18.6%), 1,452,611 in those with 100 to 299 persons (17.5% id.), 1,198,622 in those of 300 to 999 persons (14.4% id.) and 1,832,599 in those with more than 1,000 persons (22.0% id.). In the year-on-year comparison ratio, the number of employees by size of employees decreased in all size categories including less than 30 persons (down 6.9% compared to the previous year), 30 to 99 persons (down 4.0% id.), 100 to 299 persons (down 3.9% id.), 300 to 999 persons (down 1.5% id.) and more than 1,000 persons (down 7.5% id.).

27.6%

18.6%

22.0%

14.4%

17.5%

Less than 30persons

30 to 99persons

100 to 299persons

300 to 999persons

1000 or morepersons

Number of employees in

2002

8,323,589 persons

Figure 6 Composition ratio of the number of employees by size of employees

(3) Value of manufactured goods shipments

(i) The value of manufactured goods shipments (hereinafter referred to as “value of shipment”) was 269.3618 trillion yen (down 4.4% compared to the previous year). By legal status, the value of shipment was 266.5095 trillion yen (down 4.4% id.) in corporations which accounts for 98.9% of the total, 1.2872 trillion yen (down 7.5% id.) in associations and others which accounts for 0.5% and 1.5651 trillion yen (down 13.4% id.) which accounts for 0.6% (Table 5, Figure 7).

Figure 7 Transition in value of shipment by legal status

50

60

70

80

90

100

110

1997 1998 1999 2000 2001 2002

CorporationsAssociation and othersIndividual enterprises

1997 = 100

6

Table 5 Transition in value of shipment by legal status

Total Corporations Associations and others Individual (Mill. yen) Y/Y (Mill. yen) Y/Y (Mill. yen) Y/Y (Mill. yen) Y/Y

1997 323,071,831 … 318,458,355 … 1,817,608 … 2,795,868 …1998 305,839,992 -7.0 301,421,619 -6.9 1,777,123 -7.3 2,641,250 -11.41999 291,449,554 -4.7 287,455,033 -4.6 1,755,544 -1.2 2,238,978 -15.22000 300,477,604 3.1 296,665,371 3.2 1,641,850 -6.5 2,170,383 -3.12001 286,667,406 -4.6 283,312,536 -4.5 1,542,973 -6.0 1,811,897 -16.52002 269,361,805 -4.4 266,509,502 -4.4 1,287,194 -7.5 1,565,110 -13.4

Note 1: The year-on-year comparison in 1997 is unidentified because of replacement of establishments with 4 or more employees to enterprise unit.

Note 2: Because of the adjustment of establishments in the 1998 survey, the year-on-year comparison is based on a time series.

Note 3: Because of the revision of the Japan Standard Industrial Classification in the 2002 survey, the year-on-year comparison is calculated by incorporating the classification of 2001 into that of 2002.

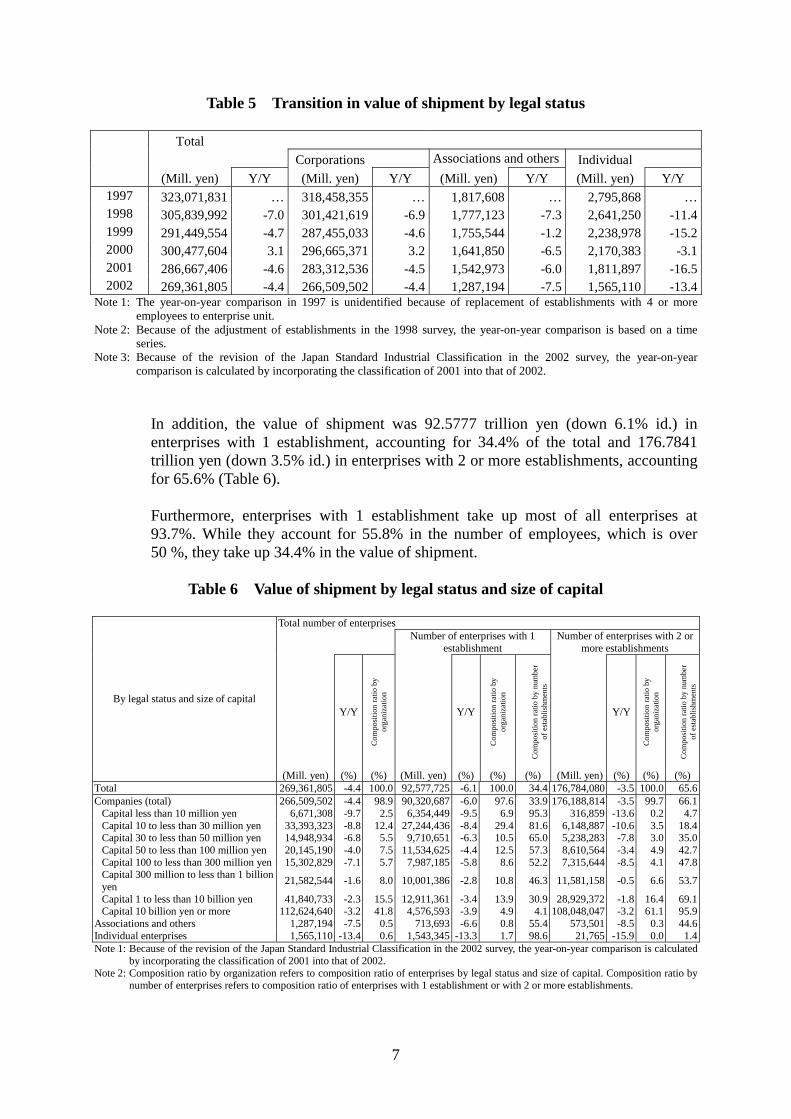
In addition, the value of shipment was 92.5777 trillion yen (down 6.1% id.) in enterprises with 1 establishment, accounting for 34.4% of the total and 176.7841 trillion yen (down 3.5% id.) in enterprises with 2 or more establishments, accounting for 65.6% (Table 6). Furthermore, enterprises with 1 establishment take up most of all enterprises at 93.7%. While they account for 55.8% in the number of employees, which is over 50 %, they take up 34.4% in the value of shipment.

Table 6 Value of shipment by legal status and size of capital

Total number of enterprises

Number of enterprises with 1

establishment Number of enterprises with 2 or

more establishments

Y/Y

Com

posi

tion

ratio

by

orga

niza

tion

Y/Y

Com

posi

tion

ratio

by

orga

niza

tion

Com

posi

tion

ratio

by

num

ber

of e

stab

lishm

ents

Y/Y

Com

posi

tion

ratio

by

orga

niza

tion

Com

posi

tion

ratio

by

num

ber

of e

stab

lishm

ents

By legal status and size of capital

(Mill. yen) (%) (%) (Mill. yen) (%) (%) (%) (Mill. yen) (%) (%) (%)Total 269,361,805 -4.4 100.0 92,577,725 -6.1 100.0 34.4 176,784,080 -3.5 100.0 65.6Companies (total) 266,509,502 -4.4 98.9 90,320,687 -6.0 97.6 33.9 176,188,814 -3.5 99.7 66.1

Capital less than 10 million yen 6,671,308 -9.7 2.5 6,354,449 -9.5 6.9 95.3 316,859 -13.6 0.2 4.7Capital 10 to less than 30 million yen 33,393,323 -8.8 12.4 27,244,436 -8.4 29.4 81.6 6,148,887 -10.6 3.5 18.4Capital 30 to less than 50 million yen 14,948,934 -6.8 5.5 9,710,651 -6.3 10.5 65.0 5,238,283 -7.8 3.0 35.0Capital 50 to less than 100 million yen 20,145,190 -4.0 7.5 11,534,625 -4.4 12.5 57.3 8,610,564 -3.4 4.9 42.7Capital 100 to less than 300 million yen 15,302,829 -7.1 5.7 7,987,185 -5.8 8.6 52.2 7,315,644 -8.5 4.1 47.8Capital 300 million to less than 1 billion yen 21,582,544 -1.6 8.0 10,001,386 -2.8 10.8 46.3 11,581,158 -0.5 6.6 53.7

Capital 1 to less than 10 billion yen 41,840,733 -2.3 15.5 12,911,361 -3.4 13.9 30.9 28,929,372 -1.8 16.4 69.1Capital 10 billion yen or more 112,624,640 -3.2 41.8 4,576,593 -3.9 4.9 4.1 108,048,047 -3.2 61.1 95.9

Associations and others 1,287,194 -7.5 0.5 713,693 -6.6 0.8 55.4 573,501 -8.5 0.3 44.6Individual enterprises 1,565,110 -13.4 0.6 1,543,345 -13.3 1.7 98.6 21,765 -15.9 0.0 1.4Note 1: Because of the revision of the Japan Standard Industrial Classification in the 2002 survey, the year-on-year comparison is calculated

by incorporating the classification of 2001 into that of 2002. Note 2: Composition ratio by organization refers to composition ratio of enterprises by legal status and size of capital. Composition ratio by

number of enterprises refers to composition ratio of enterprises with 1 establishment or with 2 or more establishments.

7

(ii) By size of capital, the value of shipment of corporations (Table 6, Figure 8) was 112.6246 trillion yen, accounting for 42.3% in corporations with capital more than 10 billion yen, 41.8407 trillion yen in corporations with capital 1 to less than 10 billion yen (composition ratio in corporations 15.7%), 33.3933 trillion yen in those with capital 10 to less than 30 million yen (12.5% id.), 21.5825 trillion yen in those with capital 300 million to less than 1 billion yen (8.1% id.), 20.1452 trillion yen in those with capital 50 to less than 100 million yen (7.6% id.), 15.3028 trillion yen in those with capital 100 to less than 300 million yen (5.7% id.), 14.9489 trillion yen in those with capital 30 to less than 50 million yen (5.6% id.) and 6.6713 trillion yen in those with capital less than 10 million yen (2.5% id.).

Figure 8 Composition ratio of value of shipment in corporations by size of capital

2.5%

5.6%

7.6%

8.1%

42.3%

15.7%

5.7%

12.5%

Capital less than 10 million yen

Capital 10 to less than30 million yen

Capital 30 to less than50 million yen

Capital 50 to less than100 million yen

Capital 100 to less than300 million yen

Capital 300 million toless than 1 billion yenCapital 1 to less than

10 billion

Capital 10 billionyen or more

Value of shipment of

corporations in 2002

266.5095 trillion yen

Looking at the year-on-year comparison ratio of value of shipment in corporations, it decreased in all size categories including capital less than 10 million yen, which was down 9.7%.

(iii) In the value of shipment (269.3618

trillion yen) by size of employees (Figure 9), enterprises with 1,000 or more persons account for 45.2% at 121.8228 trillion yen, followed by 300 to 999 persons at 47.6502 trillion yen (composition ratio in the number of enterprises 17.7%), 100 to 299 persons for 38.7367 trillion yen (14.4% id.), 30 to 99 persons for 31.8826 trillion yen (11.8% id.), less than 30 persons for 29.2696 trillion yen (10.9% id.). By ratio compared to the previous year, the value of shipment by size of employees reduced in all size categories including enterprises with less than 30 persons (down 9.3% compared to the previous year), 30 to 99 persons (down 5.6% id.), 100 to 299 persons (down 5.8% id.), 300 to 999 persons (down 1.3% id.), 1,000 or more persons (down 4.8% id.).

14.4%

10.9%

11.8%

45.2%

17.7%

Less than 30 persons

30 to 99persons

100 to 299persons

300 to 999persons

1000 or morepersons

Value of shipment in

2002

269.3618 trillion yen

Figure 9 Composition ratio of value of shipment by size of employees

8

(4) Number of employees per enterprise

(i) The number of employees per enterprise was 31 (flat compared to the previous year). By legal status, that number in corporation was 36 (flat id.). The number in corporations with capital 10 billion yen or more was particularly huge, which was 2,630 (down 154 persons id.). Associations and others have 29 persons per enterprise (flat id.) and individual enterprises have 7 persons per enterprise (down 1 person id.) (Table 7).

(ii) The number of employees per enterprise with 1 establishment increased by 1 person

compared to the previous year to 19. By legal status, the number was 21 in corporations (flat compared to the previous year). The corporations with capital 10 billion yen or more (536 persons, down 36 persons id.) and with capital 1 to 10 billion yen (251 persons, down 16 persons id.) significantly reduced the number. Those corporations have huge capital. The number in associations and others and individual enterprises was 21 persons (flat id.) and 6 persons (flat id.) respectively. The number of employees per enterprise with 2 or more establishments was 221 (up 4 persons compared to the previous year). By legal status, corporations increased the number to 224 (up 4 persons id.). Of which, the corporations with capital 10 billion yen or more (3,147 persons, down 201 persons id.) significantly reduced the number. The number in associations and others and individual enterprises was 107 (flat id.) and 24 (up 1 person id.).

Table 7 Number of employees per enterprise by legal status and size of capital

Number of

employees per enterprise

Number of employees per

enterprise with 1 establishment

Number of employees per

enterprise with 2 or more establishments

By legal status and size of capital

(Persons)

Y/Y (%) (Persons)

Y/Y (%) (Persons)

Y/Y (%)

Total 31 0 19 1 221 4Companies (total) 36 0 21 0 224 4

Capital less than 10 million yen 10 0 9 0 32 1Capital 10 to less than 30 million yen 21 0 18 0 57 0Capital 30 to less than 50 million yen 50 -1 40 -1 99 0Capital 50 to less than 100 million yen 86 0 65 0 149 1Capital 100 to less than 300 million yen 139 -3 100 -1 225 -7Capital 300 million to less than 1 billion yen 228 -1 161 -6 334 4Capital 1 to less than 10 billion yen 455 -8 251 -16 617 2Capital 10 billion yen or more 2,630 -154 536 -36 3,147 -201

Associations and others 29 0 21 0 107 0Individual enterprises 7 1 6 0 24 1Note 1: Because of the revision of the Japan Standard Industrial Classification in the 2002 survey, the year-on-year comparison is calculated

by incorporating the classification of 2001 into that of 2002.

9

(5) Value of shipment per enterprise

(i) The value of shipment per enterprise was 1.016 billion yen (up 3.3% compared to the previous year). By legal status, that of corporations was 1.21991 billion yen. Of which, corporations with capital 10 billion yen or more show prominence at 206.65072 billion yen, followed by corporations with capital 1 to less than 10 billion yen at 22.1287 billion yen and those with capital 300 million to less than 1 billion yen at 8.26917 billion yen. The shipment of value in associations and others and individual enterprises was 574.9 million yen and 35.24 million yen respectively (Table 8).

(ii) The value of shipment per enterprise with 1 establishment was 372.57 million yen.

By legal status, that in corporations was 446.78 million yen. Of which, the value in corporations with capital 10 billion yen or more was 42.37586 billion yen and that in those with capital 1 to less than 10 billion yen was 15.37067 billion yen. In addition, the value in associations and others and individual enterprises was 350.19 million yen and 34.85 million yen respectively. The value of shipment per enterprise with 2 or more establishments was 10.62532 billion yen. By legal status, the value in corporations was 10.8316 billion yen. Of which, corporations with capital 10 billion yen or more show prominence at 247.24954 billion yen. The value of shipment in associations and others and individual enterprises was 2.85324 billion yen and 170.04 million yen respectively.

Table 8 Value of shipment per enterprise by legal status and size of capital

Value of shipment

per enterprise Value of shipment per enterprise with

1 establishment

Value of shipment per enterprise with 2

or more establishments

Y/Y Y/Y Y/Y

By legal status and size of capital

(10000 yen) (%) (10000 yen) (%) (10000 yen) (%) Total 101,600 3.3 37,257 1.5 1,062,532 3.0Companies (total) 121,991 1.7 44,678 0.0 1,080,316 2.8

Capital less than 10 million yen 8,537 -1.9 8,253 -1.7 27,481 -0.7Capital 10 to less than 30 million yen 31,280 -3.3 27,179 -3.1 94,380 -1.9Capital 30 to less than 50 million yen 100,816 -4.3 78,801 -4.2 209,113 -3.1Capital 50 to less than 100 million yen 205,815 -2.4 156,848 -3.1 353,762 -1.0Capital 100 to less than 300 million yen 392,582 -5.4 296,811 -4.8 606,101 -5.2Capital 300 million to less than 1 billion yen 826,917 -0.4 623,139 -1.1 1,152,354 -0.3Capital 1 to less than 10 billion yen 2,210,287 -1.4 1,537,067 -4.0 2,747,329 0.3Capital 10 billion yen or more 20,665,072 -2.2 4,237,586 -0.4 24,724,954 -2.8

Associations and others 57,490 -3.1 35,019 -2.4 285,324 -2.2Individual enterprises 3,524 1.0 3,485 1.0 17,004 13.6Note 1: Because of the revision of the Japan Standard Industrial Classification in the 2002 survey, the year-on-year comparison is calculated

by incorporating the classification of 2001 into that of 2002.

10

(6) Situation by large enterprise and medium and small sized enterprise

Observing enterprises by large enterprise and medium and small sized enterprise Note (Table 9, Figure 10), the number was 4,676 (composition ratio 1.8%) in large enterprises and 260,444 (98.2% id.) in medium and small sized enterprises that comprise most of enterprises. The number of employees was 2,824,012 (33.9% id.) in large enterprises and 5,499,577 (66.1% id.) in medium and small sized enterprises that comprise nearly two third. The value of shipment was 173.8964 trillion yen (64.6% id.) in large enterprises and 95.4654 trillion yen (35.4% id.) in medium and small sized enterprises and large enterprises account for nearly two third.

Figure 10 Composition ratio by large enterprise and medium and

small sized enterprise (2002)

64.6 35.4

33.9 66.1

1.8 98.2

0 20 40 60 80 100

Number ofenterprises

Number ofemployees

Value of shipment

(%)

Large enterprises Medium and small sized enterprises

Table 9 Composition ratio by large enterprise and medium and small sized enterprise

(2002) (Unit: Enterprises, persons, million yen)

Total

Large enterprises Medium and small sized

enterprises

Composition

ratio (%) Composition

ratio (%) Number of enterprises 265,120 4,676 1.8 260,444 98.2

Number of employees 8,323,589 2,824,012 33.9 5,499,577 66.1

Value of shipment 269,361,805 173,896,402 64.6 95,465,403 35.4 Note: The definition of a large enterprise and a medium and small sized enterprise is as follows:

Large enterprise: Enterprise with capital more than 300 million yen and number of employees more than 300 persons in “Corporation”, enterprise with more than 300 persons in “Associations and others” and “Individual enterprises” Medium and small sized enterprise: Enterprise with capital 300 million yen or less and number of employees 300 persons or less in “Corporation”, enterprise with 300 persons or less in “Associations and others” and “Individual enterprises”

11

II. Survey Tables on Establishments The survey tables on establishments are about the activities of establishments engaged in manufacturing industry with 4 or more employees, analyzing them by legal status and size of capital. 1. Number of establishments (1) The number of establishments engaged in manufacturing industry with 4 or more

employees in 2002 was 290,848 (down 7.3% compared to the previous year). By legal status (Figure 11), the number was 243,554 (down 6.0% id.) in corporations which account for 83.7% of the total, 2,746 (down 4.8% id.) in associations and other which account for 0.9% and 44,548 (down 14.3% id.) in individual enterprises which account for 15.3%. The characteristics that the number of establishments of each legal status by industry (Figure 12) show that the ratio of establishments in corporations was high in all industries. In particular, in “chemical and allied products” (composition ratio 96.8%), “iron and steel” (94.2% id.), “petroleum and coal products” (92.1% id.), “general machinery” (92.0% id.) and “information and communication electronics equipment” (91.3% id.), more than 90% of establishments are corporations. In individual enterprises, “leather tanning, leather products and fur skins” (40.2% id.), “apparel and other finished products” (28.4% id.), “furniture and fixtures” (25.7% id.) and “textile mill products” (25.2% id.) have relatively high ratio.

Figure 11 Composition ratio of the number of establishments by legal status

0.9%

83.7%

15.3%

Corporations

Associationand others

Individualenterprises

Number of establishments

in 2002

290,848

12

Figure 12 Composition ratio of establishments of each legal status by industry

Corporations Average in manufacturing 83.7%

0

20

40

60

80

100

TotalFoo

d

Beverag

eFibe

r

Clothing

Woo

d

Furnitu

rePap

er

Printin

g

Chemica

ls

Petroleu

mPlas

tic

Rubber

Leather

Ceramics

Iron &

Steel

Non-ferr

ous Meta

lsMeta

ls

Genera

l

Electr i

c

Informa tio

n & Communic

ation

Electro

nic par

ts & devi

ces

Transpo

rtatio

n

Precisi

onOthers

(%)

Associations and others Average in manufacturing 0.9%

0

5

10

Total

Food

Beverag

eFibe

r

Clothin

gWood

Furnitu

rePape

r

Printin

g

Chemica

ls

Petrole

umPlas

tic

Rubber

Leather

Ceramics

Iron &

Steel

Non-fe

rrous

Metals

Metals

General

Electric

Inform

ation

& Com

munica

tion

Electro

nic pa

rts &

devic

es

Transpo

rtatio

n

Precisio

nOthe

rs

(%)

Individual enterprises Average in manufacturing 15.3%

0

10

20

30

40

50

TotalFoo

d

Beverag

eFibe

r

Clothing

Woo

d

Furnitu

rePap

er

Printin

g

Chemica

ls

Petroleu

mPlas

tic

Rubber

Leather

Ceramics

Iron &

Steel

Non-ferr

ous Meta

lsMeta

ls

Genera

l

Electr i

c

Informa tio

n & Communic

a tion

Electro

nic par

ts & devi

ces

Transpo

rtatio

n

Precisi

onOthers

(%)

13

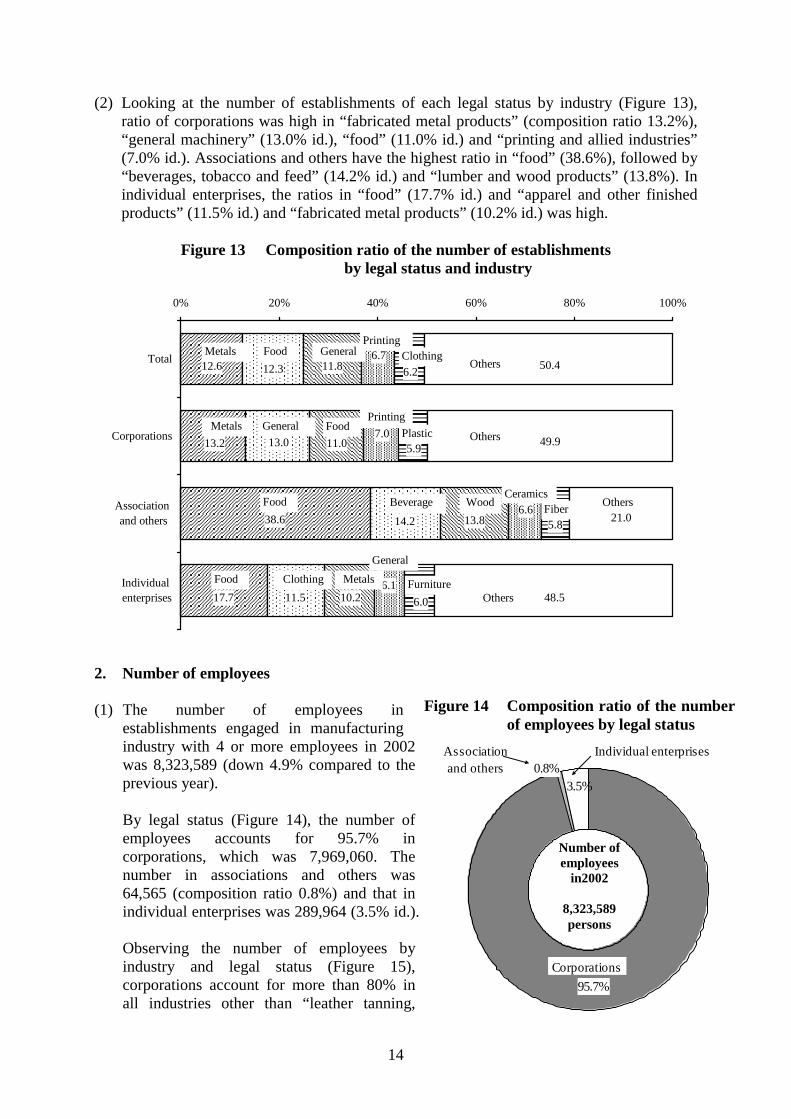
(2) Looking at the number of establishments of each legal status by industry (Figure 13), ratio of corporations was high in “fabricated metal products” (composition ratio 13.2%), “general machinery” (13.0% id.), “food” (11.0% id.) and “printing and allied industries” (7.0% id.). Associations and others have the highest ratio in “food” (38.6%), followed by “beverages, tobacco and feed” (14.2% id.) and “lumber and wood products” (13.8%). In individual enterprises, the ratios in “food” (17.7% id.) and “apparel and other finished products” (11.5% id.) and “fabricated metal products” (10.2% id.) was high.

Figure 13 Composition ratio of the number of establishments

by legal status and industry

17.7

38.6

13.2

12.6

11.5

14.2

13.0

12.3

10.2

13.8

11.0

11.8

6.1

6.6

7.0

6.7

6.0

5.8

5.9

6.2

48.5

21.0

49.9

50.4

0% 20% 40% 60% 80% 100%

Total

Corporations

Association and others

Individual enterprises

GeneralMetals FoodPrinting

ClothingOthers

Others

Others

Others

Metals General FoodPrinting

Plastic

Food Beverage WoodCeramics

Fiber

Food Clothing Metals Furniture

General

2. Number of employees (1) The number of employees in

establishments engaged in manufacturing industry with 4 or more employees in 2002 was 8,323,589 (down 4.9% compared to thep By legal status (Figure 14), the number of employees accounts for 95.7% in corporations, which was 7,969,060. The number in associations and others was 64,565 (composition ratio 0.8%) and that in in Observing the number of employees by industry and legal status (Figure 15), corporations account for more than 80% in all industries other than “leather tanning,

0.8%3.5%

95.7%Corporations

Associationand others

Individual enterprises

revious year).

dividual enterprises was 289,964 (3.5% id.).

Number of employees

in2002

8,323,589 persons

Figure 14 Composition ratio of the number of employees by legal status

14

leather products and fur skins”. A form of corporation was taken by most industries including “iron and steel” (99.1% id.), “information and communication electronics equipment” (98.9% id.), “transportation equipment” (98.8% id.), “general machinery” (98.3% id.), “electrical machinery, equipment and supplies” (98.0% id.), “precision instruments and machinery” (97.9% id.), “petroleum and coal products” (97.6% id.), “chemical and allied products” (97.5% id.) and “non-ferrous metals and products” (97.3% id.).

Figure 15 Composition ratio of the num of each legal status by industry

Average in manufacturing 95.7%

ber of employees

Corporations

020406080

100

TotalFoo

d

Beverag

eFibe

r

Clothing

Woo

d

Furnitu

rePap

er

Printin

g

Chemica

ls

Petroleu

mPlas

tic

Rubber

Leather

Ceramics

Iron &

Ste el

Non-ferr

ous Meta

lsMeta

ls

Genera

l

Electr i

c

Informa tio

n & Communic

ation

Electro

nic par

ts & devi

ces

Transpo

rtatio

n

Precisi

onOthers

(%)

Associations and others Average in manufacturing 0.8%

0

5

10

Total

Food

Bevera

geFibe

r

Clothin

gWoo

d

Furnitu

rePap

er

Printin

g

Chemica

ls

Petrole

umPlas

tic

Rubbe

r

Leathe

r

Ceramics

Iron &

Steel

Non-fe

rrous

Metals

Metals

Genera

l

Electric

Inform

ation

& Com

munica

tion

Electro

nic pa

rts &

devic

es

Transpo

rtatio

n

Precisi

onOthe

rs

(%)

※ ※※

Individual enterprises Average in manufacturing 3.5%

0

10

20

30

40

50

Total

Food

Beverag

eFiber

Clothin

gW

ood

Furnitu

rePape

r

Printin

g

Chemica

ls

Petrole

umPlas

tic

Rubber

Leathe

r

Ceramics

Iron &

Steel

Non-fe

rrous

Metals

Metals

Genera

l

Electric

Inform

ation

& Com

munica

tion

Electro

nic pa

rts &

devic

es

Transpo

rtatio

n

Precisi

onOthe

rs

(%)

※ ※ ※

Note: The ratios with the mark * are not shown because of secrecy of data.

15

(2) Looking at the number of employees in each legal status by industry (Figure 16), the ratio of corporation was high in “food” (composition ratio 13.2%), “general machinery” (11.6% id.), “transportation equipment” (10.6% id.), “fabricated metal products” (8.0% id.) and “electrical machinery, equipment and supplies” (7.4% id.). In associations and others, the ratio in “food” (44.9% id.) is extremely high, followed by “chemical and allied products” (13.1% id.), “beverages, tobacco and feed” (9.3% id.) and “lumber and wood products” (8.0% id.). The ratio in individual enterprises was high in “food” (19.4% id.), “apparel and other finished products” (12.3% id.), “fabricated metal products” (9.3% id.) and “plastic products” (5.7% id.).

Figure 16 Composition ratio of the number of employees by legal status and industry

19.4

44.9

13.2

13.7

12.3

13.1

11.6

11.3

9.3

9.3

10.6

10.3

5.7

8.0

8.0

8.0

5.5

4.2

7.4

7.2

47.8

20.5

49.2

49.5

0% 10% 20% 30% 40% 50% 60% 70% 80% 90% 100%

Total

Corporations

Association and others

Individual enterprises

Food ElectricGeneral Trans-portation

MetalsOthers

Others

Others

Others

ElectricFood GeneralTrans-portation Metals

Food Chemicals BeverageCeramic

Wood木材

Food ClothingMetals

GeneralPlastic

3. Value of shipment

Figure 17 Composition ratio of value of shipment by legal status

(1) The value of shipment of establishments engaged in manufacturing industry with 4 or more employees in 2002 was 269.3618 trillion yen (down 4.4% compared to the previous year). By legal status (Figure 17), the value of shipment was 266.5095 trillion yen which accounts for 98.9% in establishments of corporations, 1.2872 trillion yen (composition ratio 0.5%) in associations and other and 1.5651 trillion yen (0.6% id.) in individual enterprises. By industry and legal status (Figure 18), the value of shipment in corporations exceeds 90% in all industries.

98.9%

0.5% 0.6%

Corporations

Association andothers

Individualenterprises

Value of shipment in

2002 269.3618

trillion yen

16

Figure 18 Composition ratio of value of shipment by legal status and industry Corporations Average in manufacturing 98.9%

80

85

90

95

100

TotalFoo

d

Beverag

eFibe

r

Clothing

Woo

d

Furnitu

rePap

er

Printin

g

Chemica

ls

Petroleu

mPlas

tic

Rubber

Leather

Ceramics

Iron &

Ste el

Non-ferr

ous Meta

lsMeta

ls

Genera

l

Electri

c

Informa tio

n & Communic

a tion

Electro

nic par

ts & devi

ces

Transpo

rtatio

n

Precisi

onOthers

(%)

Associations and others Average in manufacturing 0.5%

0

5

10

Total

Food

Bevera

geFibe

r

Clothin

gW

ood

Furnitu

rePape

r

Printin

g

Chemica

ls

Petrole

umPlas

tic

Rubbe

r

Leather

Ceramics

Iron &

Steel

Non-fe

rrous

Metals

Metals

Genera

l

Electric

Inform

ation

& C

ommun

icatio

n

Electro

nic pa

rts &

devic

es

Transpo

rtatio

n

Precisio

nOthe

rs

(%)

※※ ※

Individual enterprises Average in manufacturing 0.6%

0

10

20

30

40

50

Total

Food

Bevera

geFib

er

Clothin

gW

ood

Furnitu

rePap

er

Printin

g

Chemica

ls

Petrole

umPla

stic

Rubbe

r

Leathe

r

Ceramics

Iron &

Steel

Non-fe

rrous

Metals

Metals

Genera

l

Electric

Inform

ation

& Com

munica

tion

Electro

nic pa

rts &

devic

es

Transpo

rtatio

n

Precisi

onOthe

rs

(%)

※ ※※

Note: The ratios with the mark * are not shown because of secrecy of data.

17

(2) Observing the value of shipment in each legal status by industry (Figure 19), the industries with corporations holding high ratio are “transportation equipment” (composition ratio 18.0%), “general machinery” (9.5% id.), “chemical and allied products” (8.5% id.) and “food” (8.3% id.). In associations and others, “food” (48.8% id.) accounts for nearly 50%. “Chemical and allied products” (14.1% id.) and “beverages, tobacco and feed” (13.5% id.) follow that. The industries with individual enterprises holding high ratio are “food” (19.5% id.), “fabricated metal products” (11.2% id.) and “apparel and other finished products” (7.6% id.).

Figure 19 Composition ratio of the number of employees by industry and legal status

17.8

18.0

48.8

19.5

9.5

9.5

14.1

11.2

8.5

8.5

13.5

7.6

8.4

8.3

5.5

6.4

6.6

6.7

3.0

6.0

49.2

49.0

15.1

49.3

0% 10% 20% 30% 40% 50% 60% 70% 80% 90% 100%

Total

Corporations

Association and others

Individual enterprises

GeneralTransportation Food Chemicals Others

Others

Others

Others

ChemicalGeneral Food ElectriTransportation

Food Beverage WoodChemicalsCeramic

FoodClothing

MetalsGenera

Furniture

Electric

4. By prefecture (1) Number of establishments

Looking at the number of establishments by legal status (Table 10),

(i) The order of prefectures holding many establishments in corporations (Figure 20) is Tokyo (21,422), Osaka (21,373), Aichi (20,605), Saitama (14,790), Shizuoka (11,435) and Kanagawa (11,163). By prefecture and industry, all prefectures show high ratio in “food”, “fabricated metal products” and “general machinery”. Observing the number compared to the previous year, it decreased in all prefectures including Tokyo (down 9.3% compared to the previous year), Fukui (down 7.3% id.), Tokushima (down 7.1% id.) and Kanagawa and Osaka (both down 7.0% id.).

18

Figure 20 Number of establishments in corporation by prefecture

0

1

2

3Number of establishments in corporation

(10,000 establishments)

-10

-8

-6

-4

-2

0

Hok

kaid

o

Aom

ori

Iwat

e

Miy

agi

Aki

taY

amag

ata

Fuku

shim

a

Ibar

aki

Toch

igi

Gun

ma

Saita

ma

Chib

a

Toky

oK

anag

awa

Niig

ata

Toya

ma

Ishi

kaw

a

Fuku

iY

aman

ashi

Nag

ano

Gifu

Shiz

uoka

Aic

hi

Mie

Shig

a

Kyo

to

Osa

ka

Hyo

go

Nar

aW

akay

ama

Totto

riSh

iman

eO

kaya

ma

Hiro

shim

aY

amag

uchi

Toku

shim

aK

agaw

a

Ehim

e

Koc

hiFu

kuok

a

Saga

Nag

asak

iK

umam

oto

Oita

Miy

azak

iK

agos

him

aO

kina

wa

Y/Y

National average -6.0%

(%)

Note: Because of the revision of the Japan Standard Industrial Classification in the 2002 survey, the year-on-year

comparison is calculated by incorporating the classification of 2001 into that of 2002.

(ii) The number of the establishments in associations and others (Figure 21) was the highest in Kyoto (249), followed by Hokkaido (204), Shizuoka (159), Kagoshima (103) and Gifu (96). By prefecture, Kyoto has the highest ratio in “textile mill products”, “ceramic, stone and clay products” and “food”, Hokkaido in “food”, “lumber and wood products” and “beverages, tobacco and feed”, Shizuoka in “beverages, tobacco and feed”, “food”, “lumber and wood products”, Kagoshima in “food” and “beverages, tobacco and feed” and Gifu in “food”, “ceramic, stone and clay products” and “lumber and wood products”. Incidentally, the ratio in “food” was relatively high in all prefectures. In the year-on-year comparison ratio, the number was down in 40 prefectures such as Tokushima (down 24.2% compared to the previous year), Chiba (down 20.6% id.), Akita (down 17.0% id.), Kanagawa (down 16.7% id.), Tokyo (down 15.9% id.), Saitama (down 13.6% id.) and Iwate (down 13.5% id.).

19

Figure 21 Number of establishments in associations and others by prefecture

0

100

200

300Number of establishments inassociations and others

(Establishments)

-40

-30

-20

-10

0

10

Hok

kaid

oA

omor

i

Iwat

e

Miy

agi

Aki

taY

amag

ata

Fuku

shim

a

Ibar

aki

Toch

igi

Gun

ma

Saita

ma

Chi

ba

Toky

oK

anag

awa

Niig

a ta

Toya

ma

Ishi

kaw

a

Fuku

iY

aman

ashi

Nag

ano

Gifu

Shiz

uoka

Aic

hi

Mie

Shig

a

Kyo

to

Osa

ka

Hyo

go

Nar

aW

akay

ama

Totto

riSh

iman

eO

kaya

ma

Hiro

shim

aY

amag

uchi

Toku

shim

aK

agaw

a

Ehim

e

Koc

hiFu

kuok

a

Saga

Nag

asak

iK

umam

oto

Oita

Miy

azak

iK

agos

him

aO

kina

wa

Y/Y

National average -4.8%

(%)

Note: Because of the revision of the Japan Standard Industrial Classification in the 2002 survey, the year-on-year

comparison is calculated by incorporating the classification of 2001 into that of 2002.

(iii) In individual establishments (Figure 22), the order of prefectures with many establishments is Osaka (5,502), Aichi (3,533), Hyogo (3,120), Gifu (2,277), Shizuoka (2,136), Tokyo (1,592), Saitama (1,435), Fukuoka (1,349) and Ibaraki (1,200). By prefecture, Osaka has the highest ratio in “fabricated metal products” and “apparel and other finished products”, Aichi in “fabricated metal products”, “apparel and other finished products” and “textile mill products”, Hyogo in “food”, “leather tanning, leather products and fur skins” and “fabricated metal products”, Gifu in “apparel and other finished products” and “ceramic, stone and clay products”, Shizuoka in “food”, “transportation equipment” and “fabricated metal products”, Tokyo in “printing and allied industries”, “fabricated metal products” and “apparel and other finished products” and Saitama in “apparel and other finished products” and “fabricated metal products”. The ratio of individual establishments in “food”, “apparel and other finished products” and “fabricated metal products” was relatively high in most prefectures. In the year-on-year comparison ratio, the number declined in all prefectures including Tokyo (down 22.9% compared to the previous year), Ishikawa (down 22.2% id.), Kagawa (down 20.5% id.), Ehime (down 19.1% id.) and Shiga (down 18.6% id.).

20

Figure 22 Number of establishments in individual enterprises by prefecture

0

1000

2000

3000

4000

5000

6000Number of establishments inindividual enterprises

(Establishments)

-40

-30

-20

-10

0

Hok

kaid

oA

omor

i

Iwat

eM

iyag

i

Aki

taY

amag

ata

Fuku

shim

a

Ibar

aki

Toch

igi

Gun

ma

Saita

ma

Chi

ba

Toky

oK

anag

awa

Niig

ata

Toya

ma

Ishi

kaw

a

Fuku

iY

aman

ashi

Nag

ano

Gifu

Shiz

uoka

Aic

hi

Mie

Shig

a

Kyo

to

Osa

ka

Hyo

go

Nar

aW

akay

ama

Totto

riSh

iman

eO

kaya

ma

Hiro

shim

aY

amag

uchi

Toku

shim

aK

agaw

a

Ehim

e

Koc

hiFu

kuok

a

Saga

Nag

asak

iK

umam

oto

Oita

Miy

azak

iK

agos

him

aO

kina

wa

Y/Y

National average -14.3%

(%)

Note: Because of the revision of the Japan Standard Industrial Classification in the 2002 survey, the year-on-year

comparison is calculated by incorporating the classification of 2001 into that of 2002.

(iv) Comparing the number of establishments of each prefectures by legal status (Table 10), the prefectures with high ratio in corporation are Kanagawa, Tokyo, Saitama, Hiroshima, Hokkaido, Chiba and Tochigi. Those with high ratio in associations and others are Kyoto, Tottori, Kagoshima, Kochi, Shimane and Miyazaki. Those with high ratio in individual establishments are Okinawa, Nara, Nagasaki, Wakayama, Hyogo and Gifu.

21

Table10 Number of establishments by prefecture and legal status Total number of establishments Y/Y (%) Composition ratio by

prefecture (%) Composition ratio by legal status (%)

Total Cor

pora

tions

Ass

ocia

tion

and

othe

rs

Indi

vidu

al

ente

rpris

es

Total Cor

pora

tions

Ass

ocia

tion

and

othe

rs

Indi

vidu

al

ente

rpris

es

Total Cor

pora

tions

Ass

ocia

tion

and

othe

rs

Indi

vidu

al

ente

rpris

es

Total Cor

pora

tions

Ass

ocia

tion

and

othe

rs

Indi

vidu

al

ente

rpris

es

Total 290,848 243,554 2,746 44,548 -7.3 -6.0 -4.8 -14.3 100.0 100.0 100.0 100.0 100.0 83.7 0.9 15.3 1 Hokkaido 7,798 6,958 204 636 -5.7 -5.5 -1.4 -9.4 2.7 2.9 7.4 1.4 100.0 89.2 2.6 8.2 2 Aomori 2,051 1,606 53 392 -7.3 -6.0 -7.0 -12.3 0.7 0.7 1.9 0.9 100.0 78.3 2.6 19.1 3 Iwate 2,855 2,273 77 505 -6.5 -5.3 -13.5 -10.6 1.0 0.9 2.8 1.1 100.0 79.6 2.7 17.7 4 Miyagi 3,904 3,336 53 515 -5.9 -5.6 -5.4 -7.9 1.3 1.4 1.9 1.2 100.0 85.5 1.4 13.2 5 Akita 2,688 2,142 44 502 -7.1 -5.7 -17.0 -11.8 0.9 0.9 1.6 1.1 100.0 79.7 1.6 18.7 6 Yamagata 3,585 3,004 56 525 -6.4 -5.1 -5.1 -13.4 1.2 1.2 2.0 1.2 100.0 83.8 1.6 14.6 7 Fukushima 5,433 4,701 46 686 -7.1 -5.8 -6.1 -15.1 1.9 1.9 1.7 1.5 100.0 86.5 0.8 12.6 8 Ibaraki 7,125 5,888 37 1,200 -7.1 -5.6 -5.1 -14.2 2.4 2.4 1.3 2.7 100.0 82.6 0.5 16.8 9 Tochigi 6,030 5,348 29 653 -7.8 -6.4 -3.3 -18.0 2.1 2.2 1.1 1.5 100.0 88.7 0.5 10.8 10 Gunma 7,016 6,121 36 859 -6.6 -5.1 2.9 -15.9 2.4 2.5 1.3 1.9 100.0 87.2 0.5 12.2 11 Saitama 16,244 14,790 19 1,435 -7.0 -6.0 -13.6 -16.1 5.6 6.1 0.7 3.2 100.0 91.0 0.1 8.8 12 Chiba 7,067 6,288 27 752 -7.1 -6.3 -20.6 -12.9 2.4 2.6 1.0 1.7 100.0 89.0 0.4 10.6 13 Tokyo 23,051 21,422 37 1,592 -10.4 -9.3 -15.9 -22.9 7.9 8.8 1.3 3.6 100.0 92.9 0.2 6.9 14 Kanagawa 11,656 11,163 30 463 -7.3 -7.0 -16.7 -14.3 4.0 4.6 1.1 1.0 100.0 95.8 0.3 4.0 15 Niigata 7,565 6,384 70 1,111 -8.3 -6.5 -1.4 -17.8 2.6 2.6 2.5 2.5 100.0 84.4 0.9 14.7 16 Toyama 3,686 3,024 29 633 -6.1 -4.3 -9.4 -13.5 1.3 1.2 1.1 1.4 100.0 82.0 0.8 17.2 17 Ishikawa 4,237 3,302 35 900 -10.6 -6.9 0.0 -22.2 1.5 1.4 1.3 2.0 100.0 77.9 0.8 21.2 18 Fukui 3,390 2,705 53 632 -9.6 -7.3 -8.6 -18.1 1.2 1.1 1.9 1.4 100.0 79.8 1.6 18.6 19 Yamanashi 2,642 2,108 16 518 -7.1 -4.7 14.3 -16.3 0.9 0.9 0.6 1.2 100.0 79.8 0.6 19.6 20 Nagano 7,003 6,159 82 762 -6.9 -5.8 -3.5 -15.4 2.4 2.5 3.0 1.7 100.0 87.9 1.2 10.9 21 Gifu 9,126 6,753 96 2,277 -5.9 -4.4 -5.0 -10.2 3.1 2.8 3.5 5.1 100.0 74.0 1.1 25.0 22 Shizuoka 13,730 11,435 159 2,136 -6.0 -4.8 -3.6 -12.0 4.7 4.7 5.8 4.8 100.0 83.3 1.2 15.6 23 Aichi 24,216 20,605 78 3,533 -6.6 -5.3 -2.5 -13.7 8.3 8.5 2.8 7.9 100.0 85.1 0.3 14.6 24 Mie 5,279 4,153 61 1,065 -6.3 -4.3 0.0 -13.6 1.8 1.7 2.2 2.4 100.0 78.7 1.2 20.2 25 Shiga 3,457 2,830 28 599 -7.7 -5.0 -3.4 -18.6 1.2 1.2 1.0 1.3 100.0 81.9 0.8 17.3 26 Kyoto 6,456 5,025 249 1,182 -7.9 -5.9 -0.8 -16.8 2.2 2.1 9.1 2.7 100.0 77.8 3.9 18.3 27 Osaka 26,902 21,373 27 5,502 -8.7 -7.0 -6.9 -14.8 9.2 8.8 1.0 12.4 100.0 79.4 0.1 20.5 28 Hyogo 12,195 9,009 66 3,120 -6.4 -4.3 -4.3 -12.0 4.2 3.7 2.4 7.0 100.0 73.9 0.5 25.6 29 Nara 2,945 1,842 11 1,092 -9.0 -3.9 -8.3 -16.4 1.0 0.8 0.4 2.5 100.0 62.5 0.4 37.1 30 Wakayama 2,659 1,785 45 829 -6.3 -3.6 -2.2 -11.8 0.9 0.7 1.6 1.9 100.0 67.1 1.7 31.2 31 Tottori 1,252 1,037 47 168 -6.4 -5.6 0.0 -12.5 0.4 0.4 1.7 0.4 100.0 82.8 3.8 13.4 32 Shimane 1,793 1,420 59 314 -6.4 -5.4 -1.7 -11.3 0.6 0.6 2.1 0.7 100.0 79.2 3.3 17.5 33 Okayama 4,706 4,122 33 551 -7.1 -5.8 -5.7 -16.0 1.6 1.7 1.2 1.2 100.0 87.6 0.7 11.7 34 Hiroshima 6,610 5,953 44 613 -6.1 -5.3 0.0 -13.5 2.3 2.4 1.6 1.4 100.0 90.1 0.7 9.3 35 Yamaguchi 2,496 2,094 50 352 -5.8 -4.3 -2.0 -14.4 0.9 0.9 1.8 0.8 100.0 83.9 2.0 14.1 36 Tokushima 1,940 1,554 47 339 -8.7 -7.1 -24.2 -13.1 0.7 0.6 1.7 0.8 100.0 80.1 2.4 17.5 37 Kagawa 2,706 2,362 29 315 -8.4 -6.5 -3.3 -20.5 0.9 1.0 1.1 0.7 100.0 87.3 1.1 11.6 38 Ehime 3,255 2,659 55 541 -9.0 -6.7 -5.2 -19.1 1.1 1.1 2.0 1.2 100.0 81.7 1.7 16.6 39 Kochi 1,434 1,080 50 304 -8.0 -6.7 -9.1 -12.4 0.5 0.4 1.8 0.7 100.0 75.3 3.5 21.2 40 Fukuoka 7,511 6,089 73 1,349 -6.4 -5.2 -1.4 -11.6 2.6 2.5 2.7 3.0 100.0 81.1 1.0 18.0 41 Saga 1,819 1,419 37 363 -7.0 -4.6 -5.1 -15.4 0.6 0.6 1.3 0.8 100.0 78.0 2.0 20.0 42 Nagasaki 2,564 1,676 48 840 -4.1 -4.9 -5.9 -2.4 0.9 0.7 1.7 1.9 100.0 65.4 1.9 32.8 43 Kumamoto 2,706 2,267 68 371 -6.4 -4.7 -1.4 -15.9 0.9 0.9 2.5 0.8 100.0 83.8 2.5 13.7 44 Oita 2,038 1,713 58 267 -5.6 -4.7 -1.7 -11.6 0.7 0.7 2.1 0.6 100.0 84.1 2.8 13.1 45 Miyazaki 1,891 1,524 62 305 -4.3 -2.0 -6.1 -14.1 0.7 0.6 2.3 0.7 100.0 80.6 3.3 16.1 46 Kagoshima 2,761 2,269 103 389 -7.3 -6.2 -1.9 -14.5 0.9 0.9 3.8 0.9 100.0 82.2 3.7 14.1 47 Okinawa 1,375 784 30 561 -3.6 -0.9 0.0 -7.3 0.5 0.3 1.1 1.3 100.0 57.0 2.2 40.8 Note: Because of the revision of the Japan Standard Industrial Classification in the 2002 survey, the year-on-year comparison is

calculated by incorporating the classification of 2001 into that of 2002.

22

(2) Value of shipment

Looking at the value of shipment (Table 11),

(i) The order of prefectures with high value of shipment in corporations (Figure 23) is Aichi (34.3601 trillion yen), Kanagawa (17.9189 trillion yen), Shizuoka (16.0298 trillion yen), Osaka (15.5229 trillion yen), Saitama (12.6961 trillion yen), Hyogo (12.2748 trillion yen), Tokyo (11.6736 trillion yen) and Chiba (10.4891 trillion yen). By prefecture, Aichi has high ratio in “transportation equipment”, Kanagawa in “transportation equipment”, “general machinery” and “chemical and allied products”, Osaka in “chemical and allied products” and “general machinery”, Shizuoka in “transportation equipment”, “electrical machinery, equipment and supplies” and “chemical and allied products”, Saitama in “transportation equipment”, “chemical and allied products” and “food” and Hyogo in “general machinery”, “electrical machinery, equipment and supplies” and “food”. In the ratio of value of shipment by legal status, corporations in all prefectures exceeds 90% (Table 11). Observing the year-on-year comparison ratio, while there is an increase in 8 prefectures including Tochigi (up 2.3% compared to the previous year), Yamagata (up 2.1% id.), Yamaguchi (up 1.7% id.) and Okayama (up 1.0% id.), there is a decline in other prefectures.

Figure 23 Value of shipment in corporations by prefecture

0

5

10

15

20

25

30

35

40Value of shipment in corporations

(1 trillion yen)

-20-15-10

-505

Hok

kaid

oA

omor

iIw

ate

Miy

agi

Aki

taY

amag

ata

Fuku

shim

aIb

arak

iTo

chig

iG

unm

aSa

itam

aC

hiba

Toky

oK

anag

awa

Niig

ata

Toya

ma

Ishi

kaw

aFu

kui

Yam

anas

hiN

agan

o

Gifu

Shiz

uoka

Aic

hi

Mie

Shig

aK

yoto

Osa

kaH

yogo Nar

aW

akay

ama

Totto

riSh

iman

eO

kaya

ma

Hiro

shim

aY

amag

uchi

Toku

shim

aK

agaw

a

Ehim

eK

ochi

Fuku

oka

Saga

Nag

asak

iK

umam

oto

Oita

Miy

azak

iK

agos

him

aO

kina

wa

Y/Y

National average -4.4%

(%)

Note: Because of the revision of the Japan Standard Industrial Classification in the 2002 survey, the year-on-year comparison

is calculated by incorporating the classification of 2001 into that of 2002.

23

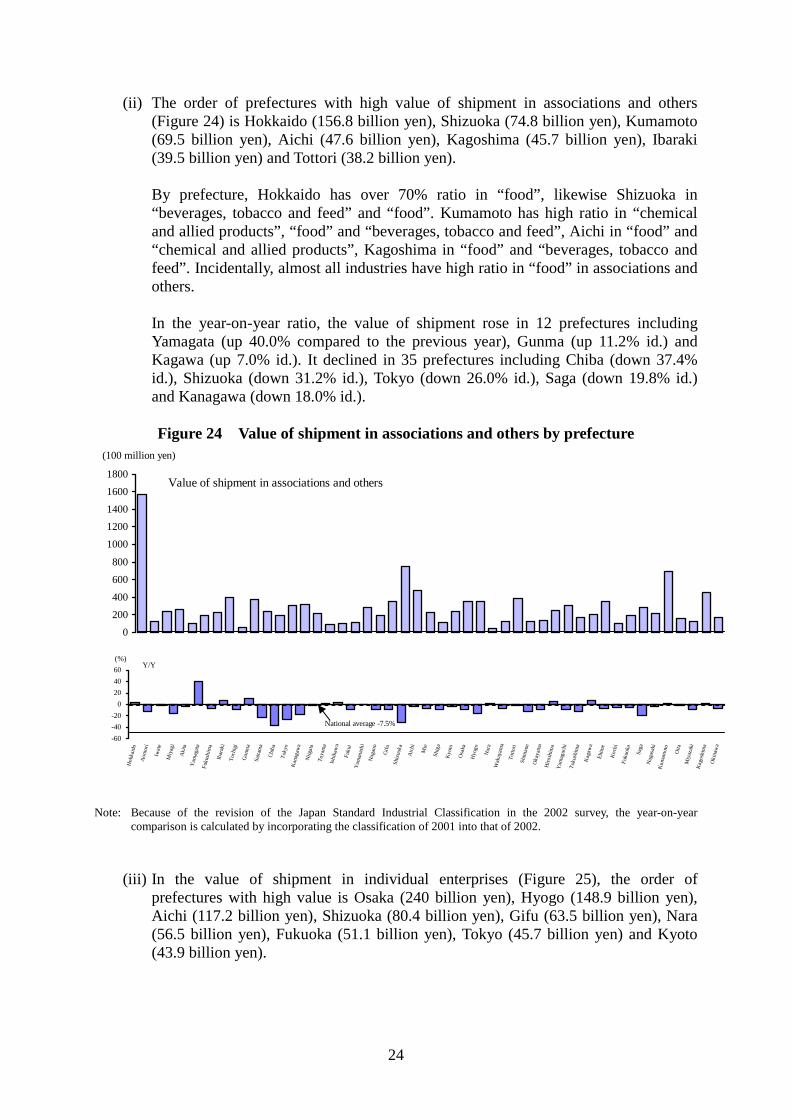
(ii) The order of prefectures with high value of shipment in associations and others (Figure 24) is Hokkaido (156.8 billion yen), Shizuoka (74.8 billion yen), Kumamoto (69.5 billion yen), Aichi (47.6 billion yen), Kagoshima (45.7 billion yen), Ibaraki (39.5 billion yen) and Tottori (38.2 billion yen). By prefecture, Hokkaido has over 70% ratio in “food”, likewise Shizuoka in “beverages, tobacco and feed” and “food”. Kumamoto has high ratio in “chemical and allied products”, “food” and “beverages, tobacco and feed”, Aichi in “food” and “chemical and allied products”, Kagoshima in “food” and “beverages, tobacco and feed”. Incidentally, almost all industries have high ratio in “food” in associations and others. In the year-on-year ratio, the value of shipment rose in 12 prefectures including Yamagata (up 40.0% compared to the previous year), Gunma (up 11.2% id.) and Kagawa (up 7.0% id.). It declined in 35 prefectures including Chiba (down 37.4% id.), Shizuoka (down 31.2% id.), Tokyo (down 26.0% id.), Saga (down 19.8% id.) and Kanagawa (down 18.0% id.).

Figure 24 Value of shipment in associations and others by prefecture

0

200

400

600

800

1000

12001400

1600

1800Value of shipment in associations and others

(100 million yen)

-60-40-20

0204060

Hok

kaid

oA

omor

i

Iwat

e

Miy

agi

Aki

taY

amag

ata

Fuku

shim

aIb

arak

iTo

chig

iG

unm

aSa

itam

a

Chi

ba

Toky

oK

anag

awa

Niig

ata

Toya

ma

Ishi

kaw

a

Fuku

iY

aman

ashi

Nag

ano

Gifu

Shiz

uoka

Aic

hi

Mie

Shig

a

Kyo

to

Osa

ka

Hyo

go

Nar

aW

akay

ama

Totto

riSh

iman

eO

kaya

ma

Hiro

shim

aY

amag

uchi

Toku

shim

aK

agaw

aEh

ime

Koc

hiFu

kuok

a

Saga

Nag

asak

iK

umam

oto

Oita

Miy

azak

iK

agos

him

aO

kina

wa

Y/Y

National average -7.5%

(%)

Note: Because of the revision of the Japan Standard Industrial Classification in the 2002 survey, the year-on-year

comparison is calculated by incorporating the classification of 2001 into that of 2002.

(iii) In the value of shipment in individual enterprises (Figure 25), the order of prefectures with high value is Osaka (240 billion yen), Hyogo (148.9 billion yen), Aichi (117.2 billion yen), Shizuoka (80.4 billion yen), Gifu (63.5 billion yen), Nara (56.5 billion yen), Fukuoka (51.1 billion yen), Tokyo (45.7 billion yen) and Kyoto (43.9 billion yen).

24

By prefecture, Osaka has high value of shipment in “fabricated metal products”, “plastic products” and “general machinery”, Hyogo in “leather tanning, leather products and fur skins”, “food” and “rubber products”, Aichi in “fabricated metal products” and “food”, Shizuoka in “food”, “fabricated metal products” and “beverages, tobacco and feed”, Nara in “lumber and wood products” and “apparel and other finished products”, Gifu in “ceramic, stone and clay products”, “apparel and other finished products” and local industry (specialty products). In the year-on-year comparison ratio, the value of shipment declined in 46 prefectures including Tokyo (down 22.1% compared to the previous year), Toyama (down 20.2% id.), Ishikawa (down 20.1% id.), Ehime (down 19.2% id.), Saitama (down 19.0% id.) and Tochigi (down 18.6% id.) while there is a slight increase in Hokkaido (up 0.6% id.).

Figure 25 Value of shipment in individual enterprises by prefecture

0

500

1000

1500

2000

2500

3000Value of shipment in individual enterprises

(100 million yen)

-30

-20-10

0

10

Hok

kaid

oA

omor

iIw

ate

Miy

agi

Aki

taY

amag

ata

Fuku

shim

aIb

arak

iTo

chig

iG

unm

aSa

itam

aCh

iba

Toky

oK

anag

awa

Niig

ata

Toya

ma

Ishi

kaw

aFu

kui

Yam

anas

hiN

agan

o

Gifu

Shiz

uoka

Aich

i

Mie

Shig

aK

yoto

Osa

kaH

yogo

Nar

aW

akay

ama

Totto

riSh

iman

eO

kaya

ma

Hiro

shim

aY

amag

uchi

Toku

shim

aK

agaw

aEh

ime

Koc

hiFu

kuok

a

Saga

Nag

asak

iK

umam

oto

Oita

Miy

azak

iK

agos

him

aO

kina

wa

Y/Y

National average -13.4%

(%)

Note: Because of the revision of the Japan Standard Industrial Classification in the 2002 survey, the year-on-year

comparison is calculated by incorporating the classification of 2001 into that of 2002.

25

Table 11 Value of shipment by prefecture and legal status

Value of shipment (1 million yen) Y/Y (%)

Total Corporations Association

and othersIndividual enterprises Total Corpora-

tions

Associa- tion and others

Individual enterprises

National total 269,361,805 266,509,502 1,287,194 1,565,110 -4.4 -4.4 -7.5 -13.41 Hokkaido 5,347,551 5,156,778 156,755 34,018 -2.5 -2.7 3.3 0.62 Aomori 1,193,532 1,168,916 11,732 12,884 -3.2 -3.1 -12.6 -6.13 Iwate 2,058,255 2,018,197 24,131 15,926 -8.3 -8.4 -1.7 -8.74 Miyagi 3,436,282 3,392,452 26,317 17,514 -5.1 -5.0 -15.8 -11.25 Akita 1,335,222 1,311,915 9,594 13,713 -9.7 -9.7 -2.8 -11.56 Yamagata 2,717,818 2,683,467 19,467 14,884 2.2 2.1 40.0 -15.77 Fukushima 5,155,135 5,115,333 22,675 17,127 -3.7 -3.6 -7.6 -14.48 Ibaraki 9,960,715 9,882,195 39,456 39,063 -2.9 -2.9 6.8 -15.09 Tochigi 7,659,208 7,639,276 5,113 14,819 2.3 2.3 -8.5 -18.610 Gunma 7,229,167 7,169,839 37,103 22,224 -6.9 -6.9 11.2 -15.011 Saitama 12,759,874 12,696,081 23,652 40,141 -8.4 -8.3 -22.3 -19.012 Chiba 10,534,916 10,489,139 18,928 26,849 -3.1 -3.0 -37.4 -8.613 Tokyo 11,749,815 11,673,571 30,506 45,739 -13.2 -13.1 -26.0 -22.114 Kanagawa 17,963,706 17,918,949 31,066 13,690 -9.5 -9.5 -18.0 -14.515 Niigata 4,206,238 4,153,816 20,878 31,545 -3.4 -3.3 -1.4 -14.616 Toyama 3,225,710 3,195,747 21,340 -2.2 -2.1 1.3 -20.217 Ishikawa 2,333,518 2,295,199 9,995 28,324 -6.7 -6.5 2.9 -20.118 Fukui 1,687,094 1,656,764 11,297 19,033 -4.4 -4.2 -9.2 -18.219 Yamanashi 2,115,477 2,068,982 28,068 18,427 -7.6 -7.7 0.5 -12.520 Nagano 5,331,857 5,291,217 18,938 21,702 -17.5 -17.5 -9.5 -13.421 Gifu 4,717,030 4,618,212 35,283 63,536 -4.5 -4.3 -8.9 -12.222 Shizuoka 16,185,060 16,029,833 74,780 80,447 0.2 0.5 -31.2 -13.623 Aichi 34,524,877 34,360,131 47,592 117,154 0.6 0.7 -3.9 -11.924 Mie 7,664,237 7,600,485 22,777 40,975 0.1 0.2 -6.9 -13.725 Shiga 5,793,622 5,763,301 11,615 18,706 -4.4 -4.3 -7.8 -17.526 Kyoto 4,620,245 4,552,764 23,557 43,923 -10.5 -10.4 -2.7 -16.127 Osaka 15,797,409 15,522,925 34,437 240,046 -5.9 -5.8 -7.8 -13.828 Hyogo 12,458,804 12,274,815 35,128 148,861 -4.7 -4.7 -16.9 -9.029 Nara 1,992,530 1,931,036 4,991 56,503 -7.0 -6.8 2.0 -13.930 Wakayama 2,053,518 2,004,608 12,251 36,660 -8.3 -8.3 -6.8 -13.331 Tottori 1,025,815 982,635 38,180 4,999 -6.9 -7.1 -1.5 -10.232 Shimane 1,003,399 980,510 12,380 10,509 -4.7 -4.6 -11.6 -10.833 Okayama 6,289,547 6,261,662 13,576 14,309 0.9 1.0 -8.1 -13.534 Hiroshima 6,556,297 6,512,873 24,855 18,569 -3.0 -3.0 4.5 -14.935 Yamaguchi 4,951,331 4,909,365 30,702 11,265 1.6 1.7 -9.5 -15.036 Tokushima 1,392,832 1,366,406 16,833 9,594 -3.1 -2.9 -13.0 -12.137 Kagawa 2,053,636 2,024,455 20,505 8,676 -2.7 -2.7 7.0 -12.038 Ehime 3,100,789 3,051,878 34,601 14,310 -5.1 -5.0 -7.1 -19.239 Kochi 543,759 522,844 10,535 10,380 -2.4 -2.0 -6.1 -13.940 Fukuoka 6,982,022 6,911,129 19,755 51,138 -3.1 -3.0 -5.5 -13.841 Saga 1,397,118 1,356,961 27,816 12,342 -11.5 -11.3 -19.8 -14.142 Nagasaki 1,493,485 1,450,755 20,864 21,867 -8.4 -8.5 -2.9 -4.843 Kumamoto 2,367,414 2,285,041 69,468 12,905 -9.2 -9.5 2.4 -14.344 Oita 2,854,180 2,831,078 15,898 7,204 0.7 0.8 -2.2 -13.345 Miyazaki 1,210,798 1,189,180 12,543 9,074 -0.7 -0.5 -8.9 -13.946 Kagoshima 1,759,236 1,702,408 45,717 11,110 -4.1 -4.2 1.2 -11.247 Okinawa 571,728 534,376 16,264 21,088 -7.7 -7.8 -7.5 -6.1

8,623

Note: Because of the revision of the Japan Standard Industrial Classification in the 2002 survey, the year-on-year comparison is calculated by incorporating the classification of 2001 into that of 2002.

26

Table 11 Value of shipment by prefecture and legal status (Continued)

Composition ratio by prefecture (%) Composition ratio by legal status (%)

Total Corporations Association and others

Individual enterprises Total Corporations Association

and others Individual enterprises

National total 100.0 100.0 100.0 100.0 100.0 98.9 0.5 0.6 1 Hokkaido 2.0 1.9 12.2 2.2 100.0 96.4 2.9 0.6 2 Aomori 0.4 0.4 0.9 0.8 100.0 97.9 1.0 1.1 3 Iwate 0.8 0.8 1.9 1.0 100.0 98.1 1.2 0.8 4 Miyagi 1.3 1.3 2.0 1.1 100.0 98.7 0.8 0.5 5 Akita 0.5 0.5 0.7 0.9 100.0 98.3 0.7 1.0 6 Yamagata 1.0 1.0 1.5 1.0 100.0 98.7 0.7 0.5 7 Fukushima 1.9 1.9 1.8 1.1 100.0 99.2 0.4 0.3 8 Ibaraki 3.7 3.7 3.1 2.5 100.0 99.2 0.4 0.4 9 Tochigi 2.8 2.9 0.4 0.9 100.0 99.7 0.1 0.2 10 Gunma 2.7 2.7 2.9 1.4 100.0 99.2 0.5 0.3 11 Saitama 4.7 4.8 1.8 2.6 100.0 99.5 0.2 0.3 12 Chiba 3.9 3.9 1.5 1.7 100.0 99.6 0.2 0.3 13 Tokyo 4.4 4.4 2.4 2.9 100.0 99.4 0.3 0.4 14 Kanagawa 6.7 6.7 2.4 0.9 100.0 99.8 0.2 0.1 15 Niigata 1.6 1.6 1.6 2.0 100.0 98.8 0.5 0.7 16 Toyama 1.2 1.2 0.7 1.4 100.0 99.1 0.3 0.7 17 Ishikawa 0.9 0.9 0.8 1.8 100.0 98.4 0.4 1.2 18 Fukui 0.6 0.6 0.9 1.2 100.0 98.2 0.7 1.1 19 Yamanashi 0.8 0.8 2.2 1.2 100.0 97.8 1.3 0.9 20 Nagano 2.0 2.0 1.5 1.4 100.0 99.2 0.4 0.4 21 Gifu 1.8 1.7 2.7 4.1 100.0 97.9 0.7 1.3 22 Shizuoka 6.0 6.0 5.8 5.1 100.0 99.0 0.5 0.5 23 Aichi 12.8 12.9 3.7 7.5 100.0 99.5 0.1 0.3 24 Mie 2.8 2.9 1.8 2.6 100.0 99.2 0.3 0.5 25 Shiga 2.2 2.2 0.9 1.2 100.0 99.5 0.2 0.3 26 Kyoto 1.7 1.7 1.8 2.8 100.0 98.5 0.5 1.0 27 Osaka 5.9 5.8 2.7 15.3 100.0 98.3 0.2 1.5 28 Hyogo 4.6 4.6 2.7 9.5 100.0 98.5 0.3 1.2 29 Nara 0.7 0.7 0.4 3.6 100.0 96.9 0.3 2.8 30 Wakayama 0.8 0.8 1.0 2.3 100.0 97.6 0.6 1.8 31 Tottori 0.4 0.4 3.0 0.3 100.0 95.8 3.7 0.5 32 Shimane 0.4 0.4 1.0 0.7 100.0 97.7 1.2 1.0 33 Okayama 2.3 2.3 1.1 0.9 100.0 99.6 0.2 0.2 34 Hiroshima 2.4 2.4 1.9 1.2 100.0 99.3 0.4 0.3 35 Yamaguchi 1.8 1.8 2.4 0.7 100.0 99.2 0.6 0.2 36 Tokushima 0.5 0.5 1.3 0.6 100.0 98.1 1.2 0.7 37 Kagawa 0.8 0.8 1.6 0.6 100.0 98.6 1.0 0.4 38 Ehime 1.2 1.1 2.7 0.9 100.0 98.4 1.1 0.5 39 Kochi 0.2 0.2 0.8 0.7 100.0 96.2 1.9 1.9 40 Fukuoka 2.6 2.6 1.5 3.3 100.0 99.0 0.3 0.7 41 Saga 0.5 0.5 2.2 0.8 100.0 97.1 2.0 0.9 42 Nagasaki 0.6 0.5 1.6 1.4 100.0 97.1 1.4 1.5 43 Kumamoto 0.9 0.9 5.4 0.8 100.0 96.5 2.9 0.5 44 Oita 1.1 1.1 1.2 0.5 100.0 99.2 0.6 0.3 45 Miyazaki 0.4 0.4 1.0 0.6 100.0 98.2 1.0 0.7 46 Kagoshima 0.7 0.6 3.6 0.7 100.0 96.8 2.6 0.6 47 Okinawa 0.2 0.2 1.3 1.3 100.0 93.5 2.8 3.7

27

<Topics>

Situation of enterprise share by industrial commodity In this section, the shares of the commodities surveyed in the 2002 Census of Manufacture by large enterprise and medium and small sized enterprise and the degree of concentration of top enterprises are verified by sorting the establishment-based data given in the Census of Manufacture with the use of a computer-assisted name identification system. The analysis was conducted through manufacturing 1,817 commodities excluding piecework, refrigerating and storage fee and selling electric power. For your reference, the data described here refer to value-of-shipment-based data in enterprises with establishments (factories) engaged in manufacturing industry in Japan. Therefore, the data differs from shares including so-called “market share”. Because: (i) there are differences in units (amount, number and weight base etc.), survey years and

definition and range of commodities; (ii) the data in this section are value-of-shipment-based data of domestic factories (including

export and excluding import ) while shares including “market share” generally refer to “domestic share” (excluding export and including import);

(iii) the data of subsidiaries, affiliating factories and OEM and EMS(*) manufacturers are

regarded as those of independent enterprises while share including “market share” generally include data of product brand or manufacturer.

* OEM stands for Original Equipment Manufacturer and means product supply by partner

brand. EMS stands for Electronics Manufacturing Services and means entrusted production of items including printed board.

28

1. Composition ratio by large enterprise and medium and small sized enterprise Observing the commodities by size of enterprises (Note 1) , medium and small sized enterprises account for 96.6%, showing significantly a high ratio while large enterprises account for 3.4% in the total enterprises (Note 2). In the value-of-shipment-base, however, the ratio is conversely high in large enterprises because of the ratio 60 to 40.

Composition ratio of the total enterprises and value of shipment by commodity and size of enterprises (2002, based on enterprise commodities)

60.1 39.9

3.4 96.6

0% 20% 40% 60% 80% 100%

Number of total

enterprises

Value of shipment

Large enterprises Medium and smallsized enterprises

Note: In this section, manufacturing commodities are calculated by enterprise unit.

Therefore, the data differ from the value of large enterprises and medium and small sized enterprises referred in the previous section. The same will be applied to the data to be mentioned hereinafter.

Note 1: The definition of a large enterprise and a medium and small sized enterprise is as follows:

Large enterprise: Enterprise with capital more than 300 million yen and number of employees more than 300 persons in “Corporation”, enterprise with more than 300 persons in “Associations and others” and “Individual enterprises” Medium and small sized enterprise: Enterprise with capital 300 million yen or less and number of employees 300 persons or less in “Corporation”, enterprise with 300 persons or less in “Associations and others” and “Individual enterprises”

Note 2: There is an expression of “number of total enterprises” because enterprises with shipment of more than 1

commodities are counted as one in each commodity category because the data by commodity and enterprise are used in this section.

29

Looking at the number of total enterprises by initial two digits of commodities, there is a high ratio of large enterprises in commodities including “information and communication electronics equipment”, “chemical and allied products”, “petroleum and coal products” and “electronic parts and devices”. On the other hand, there is a high ratio of medium and small sized enterprises in commodities including “apparel and other finished products made from fabrics and similar products”, “leather tanning, leather products and fur skins”, “lumber and wood products, except furniture”, “printing and allied industries” and “furniture and fixtures”.

Total enterprises by initial two digits of commodities

(2002, based on enterprise commodities)

Total enterprises

Large enterprises Medium and small sized enterprises

Com

posi

tion

ratio

by

size

of

ent

erpr

ises

C

ompo

sitio

n ra

tio b

y in

dust

ry

Com

posi

tion

ratio

by

size

of

ent

erpr

ises

C

ompo

sitio

n ra

tio b

y in

dust

ry

Initial two digits of commodities

(Enter- prises)

(Enter-prises) (%) (%)

(Enter- prises) (%) (%)

00 Total 336,277 11,524 3.4 100.0 324,753 96.6 100.009 Food 50,130 937 1.9 8.1 49,193 98.1 15.110 Beverages, tobacco and feed 7,547 238 3.2 2.1 7,309 96.8 2.311 Textile mill products 5,707 170 3.0 1.5 5,537 97.0 1.712 Apparel and other finished products 10,112 24 0.2 0.2 10,088 99.8 3.113 Lumber and wood products 23,622 61 0.3 0.5 23,561 99.7 7.314 Furniture and fixtures 15,381 88 0.6 0.8 15,293 99.4 4.715 Pulp, paper and paper products 9,584 323 3.4 2.8 9,261 96.6 2.916 Printing and allied industries 17,559 88 0.5 0.8 17,471 99.5 5.417 Chemical and allied products 9,084 1,570 17.3 13.6 7,514 82.7 2.318 Petroleum and coal products 902 145 16.1 1.3 757 83.9 0.219 Plastic products 17,962 518 2.9 4.5 17,444 97.1 5.420 Rubber products 4,097 179 4.4 1.6 3,918 95.6 1.221 Leather tanning, leather products and fur skins 2,370 5 0.2 0.0 2,365 99.8 0.722 Ceramic, stone and clay products 16,637 372 2.2 3.2 16,265 97.8 5.023 Iron and steel 7,027 494 7.0 4.3 6,533 93.0 2.024 Non-ferrous metals and products 4,987 368 7.4 3.2 4,619 92.6 1.425 Fabricated metal products 34,867 514 1.5 4.5 34,353 98.5 10.626 General machinery 45,242 1,777 3.9 15.4 43,465 96.1 13.427 Electrical machinery, equipment and supplies 15,978 1,082 6.8 9.4 14,896 93.2 4.628 Information and communication electronics

equipment 3,049 583 19.1 5.1 2,466 80.9 0.829 Electronic parts and devices 4,512 641 14.2 5.6 3,871 85.8 1.230 Transportation equipment 10,650 898 8.4 7.8 9,752 91.6 3.031 Precision instruments and machinery 6,055 265 4.4 2.3 5,790 95.6 1.832 Miscellaneous manufacturing industries 13,216 184 1.4 1.6 13,032 98.6 4.0

Note 1: The data in this section differ from those in Report by Industry and Report by Commodity because of calculation based on initial two digits of commodities and enterprises.

Note 2: The commodity names in the above table are names of initial two digits of commodities of manufacturing commodities. Therefore, they differ from industrial classification in reports including Report by Industry.

30

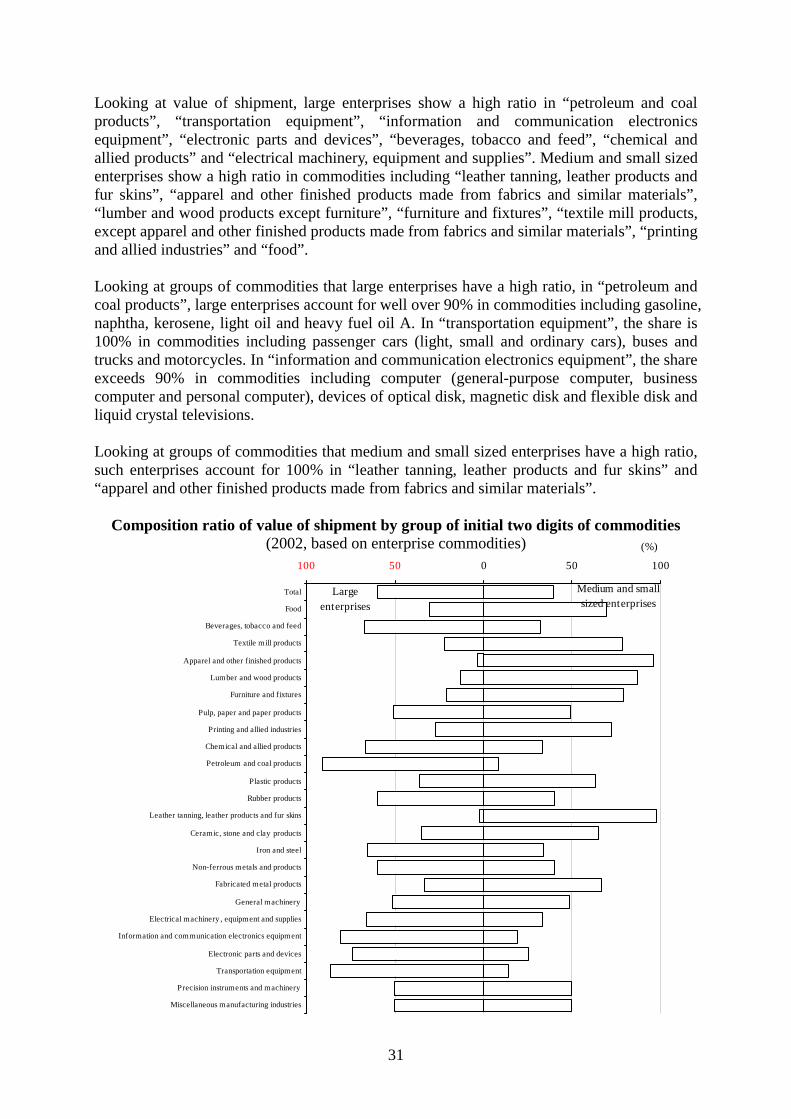
Looking at value of shipment, large enterprises show a high ratio in “petroleum and coal products”, “transportation equipment”, “information and communication electronics equipment”, “electronic parts and devices”, “beverages, tobacco and feed”, “chemical and allied products” and “electrical machinery, equipment and supplies”. Medium and small sized enterprises show a high ratio in commodities including “leather tanning, leather products and fur skins”, “apparel and other finished products made from fabrics and similar materials”, “lumber and wood products except furniture”, “furniture and fixtures”, “textile mill products, except apparel and other finished products made from fabrics and similar materials”, “printing and allied industries” and “food”. Looking at groups of commodities that large enterprises have a high ratio, in “petroleum and coal products”, large enterprises account for well over 90% in commodities including gasoline, naphtha, kerosene, light oil and heavy fuel oil A. In “transportation equipment”, the share is 100% in commodities including passenger cars (light, small and ordinary cars), buses and trucks and motorcycles. In “information and communication electronics equipment”, the share exceeds 90% in commodities including computer (general-purpose computer, business computer and personal computer), devices of optical disk, magnetic disk and flexible disk and liquid crystal televisions. Looking at groups of commodities that medium and small sized enterprises have a high ratio, such enterprises account for 100% in “leather tanning, leather products and fur skins” and “apparel and other finished products made from fabrics and similar materials”.

Composition ratio of value of shipment by group of initial two digits of commodities (2002, based on enterprise commodities)

0 50 100

Total

Food

Beverages, tobacco and feed

Textile mill products

Apparel and other finished products

Lumber and wood products

Furniture and fixtures

Pulp, paper and paper products

Printing and allied industries

Chemical and allied products

Petroleum and coal products

Plastic products

Rubber products

Leather tanning, leather products and fur skins

Ceramic, stone and clay products

Iron and steel

Non-ferrous metals and products

Fabricated metal products

General machinery

Electrical machinery , equipment and supplies

Information and communication electronics equipment

Electronic parts and devices

Transportation equipment

Precision instruments and machinery

Miscellaneous manufacturing industries

Largeenterprises

Medium and smallsized enterprises

(%) 100 50

31

Value of shipment by group of initial two digits of commodities (2002, based on enterprise commodities)

Value of shipment

Large enterprises Medium and small sized enterprises

Com

posi

tion

ratio

by

size

of

ent

erpr

ises

C

ompo

sitio

n ra

tio b

y in

dust

ry

Com

posi

tion

ratio

by

size

of

ent

erpr

ises

C

ompo

sitio

n ra

tio b

y in

dust

ry

Initial two digits of commodities

(1 million yen) (1 million yen) (%) (%) (1 million yen) (%) (%) 00 Total 257,598,451 154,696,554 60.1 100.0 102,901,897 39.9 100.009 Food 22,446,827 6,818,079 30.4 4.4 15,628,749 69.6 15.210 Beverages, tobacco and feed 10,644,526 7,190,347 67.5 4.6 3,454,179 32.5 3.411 Textile mill products 1,708,532 367,384 21.5 0.2 1,341,148 78.5 1.312 Apparel and other finished

products 1,925,164 72,566 3.8 0.0 1,852,598 96.2 1.813 Lumber and wood products 2,516,430 323,670 12.9 0.2 2,192,760 87.1 2.114 Furniture and fixtures 2,242,451 467,916 20.9 0.3 1,774,535 79.1 1.715 Pulp, paper and paper products 6,929,748 3,522,963 50.8 2.3 3,406,785 49.2 3.316 Printing and allied industries 6,478,880 1,778,169 27.4 1.1 4,700,711 72.6 4.617 Chemical and allied products 22,562,492 15,023,663 66.6 9.7 7,538,830 33.4 7.318 Petroleum and coal products 9,389,118 8,559,066 91.2 5.5 830,053 8.8 0.819 Plastic products 9,386,165 3,427,010 36.5 2.2 5,959,156 63.5 5.820 Rubber products 2,795,200 1,674,815 59.9 1.1 1,120,386 40.1 1.121 Leather tanning, leather

products and fur skins 522,462 10,603 2.0 0.0 511,859 98.0 0.522 Ceramic, stone and clay

products 7,590,932 2,668,058 35.1 1.7 4,922,874 64.9 4.823 Iron and steel 10,244,176 6,744,499 65.8 4.4 3,499,677 34.2 3.424 Non-ferrous metals and products 5,408,746 3,236,301 59.8 2.1 2,172,445 40.2 2.125 Fabricated metal products 11,814,767 3,932,990 33.3 2.5 7,881,778 66.7 7.726 General machinery 24,004,198 12,325,116 51.3 8.0 11,679,082 48.7 11.327 Electrical machinery, equipment

and supplies 17,096,852 11,337,967 66.3 7.3 5,758,885 33.7 5.628 Information and communication

electronics equipment 12,277,252 9,925,280 80.8 6.4 2,351,973 19.2 2.329 Electronic parts and devices 15,269,901 11,322,984 74.2 7.3 3,946,917 25.8 3.830 Transportation equipment 46,150,122 39,844,566 86.3 25.8 6,305,556 13.7 6.131 Precision instruments and

machinery 3,462,516 1,739,781 50.2 1.1 1,722,735 49.8 1.732 Miscellaneous manufacturing

industries 4,730,992 2,382,765 50.4 1.5 2,348,227 49.6 2.3Note 1: The data in this section differ from those in Report by Industry and Report by Commodity because of calculation

based on initial two digits of commodities and enterprises. Note 2: The commodity names in the above table are names of initial two digits of commodities of manufacturing

commodities. Therefore, they differ from industrial classification in reports including Report by Industry.

32

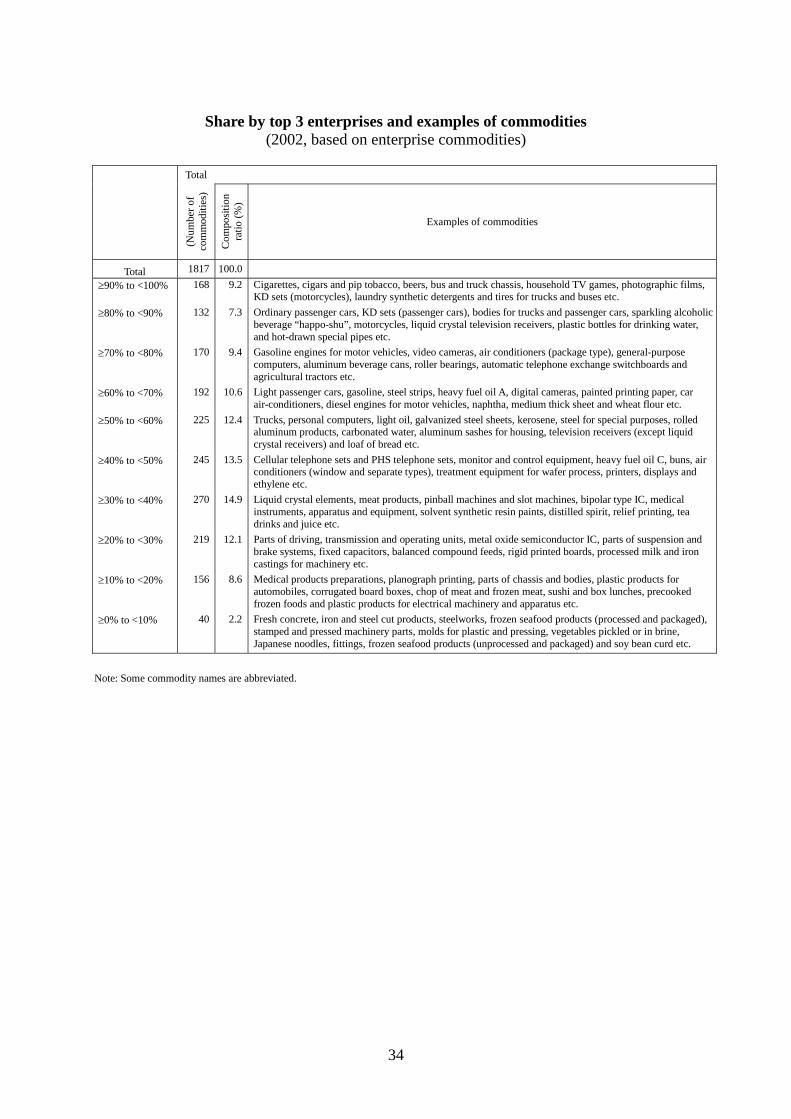
2. Share by top 3 enterprises Observing the share by top 3 enterprises in each commodity, the highest share is “30% to less than 40%”, followed by “40% to less than 50%”, “50% to less than 60%”, “20% to less than 30%”. The number of commodities which are accounted for more than 50% by the top 3 enterprises is 887, which takes up nearly the half of all commodities at 48.8%.

Composition ratio by share by top 3 enterprises

(2002, based on enterprise commodities)

9.27.3

9.410.6

12.413.5

14.9

12.1

8.6

2.2

0

5

10

15

20(%)

1%

or

mor

e to

le

ss th

an 1

0%

10%

or

mor

e to

le

ss th

an 2

0%

20%

or

mor

e to

le

ss th

an 3

0%

30%

or

mor

e to

le

ss th

an 4

0%

40%

or

mor

e to

le

ss th

an 5

0%

50%

or

mor

e to

le

ss th

an 6

0%

60%

or

mor

e to

le

ss th

an 7

0%

70%

or

mor

e to

le

ss th

an 8

0%

80%

or

mor

e to

le

ss th

an 9

0%

90%

or

mor

e to

le

ss th

an 1

00%

33

Share by top 3 enterprises and examples of commodities

(2002, based on enterprise commodities)

Total

(Num

ber o

f co

mm

oditi

es)

Com

posi

tion

ratio

(%)

Examples of commodities

Total 1817 100.0 ≥90% to <100% 168 9.2 Cigarettes, cigars and pip tobacco, beers, bus and truck chassis, household TV games, photographic films,

KD sets (motorcycles), laundry synthetic detergents and tires for trucks and buses etc. ≥80% to <90% 132 7.3 Ordinary passenger cars, KD sets (passenger cars), bodies for trucks and passenger cars, sparkling alcoholic

beverage “happo-shu”, motorcycles, liquid crystal television receivers, plastic bottles for drinking water, and hot-drawn special pipes etc.

≥70% to <80% 170 9.4 Gasoline engines for motor vehicles, video cameras, air conditioners (package type), general-purpose computers, aluminum beverage cans, roller bearings, automatic telephone exchange switchboards and agricultural tractors etc.

≥60% to <70% 192 10.6 Light passenger cars, gasoline, steel strips, heavy fuel oil A, digital cameras, painted printing paper, car air-conditioners, diesel engines for motor vehicles, naphtha, medium thick sheet and wheat flour etc.

≥50% to <60% 225 12.4 Trucks, personal computers, light oil, galvanized steel sheets, kerosene, steel for special purposes, rolled aluminum products, carbonated water, aluminum sashes for housing, television receivers (except liquid crystal receivers) and loaf of bread etc.

≥40% to <50% 245 13.5 Cellular telephone sets and PHS telephone sets, monitor and control equipment, heavy fuel oil C, buns, air conditioners (window and separate types), treatment equipment for wafer process, printers, displays and ethylene etc.

≥30% to <40% 270 14.9 Liquid crystal elements, meat products, pinball machines and slot machines, bipolar type IC, medical instruments, apparatus and equipment, solvent synthetic resin paints, distilled spirit, relief printing, tea drinks and juice etc.

≥20% to <30% 219 12.1 Parts of driving, transmission and operating units, metal oxide semiconductor IC, parts of suspension and brake systems, fixed capacitors, balanced compound feeds, rigid printed boards, processed milk and iron castings for machinery etc.

≥10% to <20% 156 8.6 Medical products preparations, planograph printing, parts of chassis and bodies, plastic products for automobiles, corrugated board boxes, chop of meat and frozen meat, sushi and box lunches, precooked frozen foods and plastic products for electrical machinery and apparatus etc.

≥0% to <10% 40 2.2 Fresh concrete, iron and steel cut products, steelworks, frozen seafood products (processed and packaged), stamped and pressed machinery parts, molds for plastic and pressing, vegetables pickled or in brine, Japanese noodles, fittings, frozen seafood products (unprocessed and packaged) and soy bean curd etc.

Note: Some commodity names are abbreviated.

34

Share by top 3 enterprises by group of initial two digits of commodities (2002, based on enterprise commodities)

Tota

l

Food

Bev

erag

es, t

obac

co a

nd fe

ed

Text

ile m

ill p

rodu

cts

App

arel

and

oth

er fi

nish

ed

prod

ucts

Lu

mbe

r and

woo

d pr

oduc

ts

Furn

iture

and

fixt

ures

Pulp

, pap

er a

nd p

aper

pro

duct

s

Prin

ting

and

allie

d in

dust

ries

Che

mic

al a

nd a

llied

pro

duct

s

Petro

leum

and

coa

l pro

duct

s

Plas

tic p

rodu

cts

Rub

ber p

rodu

cts

Leat

her t

anni

ng, l

eath

er p

rodu

cts

and

fur s

kins

C

eram

ic, s

tone

and

cla

y pr

oduc

ts

Iron

and

stee

l

Non

-fer

rous

met

als a

nd p

rodu

cts

Fabr

icat

ed m

etal

pro

duct

s

Gen

eral

mac

hine

ry

Elec

trica

l mac

hine

ry, e

quip

men

t an

d su

pplie

s In

form

atio

n an

d co

mm

unic

atio

n el

ectro

nics

equ

ipm

ent

Elec

troni

c pa

rts a

nd d

evic

es

Tran

spor

tatio

n eq

uipm

ent

Prec

ision

inst

rum

ents

and

m

achi

nery

M

isce

llane

ous m

anuf

actu

ring

indu

strie

s

Total 1817 95 28 114 72 37 21 59 9 214 24 43 41 34 116 65 56 104 237 114 52 41 77 62 102≥90% to <100% 168 3 4 11 - - 1 3 - 46 4 - 5 4 14 12 7 - 16 5 5 - 17 1 10≥80% to <90% 132 - 1 6 - 1 - 3 - 25 3 4 7 - 8 15 6 5 14 8 6 3 10 3 4≥70% to <80% 170 5 2 11 3 1 1 3 2 32 3 - 4 2 15 5 6 8 19 15 3 3 11 6 10≥60% to <70% 192 6 2 13 8 1 1 11 - 22 6 3 4 2 5 10 3 9 23 16 12 3 10 11 11≥50% to <60% 225 10 2 16 2 2 1 7 1 27 4 2 4 6 15 5 13 12 26 18 10 9 8 10 15≥40% to <50% 245 13 3 22 11 3 - 9 - 21 2 5 5 6 16 5 8 13 37 17 11 6 7 12 13≥30% to <40% 270 21 5 17 20 5 3 6 2 28 1 5 5 6 16 5 7 15 45 16 3 9 6 10 14≥20% to <30% 219 10 2 11 12 9 6 14 2 9 1 8 4 2 14 6 5 24 30 15 2 7 5 8 13≥10% to <20% 156 18 6 7 15 9 5 3 1 3 - 15 3 6 8 1 1 12 23 4 - 1 3 1 11≥0% to <10% 40 9 1 - 1 6 3 - 1 1 - 1 - - 5 1 - 6 4 - - - - - 1

35

3. Herfindahl Index Looking at Herfindahl Index Note (hereinafter referred to as “HI”), it shows a high ratio in “ transportation equipment”, “ chemical and allied products”, “ iron and steel” and “ petroleum and coal products” as share by top 3 enterprises does.

HI by initial two digits of commodities (2002, based on enterprise commodities)

0

500

1000

1500

2000

2500

3000

Total

Food

Bevera

ges, t

obacc

o and

feed

Textile

mill

produ

cts

Appare

l and

othe

r finis

hed p

roduc

ts

Lumbe

r and

woo

d prod

ucts

Furnitu

re an

d fixt

ures

Pulp, p

aper

and p

aper

produ

cts

Printin

g and

allie

d ind

ustrie

s

Chemica

l and

allie

d prod

ucts

Petrole

um an

d coa

l prod

ucts

Plastic

prod

ucts

Rubbe

r prod

ucts

Leathe

r tann

ing, le

ather

produ

cts an

d fur

skins

Ceramic,

ston

e and

clay

prod

ucts

Iron a

nd ste

el

Non-fe

rrous

metals

and p

roduc

ts

Fabric

ated m

etal p

roduc

ts

Genera

l mach

inery

Electric

al mach

inery,

equip

ment a

nd su

pplie

s

Inform

ation

and c

ommun

icatio

n elec

tronic

s equ

ipmen

t

Electro

nic pa

rts an

d dev

ices

Transpo

rtatio

n equ

ipmen

t

Precisi

on in

strum

ents

and m

achine

ry

Miscell

aneo

us man

ufactu

ring i

ndust

ries

Note: The index is calculated by totaling of squared enterprise shares (%) of each commodity. The higher the

index value means more concentration of commodity on specific enterprises. For examples, if there are shares of 50% for Company A, 30% for Company B and 20% for Company C in a commodity, the calculation will be as follows: 502 + 302 + 202 = 2500 + 900 + 400 = 3800 Calculation method: Herfindahl Index (HI) = ∑ (Xi/X*100)2

36

37

Examples of commodities by HI group (2002, based on enterprise commodities)

Total

HI

(Num

ber o

f co

mm

oditi

es)

Com

posi

tion

ratio

(%)

Examples of commodities

Total 1817 100.0

5000 or more 100 5.5 Cigarettes, cigars and pip tobacco, household TV games, bus and truck chassis, photographic films, stereo sets, whisky and car heaters etc.

2500 to less than 5000 298 16.4

Ordinary passenger cars, beers, KD sets (passenger cars and buses and trucks), gasoline engines for passenger cars, sparkling alcoholic beverage “happo-shu”, motorcycles (more than 125ml) and magnetic disks etc.

1800 to less than 2500 200 11.0 Light and small passenger cars, bodies for passenger cars, video cameras, steel strips, digital cameras, car

air-conditioners, shovel excavators and medium thick sheet etc. 1000 to less than

1800 413 22.7 Gasoline, trucks, personal computers, light oil, galvanized steel sheets, Heavy fuel oil A and C, kerosene, steel for special purposes, buns and rolled aluminum products etc.

500 to less than 1000 389 21.4

Metal oxide semiconductor IC, cellular telephone sets and PHS telephone sets, liquid crystal elements, monitor and control equipment, meat products, pinball machines and slot machines and bipolar type IC etc.

Less than 500 417 22.9 Medical products preparations, planograph printing, parts of driving, transmission and operating units, parts of chassis and bodies, fresh concrete, iron and steel cut products and plastic products for automobiles etc.

Note: Some commodity names are abbreviated.

Number of commodities by initial two digits of commodities and HI group (2002, based on enterprise commodities)

Total

Initial two digits of commodities ≥5000 ≥2500 to

<5000 ≥1800 to

<2500≥1000 to

<1800 ≥500 to <1000 <500

00 Total 1817 100 298 200 413 389 41709 Food 95 2 2 6 20 27 3810 Beverages, tobacco and feed 28 3 2 3 4 6 1011 Textile mill products 114 6 19 10 35 25 1912 Apparel and other finished products 72 - 3 3 15 20 3113 Lumber and wood products 37 - 2 2 2 7 2414 Furniture and fixtures 21 1 - 2 1 4 1315 Pulp, paper and paper products 59 3 4 8 20 8 1616 Printing and allied industries 9 - 1 1 1 2 417 Chemical and allied products 214 26 60 36 41 38 1318 Petroleum and coal products 24 3 3 6 9 1 219 Plastic products 43 - 4 3 3 9 2420 Rubber products 41 3 11 4 10 5 821 Leather tanning, leather products and

fur skins 34 2 4 2 9 9 822 Ceramic, stone and clay products 116 7 23 11 25 25 2523 Iron and steel 65 6 26 8 10 5 1024 Non-ferrous metals and products 56 2 14 8 16 10 625 Fabricated metal products 104 - 11 6 21 26 4026 General machinery 237 11 29 25 48 66 5827 Electrical machinery, equipment and

supplies 114 2 21 18 29 26 1828 Information and communication

electronics equipment 52 2 10 8 22 8 229 Electronic parts and devices 41 - 4 4 12 14 730 Transportation equipment 77 10 23 12 15 10 731 Precision instruments and machinery 62 2 10 4 20 16 1032 Miscellaneous manufacturing

industries 102 9 12 10 25 22 24

Commodity names Shipmentvalue Large

enterprises

Medium and small

sized enterprises

Top 3 enterprises

Top 10 enterprises H I

No. Commodity names (million yen) Share (%) Share (%) Share (%) Share (%) 091111 Chop of meat and frozen meat, except broilers 997,595 24.5 75.5 12.7 25.6 109091112 Canned, bottled and potted meat 6,869 23.5 76.5 67.7 99.0 1881091113 Meat products 729,333 60.0 40.0 33.9 53.5 525091211 Condensed milk, milk powder and skim milk powder 193,963 74.3 25.7 60.1 90.6 1461091212 Butter 78,789 89.5 10.5 72.1 94.3 2114091213 Cheese 142,500 75.6 24.4 61.8 88.7 1623091214 Processed milk 625,316 42.0 58.0 25.3 42.4 347091215 Cream (Food) 145,110 60.4 39.6 42.7 79.2 901091216 Ice cream 227,669 32.2 67.8 31.6 55.8 497091217 Milk beverage and lactic acid bacteria beverage 338,195 68.8 31.2 45.9 75.3 1004091219 Miscellaneous dairy products 338,764 64.7 35.3 45.3 66.3 1019091911 Broiler products, including cut products 447,313 32.3 67.7 16.5 37.5 203091919 Miscellaneous livestock products 198,867 13.2 86.8 20.8 41.8 280092111 Canned tuna 45,338 45.0 55.0 70.8 97.8 2496092112 Canned mackerel 5,163 9.8 90.2 33.9 86.7 849092119 Miscellaneous canned seafood and seaweed 74,745 14.2 85.8 18.1 41.1 275092211 Agar-agar 10,462 - 100.0 75.7 89.4 4688092212 Seaweed products 313,204 4.4 95.6 13.0 30.6 132092311 Fish-meat " ham " and sausage, including whale meat 32,465 77.1 22.9 58.8 96.6 1470092312 Fish paste products 421,870 21.8 78.2 17.3 31.7 172092411 Salted and dried seafood products, salted seafood products 251,325 0.1 99.9 7.0 17.4 60092511 Frozen seafood products (unprocessed and packaged) 372,877 0.5 99.5 7.7 18.8 66092611 Frozen seafood products (processed and packaged) 683,177 0.0 100.0 4.6 12.1 38

092911 Dried seafood products, boiled and dried seafood products 163,822 0.6 99.4 5.9 14.3 40

092919 Miscellaneous seafood products 1,034,426 7.2 92.8 5.0 11.1 30092921 Seafood by-products 6,775 4.8 95.2 34.3 61.6 623093111 Vegetable products in air-tight containers 56,938 0.3 99.7 11.3 27.3 133093112 Fruit products in air-tight containers 43,592 2.1 97.9 14.5 34.0 216093119 Miscellaneous products in air-tight containers 30,446 2.7 97.3 52.2 77.7 1361093121 Frozen fruit and vegetable products 45,521 0.4 99.6 24.1 50.7 385093129 Miscellaneous preserved fruit and vegetable products 237,881 19.2 80.8 14.8 29.1 147093211 Vegetables pickled or in brine, including fruits pickled or in

brine 476,133 0.7 99.3 5.6 12.8 38094111 Fermented bean paste " miso ", including miso powder 140,889 6.2 93.8 30.4 48.2 528094211 Soy sauce and edible amino acids, including soy sauce powder and

solid 239,850 50.3 49.7 41.7 56.3 976094311 Monosodium glutamate 24,871 92.9 7.1 97.9 100.0 8054094319 Miscellaneous chemical seasonings 13,478 15.5 84.5 57.7 87.3 1672094411 Worcester sauce, middle-thick sauce and thick sauce 62,873 16.4 83.6 61.3 81.6 1424094419 Miscellaneous sauces 212,576 69.2 30.8 52.9 73.3 1563094511 Vinegar 52,419 2.6 97.4 35.5 62.5 632094911 Spices, including paste spices 118,846 31.9 68.1 35.4 62.8 614094912 Roux 105,282 86.0 14.0 90.3 96.8 5090094919 Miscellaneous seasonings 790,095 40.1 59.9 20.2 37.8 264095111 Crude sugar, including syrup and muscovado 49,774 0.1 99.9 39.7 85.6 889095112 Refined sugar, including lump sugar, crystal sugar, liquid

sugar and granulated sugar (Suger processing) 94,997 94.7 5.3 94.7 100.0 3359095211 Refined sugar, including lump sugar, crystal sugar, liquid sugar

and granulated sugar (Refined sugar products) 127,149 1.1 98.9 45.9 81.4 919095311 Glucose 21,562 33.6 66.4 58.1 99.6 1498095312 Starch syrup and malt sugar 49,696 13.8 86.2 49.0 91.8 1205095313 High-fructose corn syrup 65,846 20.3 79.7 45.5 92.3 1095096111 Cleaned and polished rice, including crushed rice 758,419 2.9 97.1 15.9 32.1 172

1

Commodity names Shipmentvalue Large

enterprises

Medium and small

sized enterprises

Top 3 enterprises

Top 10 enterprises H I

No. Commodity names (million yen) Share (%) Share (%) Share (%) Share (%) 096112 Cleaned and polished rice waste 4,470 1.9 98.1 24.9 50.1 391096211 Cleaned and polished wheat and barley 15,411 - 100.0 37.5 78.0 817096212 Cleaned and polished wheat and barley waste 1,161 - 100.0 34.8 78.4 742096311 Wheat flour 394,514 65.5 34.5 60.8 77.9 1726096312 Wheat flour waste 17,379 47.7 52.3 44.5 64.4 861096911 Elephant food flour 11,818 - 100.0 30.1 64.4 606096919 Miscellaneous flour and grain mill products 84,139 5.7 94.3 13.1 30.2 143097111 Loaf of bread 357,208 68.3 31.7 55.6 69.3 1339097112 Buns, including yeast donut 652,381 60.0 40.0 45.4 62.4 1173097211 Western-style pastries and cakes 648,132 32.3 67.7 16.8 30.7 184097212 Japanese-style pastries and cakes 574,912 16.7 83.3 15.1 21.8 144097311 Biscuits, crackers and other dry bakery products 378,358 24.4 75.6 13.3 31.7 152097411 Baked rice confections 294,773 26.9 73.1 32.1 47.1 532097911 Candies 159,424 21.7 78.3 32.7 65.2 561097912 Chocolates 361,362 42.6 57.4 39.8 62.7 665097919 Miscellaneous bakery and confectionery products 530,152 34.5 65.5 28.0 43.6 387098111 Soybean oil 34,387 35.7 64.3 57.7 98.7 1566098112 Blended vegetable oils and fats 110,595 51.5 48.5 58.6 97.1 1481098113 Vegetable oil cakes 93,105 45.6 54.4 48.8 88.9 1185098119 Miscellaneous vegetable oils and fats 139,912 24.9 75.1 39.4 74.8 762098211 Fat 8,153 4.2 95.8 39.2 72.3 806098212 Lard 13,388 5.0 95.0 30.0 56.8 545098219 Miscellaneous animal oils and fats 26,156 14.0 86.0 25.7 57.2 443098311 Shortening 32,390 73.0 27.0 61.7 97.2 1537098312 Margarine 78,537 64.3 35.7 33.8 85.6 841098319 Miscellaneous edible oils and fats 80,657 82.3 17.7 58.7 95.3 1854099111 Starch 99,726 22.1 77.9 40.8 74.0 805099112 Starch bran 8,962 12.4 87.6 71.0 100.0 2286099211 Instant noodles 341,753 46.7 53.3 38.8 64.0 768099212 Japanese noodles 379,559 7.8 92.2 7.1 14.7 47099213 Western noodles 42,595 46.9 53.1 44.6 72.9 962099214 Chinese noodles 194,543 12.2 87.8 11.0 21.8 89099311 Soy bean curd, frozen and dried soy bean curd and fried bean

curd 337,531 9.3 90.7 6.8 16.7 49

099411 Sweet bean paste and related products 80,322 13.9 86.1 20.7 37.8 267099511 Precooked frozen foods 784,917 38.4 61.6 12.1 29.2 122099611 Side-dish foods 759,613 29.7 70.3 10.6 20.6 79099911 Yeast 11,355 77.9 22.1 71.3 100.0 2071099919 Miscellaneous leavening compounds 35,613 13.4 86.6 35.0 63.2 600

099921 Malt and malt extract 8,766 37.6 62.4 34.5 60.5 599099931 Wheat-gluten bread and toasted wheat-gluten bread 18,446 - 100.0 24.7 46.2 339099932 Processed ripe banana 19,157 - 100.0 53.9 76.6 1626099933 Sushi and box lunches 801,452 29.3 70.7 15.9 32.4 160099934 Cut rice cake and packaged rice cake, except Japanese

raw rice cakes 51,475 17.8 82.2 46.2 70.2 914

099935 Cooked bread and sandwich 182,935 35.1 64.9 21.2 44.0 288099936 Retort foods 218,571 40.1 59.9 15.0 35.6 205099939 Miscellaneous processed foods 1,261,605 22.9 77.1 4.8 12.3 35101111 Carbonated water 452,592 31.6 68.4 51.7 73.5 1470101112 Juice 401,030 69.3 30.7 30.3 57.6 481101113 Coffee drinks, including coffee with milk 389,022 43.4 56.6 22.8 55.4 410101114 Tea drinks 417,964 35.2 64.8 36.3 64.0 802

2

Commodity names Shipmentvalue Large

enterprises

Medium and small

sized enterprises

Top 3 enterprises

Top 10 enterprises H I

No. Commodity names (million yen) Share (%) Share (%) Share (%) Share (%) 101115 Mineral water 43,668 45.5 54.5 46.0 67.2 967101119 Miscellaneous soft drinks and carbonated water 366,830 53.7 46.3 32.1 51.9 531102111 Wines 65,364 43.1 56.9 46.8 67.7 1013102211 Beers 1,718,723 98.8 1.2 92.3 99.8 3419102311 Rice wine " sake ", including unrefined " sake " 670,249 26.8 73.2 18.5 37.7 193102312 Sake lees 5,037 11.7 88.3 10.8 23.6 83102411 Additive alcohol (alcohol for drink) (95% conversion) 25,521 80.6 19.4 77.8 94.8 2182102412 Low-class distilled spirits 475,982 34.3 65.7 34.3 61.7 584102413 Blended rice wine sake 14,784 45.8 54.2 62.1 85.4 1791102414 Whisky 141,909 97.8 2.2 97.5 100.0 7955102415 Sweet rice wine mirin, including mirin with additives 42,944 69.2 30.8 67.8 86.5 2339102416 Sparkling alcoholic beverage " happo-shu " 719,488 99.4 0.6 84.4 100.0 2988102419 Miscellaneous distilled, rectified and blended liquors 207,606 69.2 30.8 54.6 89.6 1567103111 Semi-finished green tea 63,786 - 100.0 15.7 31.4 147103112 Green tea (finished) 313,127 3.5 96.5 17.4 26.1 146103113 Brown tea (finished) 24,351 42.8 57.2 71.3 98.4 2457103211 Coffee 167,237 30.8 69.2 49.0 75.5 976104111 Artificial ice 29,969 - 100.0 14.0 27.7 138105111 Cigarettes, cigars and pipe tobacco 2,696,150 100.0 - 100.0 100.0 10000105211 Stemmed and re-dried leaf tobacco 229,187 100.0 - 100.0 100.0 10000106111 Balanced compound feeds 732,448 14.5 85.5 21.0 48.4 337106112 Pet feeds 76,220 1.3 98.7 35.2 69.6 700106211 Elemental feeds 89,834 4.9 95.1 16.3 29.0 182106311 Organic fertilizers 63,505 3.6 96.4 7.2 18.1 71111111 Machine reeled raw silk, hand reeled silk and doupion

silk 1,463 - 100.0 83.5 100.0 2719

111119 Miscellaneous silk yarn 16 - 100.0 100.0 100.0 4841112111 Pure cotton yarn, including yarn waste 62,883 35.5 64.5 53.3 77.3 1107112112 Mixed yarn, including yarn waste 8,894 67.7 32.3 57.1 86.7 1385112113 Yarn waste generated from spinning processes 414 65.6 34.4 50.5 96.4 1313112211 Pure viscose and staple yarn 1,428 48.2 51.8 64.1 97.9 2496112212 Mixed viscose and staple yarn 1,525 31.4 68.6 74.2 100.0 2130112213 Vinylon yarn, including mixed vinylon 3,343 96.9 3.1 99.7 100.0 5983112214 Pure acrylic yarn 2,984 28.6 71.4 59.8 98.0 1602112215 Mixed acrylic yarn 7,474 27.0 73.0 46.6 94.2 1156112216 Pure polyester yarn 4,761 6.4 93.6 59.7 93.0 2061112217 Mixed polyester yarn 17,715 49.2 50.8 46.9 84.4 1018112219 Miscellaneous synthetic fiber 9,376 27.0 73.0 41.7 78.9 998112311 Pure worsted yarn 16,410 30.7 69.3 41.2 86.1 920112312 Mixed worsted yarn 8,765 51.2 48.8 66.0 99.4 2325112313 Pure spun wool yarn 8,086 0.0 100.0 53.7 93.4 1283112314 Mixed spun wool yarn 5,131 1.8 98.2 68.8 95.7 1796112315 Wool yarn waste generated from spinning processes 46 83.2 16.8 93.5 100.0 6168112911 Miscellaneous spun yarns 3,548 10.3 89.7 56.0 89.7 1339113111 Sewing and twisting cotton yarn 2,404 - 100.0 33.7 70.8 652113112 Weaving raw silk yarn 1,049 - 100.0 47.7 85.6 1054113113 Miscellaneous twisting raw silk yarns 801 - 100.0 56.3 91.9 1271113114 Weaving synthetic yarns 12,657 28.5 71.5 54.4 85.1 1337113115 Miscellaneous synthetic fiber twisting yarns 7,604 4.0 96.0 30.5 64.1 550113119 Miscellaneous twisting yarns 8,285 - 100.0 48.3 70.7 1156113211 Bulky yarns 14,851 0.1 99.9 49.3 88.9 1169114111 Poplin and broadcloth 9,342 45.1 54.9 70.1 97.6 1882

3

Commodity names Shipmentvalue Large

enterprises

Medium and small

sized enterprises

Top 3 enterprises

Top 10 enterprises H I

No. Commodity names (million yen) Share (%) Share (%) Share (%) Share (%) 114112 Shirting, sheeting, grey sheeting, jeans and flannel 2,678 0.5 99.5 76.0 97.9 3266114113 Velveteen and corduroy 926 - 100.0 66.0 99.4 1771114114 Crepe 2,186 - 100.0 47.7 92.4 1118114119 Miscellaneous wide cotton fabrics 34,992 8.0 92.0 36.5 68.2 724114121 Toweling 7,819 - 100.0 41.0 67.6 771114129 Miscellaneous yarn-dyed wide cotton fabric 24,633 1.4 98.6 61.5 79.1 2537114131 White cotton cloth (bleached cotton cloth, toweling and

bathrobe cloth) 2,359 - 100.0 39.6 78.3 827

114139 Miscellaneous narrow cotton fabrics 2,758 - 100.0 21.6 44.0 298114141 Viscose and spun rayon fabric 4,873 0.8 99.2 61.8 84.7 1771114142 Yarn-dyed viscose and spun rayon fabric 624 - 100.0 72.8 99.0 3073114143 Acrylic fabric 2,839 - 100.0 45.8 78.5 1003114144 Spun polyester fabric, poplin and broadcloth 11,897 43.6 56.4 46.4 82.6 1007114145 Miscellaneous spun polyester fabric 18,875 22.3 77.7 33.3 68.0 601114149 Miscellaneous spun synthetic fabrics 24,299 10.9 89.1 42.6 70.8 849114151 Cotton, spun rayon and synthetic blanket fabric 3,251 - 100.0 34.3 70.4 659114211 Wide habutae silk, including union cloth 4,626 - 100.0 31.3 61.5 575114212 Wide silk crepes 386 - 100.0 68.7 100.0 1918114219 Miscellaneous wide silk fabrics 10,833 - 100.0 15.4 33.0 192114221 Narrow silk crepes 11,415 - 100.0 15.9 40.5 244114222 Miscellaneous yarn-dyed narrow silk fabrics 32,020 - 100.0 10.9 22.2 101114223 Miscellaneous piece-dyed narrow silk fabrics 4,791 - 100.0 21.6 55.2 398114231 Spun silk fabric 1,494 - 100.0 51.1 77.7 1148114241 Viscose and rayon fabric 2,440 - 100.0 52.5 81.6 1663114242 Cuprammonium rayon line fabric 2,624 - 100.0 65.3 93.2 2067114243 Acetate line fabric 1,181 - 100.0 59.2 98.8 1527114244 Nylon line fabric 3,610 - 100.0 36.1 80.7 777114245 Polyester line fabric 52,214 11.6 88.4 34.4 64.5 578114249 Miscellaneous synthetic line fabrics 20,757 27.2 72.8 45.2 68.1 840114251 Synthetic fiber tire cord 3,380 - 100.0 93.0 100.0 3022114311 Combed woolen fabric 74,032 28.3 71.7 30.9 60.0 590114319 Miscellaneous combed woolen fabrics 10,087 - 100.0 80.9 96.3 3224114321 Spun woolen fabric for clothe 13,721 2.5 97.5 45.3 78.7 972114329 Miscellaneous spun woolen fabrics 3,403 16.7 83.3 95.4 100.0 5712114339 Miscellaneous woolen fabrics 6,695 41.8 58.2 73.4 96.9 2440114411 Flax fabric 1,812 - 100.0 26.4 58.9 495114412 Fabric hose, synthetic flaxen fabric 827 - 100.0 100.0 100.0 4474114911 Moquette 8,059 51.6 48.4 73.3 91.8 3002114919 Miscellaneous fabrics 4,588 - 100.0 94.8 99.7 6197115111 Cotton tubular knit fabric 39,441 4.1 95.9 16.1 35.1 217115112 Synthetic tubular knit fabric 37,550 1.3 98.7 30.7 58.7 500115119 Miscellaneous tubular knit fabrics 10,451 - 100.0 34.3 68.7 665115211 Synthetic warp knit fabric 29,603 26.2 73.8 46.7 78.6 1092115219 Miscellaneous warp knit fabrics 1,196 - 100.0 64.5 95.0 1772115311 Flat knit fabrics, including semi-finished products 3,191 - 100.0 57.5 82.8 1626116111 Refined, breached and dyed cotton, rayon and flax

fabrics 33,573 72.4 27.6 60.3 91.5 1634

116112 Refined, breached and dyed spun synthetic fabrics 18,740 87.2 12.8 76.7 100.0 2534116211 Refined, breached and dyed silk and rayon fabrics 2,390 2.1 97.9 80.0 97.7 2699116212 Refined, breached and dyed synthetic line fabric,

machine dyed and finished synthetic rayon line fabric 14,781 64.5 35.5 71.0 98.5 2486

116311 Machine dyed and finished woolen and worsted fabrics X X - 100.0 100.0 10000

4

Commodity names Shipmentvalue Large

enterprises

Medium and small

sized enterprises

Top 3 enterprises

Top 10 enterprises H I

No. Commodity names (million yen) Share (%) Share (%) Share (%) Share (%) 116411 Machine finished woven fabrics 3,881 54.2 45.8 87.1 100.0 3076116511 Hand dyed and finished woven cotton fabric 8,658 62.8 37.2 70.6 81.9 4007116512 Hand dyed and finished woven silk fabric 14,039 - 100.0 37.6 65.3 639116519 Hand dyed and finished miscellaneous fabrics 2,463 45.0 55.0 65.4 88.9 2338116611 Dyed and finished quasi-cotton fibers and yarns 621 - 100.0 100.0 100.0 4202116612 Dyed cotton yarn 3,025 56.8 43.2 90.4 100.0 4068116613 Dyed synthetic yarn 3,618 - 100.0 62.7 98.3 1754116619 Dyed miscellaneous yarns 1,828 - 100.0 87.5 100.0 4884116711 Dyed and finished knit and lace 15,593 71.8 28.2 76.8 97.2 3039116811 Dyed and finished miscellaneous textiles, including napped

ones 11,908 60.3 39.7 73.4 86.3 3238117111 Synthetic fiber rope, cord and twines 23,337 9.4 90.6 26.2 53.2 394117112 Flax rope, cord and twines 1,661 - 100.0 55.6 88.5 1308117119 Miscellaneous fiber rope, cord and twines 3,862 1.7 98.3 61.1 88.5 1719117211 Nylon fishing net 10,085 - 100.0 33.7 67.0 606117212 Polyethylene fishing net 4,498 - 100.0 32.5 61.9 610117219 Miscellaneous fishing net 14,718 - 100.0 49.1 78.5 1320117911 Netting except fishing net 9,761 - 100.0 30.4 59.6 510118111 Embroidery lace fabrics 11,964 - 100.0 22.8 47.6 349118211 Knit lace fabrics 31,426 - 100.0 25.9 52.7 429118311 Bobbin lace fabrics 5,323 - 100.0 80.0 97.3 3913118411 Braids 13,733 1.6 98.4 15.5 31.2 174118511 Narrow fabrics 48,339 2.2 97.8 12.4 25.5 121118919 Miscellaneous textile goods 5,299 - 100.0 29.9 52.4 438119111 Semi-finished spun wool products 4,319 89.2 10.8 95.0 100.0 6303119119 Miscellaneous reclaimed wool 4,484 - 100.0 46.6 72.7 1092119211 Cotton for bedding, including wadding 3,742 - 100.0 20.7 47.1 318119219 Miscellaneous fiber cotton for bedding, including wadding 5,381 - 100.0 50.0 71.2 1737119311 Press felt fabric including needle, boned fabric (dry) 184,408 35.4 64.6 20.8 50.4 342119312 Press felt products 43,881 7.9 92.1 42.7 74.0 997119411 Carpets and cotton carpets 7,059 - 100.0 47.4 75.5 1039119412 Tufted carpets 84,230 12.4 87.6 32.6 69.3 645119419 Miscellaneous textile mats and similar products 90,937 39.1 60.9 46.9 72.1 872119511 Coated, water-proof fabrics 64,803 43.6 56.4 40.2 75.5 814119611 Sanitary gauze and bandage 21,231 - 100.0 57.4 84.8 1563119612 Sanitary cotton 11,857 - 100.0 49.5 87.5 1119119619 Miscellaneous textile-made medical and sanitary products 36,268 11.2 88.8 23.7 56.1 418119911 Pattern card (Jacquard card) 7,607 - 100.0 12.8 33.3 187119919 Miscellaneous textile mill products, n.e.c. X 2.9 97.1 20.0 45.9 292121111 Men's and boy's suit coats, including blazers, jackets, etc. 44,939 0.2 99.8 31.6 58.0 514121112 Men's and boy's suit trousers, including spare trousers 19,502 - 100.0 31.5 58.4 508121113 Men's and boy's overcoats 5,244 - 100.0 71.4 93.0 2539121114 Men's and boy's uniform coats and overcoats 9,220 - 100.0 31.8 72.8 657121115 Men's and boy's uniform pants 3,338 - 100.0 63.4 91.6 1558121116 Men's and boy's rubber-coated raincoats and vinyl raincoats 2,966 - 100.0 67.7 89.0 3397121211 Women's and girl's dressing and suit coats, including blazers,

jackets, etc. 60,312 - 100.0 11.2 29.0 137121212 Women's and girl's skirts and trousers 63,820 - 100.0 18.8 37.3 217121213 Women's and girl's blouses 24,293 - 100.0 22.9 39.6 385121214 Women's and girl's overcoats and raincoats 7,337 - 100.0 24.1 52.7 396121215 Women's and girl's uniforms 509 - 100.0 65.2 92.3 1756121311 Infant's outer garments 16,063 - 100.0 31.5 57.1 494

5

Shipmentvalue Large

enterprises

Medium and small

sized enterprises

Top 3 enterprises

Top 10 enterprises H I

No. (million yen) Share (%) Share (%) Share (%) Share (%) 121411 26,750 - 100.0 22.9 58.9 433121419 4,263 - 100.0 36.4 74.5 723121511 131,348 0.1 99.9 18.6 40.6 228121512 30,724 - 100.0 37.2 65.6 656121611 25,371 - 100.0 72.0 89.0 2003121612 12,893 - 100.0 66.3 85.5 2174121613 11,698 - 100.0 39.8 62.4 776121614 7,112 -

Commodity names

Commodity names Shirts Miscellaneous shirts Business, work and sanitary clothing Sport clothing Men's and boy's school uniform coats and overcoats Men's and boy's school uniform trousers Women's and girl's school uniform coats and overcoats Women's and girl's school uniform skirts and trousers 100.0 39.7 58.2 1086

122111 Knitted coats and overcoats, including blazers, jackets, etc. 17,116 - 100.0 30.0 55.6 456122112 Knitted pants, skirts and trousers 6,936 - 100.0 22.4 50.4 365122113 Infant's knitted outer garments 9,876 - 100.0 23.1 50.4 374122211 Knitted shirts and blouses 7,789 - 100.0 29.5 65.9 558122212 Knitted sport shirts and T-shirts 71,680 - 100.0 12.0 25.3 125122311 Men's and boy's knitted sweaters, cardigans and vests 18,162 - 100.0 16.8 37.9 219122312 Women's and girl's knitted sweaters, cardigans and vests 104,364 - 100.0 3.5 9.9 40122911 Knitted sport coats 32,388 - 100.0 20.8 49.4 330122912 Knitted sport pants, skirts and trousers 20,359 - 100.0 30.1 56.7 468122913 Knitted swimming wear, swimming pants and beachwear 5,514 - 100.0 60.5 92.2 1577122919 Miscellaneous knitted outer garments and shirts, including

school uniforms, working wear, etc. 3,794 - 100.0 38.2 81.4 824123111 Cotton textile underwear 8,862 - 100.0 38.8 69.3 751123119 Miscellaneous textile underwear 6,852 - 100.0 49.8 83.1 1131123211 Knitted underwear 46,076 37.5 62.5 46.6 65.9 1534123212 Knitted briefs and underpants 30,647 16.5 83.5 32.2 53.8 459123213 Knitted under-slips and petticoats 11,578 - 100.0 47.6 81.4 1086123311 Textile nightclothes, except Japanese-style nightclothes 4,287 - 100.0 41.8 74.5 871123411 Knitted nightclothes 6,156 - 100.0 64.5 88.2 1995123511 Foundation garments 58,445 3.5 96.5 28.6 58.0 482124111 Japanese-style clothes and belts, ready to wear 22,263 - 100.0 17.3 33.9 206124119 Miscellaneous Japanese-style apparel, including knitted apparel 5,687 - 100.0 44.8 65.2 1026124211 Japanese-style socks, including similar products and unfinished

products 3,130 - 100.0 57.6 87.7 1441125111 Ties, including knitted ones 1,743 - 100.0 53.4 80.8 1445125211 Scarves, neckerchiefs and mufflers, including knitted ones 6,264 - 100.0 37.5 65.8 653125311 Handkerchieves 6,867 - 100.0 44.1 81.2 1024125411 Socks 82,069 5.4 94.6 11.9 27.2 138125412 Panty-stockings 57,087 30.8 69.2 40.1 73.6 795125419 Miscellaneous hosiery 11,465 4.5 95.5 24.7 60.4 463125421 Tights 9,211 10.7 89.3 37.7 84.3 840125511 Knit gloves for apparel 3,589 - 100.0 79.2 96.6 2601125512 Knitted gloves for apparel 4,158 - 100.0 63.1 90.5 1716125513 Knitted gloves for work 20,251 - 100.0 44.8 63.3 788125519 Miscellaneous gloves 3,338 - 100.0 46.9 85.8 1104125611 Felt hats and hat bodies 2,068 - 100.0 40.2 74.1 830125612 Textile hats 16,129 - 100.0 15.2 33.5 206125619 Miscellaneous hats, including knitted ones 5,824 - 100.0 18.4 43.9 288125711 Fur apparel and apparel accessories 8,120 - 100.0 60.5 83.9 1549125911 Feather garments, including synthetic leather ones 1,365 - 100.0 43.4 90.5 1040125912 Textile footwear 4,836 - 100.0 22.1 50.0 379125913 Sanitary garments and accessories 4,541 - 100.0 28.4 64.7 553125919 Textile apparel and accessories, n.e.c., including knitted ones 18,286 - 100.0 22.7 46.8 323129111 Futon, including wool futon 68,149 - 100.0 11.0 27.5 132

6

Commodity names Shipmentvalue Large

enterprises

Medium and small

sized enterprises

Top 3 enterprises

Top 10 enterprises H I

No. Commodity names (million yen) Share (%) Share (%) Share (%) Share (%) 129112 Feather quilts 49,491 7.6 92.4 30.2 60.4 523129119 Miscellaneous bedding except blanket 74,388 - 100.0 17.8 30.9 188129211 Blankets 20,934 - 100.0 35.4 64.8 663129311 Cotton canvas products 6,499 - 100.0 17.7 37.2 214129312 Synthetic canvas products 65,036 5.7 94.3 19.1 35.1 190129319 Miscellaneous textile canvas products 6,640 - 100.0 36.0 58.3 708129411 Textile bags 18,730 9.8 90.2 37.8 61.7 814129511 Embroidery products 6,605 - 100.0 30.9 54.6 453129611 Towel, except handkerchiefs 80,390 - 100.0 17.9 35.9 207129919 Fabricated textile products, n.e.c., including knitted ones 251,428 6.0 94.0 12.1 27.6 116131111 Boards less than 7.5 cm depth of minimum cross section, with

more than 4 times width larger than depth 143,362 0.1 99.9 3.5 8.5 18131112 Lumbers less than 7.5 cm depth of minimum cross section, with

less than 4 times width larger than depth 214,391 3.5 96.5 6.0 11.9 32131113 Squares 7.5 cm or more depth and width 270,118 11.5 88.5 14.4 18.9 146131114 Lumber for boxes and packing 66,477 - 100.0 12.2 22.0 98131119 Miscellaneous sawed and planed wood 28,842 - 100.0 11.4 26.0 125131121 Wood materials from sawing and planing mills 16,493 0.2 99.8 14.2 31.3 150131122 Lumber dust 7,007 2.3 97.7 7.0 15.1 50131211 Veneer wood 30,115 5.6 94.4 26.6 47.4 368131311 Floor boards 180,756 47.3 52.7 30.9 62.9 540131411 Wood chips 71,707 4.1 95.9 9.6 18.2 64131911 Wooden shavings and chips 3,109 - 100.0 24.1 56.3 415131919 Miscellaneous special wood products 13,263 5.9 94.1 26.7 44.2 386132111 Millwork 270,962 30.2 69.8 20.4 38.0 234132211 Common plywood 185,589 3.2 96.8 20.3 44.2 308132212 Special plywood, except glued laminated timber 190,749 18.1 81.9 13.2 30.9 147132311 Glued laminated timber 109,558 7.5 92.5 18.1 38.7 219132411 Prefabricated wooden buildings and structural members for

housing 337,238 11.1 88.9 15.1 28.1 142132412 Miscellaneous prefabricated wooden buildings and structural

members 9,223 - 100.0 74.3 93.1 3313132413 Prefabricated wooden buildings 19,554 55.0 45.0 83.1 99.9 3505132511 Particle board 40,405 26.4 73.6 47.8 86.8 1093132611 High-grade decorative boards, precious woods and alcove posts 15,596 - 100.0 14.0 30.8 153133111 Bamboo, rattan and willow baskets 1,928 - 100.0 40.4 66.5 954133211 Chipping boxes 10,651 - 100.0 15.6 38.7 217133311 Wooden boxes 88,603 - 100.0 7.0 16.0 55133312 Drum frames, including wooden drums 12,239 - 100.0 25.4 52.2 429133411 Japanese and Western-style barrels 2,956 - 100.0 38.4 65.7 664133511 Wooden tubs 2,334 - 100.0 39.5 76.1 767139111 Chemical-treated wood 27,674 - 100.0 59.9 81.0 1814139211 Lasts and shoe tree 4,316 - 100.0 23.6 61.4 487139311 Cork goods 6,163 - 100.0 66.3 91.6 2102139911 Knobs, handles, grips, stocks and similar products 9,988 - 100.0 21.4 41.4 268139912 Wooden kitchenware 6,104 - 100.0 26.1 47.6 356139913 Chopsticks, wood and bamboo 4,365 - 100.0 35.2 57.0 570139914 Wooden members of apparatus 2,131 - 100.0 30.8 75.5 649139915 Wooden shoes, including wooden blocks for shoes 1,281 - 100.0 50.5 81.8 1155139916 " Magewa", "Magemono" 971 - 100.0 40.4 81.8 893139919 Miscellaneous wood, bamboo, rattan and willow products,

including painted products 110,209 3.9 96.1 7.6 18.8 62141111 Wooden desks, tables and chairs 189,363 5.9 94.1 7.0 18.0 63

7

Commodity names Shipmentvalue Large

enterprises

Medium and small

sized enterprises

Top 3 enterprises

Top 10 enterprises H I

No. Commodity names (million yen) Share (%) Share (%) Share (%) Share (%) 141112 Wooden cooking counters for sink and gas range 227,519 47.3 52.7 29.5 53.5 426141113 Cabinets 94,494 7.5 92.5 10.0 21.7 87141114 Wooden cabinets and shelves 171,199 1.9 98.1 5.6 12.5 36141115 Wooden cabinets for sound systems 12,673 4.8 95.2 29.7 64.9 548141116 Wooden beds 29,646 20.4 79.6 38.6 58.3 655141119 Miscellaneous wooden furniture, except Japanese lacquered

furniture 250,915 20.7 79.3 17.7 26.6 133141211 Metal desks, tables and chairs 167,966 32.0 68.0 21.5 50.0 313141212 Metal beds 8,104 38.3 61.7 70.8 97.2 2209141213 Automatic metal beds 24,529 99.6 0.4 99.9 100.0 9916141214 Metal cooking counters for sinks and gas range, (cabinets made

of steel) 99,431 47.9 52.1 39.0 66.8 800141215 Metal cabinets and shelves 100,996 18.2 81.8 26.8 50.5 420141219 Miscellaneous metal furniture and furnishings 72,770 34.1 65.9 33.3 49.3 783141311 Mattress for beds and box springs 31,310 50.0 50.0 59.6 85.1 1989142111 Furniture for religious purposes 49,918 - 100.0 11.2 23.3 102143111 Fittings, except metal fittings 378,120 5.9 94.1 8.9 16.8 50149111 Offices and store fixtures 196,524 27.3 72.7 22.9 38.7 256149211 Sunshades for windows and doors 59,374 21.0 79.0 66.2 92.4 1670149311 Folding screens, clothe racks, bamboo screens and screens,

including hanging scrolls and maps 9,128 - 100.0 23.2 40.6 332149411 Frames for mirrors and pictures 24,705 - 100.0 18.4 35.9 211149919 Furniture and fixtures, n.e.c. 43,768 9.0 91.0 19.1 38.8 226151111 Dissolved pulp X - 100.0 100.0 100.0 10000151112 Paper craft pulp 51,809 63.5 36.5 44.0 92.6 1061151119 Miscellaneous pulp 10,569 5.5 94.5 57.1 85.6 1375152111 Rolls of newsprint 393,439 93.3 6.7 63.6 99.5 1736152112 Non-painted printing paper 346,831 88.5 11.5 46.4 85.6 1036152113 Painted printing paper 608,259 95.9 4.1 62.2 99.1 1781152114 Special printing paper 30,889 83.8 16.2 63.5 97.9 1921152115 Information paper 130,463 86.7 13.3 63.8 97.8 1613152116 Writing paper and drawing paper 2,212 74.6 25.4 77.0 100.0 2323152117 Unbleached wrapping paper 54,786 79.5 20.5 52.9 97.2 1435152118 Bleached wrapping paper 55,347 74.7 25.3 44.0 90.5 1184152121 Sanitary paper 220,613 27.5 72.5 27.3 52.5 415152122 Shoji paper and calligraphic paper 8,903 - 100.0 21.0 45.1 323152123 Miscellaneous paper 258,507 71.9 28.1 25.5 58.4 452152211 Exterior liner board (corrugated liner board) 249,567 77.1 22.9 48.0 87.1 1138152212 Interior liner board (corrugated liner board) 9,432 44.0 56.0 84.0 100.0 2946152213 Corrugating medium liner board (corrugated liner board) 121,947 66.7 33.3 56.4 93.2 1422152214 Manila paperboard 66,343 79.0 21.0 57.1 98.9 1512152215 White paperboard 106,197 63.5 36.5 49.0 89.1 1104152216 Yellow paperboard and chip paperboard 10,293 49.5 50.5 60.6 98.3 1835152217 Colored paperboard 6,594 13.2 86.8 62.5 99.6 1745152218 Building paperboard 15,343 15.5 84.5 73.4 98.5 2690152219 Miscellaneous paperboard 37,608 52.0 48.0 37.7 79.0 805152411 Hand-made Japanese paper 3,232 - 100.0 29.5 48.8 429153111 Insulating paper and tape 9,830 49.4 50.6 63.6 92.0 1648153112 Asphalt coated paper 29,120 - 100.0 81.0 100.0 2770153113 Permeable converted paper 7,067 18.1 81.9 55.9 90.8 1432153114 Laminated paper 144,933 31.3 68.7 23.6 50.7 369153115 Paper- and textile-made bookbinding cloth 3,434 92.2 7.8 97.8 100.0 8524153119 Miscellaneous coated paper 301,812 69.6 30.4 31.8 72.1 644

8

Commodity names Shipmentvalue Large

enterprises

Medium and small

sized enterprises

Top 3 enterprises

Top 10 enterprises H I

No. Commodity names (million yen) Share (%) Share (%) Share (%) Share (%) 153211 Corrugated board (sheet) 235,021 43.7 56.3 25.1 46.0 334153311 Wall paper and sliding door " fusuma " paper 47,847 14.9 85.1 29.1 66.1 545154111 Books 3,186 43.2 56.8 65.2 93.0 2262154112 Forms for office work 20,921 35.3 64.7 40.8 69.8 806154113 Office paper bags 90,810 17.4 82.6 35.7 64.4 648154119 Miscellaneous office paper products 157,639 30.0 70.0 30.0 50.8 586154211 Notebooks 15,575 20.1 79.9 49.0 87.9 1108154219 Miscellaneous school paper products 5,260 - 100.0 53.0 81.6 1256154311 Paper products for celebration 17,021 - 100.0 23.9 50.5 358154312 Paper products for photography 24,910 11.8 88.2 29.0 56.6 464154319 Miscellaneous paper products for daily-use 10,758 1.0 99.0 64.9 82.6 2337154919 Miscellaneous paper products 149,834 5.7 94.3 21.1 46.4 284155111 Sacks for heavy weight shipping 76,238 21.3 78.7 24.9 49.7 374155211 Square bottom paper bags 64,994 40.2 59.8 35.4 58.6 570155311 Corrugated board boxes 1,190,159 28.1 71.9 17.2 26.2 151155411 Printed paperboard boxes 361,811 12.3 87.7 21.1 35.4 260155412 Simple paperboard boxes 40,321 1.6 98.4 51.1 60.5 1257155413 Pasted boxes 66,153 11.0 89.0 19.6 32.4 192155419 Miscellaneous paperboard boxes and cups 163,315 34.0 66.0 37.7 70.9 693159111 Cellophane 14,862 96.7 3.3 96.7 100.0 5708159211 Hard fiberboard 6,390 42.7 57.3 75.7 100.0 2290159219 Miscellaneous fiberboard 36,025 62.6 37.4 65.6 96.8 2072159311 Paper-made sanitary materials 9,348 14.0 86.0 68.0 98.6 1863159911 Paper diaper for adults 80,623 49.2 50.8 48.7 84.5 1077159912 Paper diaper for children 109,860 89.0 11.0 82.3 100.0 2654159919 Miscellaneous paper-made sanitary products 265,329 34.4 65.6 28.2 48.9 390159921 Paper pipes 67,708 0.5 99.5 17.6 35.2 208159922 Solid fiber and vulcanized fiber products 9,327 25.7 74.3 48.6 90.8 1145159939 Pulp, paper and paper worked products, n.e.c. X 40.6 59.4 24.5 40.2 299161111 Relief (anastatic) printing 458,446 37.1 62.9 35.4 49.1 590161112 Planograph (offset) printing 4,478,323 25.2 74.8 16.2 23.1 127161113 Intaglio (photogravure) printing 382,750 53.3 46.7 50.6 66.8 1343161114 Special printing on non-paper 628,986 30.5 69.5 23.8 41.3 299162111 Photoengraving, including phototypesetting 384,492 8.1 91.9 8.3 15.4 50162112 Photomask 118,797 43.9 56.1 79.5 94.1 2343162113 Printing types 3,856 12.9 87.1 78.3 96.7 3538162114 Stereotypes 16,718 0.8 99.2 24.6 49.0 360162115 Copper intaglio and wood engraving printing 6,511 - 100.0 31.1 71.3 642171111 Synthetic and reclaimed ammonium sulfate 11,614 100.0 - 94.2 100.0 3306171112 Ammonium and aqueous ammonia (NH3 100% conversion) 46,222 79.0 21.0 52.1 96.6 1300171113 Nitric acid (98% conversion) 19,986 94.3 5.7 72.6 100.0 2427171114 Ammonium nitrate 3,089 92.6 7.4 96.8 100.0 5223171115 Urea 8,988 86.9 13.1 96.4 100.0 6143171119 Miscellaneous ammonium fertilizers 5,462 61.3 38.7 60.6 99.8 1689171121 Lime nitrogen 4,891 85.3 14.7 100.0 100.0 7474171122 Super-phosphate 2,726 6.6 93.4 53.3 92.5 1296171123 Fused phosphate fertilizer 3,073 17.8 82.2 83.3 100.0 2820171129 Miscellaneous phosphatic acid fertilizers 6,845 - 100.0 94.5 100.0 6557171211 Chemical fertilizers 101,285 22.6 77.4 25.9 52.3 433171212 Mixed fertilizers 84,164 9.1 90.9 28.6 57.9 535

9

Commodity names Shipmentvalue Large

enterprises

Medium and small

sized enterprises

Top 3 enterprises

Top 10 enterprises H I

No. Commodity names (million yen) Share (%) Share (%) Share (%) Share (%) 171919 Miscellaneous chemical fertilizers 31,529 24.4 75.6 32.5 62.8 564172111 Caustic soda (liquid 97% conversion, solid) 111,262 84.8 15.2 52.1 82.3 1212172112 Soda ash 14,332 98.2 1.8 100.0 100.0 4875172113 Liquid chlorine 17,578 85.1 14.9 51.8 87.2 1186172114 Ammonium chloride X - X 100.0 100.0 8977172115 Hydrochloric acid (35% conversion) 19,513 81.6 18.4 37.7 73.7 938172116 Sodium chlorate 1,508 73.4 26.6 87.4 100.0 3126172117 Sodium hypochlorite 18,291 60.8 39.2 37.0 78.3 776172119 Miscellaneous soda 46,286 66.1 33.9 36.4 79.4 779172211 Zinc white 4,627 9.3 90.7 84.1 100.0 2983172212 Titanium oxide 66,783 92.6 7.4 85.7 100.0 3263172213 Ferric oxide (red oxide) 32,499 3.3 96.7 76.3 98.6 2745172214 Chrome yellow 1,155 - 100.0 100.0 100.0 6455172215 Carbon black 65,393 54.7 45.3 67.2 100.0 1911172219 Miscellaneous inorganic pigments 59,513 47.2 52.8 46.0 69.7 1143172311 Oxygen gas, including liquefied oxygen 64,491 6.2 93.8 44.9 65.3 833172312 Hydrogen gas 11,975 39.2 60.8 39.8 75.0 796172313 Dissolved acetylene 8,646 25.8 74.2 37.9 67.3 940172314 Carbonic acid gas 27,829 40.6 59.4 40.0 70.5 759172315 Nitrogen 54,982 12.4 87.6 21.6 43.4 306172319 Miscellaneous compressed and liquefied gasses 64,757 36.5 63.5 36.6 59.6 686172321 Refining of compressed and liquefied gasses purchased 10,032 24.0 76.0 66.7 97.4 1876172411 Salt 35,639 - 100.0 47.1 91.6 1156172412 Table salt, including refined salt 7,689 - 100.0 86.0 97.8 3074172413 Salt water and bittern 1,200 22.4 77.6 65.3 89.3 1902172911 Calcium carbide 4,771 66.7 33.3 100.0 100.0 5556172912 Phosphatic acid (by electric furnace) 5,229 97.0 3.0 100.0 100.0 4719172921 Sulfuric acid (100% conversion) 27,154 72.5 27.5 32.5 66.0 601172922 Aluminum sulfate 10,331 26.5 73.5 42.7 73.9 920172923 Potassium salt 38,607 88.7 11.3 73.3 92.5 2192172924 Silver nitrate 21,249 81.4 18.6 98.0 100.0 6786172925 Hydrogen peroxide 24,325 56.5 43.5 65.5 99.9 2239172926 Sodium silicate 20,829 42.3 57.7 50.7 85.0 1111172927 Sodium phosphate 6,857 20.1 79.9 72.9 100.0 2053172928 Activated carbon 35,488 39.6 60.4 51.0 85.2 1223172931 Barium salt 17,276 61.0 39.0 77.0 99.9 2358172932 Catalyst 167,630 82.8 17.2 78.3 92.0 3161172933 Ferric chloride 8,210 32.6 67.4 68.6 95.3 2110172934 Hydrofluoric acid 2,177 94.1 5.9 99.9 100.0 8884172935 Calcium carbonate 4,278 - 100.0 72.4 100.0 2321172949 Miscellaneous inorganic chemicals 443,449 36.0 64.0 8.7 23.7 123173111 Ethylene 289,624 69.1 30.9 47.8 99.6 1195173112 Propylene 159,341 68.3 31.7 38.2 97.2 1007173113 Butane and butylene produced by decomposing naphtha 81,600 88.4 11.6 84.1 100.0 4177173114 Pure benzol (petroleum) 89,329 70.5 29.5 44.8 81.7 971173115 Pure toluole (petroleum) 31,537 75.4 24.6 53.8 97.5 1373173116 Pure xylol (petroleum) 115,017 93.5 6.5 48.2 96.0 1202173117 Aromatic mixed solvent 60,639 94.2 5.8 97.0 100.0 4409

10

Commodity names Shipmentvalue

Medium and small

sized enterprises

Large enterprises

Top 3 enterprises

Top 10 enterprises H I

No. Commodity names (million yen) Share (%) Share (%) Share (%) Share (%)173211 Synthetic butanol 22,111 100.0 - 100.0 100.0 4340173212 Synthetic octanol 35,334 100.0 - 99.3 100.0 3728173213 Synthetic acetone 66,468 99.9 0.1 97.4 100.0 6638173214 Acetic acid, including synthetic acetic acid 25,116 31.1 68.9 84.3 100.0 3907173215 Ethylene oxide 44,687 90.9 9.1 90.9 100.0 3000173216 Glycol ethylene 77,528 87.6 12.4 87.6 100.0 3013173217 Propylene oxide 66,018 32.4 67.6 99.5 100.0 5081173218 Glycol propylene 10,268 99.0 1.0 87.5 100.0 2865173221 Glycol polypropylene 36,510 45.2 54.8 70.7 100.0 2079173222 Trichloroethylene 8,977 59.8 40.2 97.6 99.9 3321173223 Ethylene dichloride 13,542 51.7 48.3 99.7 100.0 3664173224 Vinyl chloride monomer 129,617 62.4 37.6 79.9 100.0 2694173225 Acrylonitrile 75,691 100.0 - 85.7 100.0 3730173226 Vinyl acetate monomer 30,363 72.1 27.9 87.0 100.0 2701173227 Melamine 17,695 100.0 - 100.0 100.0 3643173228 Butadiene 23,848 55.2 44.8 73.2 100.0 2291173231 Acetic anhydride 10,683 100.0 - 100.0 100.0 8497173239 Miscellaneous aliphatic intermediates 574,098 65.0 35.0 28.4 59.5 480173311 Ethyl alcohol (95% conversion) 28,984 - 100.0 86.8 100.0 3781173319 Miscellaneous fermented products 14,742 30.3 69.7 56.9 92.7 1328173411 Terephthalic acid and dimethyl terephthalate 153,314 90.0 10.0 93.4 100.0 4593173412 Styrene monomer 189,391 80.2 19.8 60.4 100.0 1745173413 Toluylenedi-isocyanate (T.D.I) 41,089 94.3 5.7 100.0 100.0 7384173414 Caprolactam 74,047 100.0 0.0 79.8 100.0 2589173415 Cyclohexane 15,079 82.9 17.1 87.5 100.0 4022173416 Synthetic carbolic acid 123,868 100.0 - 100.0 100.0 7699173417 Aniline 34,560 93.2 6.8 100.0 100.0 4469173418 Phthalic anhydride 8,475 62.5 37.5 87.6 100.0 2704173421 Diphenyl methane diisocyanate (M.D.I) X X - 100.0 100.0 9052173429 Miscellaneous cyclic intermediates 372,429 56.2 43.8 25.2 52.3 389173431 Direct dyes 22,410 54.6 45.4 69.5 92.2 2044173432 Disperse dye 7,361 27.8 72.2 88.1 100.0 3153173439 Miscellaneous synthetic dyes 102,568 30.7 69.3 31.8 59.9 599173441 Pigment range color 29,191 54.6 45.4 88.1 99.0 3617173442 Lake 11,651 63.3 36.7 97.3 100.0 4898173511 Phenol resin 60,177 71.2 28.8 44.8 84.6 961173512 Urea resin 5,579 73.5 26.5 71.8 98.1 2241173513 Melamine resin 11,137 52.7 47.3 45.2 92.2 1105173514 Unsaturated polyester resin 53,301 87.8 12.2 50.0 96.3 1263173515 Alkyd resin 16,910 71.0 29.0 71.1 99.9 2719173516 Polyethylene 336,622 76.1 23.9 36.5 90.0 914173517 Polystyrene 174,111 79.4 20.6 36.2 81.9 815173518 Polypropylene 271,817 81.1 18.9 53.8 98.1 1359173521 Vinyl chloride resin 181,241 75.8 24.2 64.5 92.8 1972173522 Methacrylic resin 92,785 94.1 5.9 81.4 99.9 3072173523 Polyvinyl alcohol 46,662 86.6 13.4 91.3 100.0 3301173524 Polyamide resin 112,271 93.6 6.4 57.6 95.7 1489173525 Fluorocarbon resin 56,230 64.2 35.8 77.2 100.0 2444

11

Commodity names Shipmentvalue Large

enterprises

Medium and small

sized enterprises

Top 3 enterprises

Top 10 enterprises H I

No. Commodity names (million yen) Share (%) Share (%) Share (%) Share (%) 173526 Polyethylene terephthalate 55,451 86.4 13.6 83.5 100.0 2769173527 Epoxy resin 61,190 39.1 60.9 54.6 96.8 1390173528 Polyvinyl acetate X X X 100.0 100.0 10000173531 Polyacetal X X - 100.0 100.0 8934173532 Polycarbonate 110,388 80.6 19.4 64.8 100.0 1881173539 Miscellaneous plastic 708,428 88.0 12.0 26.8 57.0 464173611 Synthetic rubber, including synthetic latex 377,322 86.5 13.5 57.9 88.6 1467173911 Formalin 7,291 57.2 42.8 51.9 92.3 1243173912 Chloro-fluoro-methane and chloro-fluoro-ethane (chloro-

fluoro-carbon) 25,009 78.3 21.7 81.2 100.0 2721173919 Miscellaneous methane derivatives 22,731 71.7 28.3 75.0 92.6 3001173921 Creosote oil 9,253 55.1 44.9 89.7 100.0 3128173922 Pitch 4,390 62.1 37.9 93.5 100.0 2968173923 Byproduct ammonium sulfate 3,636 96.4 3.6 72.6 100.0 2183173929 Miscellaneous coal-tar products 53,585 74.9 25.1 69.3 93.6 2668173931 Phthalic plasticizers 15,641 15.0 85.0 78.7 100.0 2688173939 Miscellaneous plasticizers 52,215 51.2 48.8 38.6 86.8 889173941 Organic rubber chemicals 30,075 32.6 67.4 53.1 97.4 1504173942 Citric acid, except fermented one 1,175 - 100.0 98.2 100.0 4874173943 Di-2-ethyl-hexyl phthalate X - X 100.0 100.0 10000173949 Miscellaneous industrial organic chemicals 696,590 62.9 37.1 17.1 37.6 228174112 Viscose short fiber X - X 100.0 100.0 10000174113 Cuppammonium, acetate long fiber yarn and short fiber 61,433 100.0 - 97.3 100.0 3343174211 Nylon line fiber yarn and tow fiber 72,110 79.2 20.8 71.0 100.0 2534174212 Polyester line fiber yarn 118,572 93.7 6.3 69.9 97.2 2166174213 Polyester tow fiber 45,657 65.5 34.5 67.6 99.6 1860174214 Acrylic line fiber yarn and tow fiber 81,624 88.7 11.3 74.0 100.0 2339174215 Vinylon line fiber yarn and tow fiber 22,829 94.3 5.7 100.0 100.0 7537174216 Polypropylene line fiber yarn and tow fiber 28,571 24.0 76.0 70.3 98.2 2085174219 Miscellaneous synthetic fibers 76,859 91.0 9.0 72.1 96.8 1971175111 Fatty acids (direct and hard) 4,579 41.7 58.3 63.8 99.4 1697175112 Refined fatty acids 18,164 33.7 66.3 48.1 87.3 1099175113 Hydrogenated oils (for industry and food) 7,341 48.7 51.3 75.2 100.0 2082175114 Refined glycerin 8,178 65.0 35.0 75.2 100.0 2226175115 Higher alcohol (reduced and distilled) 20,350 68.3 31.7 84.8 100.0 2703175119 Miscellaneous fat and oil products 26,395 37.8 62.2 41.1 86.4 952175211 Bath soap, including medicated and liquid soap 82,151 54.1 45.9 53.0 75.2 1136175212 Laundry soap (bar and powder) 5,302 8.0 92.0 54.2 85.9 1504175219 Miscellaneous soaps 15,365 36.3 63.7 32.7 71.3 650175221 Laundry synthetic detergents 230,471 93.1 6.9 91.0 97.3 3612175222 Kitchen synthetic detergents 48,170 58.4 41.6 66.9 90.0 1741175223 Miscellaneous household synthetic detergents 30,560 54.0 46.0 66.9 89.4 2441175224 Liquid body detergents, except liquid soap 10,484 83.4 16.6 81.5 99.8 2642175225 Industrial synthetic detergents 35,012 9.6 90.4 29.9 60.3 495175311 Anionic surface-active agents 52,627 51.9 48.1 34.3 70.6 681175312 Cationic surface-active agents 27,894 38.2 61.8 63.3 93.3 2203175313 Nonionic surface-active agents 128,653 62.5 37.5 38.8 71.5 841175319 Miscellaneous surface-active agents 61,494 36.4 63.6 37.9 78.7 851

12

Commodity names Shipmentvalue Large

enterprises

Medium and small

sized enterprises

Top 3 enterprises

Top 10 enterprises H I

No. Commodity names (million yen) Share (%) Share (%) Share (%) Share (%) 175411 Oil paints 25,641 37.5 62.5 73.0 90.3 2200175412 Lacquers 15,178 11.3 88.7 53.8 77.7 1955175413 Electrical insulating paints 43,696 44.7 55.3 49.6 80.1 1403175414 Solvent synthetic resin paints 578,579 56.5 43.5 36.7 55.6 567175415 Water synthetic resin paints 109,285 47.2 52.8 42.5 63.9 799175416 Solventless synthetic resin paints 27,383 44.4 55.6 43.7 80.5 958175417 Thinner 84,811 19.0 81.0 36.1 60.1 620175419 Miscellaneous paints and related products 84,410 31.2 68.8 33.5 55.6 615175511 Ordinary ink 210,042 74.9 25.1 44.1 79.2 937175512 Newspaper ink 21,244 79.6 20.4 71.3 100.0 2128175513 Vanish for printing ink 15,382 66.2 33.8 57.8 98.2 1458175611 Cleansers 7,915 4.0 96.0 72.6 96.0 2225175612 Waxes 34,994 3.6 96.4 55.3 81.9 1410175613 Shoe preparations 2,807 - 100.0 90.1 100.0 5522175619 Miscellaneous cleaning and scouring preparations 90,117 66.7 33.3 62.4 76.1 3044175711 Candles 12,455 - 100.0 61.6 80.4 2470176111 Medical material preparations 566,811 76.6 23.4 30.9 53.7 486176211 Medical products preparations, including preparations outside

medicines 5,837,451 69.4 30.6 16.4 37.3 214176311 Vaccine, blood serum and reserved blood 207,361 91.9 8.1 82.1 99.2 3445176411 Natural drugs and Chinese medicines 140,114 54.1 45.9 58.9 75.0 2587176511 Medical products for animals 46,512 21.3 78.7 34.4 65.8 609177111 Perfume and eau de cologne 7,777 90.7 9.3 73.3 96.6 2943177112 Foundation 127,317 74.9 25.1 54.3 79.1 1145177113 Powder 17,198 29.4 70.6 43.9 79.0 1126177114 Lip rouge, cheek rouge and eye shadow 91,758 71.9 28.1 50.5 80.6 1065177115 Creams (Cosmetics) 122,094 46.6 53.4 27.9 61.8 497177116 Lotions 194,834 58.3 41.7 33.2 65.1 608177117 Milky lotions 60,732 64.9 35.1 52.6 78.3 1195177119 Miscellaneous makeup and skin care products 179,483 46.2 53.8 42.3 65.7 822177211 Shampoo and hair rinse 225,790 59.7 40.3 56.5 77.6 1291177212 Hair restorers 16,338 69.2 30.8 62.4 88.4 2459177213 Hair lotions 76,882 73.7 26.3 51.2 84.9 1130177219 Miscellaneous hair care products 128,528 18.1 81.9 48.5 73.8 1325177919 Miscellaneous cosmetics and toilet preparations 138,817 56.3 43.7 37.3 68.5 674177921 Toothpaste 71,663 92.8 7.2 87.4 98.6 2709179111 Industrial explosives 20,772 78.5 21.5 75.5 95.7 2507179119 Miscellaneous ammunition 4,901 27.7 72.3 82.2 100.0 2803179121 Explosives for arms 12,486 92.0 8.0 96.6 100.0 4638179211 Pesticides 115,127 57.2 42.8 38.8 71.2 837179221 Disinfectants 65,499 32.2 67.8 37.4 76.8 767179229 Miscellaneous chemicals 119,855 50.5 49.5 31.2 62.9 558179311 Natural perfumes and fragrances 7,584 59.8 40.2 71.0 97.1 3153179312 Synthetic perfumes and fragrances 40,047 63.6 36.4 63.5 92.4 2268179313 Blended perfumes and fragrances 99,204 30.7 69.3 42.3 72.7 1002179411 Gelatin and glue 24,206 40.0 60.0 72.3 94.2 2230179412 Cellulosic adhesives and plastic adhesives 183,090 31.0 69.0 25.6 48.5 361179419 Miscellaneous adhesives 40,112 26.8 73.2 36.1 69.7 674

13

Commodity names Shipmentvalue Large

enterprises

Medium and small

sized enterprises

Top 3 enterprises

Top 10 enterprises H I

No. Commodity names (million yen) Share (%) Share (%) Share (%) Share (%) 179511 Photographic films, including photographic dry plate 345,861 96.7 3.3 99.2 100.0 5388179512 Photographic films with lens 48,654 84.4 15.6 99.9 100.0 6791179513 Photographic paper 85,314 99.6 0.4 99.6 100.0 5416179514 Sensitized paper (for blue print and copy) 23,450 91.4 8.6 91.4 100.0 3792179515 Sensitive material for photoengraving 31,057 85.1 14.9 71.4 94.3 2208179516 Chemicals for photography, prepared and packaged 231,043 74.6 25.4 54.0 87.3 1208179611 Natural resin products, including natural dyes 33,709 73.8 26.2 67.1 91.4 1660179612 Wood chemical products 8,016 1.0 99.0 74.0 95.4 3595179711 Reagents, except reagents for diagnosis 81,231 50.9 49.1 47.1 75.1 895179911 Dextrin, including soluble starch 23,381 - 100.0 91.7 99.8 5684179912 Bleaching agents 23,189 79.1 20.9 91.9 99.5 5869179919 Miscellaneous chemicals and allied products 993,561 53.0 47.0 16.6 36.2 187181111 Gasoline 4,137,720 98.2 1.8 61.1 95.7 1545181112 Naphtha 452,314 98.0 2.0 60.6 98.0 1660181113 Jet fuel oil 258,706 94.3 5.7 64.3 98.3 1654181114 Kerosene 690,778 97.1 2.9 55.7 95.4 1380181115 Light oil 1,022,401 97.1 2.9 56.0 94.3 1381181116 Heavy fuel oil A 727,901 96.0 4.0 62.7 94.5 1678181117 Heavy fuel oil B 771 56.4 43.6 83.1 100.0 2677181118 Heavy fuel oil C 702,447 86.9 13.1 48.6 86.7 1103181121 Lubricating oil, including grease 127,801 68.0 32.0 58.0 99.2 1563181122 Paraffin 12,733 11.9 88.1 96.9 100.0 6246181123 Asphalt 77,970 99.8 0.2 77.2 100.0 2330181124 Liquefied gas 181,930 96.5 3.5 51.9 96.5 1369181125 Stock oil for refining and mixing 167,158 100.0 - 97.2 100.0 4701181126 Petroleum gas 28,893 100.0 - 100.0 100.0 5230182111 Lubricating oils made of mineral, animal and vegetable oil

purchased 99,326 5.1 94.9 22.1 51.2 368182211 Greases made of mineral, animal and vegetable oil purchased 19,905 - 100.0 64.2 95.4 1982183111 Coke 118,998 66.9 33.1 80.9 99.9 2424183112 Fuel gasses, including blast furnace gas and coke oven gas 87,817 75.3 24.7 74.3 100.0 2433183113 Crude coal tar 9,391 55.3 44.7 66.7 100.0 1821183114 Pitch coke X X - 100.0 100.0 5913184111 Asphalt paving admixture and tar paving admixture, including

asphalt block and tar block 383,703 26.1 73.9 30.2 49.8 469189111 Briquettes and briquette balls 5,807 0.0 100.0 80.9 99.2 4708189911 Recovered sulfur 6,692 94.8 5.2 73.7 99.8 2414189919 Miscellaneous petroleum and coal products X 40.7 59.3 40.6 68.9 781191111 Rigid plastic flat plates, 0.5 mm or more thickness 50,595 34.8 65.2 34.3 63.5 640191112 Corrugated engineering plastic plates, 0.5 mm or more

thickness 13,907 52.5 47.5 65.3 99.9 1903191113 Laminated plastics 68,390 84.2 15.8 63.5 94.2 2046191114 Decorated plastic plates 16,027 72.8 27.2 84.6 99.9 3433191115 Plastic bars and rods 9,131 77.4 22.6 86.5 97.8 3536191211 Rigid plastic pipes and tubes 174,603 66.9 33.1 38.7 67.1 715191212 Plastic hoses 52,899 5.9 94.1 27.0 56.5 432191311 Plastic pipe fittings including valves and cocks 76,753 64.9 35.1 45.7 75.1 943191411 Plastic rainwater gutters and accessories 32,447 88.4 11.6 82.3 96.4 3236191419 Miscellaneous plastic profile extrusions 162,409 32.5 67.5 20.3 42.9 250

14

Commodity names Shipmentvalue Large

enterprises

Medium and small

sized enterprises

Top 3 enterprises

Top 10 enterprises H I

No. Commodity names (million yen) Share (%) Share (%) Share (%) Share (%) 191511 Fabrication of plastic plates, bars and rods, pipes and tubes,

pipe fittings and profile extrusions (cutting, fitting, painting, evaporation and plating, buffing, etc.) 85,968 6.3 93.7 7.5 18.7 67

192111 Flexible plastic film for packaging, less than 0.2 mm thickness 810,388 50.3 49.7 17.5 39.1 204192112 Miscellaneous flexible plastic film, less than 0.2 mm thickness 166,760 75.2 24.8 42.6 69.8 841192113 Rigid plastic film, less than 0.5 mm thickness 102,340 79.0 21.0 40.0 80.2 874192211 Flexible plastic sheets, 0.2 mm or more thickness 170,860 28.8 71.2 19.4 40.9 260192311 Plastic tile 30,934 38.7 61.3 64.9 96.7 1850192319 Miscellaneous plastic floor coverings 35,160 42.8 57.2 40.0 83.7 919192411 Synthetic leathers 85,239 75.3 24.7 54.1 84.9 1289192511 Fabrication of plastic film, sheets, floor coverings and synthetic

leathers (cutting, jointing, painting, evaporation and plating, buffing, etc.) 692,920 29.5 70.5 14.7 29.7 137

193111 Plastic products for automobiles 1,208,396 34.1 65.9 14.5 27.6 129193112 Plastic products for transportation equipment, except for

automobiles 32,916 14.7 85.3 28.7 51.5 416193113 Plastic products for electrical machinery and apparatus 777,490 26.9 73.1 12.1 19.7 90193119 Miscellaneous industrial plastic products 718,044 33.5 66.5 22.6 35.0 250193211 Fabrication of industrial plastic products (cutting, fitting,

painting, evaporation and plating, buffing, etc.) 235,143 18.1 81.9 18.3 30.3 182194111 Foamed plastic products, flexible and semi-rigid 364,606 33.9 66.1 15.6 32.9 169194211 Rigid foamed plastic plates, 3 mm or more thickness 99,583 34.6 65.4 24.5 49.1 346194212 Rigid foamed plastic sheets, less than 3 mm thickness 20,223 47.1 52.9 51.5 93.3 1397194219 Miscellaneous foamed plastic products, rigid 49,426 26.8 73.2 24.7 51.9 400194311 Reinforced plastic plates, bars and rods, pipes and tubes and

pipe fittings 55,111 35.9 64.1 33.9 64.6 578194411 Reinforced containers, bathtubs and sewage purifiers 164,193 36.2 63.8 17.6 39.4 223194412 Industrial reinforced plastic products 16,246 - 100.0 44.3 60.9 1157194419 Miscellaneous reinforced plastic products 32,926 0.6 99.4 28.7 51.5 448194511 Fabrication of foamed and reinforced plastic products (cutting,

fitting, painting, evaporation and plating, buffing, etc.) 141,565 15.9 84.1 17.5 34.4 203195111 Compounding plastic materials 398,359 29.9 70.1 17.3 38.3 215195112 Compounding reclaimed plastic materials 47,613 0.5 99.5 15.0 30.5 157195211 Reclaimed plastic products 11,270 0.1 99.9 13.3 35.2 198199111 Daily household articles, kitchenware, tableware and bath

articles 422,034 18.5 81.5 14.3 29.5 134199211 Plastic hollow containers 366,271 38.0 62.0 31.6 47.4 504199212 Plastic bottles for drinking water 226,691 89.0 11.0 82.0 94.1 3031199219 Miscellaneous plastic containers 477,668 29.3 70.7 26.1 38.7 275199711 Medical and sanitary plastic products 52,835 6.8 93.2 18.0 45.0 287199719 Plastic products, n.e.c. 486,160 45.8 54.2 33.2 43.4 686199819 Fabrication of finished plastic products, n.e.c. (cutting, fitting,

painting, evaporation and plating, buffing, etc.) 143,666 10.3 89.7 17.7 30.9 189201111 Tires for trucks and buses 208,339 100.0 - 90.0 100.0 4315201112 Tires for small trucks 123,510 100.0 - 80.1 100.0 3229201113 Tires for passenger car 460,226 100.0 - 83.6 100.0 2713201114 Tires for motorcycles 15,586 99.5 0.5 99.5 100.0 4975201115 Tires for special vehicles and aircraft 86,712 84.9 15.1 86.2 99.1 5159201116 Tubes for automobiles, special vehicles and aircraft 13,472 54.4 45.6 58.3 99.8 1519201211 Tires and tubes for bicycles 1,831 - 100.0 100.0 100.0 5235201219 Miscellaneous tires and tubes 4,982 52.6 47.4 82.6 98.4 3339202111 Rubber-soled spilt-toed shoes 394 5.6 94.4 75.6 100.0 2216

15

Commodity names Shipmentvalue Large

enterprises

Medium and small

sized enterprises

Top 3 enterprises

Top 10 enterprises H I

No. Commodity names (million yen) Share (%) Share (%) Share (%) Share (%) 202112 Rubber-soled cloth shoes 20,434 42.0 58.0 66.7 92.2 1674202113 Whole rubber shoes 7,694 - 100.0 56.3 92.5 1394202114 Rubber sandals and slippers, including ones made of sponge 1,022 - 100.0 88.9 100.0 3164202115 Rubber findings for footwear 15,541 - 100.0 17.6 36.1 234202211 Plastic shoes 58,629 28.1 71.9 27.6 50.3 379202212 Plastic sandals 11,944 - 100.0 21.1 48.3 325202213 Plastic slippers 1,683 - 100.0 31.2 64.0 618202219 Miscellaneous footwear and its findings 9,029 - 100.0 29.3 56.4 482203111 Conveyer rubber belts 22,314 92.1 7.9 74.6 100.0 2228203112 Flat rubber belts 11,106 97.8 2.2 99.5 100.0 9174203113 V belts including fan belts 20,457 98.1 1.9 100.0 100.0 4875203119 Miscellaneous rubber belts 44,146 79.9 20.1 75.9 93.8 3082203211 Rubber hoses 128,943 64.7 35.3 47.7 74.2 1049203311 Vibration-proof rubber 247,445 61.6 38.4 43.0 69.2 1095203312 Rubber roll 86,997 30.4 69.6 31.9 63.2 526203313 Rubber packing 288,174 22.6 77.4 17.1 29.1 190203314 Rubber pipes and tubes 14,174 65.2 34.8 57.2 86.7 1321203315 Rubber lining 12,070 29.8 70.2 30.6 58.0 497203316 Mechanical rubber plates 15,774 23.5 76.5 48.0 82.2 1123203317 Fenders 11,392 76.7 23.3 69.2 98.7 2124203318 Mechanical sponge products 44,757 28.6 71.4 39.6 64.4 933203329 Miscellaneous mechanical rubber products 543,845 45.7 54.3 19.8 33.3 290209111 Rubber coated fabric for clothing and sundry goods 915 9.8 90.2 85.5 100.0 3329209119 Miscellaneous rubber coated fabric and its products 7,216 30.2 69.8 67.9 95.5 1737209121 Rubber coated fabric products 12,289 18.6 81.4 69.6 98.7 2537209211 Medical and sanitary rubber products 39,241 39.1 60.9 48.3 78.9 1058209311 Rubber sheet for retreated tires 5,132 91.1 8.9 86.8 100.0 3739209319 Miscellaneous rubber sheet 64,051 8.0 92.0 31.9 57.6 586209411 Retreated tires 14,855 - 100.0 46.4 78.3 914209511 Reclaimed rubber 3,257 0.1 99.9 74.1 95.5 1953209911 Rubber gloves 6,702 - 100.0 57.4 93.5 1436209919 Miscellaneous rubber gloves 108,922 25.4 74.6 24.4 44.9 303211111 Adult cow instep straps 42,240 - 100.0 34.7 52.3 637211112 Small and medium sized cow instep straps 10,412 - 100.0 49.3 92.5 1125211113 Cow sole leather, including chrome sole leather 153 - 100.0 100.0 100.0 3916211114 Cow case leather, including chary leather 2,443 - 100.0 75.0 100.0 2849211119 Miscellaneous cow leather 6,857 - 100.0 44.0 76.1 943211121 Horse leather 2,303 - 100.0 58.5 97.3 1432211122 Pig leather 4,907 - 100.0 28.2 59.6 507211123 Goat and sheep leather 2,892 - 100.0 46.2 98.4 1177211129 Miscellaneous leather 2,539 - 100.0 42.1 81.4 885212111 Mechanical leather products 18,444 - 100.0 70.5 95.9 2085213111 Cut stock and findings for boots and shoes 17,201 - 100.0 19.1 38.4 259214111 Men's leather footwear, 23 cm or more length 51,609 4.8 95.2 15.7 39.3 234214112 Women's and children's leather footwear 130,930 0.5 99.5 10.3 21.5 99214113 Sport footwear 11,082 - 100.0 57.5 77.3 1667214114 Work shoes 15,408 - 100.0 55.6 97.1 1405214119 Miscellaneous leather shoes 7,861 93.4 6.6 97.4 100.0 8734

16

Commodity names Shipmentvalue Large

enterprises

Medium and small

sized enterprises

Top 3 enterprises

Top 10 enterprises H I

No. Commodity names (million yen) Share (%) Share (%) Share (%) Share (%) 214129 Miscellaneous leather footwear 3,511 - 100.0 35.4 69.5 663215111 Leather gloves and mittens for clothes, including synthetic

leather ones 5,485 - 100.0 68.6 96.9 1831215112 Leather gloves and mittens for work, including synthetic leather

ones 1,607 - 100.0 52.8 85.9 1471215113 Leather gloves and mittens for sport, including synthetic leather

ones 5,717 3.0 97.0 45.8 80.3 967216111 Leather travel luggage 1,183 - 100.0 51.1 88.8 1120216112 Leather brief cases, school bags and knapsacks 16,594 - 100.0 45.9 73.8 1176216113 Leather cases 1,357 - 100.0 38.6 84.2 871216119 Miscellaneous leather luggage 3,992 - 100.0 37.1 71.0 763216121 Plastic luggage 5,596 - 100.0 64.1 81.7 3132216122 Synthetic leather cases 8,983 - 100.0 53.5 82.4 1280216129 Miscellaneous luggage 26,466 - 100.0 18.4 40.6 239217111 Small leather cases 52,662 - 100.0 10.6 23.8 110217211 Leather handbags 39,504 - 100.0 17.2 29.7 213217212 Plastic handbags 500 - 100.0 100.0 100.0 4882217219 Miscellaneous handbags 8,323 - 100.0 22.3 45.2 319218111 Fur skins, prepared and unfinished X - X 100.0 100.0 8612219911 Leather belts for clothes 8,359 - 100.0 31.6 52.5 487219919 Miscellaneous leather products X - X 34.9 61.3 668221111 Sheet glass 2,507 100.0 - 100.0 100.0 9926221112 Special plate glass 8,342 100.0 - 100.0 100.0 3474221113 Polished plate glass 111,642 100.0 - 100.0 100.0 3597221119 Miscellaneous plate glass in integral production 169,784 100.0 - 79.6 100.0 2551221211 Laminated glass 85,789 76.4 23.6 79.2 94.0 3882221212 Reinforced glass 86,468 59.3 40.7 60.9 80.8 1667221219 Miscellaneous flat glass 94,296 25.1 74.9 23.0 45.1 330221221 Mirrors 13,716 7.4 92.6 36.3 68.8 670221311 Optical glass materials, including ones for glasses 45,102 86.7 13.3 72.9 99.8 2111221312 Glass bulbs for electric lamps, including tubes and bars 19,982 71.9 28.1 81.0 97.4 2820221313 Glass bulbs for electron tubes, including tubes and bars 148,710 96.8 3.2 98.8 100.0 5392221314 Glass tubes, bars and bulbs, except for electrical 2,308 92.3 7.7 99.3 100.0 8552221319 Miscellaneous glass processing materials 84,757 82.5 17.5 79.0 90.7 4982221411 Glass containers for drinks 103,488 79.3 20.7 71.7 96.9 2221221412 Glass containers for food and seasoning 32,888 75.2 24.8 69.4 98.5 2101221419 Miscellaneous glass containers 22,168 7.3 92.7 57.0 92.5 1529221511 Scientific glass instruments 24,529 37.6 62.4 46.5 74.2 1224221512 Ampoules 7,886 - 100.0 46.2 87.6 1013221513 Medicine bottles 15,010 13.1 86.9 43.3 78.4 864221611 Glass tableware 10,382 15.4 84.6 77.3 92.0 3056221612 Glass kitchenware and tableware 28,792 57.8 42.2 57.6 88.0 1476221711 Glass fiber (tow) and its products 77,114 19.1 80.9 54.2 85.0 1263221712 Glass fiber (line) and its products 156,365 59.8 40.2 42.5 75.7 864221713 Optical fiber strands 29,389 89.3 10.7 89.3 100.0 2946221911 Glass internal bottles for thermoses 2,711 - 100.0 98.5 100.0 3356221912 Products for lighting and signal 10,406 1.3 98.7 53.1 78.5 1540221919 Miscellaneous glass and its products 237,624 67.7 32.3 38.3 69.2 710222111 Portland cement 333,372 82.7 17.3 55.9 89.8 1566

17

Commodity names Shipmentvalue Large

enterprises

Medium and small

sized enterprises

Top 3 enterprises

Top 10 enterprises H I

No. Commodity names (million yen) Share (%) Share (%) Share (%) Share (%) 222112 Cement clinker 24,314 100.0 - 100.0 100.0 4705222119 Miscellaneous hydraulic cement 80,387 59.8 40.2 48.8 79.3 1216222211 Fresh concrete 1,561,561 0.0 100.0 2.5 4.8 9222311 Centrifugal ferrous-concrete pipes (Hume pipes) 48,196 17.0 83.0 22.5 46.6 321222312 Centrifugal ferrous-concrete poles 30,163 30.5 69.5 55.7 91.5 1377222313 Centrifugal ferrous-concrete piles 85,493 18.1 81.9 21.4 52.5 366222314 Normal concrete 6,730 - 100.0 25.6 49.5 420222315 Hollow concrete blocks 45,735 - 100.0 32.5 54.7 485222316 Concrete blocks for construction 158,563 14.3 85.7 15.2 25.8 165222317 Concrete products for roads 324,703 5.0 95.0 4.9 12.7 37222318 Prestressed concrete products 61,651 17.0 83.0 27.9 58.2 471222319 Miscellaneous concrete products 233,228 9.6 90.4 11.8 23.2 108222321 Terrazzo products 3,078 - 100.0 43.8 75.9 874222322 Prefabricated concrete housing 17,437 7.2 92.8 43.5 88.7 992222911 Asbestos cement plates 50,024 57.5 42.5 47.0 87.5 1096222912 Corrugated asbestos cement slates 6,945 14.5 85.5 55.9 95.1 1316222919 Miscellaneous asbestos cement products 26,427 37.5 62.5 78.8 99.9 2283222921 Pressed cement roofing tile 16,368 0.0 100.0 53.5 71.5 1041222922 Lumber cement products, including pulp cement flat sheets and

cement chip boards 71,300 78.7 21.3 87.9 95.9 5786222923 Cellular concrete products 64,815 91.8 8.2 90.2 99.1 2943222929 Miscellaneous cement products 154,029 63.4 36.6 38.0 63.7 662223111 Smoked roofing tile 29,335 - 100.0 15.1 34.9 192223112 Glazed and salt-grazed roofing tile 71,457 18.5 81.5 29.7 51.4 532223211 Building brick 6,112 15.0 85.0 25.7 67.4 553223311 Clay pipes, including drainpipes 3,892 - 100.0 56.3 85.0 1317223919 Miscellaneous structural clay products 6,075 4.4 95.6 23.6 49.2 353224111 Sanitary pottery, including accessories 122,451 89.3 10.7 91.3 99.5 3924224211 Japanese-style ceramic tableware 68,883 0.4 99.6 11.7 18.6 77224212 Western-style ceramic tableware 42,814 37.7 62.3 37.7 68.2 728224213 Ceramic kitchenware 4,533 - 100.0 31.7 56.6 520224311 Pottery ornaments 16,096 - 100.0 9.8 23.2 92224411 Insulators and insulating tubes 44,727 62.8 37.2 75.3 88.5 3885224412 Special porcelain electrical supplies 5,329 4.0 96.0 45.6 88.1 1136224413 Fine ceramic IC boards and fine ceramic IC packages, sintered

and unmachined 152,047 92.4 7.6 85.9 98.9 4138224419 Miscellaneous porcelain electrical supplies 30,857 46.2 53.8 48.9 84.6 1117224511 Scientific and industrial ceramic products 35,675 85.3 14.7 97.9 99.8 7375224512 Scientific and industrial fine ceramics, sintered and unmachined 34,839 50.4 49.6 46.1 75.2 947224611 Mosaic tile 23,983 - 100.0 29.3 67.0 591224612 Interior tile 17,719 62.9 37.1 81.3 98.7 4052224619 Miscellaneous tile 70,814 32.3 67.7 41.4 62.6 1093224711 Decorated pottery products 4,089 - 100.0 37.1 63.2 728224811 Preparing pottery clay 20,935 - 100.0 25.6 49.4 374224919 Miscellaneous pottery products 10,729 3.3 96.7 15.9 38.2 208225111 Clay fire bricks 36,942 63.7 36.3 60.4 89.4 1888225119 Miscellaneous fire bricks 61,618 44.1 55.9 31.9 78.1 706225211 Refractory mortars 4,059 29.5 70.5 38.4 75.7 771225212 Castable refractories 25,794 20.1 79.9 41.1 80.8 845

18

19

231121 Large and medium bar steel 53,758 62.2 37.8 61.7 96.2 1993

Commodity names Shipmentvalue Large

enterprises

Medium and small

sized enterprises

Top 3 enterprises

Top 10 enterprises H I

No. Commodity names (million yen) Share (%) Share (%) Share (%) Share (%) 225219 Miscellaneous unshaped refractorie 35,800 45.8 54.2 52.9 80.2 1248225911 Artificial refractories 26,263 42.9 57.1 45.9 85.6 1072225919 Miscellaneous clay refractories, including clay crucibles 29,052 22.0 78.0 34.2 64.5 653226111 Artificial graphite electrodes 42,247 84.8 15.2 84.8 100.0 2774226119 Miscellaneous carbonaceous electrodes 10,882 17.0 83.0 93.1 98.6 5337226211 Carbon fiber 37,504 93.8 6.2 90.2 100.0 2840226911 Carbon rods 3,115 75.6 24.4 99.2 100.0 6177226912 Carbon and graphite brushes 33,744 51.2 48.8 71.5 97.4 2632226913 Special carbon products 37,191 71.1 28.9 65.2 89.7 1749226919 Miscellaneous carbon and graphite products 48,739 29.2 70.8 28.2 65.0 534227111 Natural abrasive grains and artificial abrasives 53,426 51.9 48.1 53.8 85.9 1434227211 Vitrified grinding wheels, including silicate grinding stones 14,191 31.0 69.0 46.7 81.8 1301227212 Resinoid grinding wheels 27,600 13.1 86.9 35.0 76.7 716227219 Miscellaneous grinding wheels 19,357 43.4 56.6 59.3 82.9 2129227311 Abrasive cloth and paper 34,930 19.5 80.5 58.8 92.2 1459227919 Miscellaneous abrasive products 25,589 5.4 94.6 37.4 66.8 774228111 Crushed stones 285,887 0.3 99.7 4.7 10.5 34228211 Artificial aggregate 16,916 35.9 64.1 50.5 81.4 1155228311 Cut-stones and stoneware products 171,081 - 100.0 6.3 12.7 37228411 Diatomaceous earth and its products 8,667 6.1 93.9 45.0 77.8 921228511 Minerals and stones crushed or otherwise treated 124,266 7.1 92.9 11.9 28.5 136229111 Enameled iron kitchenware and tableware 1,503 - 100.0 93.3 100.0 3773229112 Enameled sanitary products 3,128 24.2 75.8 76.8 100.0 2294229119 Miscellaneous enameled ironware 18,822 49.5 50.5 77.5 93.9 3052229211 Cloisonne 1,228 - 100.0 38.2 74.3 786229311 Artificial jewelry, including synthetic jewelry, imitation

jewelry, artificial pearls and artificial crystal 4,073 47.0 53.0 72.0 98.8 2385229411 Rock wool, slag wool and its products 34,926 58.8 41.2 64.6 95.7 1952229511 Asbestos brake lining 5,776 19.5 80.5 85.5 99.7 3010229519 Miscellaneous asbestos products 11,472 18.1 81.9 30.4 59.4 496229611 Calcined gypsum 7,865 25.5 74.5 51.7 93.4 1206229612 Gypsum board and its products 91,544 46.4 53.6 74.1 95.2 2771229613 Gypsum plaster products 3,789 1.4 98.6 89.0 100.0 3320229619 Miscellaneous gypsum products 6,026 9.0 91.0 39.8 62.2 751229711 Raw lime 65,951 13.6 86.4 28.0 58.5 484229712 Hydrated lime 19,273 6.2 93.8 22.6 50.2 356229713 Precipitated calcium carbonate 14,456 2.3 97.7 72.4 94.5 1941229719 Miscellaneous lime products 28,373 12.2 87.8 33.2 66.3 606229811 Molds, including cores 26,764 - 100.0 11.2 28.0 130229911 Glaze 19,412 13.0 87.0 29.6 55.7 464229912 Mica plate 8,566 34.4 65.6 71.9 100.0 2160229919 Miscellaneous ceramic, stone and clay products 143,062 18.1 81.9 15.6 31.4 161231111 Pig iron and steel, manufactured by blast furnaces and rolling

facilities 71,125 54.0 46.0 83.5 100.0 3016231112 Pig iron and steel, manufactured by blast furnaces, without

rolling facilities 12,006 100.0 - 100.0 100.0 5180231113 Common crude steel 10,078 3.8 96.2 95.2 100.0 4103231114 Semi-finished common steel products 217,435 91.5 8.5 70.4 96.0 2215231115 Outer rings, bearing rings and its products 45,876 100.0 - 84.6 100.0 3051231116 Shape steel, including steel sheet piles, rim and ring covers and

sash bars 349,603 92.9 7.1 46.0 92.6 1105231117 Steel pipe materials 12,742 100.0 - 100.0 100.0 3770231118 Small bar steel 347,300 34.2 65.8 22.6 50.6 437

20

235219 Miscellaneous malleable iron castings 5,252 59.3 40.7 89.3 100.0 4029

Commodity names Shipmentvalue Large

enterprises

Medium and small

sized enterprises

Top 3 enterprises

Top 10 enterprises H I

No. Commodity names (million yen) Share (%) Share (%) Share (%) Share (%) 231122 Wire rods and bars in coil 130,749 98.6 1.4 68.6 99.6 2004231123 Medium thick sheet, 3 mm or more thickness 413,810 99.2 0.8 67.2 100.0 1842231124 Sheet steel, less than 3 mm thickness, including chrome sheets

and electrical steel sheets 45,884 98.0 2.0 98.6 100.0 6546231125 Steel strips 775,311 100.0 - 68.1 100.0 2095231126 Cold finished common steel 66,812 37.3 62.7 54.7 81.1 1694231127 Cold rolled common steel sheets, including cold rolled chrome

sheets and regenerated steel sheets 81,362 99.2 0.8 80.8 99.7 2802231128 Cold rolled common electric steel strips 125,403 100.0 - 100.0 100.0 4574231131 Cold rolled common wide steel loop in coil, less than 600-mm

width 306,740 100.0 - 86.6 100.0 2618231132 Cold finished common steel loops in coil, less than 600-mm

width 10,733 60.8 39.2 82.4 100.0 2752231133 Cold rolling formed shape steel 60,311 56.6 43.4 66.3 94.5 2023231134 Common steel wires 96,382 13.3 86.7 26.7 54.3 434231135 Hot drawn common steel pipes, except bending rolled steel

pipes 295,755 68.2 31.8 47.0 81.9 1038231136 Cold drawn common steel pipes, including regenerated drawn

steel pipes 92,414 31.8 68.2 37.0 63.7 705231137 Galvanized common steel pipes 22,548 31.9 68.1 79.1 100.0 2564231138 Special crude steel 20,557 25.8 74.2 96.8 100.0 5833231141 Semi-finished special steel products 85,941 100.0 0.0 83.3 99.4 4176231142 Tool steel 45,430 95.1 4.9 81.9 98.3 3358231143 Structural steel 328,067 96.6 3.4 45.6 91.7 1125231144 Steel for special purposes 674,369 97.9 2.1 52.2 86.8 1340231145 Cold finished special bar steel, including drill rods 106,562 29.2 70.8 33.6 66.5 637231146 Cold-rolled special steel sheets 92,743 87.4 12.6 76.3 98.0 3678231147 Cold-rolled special wide steel loops in coil, 600 mm or more

width 280,838 87.6 12.4 60.2 91.8 1732231148 Cold finished special steel loops in coil, less than 600-mm

width 115,615 85.0 15.0 61.2 97.7 1699231151 Special steel wires 137,711 65.9 34.1 40.5 83.9 921231152 Hot-drawn special pipes, except bending-rolled special pipes 218,133 94.0 6.0 86.1 108.9 2856231153 Cold-drawn special steel 82,477 74.9 25.1 60.2 93.3 1806231154 Mis roll, common and special steel 3,862 100.0 0.0 94.8 100.0 3614231159 Miscellaneous steel materials 12,901 86.9 13.1 82.0 98.2 3545231168 Iron scrap 38,152 65.1 34.9 43.6 55.9 890231211 Pig iron and steel, with electric furnaces, small blast furnaces

and regenerating furnaces, including crude iron, pure iron and basic metal X X - 100.0 100.0 10000

231311 Ferro-manganese 24,370 35.8 64.2 99.8 100.0 3861231312 Silico-manganese 2,165 29.3 70.7 100.0 100.0 5779231313 Ferro-chrome 8,204 8.1 91.9 100.0 100.0 4821231319 Miscellaneous ferro-alloys 146,571 89.8 10.2 88.5 99.6 4042231321 Quasi-ferroalloy products 2,990 20.8 79.2 96.3 100.0 5357234111 Galvanized steel sheets, including galvanized steel loops 782,037 91.0 9.0 50.9 89.3 1264234911 Tin plates 96,470 95.4 4.6 80.8 100.0 2982234912 Tin-free steel 83,972 98.6 1.4 89.7 100.0 2947234913 Wire 14,839 60.8 39.2 74.5 100.0 3916234914 Galvanized hard steel wire, including miscellaneous galvanized

iron and steel wire 13,789 6.9 93.1 39.2 95.2 992234919 Miscellaneous coated steel 113,743 90.1 9.9 64.6 93.5 1964235111 Iron castings for machinery 424,261 37.7 62.3 23.6 38.2 339235119 Miscellaneous iron castings 87,667 2.6 97.4 30.4 48.4 475235211 Malleable iron castings for machinery 36,580 39.5 60.5 58.4 94.8 1450235212 Malleable iron-cast pipe joints, including flanges 60,456 69.7 30.3 80.4 96.6 3003

21

244116 Telecommunication cable 173,911 71.0 29.0 55.2 75.3 1566

Commodity names Shipmentvalue Large

enterprises

Medium and small

sized enterprises

Top 3 enterprises

Top 10 enterprises H I

No. Commodity names (million yen) Share (%) Share (%) Share (%) Share (%) 235311 Common steel castings (unmachined), including steel-cast

pipes 57,238 41.5 58.5 31.5 56.2 491235312 Special steel castings (unmachined), including steel-cast pipes 74,347 40.2 59.8 28.7 56.6 458235411 Secondary forgings 359,078 25.2 74.8 21.8 37.5 329235511 Common steel forgings (unmachined) 11,157 67.9 32.1 80.5 100.0 3433235512 Special steel forgings (unmachined) 83,630 91.0 9.0 69.4 95.7 2877239111 Iron and steel cut products, including iron and steel cast

products 1,239,272 0.9 99.1 9.6 18.6 74239211 Iron and steel prepared products 311,739 5.0 95.0 12.6 27.5 118239311 Cast iron pipes 142,813 66.3 33.7 72.6 88.2 2867239911 Iron powder and pure iron powder 28,271 66.1 33.9 54.1 97.2 1346239919 Iron and steel products, n.e.c. X 50.3 49.7 24.1 55.7 403241111 Crude copper 136,663 100.0 - 100.0 100.0 4724241112 Electrolytic copper and straight copper, including steel billet

and cake 197,138 99.7 0.3 99.0 100.0 3727241211 Pig zinc 29,844 93.1 6.9 100.0 100.0 4410241311 Alumina (aluminum oxide) 21,862 83.1 16.9 83.1 100.0 2685241312 Aluminum hydroxide 15,166 97.9 2.1 97.9 100.0 3389241313 Pig aluminum X X - 100.0 100.0 5307241911 Pig lead 16,333 86.7 13.3 79.7 100.0 2927241912 Pig gold 157,087 99.4 0.6 85.9 100.0 2690241913 Pig silver 25,959 96.9 3.1 63.6 100.0 1846241914 Tungsten X X X 100.0 100.0 5728241929 Miscellaneous non-ferrous metals by primary smelting and

refining 199,690 80.2 19.8 53.6 84.1 1632242111 Regenerated pig lead, including type metal 8,884 3.3 96.7 52.2 86.2 1139242112 Solder and antifriction alloys 39,779 44.2 55.8 58.5 82.3 2053242211 Regenerated pig zinc and zinc alloys 9,364 1.3 98.7 39.4 76.6 774242311 Regenerated pig aluminum and aluminum alloys 418,343 12.0 88.0 27.8 53.5 407242911 Regenerated pig gold and gold alloys 21,573 19.7 80.3 48.6 93.3 1204242912 Regenerated pig silver and silver alloys 7,728 3.8 96.2 44.0 78.6 919242913 Regenerated pig copper and copper alloys 28,601 1.9 98.1 65.2 93.2 1696242919 Miscellaneous regenerated non-ferrous pig metals and non-

ferrous alloys 82,358 12.4 87.6 58.5 84.3 1404243111 Rolled and drawn copper products 206,315 83.5 16.5 49.1 84.4 1079243112 Rolled and drawn brass products 110,699 41.8 58.2 30.9 66.1 576243113 Rolled and drawn bronze products 33,918 50.7 49.3 72.9 97.8 2278243119 Miscellaneous rolled and drawn copper products, including

rolled and drawn nickel silver products 60,950 73.6 26.4 54.7 87.4 1294243211 Rolled aluminum products 608,427 80.1 19.9 50.7 94.9 1286243212 Extruded aluminum products 282,907 72.9 27.1 35.5 70.9 665243213 Aluminum foil 87,877 53.4 46.6 45.2 98.1 1219243911 Lead pipes and sheets 2,332 0.8 99.2 43.0 95.9 1118243912 Rolled zinc and zinc alloy materials, including zinc sheets and

zinc alloy sheets 3,062 57.5 42.5 89.2 100.0 4064243913 Rolled gold and gold alloy materials 52,013 24.1 75.9 76.0 99.5 2412243914 Rolled silver and silver alloy materials 10,846 13.5 86.5 63.9 100.0 1962243915 Rolled platinum and platinum alloy materials 24,931 20.0 80.0 81.4 100.0 2754243916 Rolled nickel and nickel alloy materials 43,038 83.5 16.5 81.3 99.3 2662243919 Miscellaneous rolled non-ferrous metal and alloy materials 74,004 66.5 33.5 37.4 72.1 696244111 Copper rough drawing wire 58,027 100.0 - 96.9 100.0 3636244112 Copper bare wire 127,815 63.3 36.7 40.0 79.1 849244113 Copper-clad wire 357,942 47.6 52.4 26.3 50.4 396244114 Winding 121,273 72.3 27.7 50.7 84.9 1144244115 Power cable 185,628 65.0 35.0 41.2 75.8 901

22

253221 Oil stoves 88,576 72.9 27.1 55.7 96.1 1474

Commodity names Shipmentvalue Large

enterprises

Medium and small

sized enterprises

Top 3 enterprises

Top 10 enterprises H I

No. Commodity names (million yen) Share (%) Share (%) Share (%) Share (%) 244117 Aluminum rough drawing wire 10,276 - 100.0 79.8 100.0 2570244118 Aluminum wire, except aluminum rough drawing wire 28,760 36.8 63.2 53.0 92.7 1314244211 Optical fiber cord, including core wire 9,430 52.3 47.7 84.9 100.0 2685244212 Optical fiber cable, including composite cable 182,884 93.1 6.9 70.3 92.2 2121245111 Copper and copper-base alloy castings 67,462 14.2 85.8 34.9 52.7 525245211 Aluminum and aluminum alloy castings 170,270 27.7 72.3 26.7 45.4 351245219 Miscellaneous non-ferrous metal castings ( piecework ) 35,878 25.8 74.2 49.5 80.1 1122245311 Aluminum and aluminum alloy die castings 391,514 41.1 58.9 29.2 47.9 465245411 Zinc die castings 38,611 12.2 87.8 17.6 35.1 220245419 Miscellaneous non-ferrous metal die castings 22,837 21.7 78.3 50.4 82.1 1132245511 Non-ferrous metal forgings 43,708 27.6 72.4 31.8 63.3 604249911 Copper and copper alloy powder 11,908 52.8 47.2 59.8 93.0 1827249912 Aluminum and aluminum alloy powder 20,644 59.6 40.4 76.8 93.7 3714249919 Miscellaneous non-ferrous metal and alloy powder 79,736 24.2 75.8 50.6 85.8 1191249921 Crude products of copper, lead, zinc, nickel, tin, etc. 56,391 65.1 34.9 57.8 86.8 1957249929 Miscellaneous non-ferrous metal products 129,749 72.1 27.9 39.4 75.1 893249931 Non-ferrous metal scrap 48,258 38.0 62.0 20.9 37.2 229251111 18-liter cans 62,363 1.9 98.1 26.0 54.2 457251112 Food cans 318,181 88.5 11.5 88.5 97.8 4144251119 Miscellaneous plated sheet containers 95,538 23.1 76.9 23.3 42.0 340251129 Miscellaneous plated sheet products 8,518 - 100.0 34.5 68.3 735252111 Table knives, forks and spoons, including plated sheet products 11,766 - 100.0 24.8 54.9 396252119 Miscellaneous tableware (occidental-type) 4,595 - 100.0 29.7 69.1 569252211 Edge tools for shearing steel sheets 5,410 11.7 88.3 36.3 73.5 722252212 Edge tools for plywood and wood working machines 28,111 55.6 44.4 70.7 84.0 2845252219 Miscellaneous edge tools for machinery 42,289 5.1 94.9 22.6 44.0 285252311 Hairdressing scissors 18,780 - 100.0 64.4 85.7 1860252312 Cooking knives 11,411 - 100.0 24.9 52.1 378252313 Knives 5,294 - 100.0 51.9 77.9 1130252314 Scissors 15,550 - 100.0 23.2 50.9 368252315 Artisan's tools 5,050 - 100.0 45.0 66.5 924252316 Peckers, hammers, shovels, scoops and bars, including ones for

gardening 6,302 - 100.0 50.2 79.1 1135252319 Miscellaneous edge tools, artisans' tools and hand tools 10,902 - 100.0 34.4 59.8 559252411 Work tools 55,944 12.9 87.1 23.5 45.8 349252511 Files 1,770 - 100.0 27.2 64.3 541252611 Hand saws 11,237 - 100.0 49.3 82.3 1137252612 Metal saw blades 11,991 14.6 85.4 81.4 97.2 3080252619 Miscellaneous saw blades 9,422 5.2 94.8 33.0 69.1 677252711 Agricultural machinery 8,646 - 100.0 23.0 41.3 316252712 Agricultural part tools 8,485 - 100.0 28.6 53.1 431252911 Locks and keys 74,189 39.3 60.7 50.8 68.1 1433252912 Construction hardware 184,933 6.9 93.1 11.2 24.5 106252913 Stringing hardware 93,791 13.4 86.6 26.8 50.9 393252919 Miscellaneous hardware 62,677 5.3 94.7 16.1 32.1 165253111 Metal tube fittings 171,033 0.5 99.5 9.1 25.2 120253112 Metal sanitary ware 43,666 50.9 49.1 55.8 73.2 2407253113 Plumbing accessories 96,839 35.0 65.0 43.8 62.2 1040253211 Gas ovens 60,562 70.4 29.6 71.5 97.0 3314253212 Gas bath furnaces, including ones with burners 72,860 87.3 12.7 79.9 98.2 2625253213 Gas water boilers 108,474 77.7 22.3 73.8 99.2 2316253214 Gas rice cookers 7,605 - 100.0 88.2 100.0 3048253219 Miscellaneous gas appliances, except hot air type heaters 78,260 55.6 44.4 54.9 76.5 1539

23 258112 Rivets 24,024 12.1 87.9 33.0 54.7 477

Commodity names Shipmentvalue Large

enterprises

Medium and small

sized enterprises

Top 3 enterprises

Top 10 enterprises H I

No. Commodity names (million yen) Share (%) Share (%) Share (%) Share (%) 253229 Miscellaneous oil appliances 78,932 67.7 32.3 60.7 90.5 1399253231 Parts and accessories of gas and oil appliances 220,191 34.2 65.8 27.6 47.0 357253311 Hot air heating systems of heat exchanger type 10,237 30.5 69.5 57.7 89.3 1487253312 Water boilers 17,482 39.4 60.6 41.0 81.3 916253313 Radiators and unit heaters 10,253 0.2 99.8 41.6 83.1 925253911 Heating and cooking apparatus 13,996 - 100.0 62.1 83.8 1477253912 Solar systems 8,348 30.0 70.0 45.3 89.4 1053253919 Miscellaneous parts of heating and cooking apparatus 12,445 - 100.0 28.6 53.5 529254111 Steelworks 830,290 10.6 89.4 7.0 13.6 41254112 Light weight steelworks 55,647 8.4 91.6 19.4 38.7 207254113 Bridges 604,792 65.1 34.9 16.3 42.1 274254114 Steel towers 50,661 39.5 60.5 32.1 72.6 649254115 Flood gates 121,939 35.1 64.9 25.6 49.4 359254119 Miscellaneous fabricated construction-use metal products 733,894 24.0 76.0 10.1 21.1 72254211 Aluminum sashes for housing 439,419 75.1 24.9 58.7 75.6 1384254212 Aluminum sashes for building 318,877 65.2 34.8 41.7 67.1 756254219 Miscellaneous aluminum sashes 30,800 9.0 91.0 20.9 36.8 266254221 Aluminum doors 61,646 66.1 33.9 61.4 82.0 2287254222 Metal sashes and doors 210,667 18.1 81.9 18.2 32.0 204254223 Shutters 83,123 64.3 35.7 63.7 83.8 1649254224 Metal laths 9,734 - 100.0 56.0 89.7 1379254225 Architectural sheet metal products 148,712 11.7 88.3 11.3 26.5 114254226 Steel structural prefabricated housing 300,768 86.2 13.8 85.3 96.1 2642254227 Unit houses 33,655 3.1 96.9 25.7 52.0 385254229 Miscellaneous prefabricated architectural metal products 786,655 26.1 73.9 10.5 21.8 79254311 Sheet metal tanks 87,324 3.6 96.4 13.8 26.9 132254312 High pressure containers (bombs) 36,959 19.2 80.8 41.7 78.3 872254313 Drum cans 43,932 1.3 98.7 60.7 89.6 1475254314 Containers 19,737 11.0 89.0 55.9 78.5 1445254319 Miscellaneous fabricated plate and sheet metal products 759,466 5.1 94.9 3.6 8.3 15255111 Aluminum machinery parts, without machine finishing 47,203 1.9 98.1 19.4 41.1 258255112 Aluminum kitchenware and tableware 25,919 - 100.0 28.6 58.9 483255113 Aluminum beverage cans 268,801 92.5 7.5 76.5 100.0 2550255119 Miscellaneous stamped and pressed aluminum and aluminum

alloy products 122,444 57.2 42.8 39.8 63.2 845255211 Stamped and pressed machinery parts, without machine

finishing 680,216 7.2 92.8 6.6 12.8 39255212 Bottle caps 12,883 14.2 85.8 30.8 72.1 618255219 Miscellaneous stamped and pressed metal products 184,732 7.0 93.0 8.6 21.5 82255311 Powder metallurgy products 221,292 64.4 35.6 38.7 66.1 718256311 Engraved metal products 8,574 - 100.0 27.4 52.1 428256511 Heat treated metals 35,581 39.9 60.1 43.5 70.8 966256919 Miscellaneous treatment of metal surface 156,298 37.4 62.6 33.8 53.4 604257111 Round iron nails 3,680 - 100.0 46.0 80.3 1011257112 Special iron nails 22,760 18.0 82.0 43.9 83.0 961257119 Miscellaneous nails 4,438 7.9 92.1 71.2 96.7 3398257911 Iron wire gauze, including welded wire gauze and wire-

cylinders 153,261 15.2 84.8 23.0 33.5 275257912 Non-ferrous metal wire gauze 1,946 9.6 90.4 40.1 85.9 916257913 Steel rope, including steel strand 84,810 53.7 46.3 49.9 71.6 929257914 Steel strand for prestressed concrete 17,505 77.9 22.1 77.9 100.0 2443257915 Welding rod 46,250 76.5 23.5 84.1 97.0 3533257919 Miscellaneous fabricated wire products 143,019 23.4 76.6 21.2 41.9 273258111 Bolts and nuts 518,846 15.5 84.5 16.5 30.8 172

24

263122 Shovel trucks 13,487 100.0 - 100.0 100.0 6074

Commodity names Shipmentvalue Large

enterprises

Medium and small

sized enterprises

Top 3 enterprises

Top 10 enterprises H I

No. Commodity names (million yen) Share (%) Share (%) Share (%) Share (%) 258113 Washers 21,682 - 100.0 38.4 58.4 850258114 Wood screws, machine screws and set screws 80,387 18.1 81.9 20.8 38.6 262258119 Miscellaneous products related to bolts, nuts, etc. 97,413 14.8 85.2 14.9 32.5 170259111 Safes 21,934 43.2 56.8 79.9 97.2 2790259112 Parts, fittings and accessories of safes 847 0.3 99.7 60.0 85.5 1348259211 Laminated springs 25,458 69.1 30.9 57.9 99.8 1607259212 Helical springs 34,574 65.1 34.9 61.5 77.6 1325259213 Wire springs 157,510 32.5 67.5 25.2 39.1 341259214 Flat springs 92,632 42.1 57.9 32.3 56.0 542259219 Miscellaneous springs 67,460 41.4 58.6 37.1 63.9 645259911 Metal packing and gaskets, including ones combined with non-

metal 132,361 45.2 54.8 54.0 76.4 1548259912 Metallic nameplates 58,713 - 100.0 22.0 40.0 260259913 Flexible tubes 24,216 3.7 96.3 31.4 61.9 542259914 Metallic extruded tubes 15,565 52.3 47.7 68.6 98.2 2201259915 Metallic foil, stamped 4,952 - 100.0 37.3 73.3 768259919 Fabricated metal products, n.e.c. 152,980 6.3 93.7 9.7 22.7 97261111 Smoke tube boilers 6,010 - 100.0 60.8 99.9 1667261112 Water tube boilers 123,804 93.9 6.1 92.3 99.2 4148261119 Miscellaneous boilers, except hot water boilers 40,291 87.2 12.8 88.3 98.1 6186261121 Parts, fittings and accessories of boilers 176,432 83.6 16.4 81.3 88.6 4072261211 Steam turbines 180,704 97.1 2.9 91.3 100.0 3308261219 Miscellaneous turbines 120,994 97.3 2.7 79.9 97.4 2294261221 Parts, fittings and accessories of steam engines, turbines and

water wheels 320,464 95.6 4.4 91.5 96.6 5568261311 General gasoline and oil engines, including general gas engines 131,788 94.1 5.9 72.8 97.0 2265261312 General diesel engines 201,513 100.0 0.0 68.9 99.0 1923261313 Parts, fittings and accessories of internal combustion engines 127,663 63.9 36.1 41.4 66.0 815261911 Nuclear power reactors, and parts, fittings and accessories 388,161 98.5 1.5 89.4 99.0 3291261919 Miscellaneous engines and turbines 18,051 97.3 2.7 98.1 100.0 8101262111 Power cultivators, walking tractors, including walking tractors

without engines and garden tractors 31,847 51.3 48.7 52.2 99.1 1293262112 Agricultural tractors 235,403 91.0 9.0 79.0 100.0 3781262119 Miscellaneous ground leveling equipment 24,518 1.9 98.1 57.2 85.2 1584262121 Sprinklers and distributors 24,491 16.3 83.7 42.1 76.4 831262122 Rice planting machines 43,027 62.2 37.8 81.7 100.0 3073262129 Miscellaneous equipment for culture and control 92,565 32.2 67.8 23.5 58.6 434262131 Agricultural dryers 35,827 15.9 84.1 54.2 95.0 1344262132 Combined harvesters and threshers 104,971 98.0 2.0 81.2 100.0 2918262139 Miscellaneous harvesters and threshers 70,191 29.4 70.6 36.2 68.8 695262141 Feed equipment 9,607 - 100.0 39.6 68.7 754262149 Miscellaneous agricultural machinery and equipment 25,931 5.8 94.2 25.8 56.6 455262151 Parts, fittings and accessories of agricultural machinery and

equipment 138,764 8.7 91.3 13.6 27.8 129262152 Parts, fittings and accessories of agricultural tractors 61,872 13.3 86.7 49.3 69.7 1253263111 Shovel excavators 459,762 94.9 5.1 66.7 95.7 1843263112 Excavators, except shovel excavators 60,259 66.2 33.8 51.8 85.1 1254263113 Construction cranes 74,816 59.5 40.5 75.6 98.7 2101263114 Ground leveling machines 23,571 48.1 51.9 62.1 90.6 1586263115 Asphalt paving machines 18,003 68.7 31.3 58.8 99.5 1711263116 Concrete machines 33,574 30.3 69.7 37.3 75.0 752263117 Machine for foundation work 16,235 18.9 81.1 51.9 80.2 1283263118 Drills 10,947 34.1 65.9 68.7 94.8 2083263121 Construction tractors 84,107 92.6 7.4 100.0 100.0 4367

25

265413 Parts, attachments and accessories of dyeing and finishing 6,638 - 100.0 32.1 55.5 550

Commodity names Shipmentvalue Large

enterprises

Medium and small

sized enterprises

Top 3 enterprises

Top 10 enterprises H I

No. Commodity names (million yen) Share (%) Share (%) Share (%) Share (%) 263131 Rock drills 20,348 44.3 55.7 76.5 97.3 2367263132 Crushers 37,073 46.4 53.6 46.4 71.3 981263133 Mills and separators 9,188 42.2 57.8 40.0 76.2 811263134 Auxiliary machinery of crushers, mills and separators 22,216 14.9 85.1 39.9 65.2 800263139 Miscellaneous machinery and equipment for construction and

mining 112,204 76.7 23.3 74.9 89.8 4279263141 Parts, fittings and accessories of machinery and equipment for

construction and mining 318,532 24.6 75.4 15.1 28.1 138263142 Parts, fittings and accessories of construction tractors 46,469 74.8 25.2 74.8 91.8 2384264111 Numerically controlled lathes 176,903 66.8 33.2 38.3 71.4 699264119 Miscellaneous lathes 7,885 28.1 71.9 43.7 72.9 884264121 Drilling machines 10,992 75.1 24.9 90.7 98.7 5542264122 Boring machines 11,076 72.8 27.2 78.1 100.0 2410264123 Milling machines 11,375 53.1 46.9 47.8 86.8 1095264124 Grinding machines 77,726 51.4 48.6 30.2 57.8 492264125 Gear cutting machines and gear finishing machines 15,005 60.4 39.6 73.5 99.2 2545264126 Special purpose machines 170,733 49.8 50.2 29.2 48.4 411264127 Machining centers 194,775 74.1 25.9 36.6 71.2 687264129 Miscellaneous metal machine tools 243,654 42.9 57.1 27.3 50.8 369264211 Rolling mills and auxiliary equipment 23,197 57.0 43.0 57.3 84.0 1912264212 Washing and finishing devices 33,843 15.9 84.1 28.9 53.7 432264213 Bending machines 19,485 6.1 93.9 24.9 59.1 447264214 Hydraulic presses 22,527 32.2 67.8 45.3 84.1 1072264215 Mechanical presses 95,604 72.6 27.4 45.4 74.0 1040264216 Shearing machines 14,684 2.8 97.2 51.7 82.1 1301264217 Forging machines 13,906 - 100.0 50.6 87.0 1125264218 Wire forming machines 40,859 24.3 75.7 34.8 67.5 730264221 Gas welding and melting machines 14,279 - 100.0 72.6 98.3 2037264229 Miscellaneous metal working machinery 87,399 29.3 70.7 20.9 42.0 263264311 Parts, fittings and accessories of metal working machines 363,211 19.7 80.3 8.0 19.1 58264312 Rolls for metal rolling 40,210 65.6 34.4 47.9 75.1 1049264313 Parts, fittings and accessories of machine tools 146,542 5.8 94.2 6.2 15.0 40264411 Special steel cutting tools 104,647 54.6 45.4 42.7 62.2 744264412 Carbide tools, except powdered and metallic carbide tools 159,561 50.0 50.0 25.8 56.6 397264413 Diamond tools 72,069 38.6 61.4 34.0 66.4 586264414 Pneumatic tools 50,111 34.3 65.7 38.9 72.1 866264415 Power tools 149,318 82.6 17.4 77.2 91.7 3610264416 Fixtures and accessories for metal machining 81,843 4.5 95.5 12.7 24.6 110264419 Miscellaneous machinists' precision tools 22,828 40.6 59.4 43.3 67.8 798265111 Machinery for man-made fiber 18,831 56.3 43.7 84.4 98.1 2441265112 Fine spinning machines 7,017 99.2 0.8 99.2 100.0 5074265119 Miscellaneous machines related to spinning 15,981 39.8 60.2 43.2 73.7 850265211 Weaving machinery for air jet loom and water jet loom 54,737 99.7 0.3 99.9 100.0 5204265219 Miscellaneous weaving machinery 4,020 32.3 67.7 59.9 95.9 1679265221 Knitting machinery 47,295 67.1 32.9 93.4 99.7 4952265229 Miscellaneous knitting machinery 12,886 - 100.0 81.1 98.6 4557265231 Preparation machinery for textiles 8,024 53.2 46.8 79.2 99.3 3290265311 Dyeing and printing machinery 10,432 29.2 70.8 68.8 94.6 1891265312 Finishing machines 7,240 - 100.0 47.5 88.1 1064265319 Miscellaneous dyeing and finishing machinery 6,339 8.7 91.3 69.0 89.5 2033265411 Parts, attachments and accessories of machinery for manmade

fiber and spinning machine 33,660 1.6 98.4 26.8 48.9 384265412 Parts, attachments and accessories of weaving and knitting

machinery 38,032 18.9 81.1 32.0 52.7 496

26

18,516 6.6 93.4 38.6 72.1 749266919 Miscellaneous industrial special machinery and equipment 367,576 38.4 61.6 11.7 29.1 135

Commodity names Shipmentvalue Large

enterprises

Medium and small

sized enterprises

Top 3 enterprises

Top 10 enterprises H I

No. Commodity names (million yen) Share (%) Share (%) Share (%) Share (%) machinery

265511 Household sewing machinery 27,156 44.8 55.2 63.0 100.0 1821265512 Industrial sewing machinery 71,314 58.3 41.7 67.1 94.6 1684265519 Miscellaneous sewing machinery and equipment 7,438 22.9 77.1 48.0 81.8 1083265521 Parts, attachments and accessories of sewing machinery and

equipment 59,063 22.5 77.5 20.8 49.4 321265522 Sewing machinery,woolen yarn hand knitting machines, and

parts, attachments and accessories 729 14.3 85.7 88.5 100.0 3911266111 Grain treating machinery and equipment 50,297 1.2 98.8 44.7 68.4 959266112 Bread and confectionery making machinery and equipment 47,057 - 100.0 34.4 54.8 639266113 Brewing machinery 12,138 2.1 97.9 41.6 76.9 961266114 Milk processing and diary product manufacturing machinery

and equipment 14,514 1.4 98.6 54.7 90.7 1677266115 Meat and seafood products manufacturing machinery 27,631 0.7 99.3 24.1 48.6 364266119 Miscellaneous food processing machinery 92,879 6.1 93.9 18.1 40.7 229266121 Parts, attachments and accessories of food processing

machinery 68,502 - 100.0 46.8 51.9 1891266211 Lumber sawing machinery 4,555 - 100.0 61.1 87.1 1563266212 Woodworking machinery 28,529 0.9 99.1 32.4 60.9 555266213 Plywood working machinery, including fiber board working

machinery 11,515 10.8 89.2 43.5 83.7 959266214 Parts, attachments and accessories of lumber sawing,

woodworking and plywood working machinery 11,492 - 100.0 12.5 33.0 168266311 Pulp manufacturing machinery and equipment 9,514 3.2 96.8 58.7 85.2 1431266312 Paper machinery 5,249 - 100.0 66.9 100.0 2117266319 Miscellaneous paper machinery 19,969 - 100.0 51.9 73.2 1586266321 Parts, attachments and accessories of pulp and paper machinery 51,399 30.4 69.6 36.9 54.3 562266411 Printing machinery 233,669 56.1 43.9 46.4 75.7 885266412 Bookbinding machinery 31,899 - 100.0 37.0 63.5 785266413 Paper covering machinery 45,475 26.7 73.3 41.6 71.6 831266414 Engraving machinery 44,503 82.0 18.0 82.0 97.3 4401266415 Parts, attachments and accessories of printing, bookbinding and

covering machinery 106,172 24.8 75.2 32.9 43.5 690266511 Die cast machinery 21,641 93.0 7.0 93.0 100.0 3383266519 Miscellaneous foundry equipment 26,505 43.0 57.0 43.4 73.4 845266521 Molds and molding boards, restricted to ones for iron and steel

industries 8,420 11.2 88.8 51.1 89.3 1180266522 Parts, attachments and accessories of foundry equipment 17,601 44.2 55.8 43.4 64.3 879266611 Injection molding machinery 139,951 82.8 17.2 45.5 87.4 1026266612 Extruders 46,518 74.9 25.1 58.9 91.1 1453266619 Miscellaneous plastic working machinery and auxiliary

equipment, including manual types 103,881 13.1 86.9 27.2 51.3 381266621 Parts, attachments and accessories of plastic working

machinery and auxiliary equipment 77,406 31.3 68.7 18.3 36.3 227266711 Treatment equipment for wafer process (electronic circuit

forming) 445,814 87.4 12.6 48.8 81.3 1049266712 Assembly equipment 96,762 43.7 56.3 35.0 60.6 602266719 Miscellaneous semiconductor manufacturing equipment 175,638 73.1 26.9 64.7 76.9 2429266721 Flat panel and display manufacturing equipment 294,305 76.8 23.2 33.6 71.9 677266722 Parts, attachments and accessories of semiconductor

manufacturing equipment, including flat panel and display equipment 306,245 34.4 65.6 19.9 31.9 187

266811 Vacuum pumps 40,457 38.8 61.2 42.0 72.8 824266819 Vacuum equipment 52,630 23.1 76.9 51.5 81.7 1070266821 Parts, attachments and accessories of Vacuum equipment 20,429 0.2 99.8 15.4 34.5 197266911 Rubber industrial machinery and equipment 42,340 41.4 58.6 41.4 71.6 782266912 Glass industrial special machinery

27

267822 Chemically treated environment protecting equipment 109,895 39.4 60.6 29.5 62.9 517

Commodity names Shipmentvalue Large

enterprises

Medium and small

sized enterprises

Top 3 enterprises

Top 10 enterprises H I

No. Commodity names (million yen) Share (%) Share (%) Share (%) Share (%) 266929 Parts, attachments and accessories of miscellaneous industrial

special machinery and equipment 61,289 12.9 87.1 11.0 26.3 118267111 Single-stage centrifugal pumps, including turbine pumps 63,730 49.5 50.5 36.2 65.1 678267112 Multistage centrifugal pumps, including turbine pumps 31,292 45.6 54.4 54.8 90.6 1346267113 Corrosion resisting pumps (special pumps for chemical

industry) 30,809 46.0 54.0 50.8 78.1 999267114 Household pumps 22,627 63.7 36.3 61.4 98.2 1595267119 Miscellaneous pumps 273,701 61.5 38.5 47.8 70.9 1532267121 Parts, attachments and accessories of pumps and pumping

equipment 114,417 58.3 41.7 43.9 68.5 801267211 Reciprocating compressors 85,346 81.2 18.8 81.5 93.3 5070267212 Rotary compressors 67,091 89.7 10.3 76.3 98.3 2333267213 Centrifugal compressors and axial compressors 20,817 92.1 7.9 79.1 100.0 2712267214 Centrifugal blowers 41,307 37.0 63.0 39.6 69.7 811267215 Axial blowers 8,894 29.7 70.3 31.9 73.4 675267219 Miscellaneous blowers 34,318 9.3 90.7 36.9 72.0 707267222 Parts, attachments and accessories of air compressors, gas

compressors and blowers 92,414 54.3 45.7 39.8 57.0 640267311 Elevators 194,672 86.6 13.4 78.4 96.3 2445267312 Escalators, including automatic-moving sidewalks 31,923 86.9 13.1 92.3 100.0 3593267313 Parts, attachment and accessories of elevators and escalators 89,277 6.9 93.1 21.6 40.2 264267411 Overhead travelling cranes 25,261 40.7 59.3 34.8 62.2 562267419 Miscellaneous cranes 71,455 48.8 51.2 36.4 67.5 628267421 Winding machines 58,640 38.6 61.4 37.4 65.6 681267422 Conveyers 216,835 22.2 77.8 16.6 34.3 176267429 Miscellaneous conveyers and conveying equipment 256,800 64.5 35.5 46.5 71.3 1050267431 Parts, attachments and accessories of conveyers and conveying

equipment 99,243 12.8 87.2 11.3 22.3 86267511 Transmissions 165,707 65.3 34.7 35.1 60.1 687267512 Gears, including plastic gears 114,905 8.3 91.7 17.2 40.6 221267513 Roller chains 46,941 58.6 41.4 65.8 96.2 1945267519 Miscellaneous power transmissions 121,184 58.8 41.2 41.1 69.2 879267521 Parts, attachments and accessories of power transmissions 101,924 66.5 33.5 60.7 76.1 1863267611 Industrial furnaces and ovens 83,562 64.6 35.4 64.6 83.9 2697267612 Parts, attachments and accessories of industrial furnaces and

ovens 15,883 3.7 96.3 27.8 52.2 401267711 Hydraulic pumps 58,834 79.0 21.0 52.6 82.0 1278267712 Hydraulic motors 35,615 86.0 14.0 56.8 98.7 1480267713 Hydraulic cylinders 58,718 36.2 63.8 38.3 59.3 1002267714 Hydraulic valves 70,471 60.5 39.5 36.2 71.4 674267719 Miscellaneous oil hydraulic equipment 54,568 39.6 60.4 27.9 56.1 441267721 Parts, attachments and accessories of hydraulic equipment 91,053 32.4 67.6 23.2 41.2 292267722 Pneumatic equipment, including pneumatic unit equipment 215,580 90.1 9.9 81.4 91.8 4481267723 Parts, attachments and accessories of pneumatic equipment 30,488 10.7 89.3 32.1 51.8 560267811 Filters 72,156 12.9 87.1 22.9 44.7 350267812 Separators 56,416 63.8 36.2 67.8 88.0 3053267813 Heat exchangers, including partial condensers and heat

converters 64,938 37.9 62.1 28.1 56.2 441267814 Mixers, agitators, kneaders, dissolvers, granulators, emulsifiers

and crushers 57,670 6.3 93.7 24.9 55.8 406267815 Reactors, generators, carbonizers and electrolytic cells 35,365 22.4 77.6 39.1 72.6 748267816 Evaporators, distillers, digesters and crystallizers 12,240 51.7 48.3 52.3 85.4 1564267817 Dryers 29,151 29.5 70.5 44.0 71.0 946267818 Dust collectors 70,334 40.3 59.7 30.0 54.4 453267821 Tanks for chemical equipment 69,807 30.4 69.6 46.5 68.1 904

28

269612 Molds for forging 44,181 31.5 68.5 31.3 51.3 491

Commodity names Shipmentvalue Large

enterprises

Medium and small

sized enterprises

Top 3 enterprises

Top 10 enterprises H I

No. Commodity names (million yen) Share (%) Share (%) Share (%) Share (%) 267829 Miscellaneous chemical machinery and its equipment 214,350 59.1 40.9 48.9 61.8 1510267831 Parts, attachments and accessories of chemical machinery and

its equipment 150,579 21.5 78.5 16.6 34.4 176267911 Heavy oil and gas combustion chambers, including light oil

combustion chambers 15,050 16.3 83.7 39.8 79.7 863267919 Miscellaneous general industrial machinery and equipment 497,799 39.7 60.3 17.9 31.4 176267929 Parts, attachments and accessories of miscellaneous general

industrial machinery and equipment 464,384 28.6 71.4 14.7 26.9 118268111 Computers 20,052 99.1 0.9 100.0 100.0 7917268112 Electrostatic indirect copying machines 35,176 82.3 17.7 74.7 100.0 2980268113 Digital copying machines 418,261 91.5 8.5 52.9 95.8 1275268114 Full color copying machines 106,236 99.5 0.5 90.9 100.0 3637268115 Cash registers 22,324 55.7 44.3 67.2 99.0 1763268116 Word-processors X X - 100.0 100.0 9816268119 Miscellaneous office machines 392,571 74.7 25.3 36.4 62.3 664268121 Parts, attachments and accessories of office machines 962,166 55.5 44.5 21.2 44.7 295268211 Refrigerators 303,325 92.2 7.8 65.0 86.7 2553268212 Showcases for refrigeration, including refrigerating display

racks 110,365 76.5 23.5 49.4 80.7 1040268213 Air conditioners, except window and separate types 349,687 89.6 10.4 70.5 93.5 2424268219 Miscellaneous applied refrigerators 66,687 58.5 41.5 41.1 71.4 790268221 Cooling towers 16,936 8.4 91.6 70.7 98.1 2287268222 Refrigerating equipment 80,629 71.5 28.5 60.7 81.1 1568268223 Parts, attachments and accessories of refrigerators and air

conditioning apparatus 143,732 14.9 85.1 18.3 39.9 228268311 Pinball machines and slot machines 675,168 11.2 88.8 36.9 77.6 765268312 Game machines for amusement centers 24,387 0.3 99.7 66.8 90.4 1715268313 Recreation machines for amusement parks 3,697 0.9 99.1 82.5 99.1 4709268319 Miscellaneous recreation machines 804 - 100.0 88.2 100.0 3014268329 Parts, attachments and accessories of recreation machines 187,468 2.5 97.5 28.8 54.6 433268411 Vending machines 170,280 91.9 8.1 51.8 90.3 1279268419 Parts, attachments and accessories of vending machines 43,402 25.3 74.7 24.2 48.9 349268911 Industrial washing machinery 24,373 5.7 94.3 25.6 64.1 507268912 Automobile maintenance and servicing machines 65,445 18.1 81.9 34.2 67.8 632268913 Household elevators X - X 100.0 100.0 5018268919 Miscellaneous office, service industry and household machines 202,799 50.3 49.7 21.8 57.7 395268929 Parts, attachments and accessories of miscellaneous office,

service industry and household machines 92,520 17.8 82.2 38.2 57.0 582269111 Fire extinguishing equipment and its apparatus, including

equipment for fire engines 48,711 23.0 77.0 48.3 89.7 1186269112 Parts, attachments and accessories of fire extinguishing

equipment and its apparatus 17,138 6.1 93.9 33.1 59.3 517269211 High temperature and high pressure valves 44,047 17.7 82.3 37.5 74.1 772269212 Automatic regulating valves 108,590 27.4 72.6 29.8 61.7 548269213 Valves and cocks for water supply 118,699 44.5 55.5 55.5 79.6 1372269214 General valves and cocks 230,007 27.2 72.8 26.1 49.6 381269215 Accessories of valves and cocks 29,814 7.5 92.5 31.3 59.8 501269311 Cutting, bending, threading etc. of pipe products 62,034 1.2 98.8 20.1 42.6 256269411 Radial ball bearing, except ones for bearing units 336,988 85.5 14.5 55.6 90.3 1263269412 Miscellaneous ball bearings, except ones for bearing units 24,716 70.4 29.6 66.4 91.9 2761269413 Roller bearings, except ones for bearing units 249,151 90.7 9.3 70.5 95.2 1846269414 Bearing units 61,375 62.6 37.4 63.3 92.1 1557269415 Parts of ball and roller bearings 167,063 23.3 76.7 17.4 42.1 264269511 Piston rings 67,386 91.6 8.4 89.3 98.8 3053269611 Molds for pressing 517,096 23.8 76.2 9.8 22.2 74

29

internal combustion engines 984,092 40.8 59.2 32.3 48.9 501271911 Condensers 34,288 44.2 55.8 42.9 87.1 969

Commodity names Shipmentvalue Large

enterprises

Medium and small

sized enterprises

Top 3 enterprises

Top 10 enterprises H I

No. Commodity names (million yen) Share (%) Share (%) Share (%) Share (%) 269613 Molds for casting, including ones for die casting 108,935 15.9 84.1 13.0 26.6 118269614 Molds for plastics 555,523 11.8 88.2 6.3 12.5 34269615 Molds for rubber and glass 52,666 - 100.0 11.8 26.0 124269619 Miscellaneous molds and dies, parts and accessories 208,519 16.8 83.2 13.0 20.9 124269711 Item and inner packaging 215,233 23.1 76.9 25.8 47.1 364269712 Outer packaging machines 49,394 17.5 82.5 31.1 61.4 585269713 Parts, attachments and accessories of packing machines 37,383 7.9 92.1 18.6 33.7 194269811 Numerical control robots 105,104 60.0 40.0 57.4 81.9 1494269819 Miscellaneous industrial robots 225,393 80.7 19.3 34.0 73.8 660269821 Industrial robots, and parts, attachments and accessories 135,897 26.8 73.2 21.1 38.3 231269919 Machine shops, n.e.c. 258,131 16.0 84.0 10.0 21.8 73271111 Turbine generators (AC) 63,727 100.0 - 91.3 100.0 2844271112 Engine generators (AC) 73,394 63.0 37.0 47.0 80.5 1003271113 DC motors, 70 W or more 21,718 61.4 38.6 57.9 88.2 1907271114 Single-phase induction motors, 70 W or more 30,181 29.8 70.2 57.1 91.2 1702271115 Three-phase induction motors, 70 W or more 110,478 86.5 13.5 37.0 79.5 798271119 Miscellaneous AC motors, 70 W or more 48,083 84.5 15.5 62.2 86.8 1520271121 AC-DC miniature motors, between 3 and 70 W 413,452 74.4 25.6 48.1 73.4 1574271129 Miscellaneous miniature motors, between 3 and 70 W 28,361 53.2 46.8 56.6 93.8 1688271139 Miscellaneous miniature generators 20,514 61.0 39.0 49.5 89.6 1131271149 Miscellaneous rotating electrical machinery 27,946 65.2 34.8 57.3 93.5 1355271151 Parts, attachments and accessories of generators, motors and

other rotating electrical machinery 174,941 35.6 64.4 24.3 42.0 268271211 Standard transformers 63,365 43.1 56.9 29.6 65.2 545271212 Non-standard transformers 110,911 75.9 24.1 33.4 69.2 724271213 Transformers for special-use 15,317 36.6 63.4 38.0 63.8 660271214 Instrument transformers 24,295 53.1 46.9 36.8 66.1 648271215 Reactors and induction voltage transformers 10,221 25.9 74.1 36.1 65.6 762271216 Parts, attachments and accessories of power and distribution

transformers 51,107 19.6 80.4 17.9 39.3 221271311 Switchboards 430,177 41.3 58.7 18.2 34.7 186271312 Monitor and control equipment 801,493 59.6 40.4 42.0 56.0 666271313 Distribution boards 117,162 32.0 68.0 27.5 41.0 367271314 Relays 88,068 58.7 41.3 47.2 81.7 990271315 Circuit breakers 185,439 71.6 28.4 43.5 69.4 852271316 Switches 181,622 52.5 47.5 28.0 53.6 420271317 Programmable controllers 100,214 94.3 5.7 72.8 95.6 2845271319 Miscellaneous distribution and control equipment 137,337 58.4 41.6 25.5 52.9 393271321 Parts, attachments and accessories of relay switches,

switchboards and electrical control equipment 186,804 36.5 63.5 20.9 38.4 270271411 Miniature switches 12,230 39.6 60.4 48.0 85.2 1035271412 Flasher switches 136,227 72.1 27.9 82.4 94.1 4473271413 Connectors 119,971 67.3 32.7 70.1 79.4 3017271419 Miscellaneous wiring devices and supplies 216,007 19.4 80.6 17.6 38.6 224271511 Arc welding equipment 43,882 59.9 40.1 66.9 91.4 2352271512 Resistance welding equipment 35,911 30.9 69.1 43.2 75.9 961271513 Parts, attachments and accessories of electrical welding

equipment 29,693 30.6 69.4 49.0 70.2 1211271611 Charging generators 124,314 96.1 3.9 93.4 99.4 3664271612 Starter generators 121,415 84.7 15.3 76.0 97.5 2612271613 Permanent-magnet generators 18,926 96.0 4.0 99.8 100.0 5016271619 Miscellaneous auxiliary equipment for internal combustion

engines 373,363 88.2 11.8 75.9 91.6 2078271621 Parts, attachments and accessories of auxiliary equipment for

30

274321 Parts, attachments and accessories of medical electronic instruments and equipment 20,954 3.0 97.0 33.1 55.8 596

Commodity names Shipmentvalue Large

enterprises

Medium and small

sized enterprises

Top 3 enterprises

Top 10 enterprises H I

No. Commodity names (million yen) Share (%) Share (%) Share (%) Share (%) 271912 Electric furnaces 32,250 27.1 72.9 30.6 55.0 519271913 Industrial electric heating equipment 61,376 25.3 74.7 21.7 50.6 340271914 Power transformers 223,760 84.1 15.9 40.7 74.8 810271915 Silicon and selenium rectifiers 50,650 90.7 9.3 83.9 98.0 2908271919 Miscellaneous rectifiers 9,934 86.3 13.7 92.3 99.9 7477271929 Parts, attachments and accessories of miscellaneous industrial

electrical apparatus 106,222 24.0 76.0 17.2 34.8 226272111 Electric rice cookers 68,282 68.2 31.8 60.7 96.7 1594272112 Electronic ovens 73,775 97.6 2.4 79.9 99.9 2754272113 Electric refrigerators 270,170 94.7 5.3 57.5 99.3 1601272119 kitchen ware 174,074 66.4 33.6 54.1 76.7 1913272129 Parts, attachments and accessories of kitchen ware 45,109 58.7 41.3 41.7 66.7 767272211 Electric fans 6,812 71.1 28.9 79.4 100.0 2759272212 Ventilators 112,551 61.8 38.2 68.4 91.6 1740272213 Air conditioners 588,302 98.9 1.1 49.7 98.9 1326272219 Miscellaneous air conditioning and household eguipment 132,924 64.0 36.0 37.1 65.8 792272229 Parts, attachments and accessories of air conditioning and

household eguipment 132,686 8.2 91.8 20.3 42.2 268272311 Electric irons 8,295 66.7 33.3 97.5 100.0 3938272312 Electric washing machines 139,867 98.1 1.9 60.9 100.0 1809272313 Electric cleaning machines 79,168 90.8 9.2 57.6 99.0 1534272314 Electric hot water cleaning seats for toilet, including warming

seats 97,470 92.3 7.7 86.2 99.5 3004272319 Miscellaneous equipment for clothes sanitary 11,887 80.5 19.5 67.7 96.1 1846272329 Parts, attachments and accessories of equipment for clothes

sanitary 23,966 2.9 97.1 55.4 83.5 1545272911 Electric Japanese-style warmers 8,798 11.9 88.1 61.6 93.0 1630272912 Electric appliances for hair dressing 133,154 79.7 20.3 82.1 93.5 4272272919 Miscellaneous household electric appliances 289,222 54.2 45.8 23.9 50.7 353272929 Parts, attachments and accessories of miscellaneous household

electric appliances 367,877 33.5 66.5 22.1 34.6 292273111 General lighting bulbs 11,549 74.0 26.0 79.8 98.7 3277273112 Miniature lamps and illumination lamps for Christmas trees 6,874 50.9 49.1 78.1 99.3 3071273113 Automobile lamps 125,398 79.7 20.3 75.9 96.2 3938273119 Miscellaneous electric bulbs 65,230 72.6 27.4 50.9 79.4 1267273121 Fluorescent lamps 126,744 69.3 30.7 78.1 98.3 2255273129 Miscellaneous electric discharge lamps 85,832 66.4 33.6 55.0 82.7 1274273211 Incandescent lamp fixtures 196,281 72.4 27.6 68.0 77.7 2035273212 Straight-tube fluorescent lamp fixtures 110,490 48.6 51.4 53.5 71.5 1072273213 Ring-tube fluorescent lamp fixtures 98,337 37.0 63.0 44.4 85.8 1001273214 Fluorescent lamp fixtures, except straight and ring tube lamp

fixtures 34,094 18.6 81.4 52.5 80.6 1268273215 Mercury lamp fixtures 28,137 62.8 37.2 59.8 89.5 1829273219 Miscellaneous electric lighting fixtures 48,038 43.7 56.3 36.0 65.8 620273221 Parts, attachments and accessories of electric lighting fixtures 150,030 25.4 74.6 26.0 50.8 348274111 Medical X-ray equipment 151,626 85.0 15.0 77.1 94.6 2804274112 Industrial X-ray equipment 21,831 66.8 33.2 72.7 97.0 2282274113 Parts, attachments and accessories of X-ray equipment 31,595 13.9 86.1 36.5 58.9 646274211 Video tape recording and duplicating equipment (VTR, EVR) 261,884 99.4 0.6 66.7 99.3 1877274212 Video cameras, including integrated VTR-EVR, except

broadcast video cameras 876,526 88.2 11.8 71.3 94.0 2436274213 Digital cameras 673,991 72.8 27.2 66.9 94.8 2016274214 Parts, attachments and accessories of video recording and

duplicating equipment 427,259 59.9 40.1 53.5 70.8 1517274311 Medical electronic instrument and equipment 263,253 97.0 3.0 65.8 96.4 1918

31

281415 High fidelity (HI-FI) amplifiers 15,034 53.7 46.3 61.0 97.6 2004

Commodity names Shipmentvalue Large

enterprises

Medium and small

sized enterprises

Top 3 enterprises

Top 10 enterprises H I

No. Commodity names (million yen) Share (%) Share (%) Share (%) Share (%) 274911 Ultrasonic application equipment 87,041 65.9 34.1 51.6 76.2 1337274912 High-frequency power application equipment 22,638 38.7 61.3 35.0 68.3 687274913 Electronic microscopes 60,464 92.6 7.4 87.8 100.0 3266274914 Numerical control equipment 120,716 88.2 11.8 85.8 94.5 4999274919 Electronic equipment, n.e.c. 350,318 63.4 36.6 32.4 66.6 587274921 Parts, attachments and accessories of miscellaneous electronic

equipment 193,379 27.1 72.9 21.4 48.8 301275111 Electric meters 72,058 54.8 45.2 34.6 70.6 654275112 Electric measuring instruments 266,913 53.8 46.2 27.9 52.4 410275113 Semiconductor and IC measuring instruments 218,761 56.8 43.2 60.5 79.3 1834275119 Miscellaneous electric measuring instruments 61,565 64.5 35.5 40.8 67.9 753275121 Parts, attachments and accessories of electric measuring

instruments 43,788 13.5 86.5 25.1 41.7 294275211 Industrial process controlling instruments 221,254 53.8 46.2 38.2 61.5 871275212 Parts, attachments and accessories of industrial process

controlling instruments 29,180 27.6 72.4 32.8 54.7 641275311 Medical measuring instruments 118,558 70.8 29.2 51.4 82.7 1200275321 Parts, attachments and accessories of medical measuring

instruments 22,708 15.2 84.8 52.6 72.7 1266279111 Lead storage batteries 171,346 97.1 2.9 73.0 100.0 2187279112 Alkali storage batteries 147,812 88.1 11.9 87.9 99.8 4047279113 Lithium ion batteries 263,845 83.3 16.7 61.3 98.5 1920279114 Parts, attachments and accessories of storage batteries 112,152 69.1 30.9 59.4 81.3 1786279211 Cylindrical manganese dry batteries 19,267 81.9 18.1 84.5 100.0 2892279219 Miscellaneous primary batteries 145,732 86.3 13.7 65.4 96.6 1908279221 Parts, attachments and accessories of primary batteries 19,276 32.4 67.6 49.0 85.9 1042279311 Magnetic tapes (raw) 308,205 92.9 7.1 60.2 96.6 1506279312 Magnetic discs (raw) 149,189 65.7 34.3 43.0 89.0 1000279911 Lead-in wires 26,867 7.0 93.0 70.9 88.1 2643279912 Silicon wafers (surface-polished) 378,776 94.3 5.7 66.2 90.4 1733279919 Electrical machinery, equipment and supplies, n.e.c. 633,860 65.4 34.6 26.2 51.9 400281111 Telephone sets 69,868 53.6 46.4 44.7 89.8 1030281112 Automatic telephone exchange switchboards 245,419 85.2 14.8 73.1 98.8 3062281113 Auxiliary equipment of telephone exchange switchboards 18,924 30.4 69.6 47.8 91.9 1298281119 Miscellaneous wired telephone sets 270,004 82.4 17.6 56.3 88.5 1414281121 High-speed facsimiles, including ultra-high-speed ones 89,835 89.9 10.1 80.5 100.0 2857281122 Facsimiles, except high-speed ones 53,183 93.3 6.7 82.8 99.6 2546281129 Miscellaneous wired telecommunication equipment 121,656 60.0 40.0 51.4 84.6 1429281131 Digital transmission equipment 351,260 93.2 6.8 58.2 89.2 1671281132 Transmission equipment, except digital transmission equipment 44,689 48.9 51.1 62.2 94.4 1589281211 Radio and TV broadcasting equipment 128,821 84.6 15.4 53.6 89.7 1282281212 Fixed-station communication equipment 290,843 91.6 8.4 41.6 89.0 999281213 Cellular telephone sets and PHS telephone sets 1,588,605 80.8 19.2 42.9 89.1 983281214 Miscellaneous mobile-station communication equipment 227,480 84.1 15.9 63.9 86.8 1834281215 Portable communication equipment 22,783 79.9 20.1 53.5 92.4 1269281216 Radio applied equipment 355,132 86.6 13.4 36.4 71.6 693281219 Miscellaneous radio communication equipment 100,557 67.0 33.0 60.1 82.4 1616281311 Radio receivers 14,932 44.7 55.3 80.5 98.5 2689281312 Television receivers, except liquid crystal receivers 411,775 83.3 16.7 53.5 97.3 1343281313 Liquid crystal television receivers 228,988 90.5 9.5 83.4 99.7 2896281411 Stereo sets 151,081 95.9 4.1 95.3 100.0 6159281412 Car stereo sets 470,650 77.8 22.2 60.9 89.0 1422281413 Tape recorders 32,189 89.7 10.3 90.3 99.4 3828281414 Digital audio disc players 265,445 88.1 11.9 69.5 97.1 1934

32

291511 Acoustic parts 62,515 81.2 18.8 66.7 89.8 1807

Commodity names Shipmentvalue Large

enterprises

Medium and small

sized enterprises

Top 3 enterprises

Top 10 enterprises H I

No. Commodity names (million yen) Share (%) Share (%) Share (%) Share (%) 281416 Speaker systems for HI-FI and cars 28,862 81.2 18.8 93.4 100.0 4150281417 Hearing aids 14,674 58.8 41.2 80.7 100.0 3327281419 Miscellaneous electric audio equipment 163,865 83.1 16.9 67.4 90.2 1919281421 Finished speaker systems, microphones, earphones, audio

pickups, etc. 138,995 60.1 39.9 57.0 83.4 1666281422 Parts, attachments and accessories of electric audio equipment 370,070 43.8 56.2 26.8 53.1 397281511 Railway signal and safety appliances 145,118 71.8 28.2 41.9 77.0 955281512 Parts, attachments and accessories of railway signal and safety

appliances 34,343 59.9 40.1 60.2 74.1 1641281911 Fire alarm equipment 32,561 - 100.0 64.7 91.1 1737281919 Miscellaneous communication related products 123,791 47.7 52.3 29.4 60.1 481282111 General computers 318,285 96.0 4.0 79.9 100.0 2427282112 Office computers 117,517 95.3 4.7 73.6 99.8 2273282113 Work stations 154,868 89.2 10.8 94.4 100.0 3782282114 Parts, attachments and accessories of data processing machines,

digital and analog computers and auxiliary equipment 82,562 62.5 37.5 44.8 66.4 835282211 Personal computers 1,850,254 99.6 0.4 53.1 98.9 1340282212 Parts, attachments and accessories of personal computers 418,616 45.3 54.7 35.5 56.7 600282311 Magnetic disc equipment 464,783 94.2 5.8 82.1 97.0 4163282312 Optical disc equipment 290,450 94.5 5.5 60.5 95.6 1523282313 Flexible disc equipment 23,935 100.0 - 99.3 100.0 8285282319 Miscellaneous external memories 110,998 96.1 3.9 46.1 92.9 1156282321 Parts, attachments and accessories of external memories 47,244 53.0 47.0 62.2 93.1 2134282411 Printers 422,077 61.5 38.5 46.8 77.7 1084282412 Parts, attachments and accessories of printers 214,644 57.9 42.1 58.5 90.3 1582282911 Displays 375,212 66.2 33.8 45.2 90.8 1049282919 Miscellaneous input-output systems 159,167 86.3 13.7 64.1 87.4 2407282921 Finance terminal units 166,017 87.6 12.4 55.2 89.2 1267282929 Miscellaneous terminal units 215,848 83.1 16.9 35.8 73.5 707282939 Miscellaneous accespries equipment 109,791 65.2 34.8 40.9 80.1 880282941 Parts, attachments and accessories of miscellaneous accespries

equipment 113,552 38.9 61.1 46.5 69.5 1029291111 Microwave tubes 15,949 68.1 31.9 76.9 100.0 2352291112 Cathode ray tubes (CRT) 155,331 99.0 1.0 80.3 100.0 2501291119 Miscellaneous electron tubes 219,666 90.6 9.4 64.6 89.5 1912291211 Diode 208,417 71.7 28.3 36.1 78.5 756291212 Rectifying devices, 100 mA or more 115,923 71.1 28.9 41.6 87.8 976291213 Silicon transistors 321,055 75.6 24.4 38.2 75.6 764291214 Transistors, except silicon transistors 169,056 95.4 4.6 86.2 99.1 4338291215 Photoelectric converter devices 34,475 71.7 28.3 84.3 100.0 2577291216 Light emitting diode 318,366 82.3 17.7 52.7 86.5 1327291219 Miscellaneous semiconductor devices 350,101 68.7 31.3 44.6 69.1 952291311 Bipolar type IC 657,911 91.2 8.8 35.5 76.2 742291312 Metal oxide semiconductor IC 3,107,416 94.8 5.2 28.5 61.0 507291313 Linear circuit 255,918 99.5 0.5 55.6 99.2 1564291319 Miscellaneous semiconductor IC 321,322 76.9 23.1 38.9 81.7 869291321 Thick film IC 180,526 71.7 28.3 46.0 79.2 1041291329 Miscellaneous hybrid IC 106,579 90.2 9.8 74.9 96.9 2189291339 Miscellaneous IC 211,782 96.1 3.9 43.0 96.2 1132291411 Resistors 201,570 43.0 57.0 35.9 61.1 619291412 Fixed capacitors 799,801 62.4 37.6 25.4 60.0 462291413 Capacitors, except fixed capacitors 5,122 21.1 78.9 59.9 95.7 1512291414 Transformers 139,359 43.3 56.7 22.4 49.6 328291415 Composite parts 32,506 42.6 57.4 57.9 94.6 1495

33

302115 Freight cars for railroad 2,719 74.3 25.7 93.4 100.0 3178

Commodity names Shipmentvalue Large

enterprises

Medium and small

sized enterprises

Top 3 enterprises

Top 10 enterprises H I

No. Commodity names (million yen) Share (%) Share (%) Share (%) Share (%) 291512 Magnetic heads 135,876 90.3 9.7 75.8 91.4 3644291513 Small motors, less than 3 W 144,359 48.4 51.6 45.4 81.1 975291611 Connectors for printed boards 114,939 49.9 50.1 36.4 74.9 753291612 Connectors, except ones for printed boards 372,175 60.3 39.7 55.9 73.7 1628291613 Switches 271,072 69.4 30.6 53.9 85.8 1281291614 Relays 83,214 30.0 70.0 55.1 82.9 1268291711 Switching power supplies 170,262 49.5 50.5 22.0 56.7 415291712 TV tuners, including video tuners 24,012 79.1 20.9 65.7 96.3 1695291719 Miscellaneous high-frequency assemblies 178,587 62.8 37.2 37.8 67.6 729291721 Control units 31,568 37.6 62.4 54.6 91.0 1391291811 Rigid printed boards 695,962 59.1 40.9 22.5 44.2 313291819 Miscellaneous printed boards 262,084 58.7 41.3 59.3 77.1 1411291821 Printed circuit boards 470,554 31.4 68.6 14.9 35.8 194291911 Magnetic parts of powder and gold 64,618 73.6 26.4 37.9 78.0 805291912 Crystal vibrators, except ones for watches and clocks 155,503 54.0 46.0 43.1 72.0 903291913 Liquid crystal elements 1,115,306 81.3 18.7 33.7 71.6 660291914 Parts and accessories of communication equipment, n.e.c. 247,078 49.9 50.1 28.3 49.0 426291919 Miscellaneous electronic parts 2,742,066 66.3 33.7 24.4 41.1 302301111 Light and small passenger cars, less than 2000 ml cylinder

capacity, including chassis 6,743,687 100.0 0.0 65.1 99.0 1896301112 Ordinary passenger cars, 2000 ml cylinder capacity or more,

including chassis 7,175,471 100.0 0.0 81.3 100.0 3298301113 Buses 138,701 100.0 - 90.2 100.0 3771301114 Trucks, including tractors 2,271,028 100.0 - 51.8 98.2 1333301115 Motor vehicles for special-use 105,627 75.9 24.1 63.2 86.4 1865301116 Bus and truck chassis 481,979 100.0 - 100.0 100.0 5058301117 Motorcycles, less than 125 ml, including motor bicycles and

motor scooters 179,714 100.0 - 89.5 100.0 3209301118 Motorcycles, more than 125 ml, including ones with side cars

and motor scooters 714,087 100.0 - 89.5 100.0 3075301211 Passenger car bodies 1,170,292 98.2 1.8 80.1 99.2 2331301212 Bus bodies 131,568 82.7 17.3 53.9 99.1 1402301213 Truck bodies 1,188,876 92.3 7.7 84.2 92.6 4737301214 Special-use car bodies 167,941 67.2 32.8 40.4 75.7 798301215 Trailers, including trailer chassis and bodies 31,988 76.6 23.4 60.0 96.4 1672301311 Gasoline engines for motor vehicles 1,295,378 99.0 1.0 74.2 98.2 2509301312 Diesel engines for motor vehicles 465,626 99.7 0.3 63.6 99.9 1704301313 Internal combustion engines for motorcycles and motor

scooters 11,733 39.3 60.7 93.9 100.0 3108301314 Parts, attachments and accessories of internal combustion

engines for motor vehicles 2,791,597 69.5 30.5 22.4 40.7 291301315 Parts of driving, transmission and operating units 4,144,109 76.4 23.6 26.2 43.0 314301316 Parts of suspension and brake systems 1,078,912 59.7 40.3 20.9 47.0 286301317 Parts of chassis and bodies 2,407,365 56.7 43.3 17.3 30.6 173301318 Car air-conditioners 557,983 82.8 17.2 63.0 86.5 2240301321 Car heaters 137,080 98.1 1.9 98.4 100.0 8567301322 Finished seats 578,576 66.0 34.0 36.2 79.6 770301329 Miscellaneous parts of motor vehicles, including parts of

motorcycles 6,036,745 78.3 21.7 38.9 50.4 953301331 KD sets (passenger cars, buses and trucks) 1,373,105 100.0 0.0 85.1 100.0 4446301332 KD sets (motorcycles) 246,449 99.9 0.1 99.9 100.0 4757302111 Locomotives 3,251 100.0 - 100.0 100.0 7150302112 Electric railcars, with motive power 124,710 99.2 0.8 74.3 100.0 2583302113 Internal combustion motive cars 5,324 85.0 15.0 100.0 100.0 4051302114 Trailed passenger cars and electric cars for railroad 38,650 100.0 - 82.9 100.0 2584

34

311111 Universal measures 7,332 - 100.0 55.8 88.3 1408311211 Integrate volumeters 92,862 37.8 62.2 39.2 77.9 782

Commodity names Shipmentvalue Large

enterprises

Medium and small

sized enterprises

Top 3 enterprises

Top 10 enterprises H I

No. Commodity names (million yen) Share (%) Share (%) Share (%) Share (%) 302119 Miscellaneous railroad cars 11,674 30.1 69.9 50.1 87.6 1162302211 Parts, attachments and accessories of locomotives 39,829 51.9 48.1 46.6 70.3 1341302212 Parts, attachments and accessories of electric cars, passenger

cars and freight cars 139,654 57.0 43.0 31.3 59.8 506303111 Steel passenger shipbuilding, power vessel 20 gross tonnage or

more X - X 100.0 100.0 10000303112 Steel cargo and passenger shipbuilding, power vessel 20 gross

tonnage or more 65,419 98.7 1.3 98.7 100.0 7028303113 Steel cargo shipbuilding, power vessel 20 gross tonnage or

more 720,400 73.5 26.5 27.6 65.5 535303114 Steel oil transportation shipbuilding, power vessel 20 gross

tonnage or more 314,588 63.6 36.4 42.2 72.8 894303115 Steel fishing shipbuilding, power vessel 20 gross tonnage or

more 10,548 22.8 77.2 67.6 100.0 1890303116 Steel special-use shipbuilding, power vessel 20 gross tonnage

or more 74,316 67.9 32.1 62.6 85.0 1860303117 Warship building 104,285 100.0 - 81.8 100.0 3683303118 Steel non-power vessel building 14,708 13.5 86.5 59.4 93.2 1455303121 Steel power vessel building, less than 20 gross tonnage 8,143 - 100.0 53.3 76.3 1595303122 Hull of steel ship 5,518 44.9 55.1 78.3 100.0 2769303123 Modification and repair of domestic steel ship 128,671 33.3 66.7 15.5 32.4 173303124 Modification and repair of foreign steel ship 21,083 62.3 37.7 49.9 84.8 1195303125 Modification and repair of warship 74,351 95.9 4.1 64.8 98.7 1871303126 Wooden shipbuilding, modifying and repairing, 20 gross

tonnage or more 8,937 - 100.0 98.4 99.8 9206303211 Hull blocks 27,622 34.2 65.8 54.9 83.0 1241303311 Wooden and metallic shipbuilding, except steel shipbuilding 8,064 17.2 82.8 41.8 85.3 947303312 Plastic shipbuilding 25,713 22.1 77.9 38.9 60.0 704303313 Ship modifying and repairing 10,986 1.2 98.8 14.5 26.4 128303411 Marine engines 129,682 66.7 33.3 51.6 90.7 1318303419 Miscellaneous marine engines 168,390 89.9 10.1 73.1 99.5 2877303421 Parts, attachments and accessories of marine engines 249,411 56.2 43.8 32.8 52.5 544304111 Airplanes 114,125 100.0 - 100.0 100.0 8302304112 Helicopters 91,302 100.0 - 99.8 100.0 5590304121 Aircraft repairing and overhaul 85,583 97.2 2.8 68.4 100.0 2034304211 Aircraft engines 67,030 100.0 - 100.0 100.0 8220304212 Aircraft engine repairing and overhaul 45,600 100.0 0.0 99.2 100.0 6736304213 Parts, attachments and accessories of aircraft engines 262,848 95.4 4.6 94.2 98.2 4670304919 Miscellaneous aircraft parts and auxiliary equipment 487,370 94.9 5.1 52.6 79.8 1161305111 Forklift trucks 181,774 91.9 8.1 71.6 99.9 2522305112 Parts, attachments and accessories of forklift trucks 30,859 18.6 81.4 28.3 50.1 459305911 Platform trucks, including trailers 15,987 59.6 40.4 49.2 89.1 1257305912 Shovel trucks 6,910 100.0 - 100.0 100.0 3587305913 Industrial trailers, including agricultural trailers 779 - 100.0 73.8 98.8 2148305919 Miscellaneous industrial trucks 58,971 70.2 29.8 73.5 90.2 2418305921 Parts, attachments and accessories of industrial trucks 120,297 53.6 46.4 39.8 57.0 631309111 Light bicycles, mini-bicycles and mountain motorcycles 45,988 43.7 56.3 60.5 94.6 1596309112 Children's bicycles, from 12 to 24 inches wheel diameter 4,668 64.2 35.8 88.7 100.0 4373309113 Special bicycles, including ones for sport and practical-use 13,614 79.0 21.0 77.8 98.8 2460309114 Wheelchairs (manual) 11,219 5.1 94.9 75.9 90.0 2705309115 Finished frames for bicycles 5,914 33.4 66.6 70.7 98.6 2132309116 Parts, attachments and accessories of bicycles 112,641 71.4 28.6 78.0 83.4 4952309911 Flying objects, parts and accessories 67,218 97.6 2.4 84.4 99.3 3548309919 Transportation equipment, parts, attachments and accessories,

n.e.c. X 20.9 79.1 44.7 61.6 1364

35

315411 Camera lenses 50,444 18.4 81.6 24.5 57.5 438315412 Exchange lenses for cameras 59,821 74.0 26.0 60.1 89.0 1411

Commodity names Shipmentvalue Large

enterprises

Medium and small

sized enterprises

Top 3 enterprises

Top 10 enterprises H I

No. Commodity names (million yen) Share (%) Share (%) Share (%) Share (%) 311219 Miscellaneous volumeters 3,339 - 100.0 70.7 88.9 2913311221 Parts, attachments and accessories of volumeters 17,809 49.2 50.8 62.8 87.4 1525311311 Balances and scales 133,405 52.1 47.9 65.7 86.7 1873311312 Parts, attachments and accessories of balances and scales 6,098 0.8 99.2 43.3 71.1 1155311411 Manometers 62,255 36.7 63.3 46.1 77.7 1059311412 Metal thermometers 10,239 - 100.0 33.9 61.9 635311413 Flowmeters 50,840 41.1 58.9 41.3 81.9 881311414 Quantity gauges (level meters) 14,630 31.4 68.6 59.3 85.0 1519311415 Parts, attachments and accessories of manometers, flowmeters

and quantity gauges 14,236 21.3 78.7 29.9 52.5 475311511 Industrial measures 29,309 60.5 39.5 62.2 75.8 3226311512 Precision measuring machines and instruments 119,847 60.7 39.3 37.0 64.5 648311513 Parts, attachments and accessories of precision measuring

machines and instruments 13,580 0.0 100.0 16.6 34.1 197311611 Optical analytical instruments 34,098 35.0 65.0 67.1 93.3 1722311619 Miscellaneous analytical instruments 84,435 72.3 27.7 55.7 81.3 1296311621 Parts, attachments and accessories of analytical instruments 21,035 13.0 87.0 43.4 68.4 819311711 Material testing machines 30,980 30.8 69.2 42.4 67.0 745311719 Miscellaneous testing machines 43,058 43.4 56.6 44.7 73.0 1023311721 Parts, attachments and accessories of testing machines 8,435 45.3 54.7 46.3 67.1 1061311911 Photometers, integrating photometers, illumination photometers

and refractivity photometers 14,785 70.5 29.5 85.6 98.4 5133311912 Pollution measuring instruments 50,812 65.3 34.7 63.2 90.5 1520311919 Miscellaneous measuring instruments 281,167 57.7 42.3 57.9 75.8 1257311921 Glass thermometers 7,001 66.0 34.0 76.3 90.2 3064311931 Parts, attachments and accessories of measuring instruments,

n.e.c. 48,852 8.5 91.5 32.2 54.0 507312111 Gyro surveying instruments and magnetic compasses 9,093 48.2 51.8 80.4 97.3 2559312119 Miscellaneous surveying instruments 31,991 70.5 29.5 75.9 94.4 2869312121 Parts, attachments and accessories of surveying instruments 6,433 12.3 87.7 45.0 74.6 874313111 Medical instruments, apparatus and equipment 585,028 65.5 34.5 37.9 60.5 676313112 Hospital instruments, apparatus and equipment 36,262 11.3 88.7 26.5 54.3 393313113 Parts, attachments and accessories of medical instruments and

apparatus 64,305 28.9 71.1 29.9 49.8 421313211 Dental instruments, apparatus and equipment 57,233 35.6 64.4 38.5 74.3 774313212 Parts, attachments and accessories of dental instruments and

apparatus 11,910 - 100.0 68.5 80.7 3156313311 Veterinary instruments and apparatus, and parts, attachments

and accessories 2,416 0.7 99.3 42.3 84.5 906313411 Medical supplies 83,960 19.6 80.4 32.5 52.1 448313511 Dental materials 86,486 14.0 86.0 46.0 71.6 1088314111 Physical and chemical instruments 82,084 34.3 65.7 31.4 48.8 715314112 Parts, attachments and accessories of physical and chemical

instruments 12,893 36.7 63.3 52.3 74.0 1444315111 Telescopes 7,990 55.7 44.3 78.7 95.7 3501315112 Binoculars 5,187 8.2 91.8 66.0 96.5 2570315113 Microscopes and magnifying glasses 37,755 84.2 15.8 90.6 97.4 7128315114 Parts, attachments and accessories of microscopes and

telescopes 8,654 - 100.0 25.2 56.1 414315211 35-mm cameras 78,477 70.3 29.7 54.2 97.3 1354315212 Cameras except 35-mm cameras 2,529 23.3 76.7 74.7 100.0 2679315213 Photographic machines and related instruments 166,235 61.3 38.7 58.6 92.8 1584315214 Parts, attachments and accessories of cameras 115,305 41.9 58.1 28.6 48.4 387315311 Motion picture equipment 5,225 26.3 73.7 71.8 100.0 2261315321 Parts, attachments and accessories of motion picture equipment 2,452 16.7 83.3 45.2 84.2 992

36

324113 Parts of pens and mechanical pencils, pen nibs and penholders 3,205 1.5 98.5 26.1 58.4 462

Commodity names Shipmentvalue Large

enterprises

Medium and small

sized enterprises

Top 3 enterprises

Top 10 enterprises H I

No. Commodity names (million yen) Share (%) Share (%) Share (%) Share (%) 315413 Optical lenses 209,079 50.5 49.5 47.0 67.2 880315414 Prisms 20,912 12.1 87.9 37.7 75.9 827316111 Ophthalmic goods 6,922 - 100.0 63.6 84.8 1607316112 Frames 52,507 0.0 100.0 24.8 48.8 347316113 Lenses, including contact lenses 91,835 52.4 47.6 53.8 78.1 1360316114 Parts of glasses 10,159 - 100.0 23.5 49.4 354317111 Watches, including movements 146,982 94.8 5.2 84.0 99.7 3736317112 Clocks, including movements 23,082 38.7 61.3 51.4 93.2 1209317119 Miscellaneous watches and clocks 887 23.0 77.0 56.1 100.0 1742317121 Parts of watches and clocks 79,522 51.9 48.1 31.8 62.5 578317211 Portable watchcases 7,947 39.6 60.4 69.2 97.3 1895317219 Miscellaneous watchcases 2,072 - 100.0 62.2 92.4 2009321111 Precious metal accessories,including jewel, ivory and turtle

products 153,882 7.1 92.9 25.3 42.8 329321112 Natural and cultured pearl accessories, made by purchased

pearls 35,185 18.1 81.9 59.1 84.7 1361321211 Parts,accessories,material,processing and work goods of

precious metal and precious stone accessories( piecework ) 17,217 - 100.0 37.7 71.4 715321911 Miscellaneous precious metal and precious stone except

accessories 7,267 - 100.0 29.6 66.7 566321919 Parts,accessories,material,processing and work goods of

miscellaneous precious metal and precious stone except accessories 1,060 - 100.0 97.1 100.0 6542

322111 Pianos 46,567 99.3 0.7 99.7 100.0 6707322211 Guitars, including electric guitars 6,534 - 100.0 49.9 89.2 1203322911 Electronic musical instruments 41,349 78.2 21.8 79.4 98.3 3133322919 Miscellaneous Western and Japanese musical instruments 63,392 64.3 35.7 71.3 82.4 4190322921 Parts, attachments and accessories of musical instruments 55,096 38.6 61.4 53.1 73.6 1523323111 Cards, Japanese parcheesi, trumps, Japanese playing cards,

Japanese go, Japanese chess, mahjong pieces, game tables, etc. 6,945 16.1 83.9 47.4 78.2 925323112 Household TV games 509,908 95.9 4.1 99.9 100.0 6307323113 Electronic toys, using integrated circuits (IC) 87,201 83.0 17.0 90.9 97.8 6728323114 Metal toys 10,950 - 100.0 54.7 79.9 1350323115 Plastic model kits 18,442 - 100.0 84.3 93.2 4184323116 Pneumatic vinyl toys 1,957 - 100.0 36.7 76.8 754323119 Miscellaneous plastic toys 39,805 3.5 96.5 45.7 65.0 1532323129 Miscellaneous games and toys 41,107 0.3 99.7 38.2 56.9 712323131 Parts and accessories of games and toys 33,485 34.6 65.4 43.3 74.3 1022323211 Japanese dolls, Western dolls, stuffed dolls 1,791 - 100.0 25.6 51.4 405323212 Seasonal festival dolls, boys' festival dolls and girls' festival

dolls 18,766 - 100.0 17.6 36.8 223323219 Miscellaneous dolls 2,464 - 100.0 41.4 65.4 921323221 Parts and accessories of dolls 8,495 - 100.0 17.5 49.0 331323311 Children's vehicles, including parts and accessories 16,223 - 100.0 68.6 92.0 2130323411 Baseball and softball goods 17,414 - 100.0 34.6 58.9 680323412 Goods for basketball, volleyball, Rugby, soccer, etc. 8,710 10.0 90.0 69.4 81.2 2852323413 Tennis, table tennis and badminton goods 17,135 68.2 31.8 68.4 88.5 2776323414 Golf and hockey goods 87,162 60.8 39.2 38.8 86.4 882323415 Skiing, water skiing and skating goods 10,083 3.9 96.1 51.0 90.0 1184323416 Track, field and athletic goods 10,609 - 100.0 64.0 79.0 2936323417 Fishing gears and accessories 105,266 51.7 48.3 57.2 72.9 1434323419 Miscellaneous sporting and athletic goods 269,695 79.8 20.2 80.9 86.6 4525323421 Parts and accessories of sporting and athletic goods 16,242 2.4 97.6 42.0 73.6 787324111 Fountain pens 1,469 75.4 24.6 98.3 100.0 5951324112 Mechanical pencils 14,574 45.5 54.5 71.5 96.2 2129

37

329212 Signboards, signs and display equipment, electrical and mechanical 164,027 26.4 73.6 28.3 39.7 485

Commodity names Shipmentvalue Large

enterprises

Medium and small

sized enterprises

Top 3 enterprises

Top 10 enterprises H I

No. Commodity names (million yen) Share (%) Share (%) Share (%) Share (%) 324211 Ball-point pens 58,091 44.9 55.1 51.4 92.8 1321324212 Marking pens 38,283 25.0 75.0 37.1 84.7 848324213 Parts of ball-point pens and marking pens 36,004 12.6 87.4 43.4 69.4 869324311 Lead pencils 6,601 42.4 57.6 65.7 96.9 2061324312 Pencil lead and holders, including mechanical pencil lead 8,211 81.0 19.0 91.8 100.0 4927324411 Water paints 5,015 20.1 79.9 77.8 96.2 2429324419 Miscellaneous painting materials 18,711 2.3 97.7 26.4 45.8 352324911 Seals, inkpads, stamps, stamp pads 29,639 1.0 99.0 37.6 51.5 889324912 Design and drawing instruments 1,885 - 100.0 37.1 82.3 826324913 Office and industrial bond 5,549 0.1 99.9 62.4 87.4 1486324919 Miscellaneous office supplies 29,433 5.9 94.1 21.9 46.5 315324921 Parts and accessories of office supplies, n.e.c. 11,976 25.7 74.3 44.9 76.5 964325111 Costume accessories,including tin and antimony products 26,141 2.0 98.0 15.9 31.9 180325112 Accessories and ornaments 9,636 - 100.0 27.8 57.8 438325113 Jewelry boxes and small article cases 6,066 - 100.0 46.7 69.5 1445325114 Parts and accessories of costume jewelry and costume

accessories, except precious metal and jewel products 9,177 - 100.0 29.4 54.3 463325211 Artificial flowers and ornamental feathers 11,482 - 100.0 35.0 55.7 690325311 Plastic buttons 10,997 - 100.0 41.8 72.3 974325319 Miscellaneous buttons, including button-shaped products 10,046 20.6 79.4 54.8 79.4 1149325411 Sewing needles and sewing machine needles 6,889 67.4 32.6 91.7 100.0 4922325412 Slide fasteners 38,736 95.2 4.8 96.3 99.6 8555325413 Snaps and hooks 12,079 - 100.0 61.5 92.4 1828325419 Miscellaneous needles and related articles 15,345 19.6 80.4 32.1 57.9 567325511 Wigs and tresses of false hair, including those for dolls 2,642 - 100.0 72.3 93.8 2224326111 Lacquered furniture 18,032 - 100.0 15.1 34.6 185326112 Lacquered kitchenware and tableware 14,103 0.9 99.1 18.7 30.6 214326119 Miscellaneous lacquer ware 10,125 - 100.0 19.2 38.5 231327111 Straws, panama hats and hat bodies, including paper twist hats

and chip hats 2,206 - 100.0 32.0 60.6 551327119 Miscellaneous straw goods 4,219 - 100.0 28.6 57.7 493327211 Straw-mats and mat bases 55,540 0.4 99.6 4.3 9.2 26327212 Tatami matting 3,841 - 100.0 13.5 29.4 158327213 Mats and fancy mats 2,902 - 100.0 51.7 76.7 1083327311 Fans, including frames 7,956 - 100.0 26.5 55.0 429327312 Lanterns, including frames 12,816 - 100.0 24.8 50.0 385327411 Toothbrushes 37,641 54.6 45.4 59.3 81.6 1626327419 Miscellaneous brushes 48,067 0.5 99.5 33.9 50.1 553327421 Cleaning tools 11,423 - 100.0 60.1 76.6 1473327511 Men's umbrellas 1,647 - 100.0 83.1 100.0 2965327512 Women's umbrellas, including parasols and children's

umbrellas 2,142 - 100.0 63.2 98.6 1682327519 Miscellaneous umbrellas, parasols and parts 1,963 - 100.0 79.6 96.5 2318327611 Matches, including splints and boxes 2,847 - 100.0 54.6 89.4 1469327711 Smoking accessories and supplies 11,809 - 100.0 79.5 92.0 4417327811 Thermos bottles and cases, including jars and jar cases 14,879 6.5 93.5 79.2 99.3 2479328111 Small arms (rifles), artilleries and launchers products 52,367 99.1 0.9 72.7 100.0 2213328112 Small arms ammunition (bullets), shells (projectile) and

explosives products 151,894 93.5 6.5 87.2 100.0 5041328119 Miscellaneous ordnance and accessories 139,805 100.0 - 100.0 100.0 7838328121 Parts and accessories of ordnance 54,737 93.7 6.3 58.5 95.4 1492329111 Fireworks, including toy fireworks 18,123 6.8 93.2 18.9 34.3 218329211 Signboards, signs and display equipment, not electrical and

mechanical 212,029 6.3 93.7 12.8 19.5 91

38

Commodity names Shipmentvalue Large

enterprises

Medium and small

sized enterprises

Top 3 enterprises

Top 10 enterprises H I

No. Commodity names (million yen) Share (%) Share (%) Share (%) Share (%) 329311 Pallets 72,061 0.3 99.7 17.9 30.8 199329411 Window dummies and lay figures 2,376 - 100.0 54.8 84.6 1259329419 Miscellaneous models and patterns 16,737 - 100.0 26.0 42.9 349329511 Pattern manufactured of industrial-use, including wooden

patterns 112,863 1.3 98.7 14.7 24.6 122329611 Audio disc records 86,132 83.2 16.8 75.4 97.9 3207329612 Audio tape records 4,586 26.3 73.7 43.3 88.1 1007329613 Video disc records 30,628 78.9 21.1 68.1 97.3 1707329614 Video tape records 17,388 26.6 73.4 34.9 75.9 766329615 Cassettes for games 122,941 99.5 0.5 99.8 100.0 8916329619 Miscellaneous information recording materials 40,628 42.0 58.0 49.2 84.6 1154329911 Fiber wall materials, including spray-coated materials for

decoration 17,160 - 100.0 67.3 90.6 2304329912 Incenses 30,565 - 100.0 55.7 79.6 1452329913 Safety protectors and life saving apparatus 278,170 57.3 42.7 44.7 79.8 928329914 Unit housing 204,394 29.7 70.3 52.1 98.8 1302329915 Room units 285,261 82.9 17.1 59.0 86.4 1416329919 Miscellaneous manufacturing products, n.e.c. 156,677 24.2 75.8 31.0 44.7 630


Recommended