Computación y Sistemas Vol. 14 No. 4, 2011 pp 437-450 ISSN 1405-5546 ABSTRACT of PhD THESIS General Algorithm for the Semantic Decomposition of Geo-Images Un Algoritmo General para la Descomposición Semántica de Geo-Imágenes José Giovanni Guzmán Lugo Graduated on december 4, 2007 Centro de Investigación en Computación, IPN México D.F., México. [email protected]Advisor: Serguei Levachkine Centro de Investigación en Computación, IPN México D.F., México [email protected]Abstract. The thesis presents an object oriented methodology for the semantic extraction of a geo-image which is defined by a set of natural language labels. The approach is composed of two main stages: analysis and synthesis. The analysis stage detects the main geographic components of a geo-image by means of the color quantification, geometry and topology of the geospatial objects. The result of this stage is a set of geo- images with intensities that are approximately uniform. The synthesis stage extracts the main geographic objects that have been identified and a labeling process in two levels (general and specialized), which is equivalent to consider both local and global information of a geo-image. The aim of the general labeling process is to associate a label of the adequate thematic to each region, taking into account the RGB characteristics of the image. In order to specialize each geographic object, we have proposed a specialization algorithm that considers geometric and topologic relations among them, represented in geographic application domain ontology. The obtained set of labels describes the geo-image semantics. Keywords: Image Processing and Computer Vision, Scene Analysis, Object Recognition. Resumen. Esta tesis presenta una metodología orientada a objetos para la extracción de la semántica de una geo-imagen definida por un conjunto de etiquetas en lenguaje natural. La metodología está compuesta de dos grandes etapas: análisis y síntesis. La etapa de análisis detecta los principales elementos geográficos de una geo-imagen mediante la cuantificación de características como color, geometría y topología de los objetos geográficos. El resultado de esta etapa es un conjunto de geo-imágenes con intensidades de color aproximadamente uniforme. La etapa de síntesis extrae los objetos geográficos que fueron identificados y realiza un proceso de etiquetado en dos niveles (general y especializado), el cual es equivalente a considerar tanto la información global como local de una geo- imagen. El propósito del etiquetado general es asociar a cada región una etiqueta de una temática adecuada, tomando en consideración la información RGB de la geo-imagen. Para especializar cada objeto geográfico, se propone un algoritmo de especialización que considera la geometría y relaciones topológicas entre los objetos geográficos, tomando como base una ontología de aplicación del dominio geográfico. El conjunto de etiquetas resultante describe la semántica de una geo-imagen. Palabras clave: Procesamiento de imágenes y visión por computadora, análisis de escena, reconocimiento de objetos. 1 Introduction Nowadays geospatial data of remote images (geo- images) are very useful, because with them it is possible to obtain information for task planning, construction or simulation of natural disasters. Some of the challenges related with these geo-images that researchers are currently addressing are automatic analysis, recognition, classification, object decomposition, among others. Basically the main goal of any technique is to make a partition of the information to process, label assigning or class-id, with the purpose to describe the main regions presented in a remote image, in order to determine the geographic objects represented by the geo- image. For this process, it is possible to apply techniques of Remote Sensing (RS) and Digital Image Processing (DIP). Currently, algorithms can be classified in two major categories: pixel based and object oriented methodologies. The most of DIP or RS approaches, such as hierarchical analysis [Huang et al., 1998], segmentation [Byung-Gyu et al., 2003; Chen et al., 2005; Din-Yuen et al., 2005; Liu et al., 1994], wavelets, or others techniques [Angulo et al., 2003; Bezdeck, 1981; Bradshaw, 2000], are centered at the first category. The most
Centro de Investigación en Computación, IPN México D.F., México [email protected]
Abstract. The thesis presents an object oriented methodology for the semantic extraction of a geo-image which is defined by a set of natural language labels. The approach is composed of two main stages: analysis and synthesis. The analysis stage detects the main geographic components of a geo-image by means of the color quantification, geometry and topology of the geospatial objects. The result of this stage is a set of geo-images with intensities that are approximately uniform. The synthesis stage extracts the main geographic objects that have been identified and a labeling process in two levels (general and specialized), which is equivalent to consider both local and global information of a geo-image. The aim of the general labeling process is to associate a label of the adequate thematic to each region, taking into account the RGB characteristics of the image. In order to specialize each geographic object, we have proposed a specialization algorithm that considers geometric and topologic relations among them, represented in geographic application domain ontology. The obtained set of labels describes the geo-image semantics. Keywords: Image Processing and Computer Vision, Scene Analysis, Object Recognition. Resumen. Esta tesis presenta una metodología orientada a objetos para la extracción de la semántica de una geo-imagen definida por un conjunto de etiquetas en lenguaje natural. La metodología está compuesta de dos grandes etapas: análisis y síntesis. La etapa de análisis detecta los principales elementos geográficos de una geo-imagen mediante la cuantificación de características como color, geometría y topología de los objetos geográficos. El resultado de esta etapa es un conjunto de geo-imágenes con intensidades de color aproximadamente uniforme. La etapa de síntesis extrae los objetos geográficos que fueron identificados y realiza un proceso de etiquetado en dos niveles (general y especializado), el cual es equivalente a considerar tanto la información global como local de una geo-imagen. El propósito del etiquetado general es asociar a cada región una etiqueta de una temática adecuada, tomando en consideración la información RGB de la geo-imagen. Para especializar cada objeto geográfico, se propone un algoritmo
de especialización que considera la geometría y relaciones topológicas entre los objetos geográficos, tomando como base una ontología de aplicación del dominio geográfico. El conjunto de etiquetas resultante describe la semántica de una geo-imagen. Palabras clave: Procesamiento de imágenes y visión por computadora, análisis de escena, reconocimiento de objetos.
1 Introduction
Nowadays geospatial data of remote images (geo-images) are very useful, because with them it is possible to obtain information for task planning, construction or simulation of natural disasters. Some of the challenges related with these geo-images that researchers are currently addressing are automatic analysis, recognition, classification, object decomposition, among others. Basically the main goal of any technique is to make a partition of the information to process, label assigning or class-id, with the purpose to describe the main regions presented in a remote image, in order to determine the geographic objects represented by the geo-image.
For this process, it is possible to apply techniques of Remote Sensing (RS) and Digital Image Processing (DIP). Currently, algorithms can be classified in two major categories: pixel based and object oriented methodologies. The most of DIP or RS approaches, such as hierarchical analysis [Huang et al., 1998], segmentation [Byung-Gyu et al., 2003; Chen et al., 2005; Din-Yuen et al., 2005; Liu et al., 1994], wavelets, or others techniques [Angulo et al., 2003; Bezdeck, 1981; Bradshaw, 2000], are centered at the first category. The most
important limitation of these algorithms is the following: its result is an image or a set of sub-images, requiring pre-processing and post-processing stages, and uses a single or reduced set of variables to determine the partition. However, we, the humans, are best understood the assignation of labels or concepts (semantic approach) not the use of regions or clusters (numerical approach).
On the other hand, the object oriented approaches try to use a priori information that is not presented in the geo-image [Mueller, 2004]. In this case the main limitation is the use of traditional DIP algorithms to extract the geographic objects. To determine the semantics of a geo-image, it is necessary more information that is not explicitly in the image. For instance, the concept island is defined as “portion on land surrounded by a water body”, other case is the concept lake “it is a water body insides a land”. This is the knowledge (the objects and relations between them) that human beings use to determine the contents of the visual information [Fonseca et al., 2002].
In conclusion, we have indentified two main problems with current methods: the limitations of use one or a reduced set of properties to determine the main objects in a geo-image, and the form to specialize them. In this paper, we propose an object oriented algorithm that consists of two main stages: analysis and synthesis to determine the semantics of the geo-images, i.e. the image objects and their labels.
The rest of the paper is organized as follows: in Section 2 we describe some aspects of the transformation from RGB into isotropic space that is the semantic compression algorithm; Section 3 describes the proposed methodology composed of the analysis and synthesis stages. Section 4 depicts the results obtained for some geo-images. Conclusions and future work are pointed out in Section 5.
2 Transformation for RGB into isotropic space The semantic compression algorithm quantifies different characteristics in an isotropic space of a segment set represented by means of a dynamic tree (hierarchical segments) [Adams et al., 2003]. The initial assertion is that the number of segments is equal to the number of discretional elements (pixels) of the geo-image. This condition is necessary because there is not a priori knowledge about the structure or form of the geographic objects contained in the geo-image. When two segments satisfy the adjacent condition and some property or characteristic measured between them is similar, then these segments will be merged. A new node is created and associated with the involved segments in the dynamic tree to represent the segment fusion.
The hierarchical segments are generated by step-to-step integration of similar areas, that is, in recursive form. The selection of the criteria that allows making a segment fusion is limited by a set of characteristics that are computed for each segment in the fusion process. The segment characteristics can be classified in two groups: attributes and properties. The attributes are a primary set of segment characteristics, dynamically estimated and stored for all segments at any level of their representation in the dynamic tree. The properties are numerical segment characteristics, determined as an output of data conversion and selected in function of the processing stage and the problem context.
The characteristics set for our context, is sorted according to the complexity order: global characteristics (for all geo-image), local characteristics (inside the neighborhood for one segment), integral intensity (sum of all intensities), number of pixels, first and second order moments (computed with respect to the center of the segment), no additive perimeter and description of adjacent segments. This list represents the geometric and intensity properties, such as: pixel intensities range, average intensity and invariant moments. To determine the numerical expressions to quantify the segment properties for the construction of the object hierarchy, it is necessary to work in a different space applying a space transformation that allows us to convert the objects in isotropic objects [Levachkine, 2003; Levachkine et al., 2001].
General Algorithm for the Semantic Decomposition of Geo-Images 439
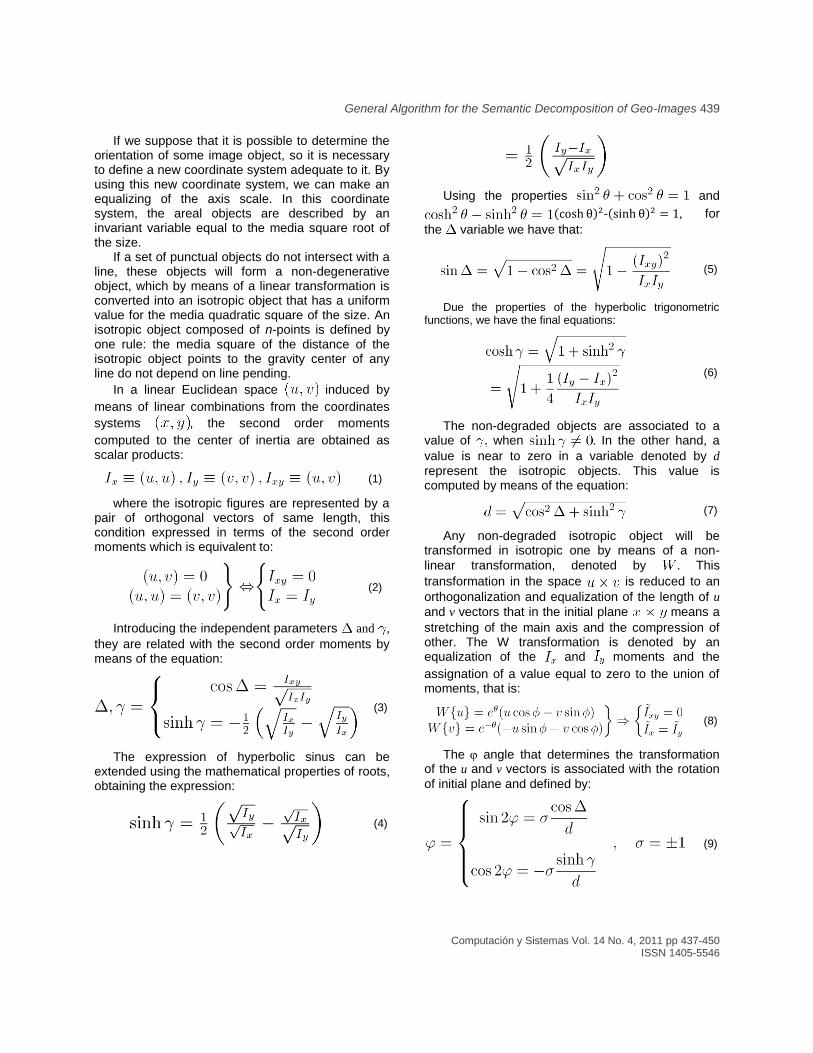
If we suppose that it is possible to determine the orientation of some image object, so it is necessary to define a new coordinate system adequate to it. By using this new coordinate system, we can make an equalizing of the axis scale. In this coordinate system, the areal objects are described by an invariant variable equal to the media square root of the size.
If a set of punctual objects do not intersect with a line, these objects will form a non-degenerative object, which by means of a linear transformation is converted into an isotropic object that has a uniform value for the media quadratic square of the size. An isotropic object composed of n-points is defined by one rule: the media square of the distance of the isotropic object points to the gravity center of any line do not depend on line pending.
In a linear Euclidean space induced by
means of linear combinations from the coordinates
systems , the second order moments
computed to the center of inertia are obtained as scalar products:
(1)
where the isotropic figures are represented by a pair of orthogonal vectors of same length, this condition expressed in terms of the second order moments which is equivalent to:
(2)
Introducing the independent parameters and ,
they are related with the second order moments by means of the equation:
(3)
The expression of hyperbolic sinus can be extended using the mathematical properties of roots, obtaining the expression:
(4)
Using the properties and
( ) -( ) , for
the variable we have that:
(5)
Due the properties of the hyperbolic trigonometric functions, we have the final equations:
(6)
The non-degraded objects are associated to a value of when . In the other hand, a
value is near to zero in a variable denoted by d
represent the isotropic objects. This value is computed by means of the equation:
(7)
Any non-degraded isotropic object will be transformed in isotropic one by means of a non-
linear transformation, denoted by . This
transformation in the space is reduced to an
orthogonalization and equalization of the length of u
and v vectors that in the initial plane means a
stretching of the main axis and the compression of other. The W transformation is denoted by an equalization of the and moments and the
assignation of a value equal to zero to the union of moments, that is:
(8)
The angle that determines the transformation of the u and v vectors is associated with the rotation
orientation of the non-isotropic objects with respect to the initial configuration. In particular, the symmetric figures allow us to find the direction of symmetry axis. Now, defining the hyperbolic
parameter by the equation:
(10)
This parameter describes in logarithmic scale
the radio of the linear dimensions:
(11)
where and are the width and height
respectively. The object dimensions are indistinctly calculated from the orientation, by using the media quadratic of the point distances to the axis:
(12)
The square of the invariant linear size (s) of an isotropic object determines its area (a) that corresponds with the area of the initial object (non-isotropic) and it is equal to the product of l and h
variables:
(13)
The number of points, the a, h, l variables, the object invariant s, the trigonometric and hyperbolic
parameters that allow transforming some objects in isotropic ones, are estimated for the whole geo-image or in the fusion process. To establish that the
transformation from the bi-dimensional space
coincides with the transformation of the initial
plane , it is sufficient to show it as the product
of the orthogonal transformation with the set
(where is a symmetric conjugate of ), which allows
us to considerer these planes as a vector set. The points of the figure are described by means of
vectors:
(14)
where and are orthonormal vectors defined
by:
(15)
The y vectors in the coordinate can be
expressed by the next equation:
(16)
The rotation and the Lorentz transformation
are defined by:
(17)
where is a random vector of the or
planes. So, in the case of a passive
interpretation of the coordinate’s transformation ,
we have that:
(18)
and are the components of the
decomposition to obtain:
(19)
The.new.coordinates( - * +)
are a result of
the plane deformation and describes the ,
multidimensional components, while, for an
active interpretation of the coordinates
transformation the previous expression compliant with the inverse transformation. Furthermore, any non-isotropic object composed of n-points in the
General Algorithm for the Semantic Decomposition of Geo-Images 441
These vectors are transformed in orthogonal ones with the same length applying the transformation that converts the objects into isotropic.
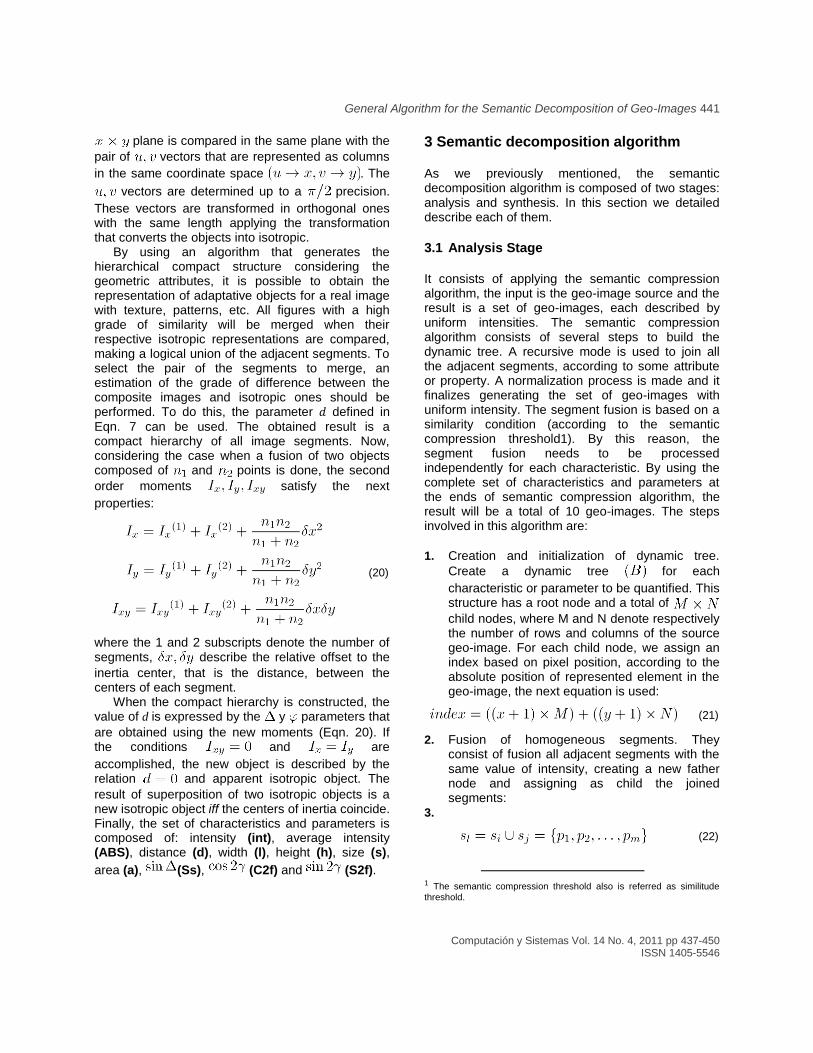
By using an algorithm that generates the hierarchical compact structure considering the geometric attributes, it is possible to obtain the representation of adaptative objects for a real image with texture, patterns, etc. All figures with a high grade of similarity will be merged when their respective isotropic representations are compared, making a logical union of the adjacent segments. To select the pair of the segments to merge, an estimation of the grade of difference between the composite images and isotropic ones should be performed. To do this, the parameter defined in
Eqn. 7 can be used. The obtained result is a compact hierarchy of all image segments. Now, considering the case when a fusion of two objects composed of and points is done, the second
order moments satisfy the next
properties:
(20)
where the 1 and 2 subscripts denote the number of segments, describe the relative offset to the
inertia center, that is the distance, between the centers of each segment.
When the compact hierarchy is constructed, the value of d is expressed by the y parameters that
are obtained using the new moments (Eqn. 20). If the conditions and are
accomplished, the new object is described by the relation and apparent isotropic object. The
result of superposition of two isotropic objects is a new isotropic object iff the centers of inertia coincide. Finally, the set of characteristics and parameters is composed of: intensity (int), average intensity (ABS), distance (d), width (l), height (h), size (s),
area (a), (Ss), (C2f) and (S2f).
3 Semantic decomposition algorithm
As we previously mentioned, the semantic decomposition algorithm is composed of two stages: analysis and synthesis. In this section we detailed describe each of them.
3.1 Analysis Stage
It consists of applying the semantic compression algorithm, the input is the geo-image source and the result is a set of geo-images, each described by uniform intensities. The semantic compression algorithm consists of several steps to build the dynamic tree. A recursive mode is used to join all the adjacent segments, according to some attribute or property. A normalization process is made and it finalizes generating the set of geo-images with uniform intensity. The segment fusion is based on a similarity condition (according to the semantic compression threshold1). By this reason, the segment fusion needs to be processed independently for each characteristic. By using the complete set of characteristics and parameters at the ends of semantic compression algorithm, the result will be a total of 10 geo-images. The steps involved in this algorithm are:
1. Creation and initialization of dynamic tree.
Create a dynamic tree for each
characteristic or parameter to be quantified. This structure has a root node and a total of
child nodes, where M and N denote respectively the number of rows and columns of the source geo-image. For each child node, we assign an index based on pixel position, according to the absolute position of represented element in the geo-image, the next equation is used:
(21)
2. Fusion of homogeneous segments. They consist of fusion all adjacent segments with the same value of intensity, creating a new father node and assigning as child the joined segments:
3.
(22)
1 The semantic compression threshold also is referred as similitude threshold.
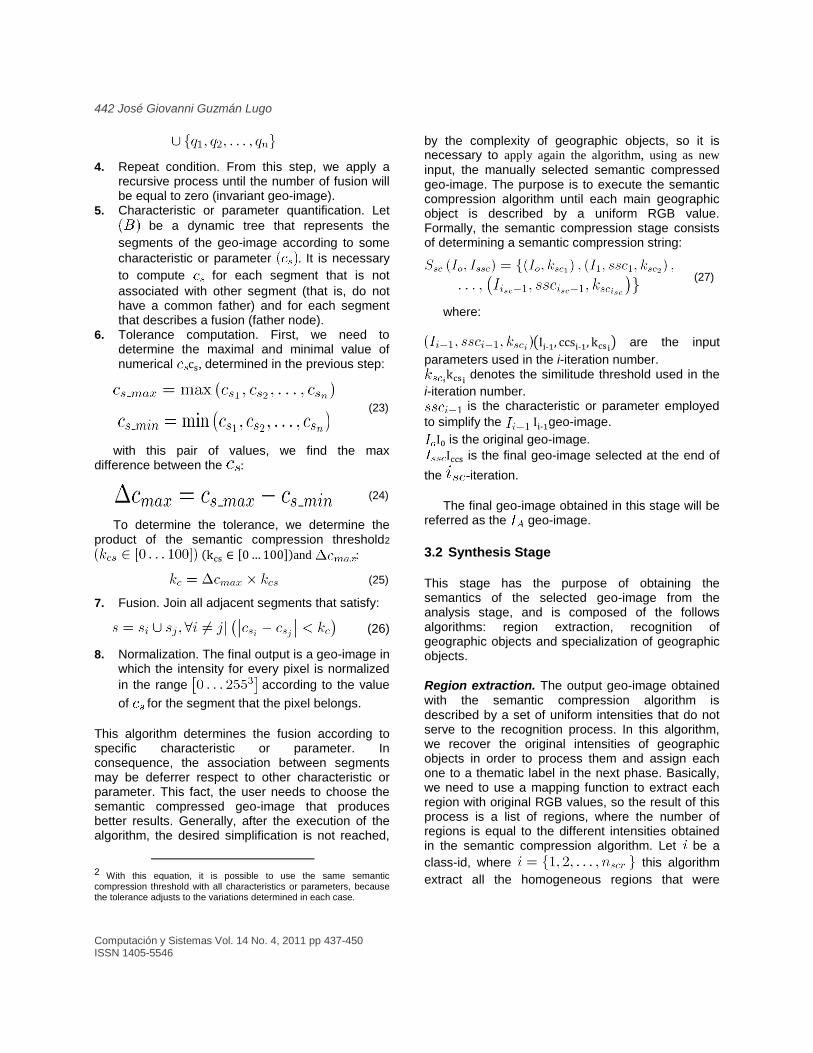
4. Repeat condition. From this step, we apply a recursive process until the number of fusion will be equal to zero (invariant geo-image).
5. Characteristic or parameter quantification. Let
be a dynamic tree that represents the
segments of the geo-image according to some
characteristic or parameter . It is necessary
to compute for each segment that is not
associated with other segment (that is, do not have a common father) and for each segment that describes a fusion (father node).
6. Tolerance computation. First, we need to determine the maximal and minimal value of numerical , determined in the previous step:
(23)
with this pair of values, we find the max difference between the :
(24)
To determine the tolerance, we determine the product of the semantic compression threshold2
( , -)and :
(25)
7. Fusion. Join all adjacent segments that satisfy:
(26)
8. Normalization. The final output is a geo-image in which the intensity for every pixel is normalized
in the range according to the value
of for the segment that the pixel belongs.
This algorithm determines the fusion according to specific characteristic or parameter. In consequence, the association between segments may be deferrer respect to other characteristic or parameter. This fact, the user needs to choose the semantic compressed geo-image that produces better results. Generally, after the execution of the algorithm, the desired simplification is not reached,
2 With this equation, it is possible to use the same semantic compression threshold with all characteristics or parameters, because the tolerance adjusts to the variations determined in each case.
by the complexity of geographic objects, so it is necessary to apply again the algorithm, using as new
input, the manually selected semantic compressed geo-image. The purpose is to execute the semantic compression algorithm until each main geographic object is described by a uniform RGB value. Formally, the semantic compression stage consists of determining a semantic compression string:
(27)
where:
( - - ) are the input
parameters used in the i-iteration number. denotes the similitude threshold used in the
i-iteration number. is the characteristic or parameter employed
to simplify the - geo-image.
is the original geo-image.
is the final geo-image selected at the end of
the -iteration.
The final geo-image obtained in this stage will be referred as the geo-image.
3.2 Synthesis Stage
This stage has the purpose of obtaining the semantics of the selected geo-image from the analysis stage, and is composed of the follows algorithms: region extraction, recognition of geographic objects and specialization of geographic objects.
Region extraction. The output geo-image obtained with the semantic compression algorithm is described by a set of uniform intensities that do not serve to the recognition process. In this algorithm, we recover the original intensities of geographic objects in order to process them and assign each one to a thematic label in the next phase. Basically, we need to use a mapping function to extract each region with original RGB values, so the result of this process is a list of regions, where the number of regions is equal to the different intensities obtained in the semantic compression algorithm. Let be a
class-id, where this algorithm
extract all the homogeneous regions that were
General Algorithm for the Semantic Decomposition of Geo-Images 443
generate a new geo-image, computed in terms of the next expression:
(28)
where is a function that determines the
number of class that the pixel belongs in the
geo-image; in consequence
( ) * +. The
second operation is to replace the intensities of region to recover original values, using the equation:
(29)
To finish the algorithm, we have a total of
geo-images, in which each geo-image describes all geographic objects (regions) of the same thematic.
Recognition of geographic objects. Nowadays, there is not a unique set of thematic layer for the recognition of geographic objects; this set depends on the application and personal requirements. Formally, a thematic layer (water body, land, among others) is a label that describes geographic objects with similitude in the RGB space. The set of thematic layers is composed of all labels in which the geographic object needs to be classified:
(30)
where is the number of thematic layers
defined for the synthesis stage. With this set, we try to do a coarse scale labeling of geographic objects. For practical tests, we define prototype vectors by means of a training process using a bank of 20 regions for each thematic layer. Later, using some recognition algorithm (like minimal Euclidean distance) it is determined the most similitude thematic layer for each uniform image (obtained in previous stage). The result of this algorithm is a label set defined as:
(31)
Specialization of geographic objects. This algorithm has the goal of specializing each label obtained in the recognition process. For instance: let a region be with the water body label, we are interest to determined that this water body represents a river, lake, or other concept. In other case if a land region is a continent or an island.
Each region of some geo-
image describes a geographic object
to specialize them, we propose
the use of application domain ontology [Borst, 1997; Corcho et al., 2002], in which the relations between the objects need to be determined by means of a set of DIP operators. For instance, the lake concept is described as “portion of land surrounded by a water body” in this case the surrounded relation can be determined by using the intersection operator. One important concept in the ontology used is the concept “other”, when the size of some region is less or equal to specific threshold we classify this geographic object as “other”. This restriction is necessary because the number of pixels that describes this region is not enough to make a recognition or specialization. Finally, the semantics
of original geo-image is a set of specific labels
obtained at the end of the specialization algorithm:
(32)
where is the number of objects identified in
and is a specific label.
4 Results
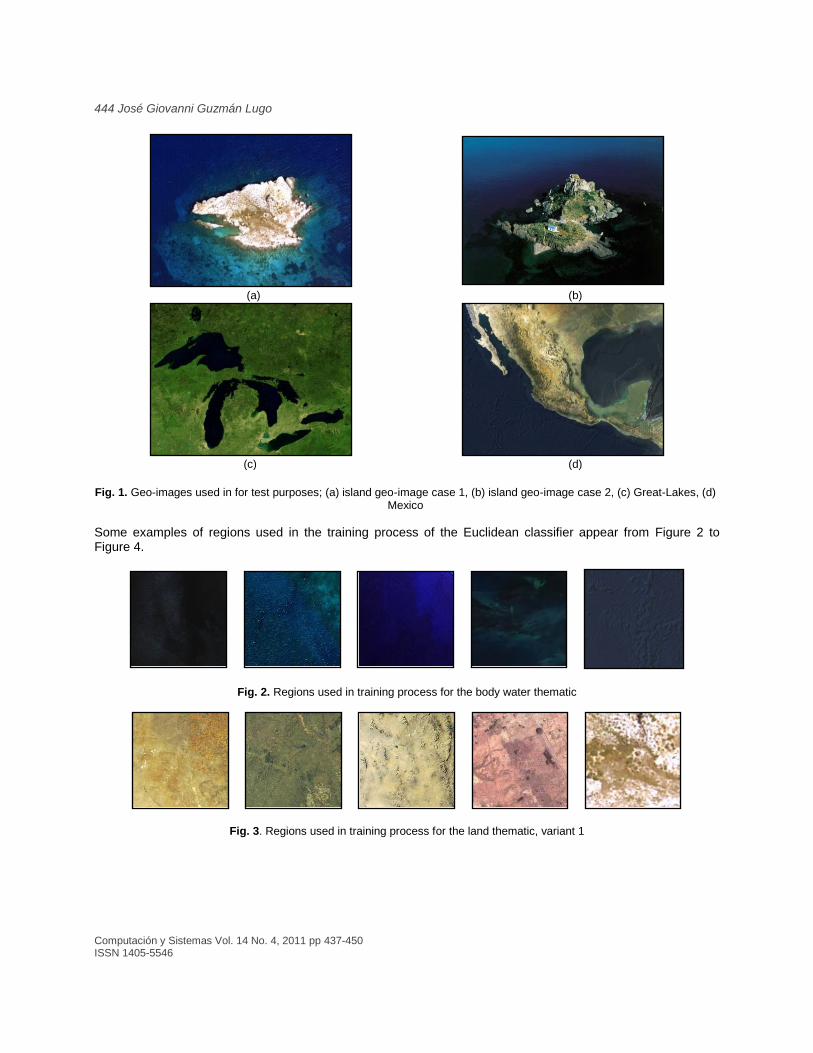
In this section we depict the obtained result with the proposed algorithm. The test images are illustrated in Figure 1.
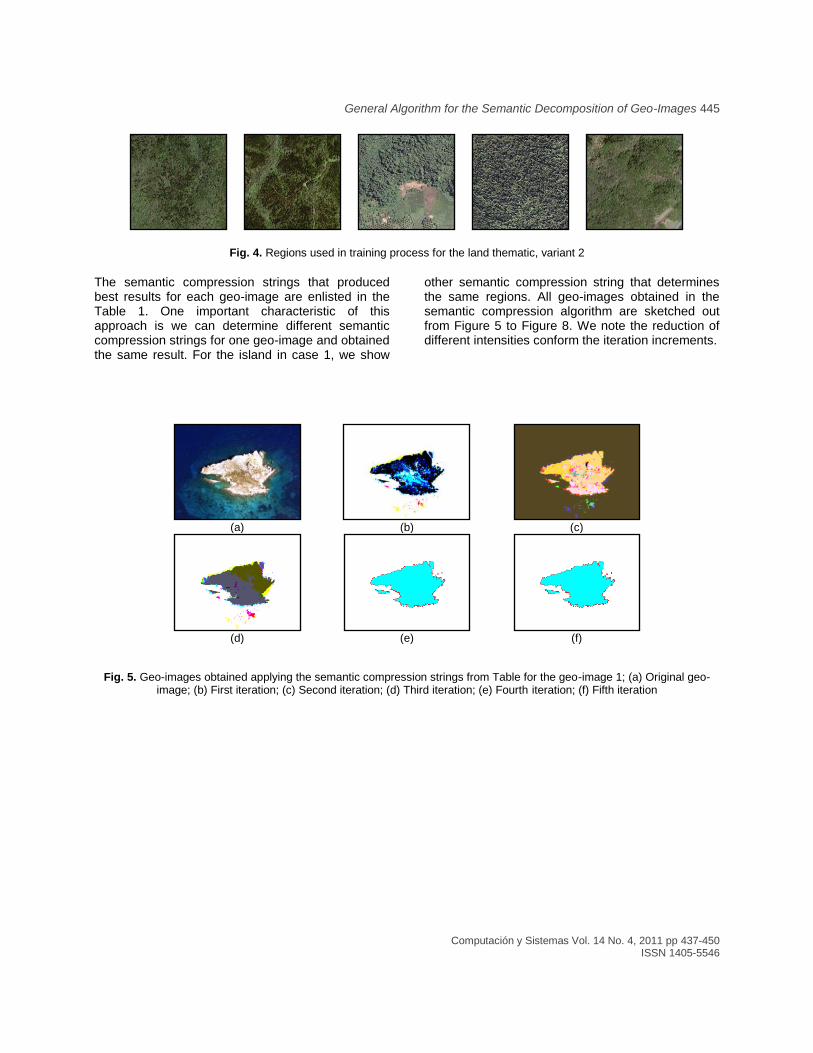
Fig. 4. Regions used in training process for the land thematic, variant 2
The semantic compression strings that produced best results for each geo-image are enlisted in the Table 1. One important characteristic of this approach is we can determine different semantic compression strings for one geo-image and obtained the same result. For the island in case 1, we show
other semantic compression string that determines the same regions. All geo-images obtained in the semantic compression algorithm are sketched out from Figure 5 to Figure 8. We note the reduction of different intensities conform the iteration increments.
(a) (b) (c)
(d) (e) (f)
Fig. 5. Geo-images obtained applying the semantic compression strings from Table for the geo-image 1; (a) Original geo-image; (b) First iteration; (c) Second iteration; (d) Third iteration; (e) Fourth iteration; (f) Fifth iteration
(d) (e) Fig. 8. Geo-images obtained applying the semantic compression strings from Table for the geo-image 1; (a) Original geo-
image; (b) First iteration; (c) Second iteration; (d) Third iteration; (e) Fourth iteration
Table 1. Semantic compression strings used in each geo-image
Geo-image Semantic Compression String
1 ( ) {( ) ( ) ( )
( ) ( )}, or
2
3
4
The prototype vector of the each thematic used by the first labeling algorithm appears in Table 2, we use the media, median and standard deviation in each color component and the Euclidean distance to classify the regions and assign the thematic layer
label. The thematic layer used was T = {body water,
land} * +. Because there are two
great categories of land, one that describes deserted or mountain regions and other for vegetation zones, we have two different vector prototypes for the second thematic layer.
Table 2. Prototype vector used in the recognition of geographic objects algorithm
Thematic Component Media Median Standard Deviation
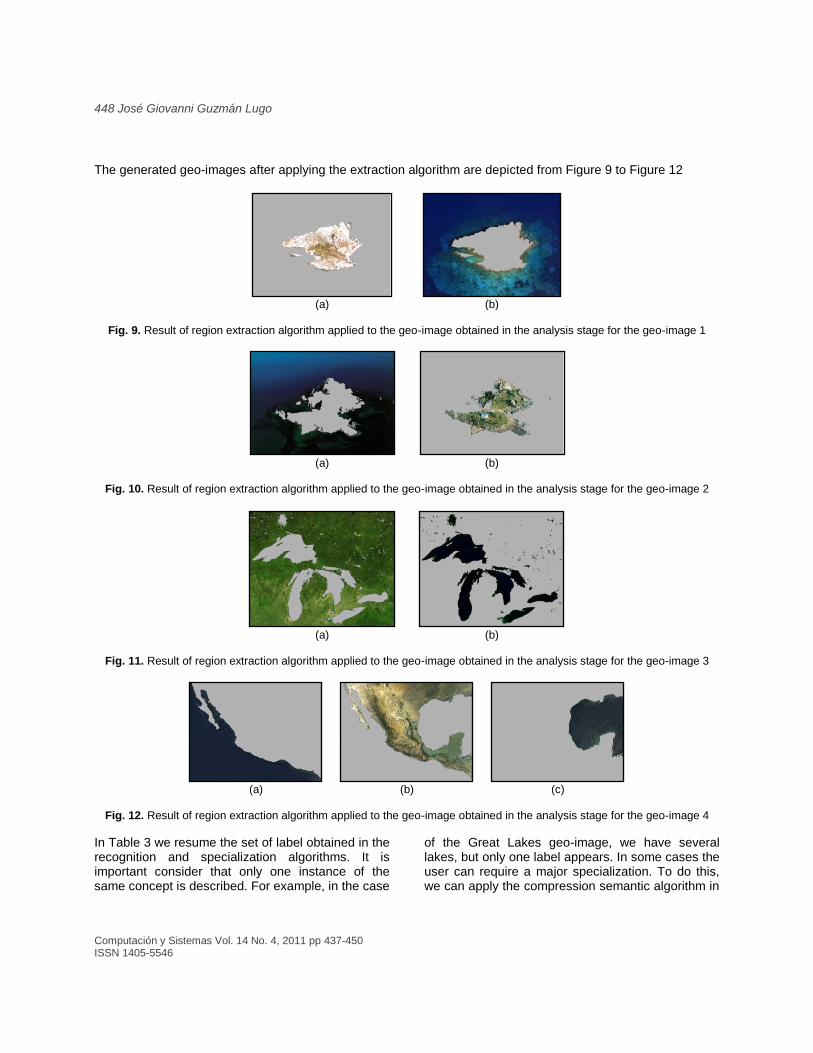
The generated geo-images after applying the extraction algorithm are depicted from Figure 9 to Figure 12
(a) (b)
Fig. 9. Result of region extraction algorithm applied to the geo-image obtained in the analysis stage for the geo-image 1
(a) (b)
Fig. 10. Result of region extraction algorithm applied to the geo-image obtained in the analysis stage for the geo-image 2
(a) (b)
Fig. 11. Result of region extraction algorithm applied to the geo-image obtained in the analysis stage for the geo-image 3
(a) (b) (c)
Fig. 12. Result of region extraction algorithm applied to the geo-image obtained in the analysis stage for the geo-image 4
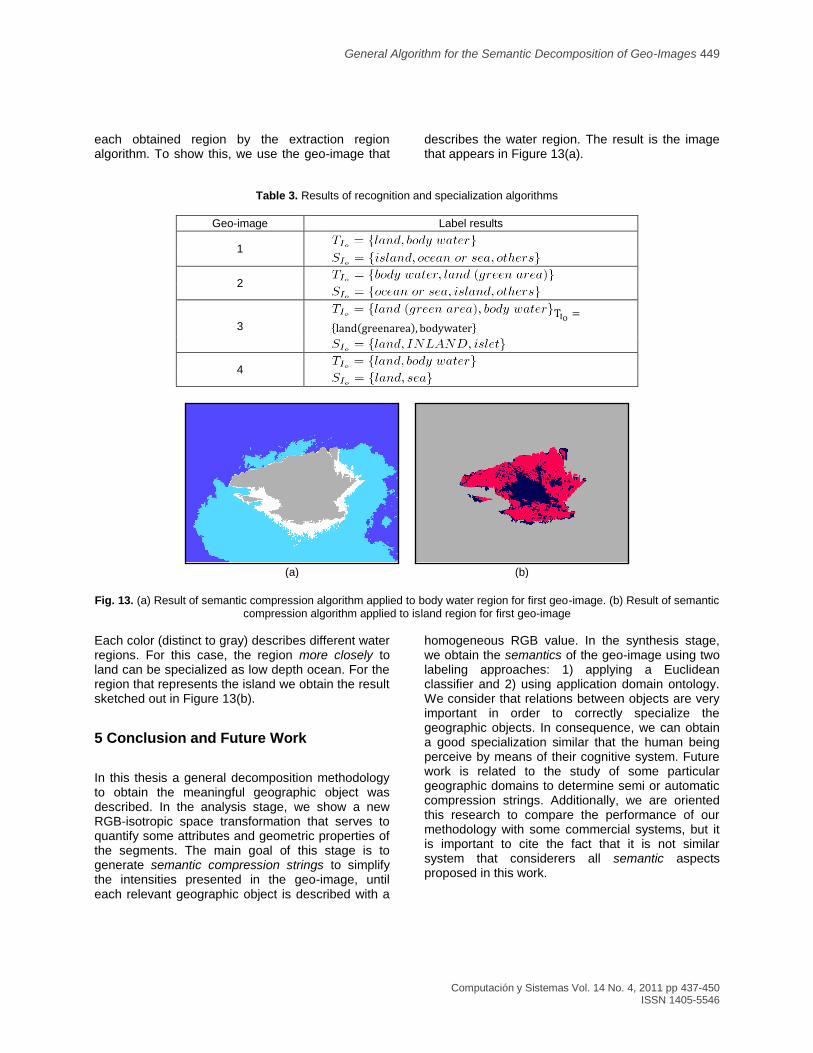
In Table 3 we resume the set of label obtained in the recognition and specialization algorithms. It is important consider that only one instance of the same concept is described. For example, in the case
of the Great Lakes geo-image, we have several lakes, but only one label appears. In some cases the user can require a major specialization. To do this, we can apply the compression semantic algorithm in
General Algorithm for the Semantic Decomposition of Geo-Images 449
each obtained region by the extraction region algorithm. To show this, we use the geo-image that
describes the water region. The result is the image that appears in Figure 13(a).
Table 3. Results of recognition and specialization algorithms
Geo-image Label results
1
2
3
* ( ) +
4
(a) (b)
Fig. 13. (a) Result of semantic compression algorithm applied to body water region for first geo-image. (b) Result of semantic
compression algorithm applied to island region for first geo-image
Each color (distinct to gray) describes different water regions. For this case, the region more closely to land can be specialized as low depth ocean. For the region that represents the island we obtain the result sketched out in Figure 13(b).
5 Conclusion and Future Work
In this thesis a general decomposition methodology to obtain the meaningful geographic object was described. In the analysis stage, we show a new RGB-isotropic space transformation that serves to quantify some attributes and geometric properties of the segments. The main goal of this stage is to generate semantic compression strings to simplify the intensities presented in the geo-image, until each relevant geographic object is described with a
homogeneous RGB value. In the synthesis stage, we obtain the semantics of the geo-image using two
labeling approaches: 1) applying a Euclidean classifier and 2) using application domain ontology. We consider that relations between objects are very important in order to correctly specialize the geographic objects. In consequence, we can obtain a good specialization similar that the human being perceive by means of their cognitive system. Future work is related to the study of some particular geographic domains to determine semi or automatic compression strings. Additionally, we are oriented this research to compare the performance of our methodology with some commercial systems, but it is important to cite the fact that it is not similar system that considerers all semantic aspects proposed in this work.
1. Adams, N. J., & Williams, C. K. I. (2003). Dynamic trees for image modeling. Image Vision Computing, 21(10), 865 – 877.
2. Angulo, J., & Serra, J. (2003). Mathematical Morphology in Color Spaces Applied to the Analysis of Cartographic Images. In S. Levachkine, J. Serra & M. Egenhofer (Eds.), Second International Workshop on Semantic Processing of Spatial Data, Mexico City, Mexico, 59-66.
3. Bezdeck, J.C. (1981). Pattern Recognition with Fuzzy Objective Function Algorithms. Plenum Press, New York.
4. Borst W. N. (1997). Construction of Engineering Ontologies for Knowledge Sharing and Reuse. Ph.D. Thesis, University of Twente, Enschede, Netherlands.
5. Bradshaw, B. (2000). Semantic Based Image Retrieval: A Probabilistic Approach, Proceedings of the eighth ACM international conference on Multimedia (MULTIMEDIA’00), Los Angeles, CA, USA, 167 – 176.
6. Byung-Gyu, K., Jae-Ick, S., & Dong-Jo, P. (2003). Fast image segmentation based on multi-resolution analysis and wavelets. Pattern Recognition Letters, 24 (16), 2995 – 3006.
7. Junqing Ch., Pappas, T.N., Mojsilovic, A., & Rogowitz, B.E. (2005). Adaptive Perceptual Color-Texture Image Segmentation. IEEE Transactions on Image Processing, 14(10), 1524 – 1536.
8. Corcho, O., Fernández-López, M., & Gómez-Pérez, A. (2002). Methodologies, tools and languages for building ontologies. Where is the meeting point?. Data & Knowledge Engineering, 46(1), 41 – 64.
9. Din-Yuen, C., Chih-Hsueh, L., & Wen-Shyong, H. (2005). Image Segmentation with Fast Wavelet-Based Color Segmentation and Directional Region Growing. IEICE Transactions on Information and Systems, E88-D(10), 2249 – 2259.
10. Fonseca, F., Egenhofer, M., Davis, C., & Câmara, G. (2002). Semantic Granularity in Ontology-Driven Geographic Information Systems. Annals of Mathematics and Artificial Intelligence, 36(1-2), 121 – 151.
11. Huang J., Kumar S.R., & Zabih R. (1998). An Automatic Hierarchical Image Classification Scheme. Sixth ACM International Conference on Multimedia (MULTIMEDIA ’98), Ithaca, NY, USA, 219 – 228.
12. Levachkine, S. (2003). Raster to Vector Conversion of Color Cartographic Maps. In J. Lladós & Y.B. Kwon (Eds.), Graphics Recognition, Recent Advances and Perspectives, Lecture Notes in Computer Science, 3088, 50 – 62.
13. Levachkine, S., Velázquez, A., Alexandrov, V., & Kharinov M. (2001). Semantic Analysis and Recognition of Raster-Scanned Color Cartographic Images. In Dorotea Blostein & Young-Bin Kwon (Eds.), 4th International Workshop Graphics Recognition, Algorithms and Applications, Ontario, Canada, 178 – 189.
14. Jianqing, L; Yee-Hong Y. (1994). Multiresolution Color Image Segmentation. IEEE Transactions on Pattern Analysis and Machine Intelligence, 16(7), 689 – 700.
15. Mueller, M., Segl, & K. Kaufmann, H. (2004). Edge and region-based segmentation technique for the extraction of large, man-made objects in high-resolution satellite imagery. Pattern Recognition, 37(8), 1619 – 1628.
José Giovanni Guzmán Lugo
He received his Bachelor Degree in Computer Systems from the ESCOM-IPN in 1999 and his M.S. and Ph.D., in Computer Sciences from the Center for Computing Research of the IPN in 2003 and 2007 respectively. He has published more than 40 papers in National and International Journals and Conferences. He is currently a full time professor at the Laboratory of Intelligent Processing of Geospatial Information. His current research interest is the semantic processing of raster data.
Serguei Levachkine
Is a Professor and Researcher of the CIC-IPN and member of the Laboratory of Intelligent Processing of Geospatial Information. He obtained his Ph. D. degree from the Moscow State University. Additionally, he has published more than 150 papers in National and International Journals and Conferences. His research efforts are mainly in the transition from data to semantics, in a variety of areas such as databases, artificial intelligence, cognitive science, human-computer interaction, information retrieval and integration, intelligent geographic information systems (GIS), and so on.