50
GENERAL ATOMIC SPECTROSCOPY ENERGY LEVELS, ABSORPTION, EMISSION, ATOMIZATION ATOMIC ABSORPTION: FLAME, FURNACE, HYDRIDE, COLD VAPOR
GENERAL ATOMIC SPECTROSCOPY
ENERGY LEVELS, ABSORPTION, EMISSION,ATOMIZATION
ATOMIC ABSORPTION: FLAME, FURNACE, HYDRIDE, COLD VAPOR

BOOKS
ICPs in Analytical Atomic SpectrometryMontaser, Ed., VCH, 1992.
Handbook of ICP-AES, Thompson & WalshViridian Publishing, reprinted 2003.
Winge, Fassel et al. ICP-AES: An Atlas of Spectral Information, Elsevier, 1985.
Ingle & Crouch, Spectrochemical Analysis, Prentice Hall, 1988
Also NBS, MIT Wavelength Tables

IE
ATOMIC SPECTROSCOPY
M0
M*
(M+)0
(M+)* ATOMIC LEVELSNO VIB - ROT SUBLEVELSSHARP LINESHIGH SELECTIVITY(+)ONLY DETERMINE ELEMENTNOT COMPOUND (-)
AA AE
PRODUCE FREE ATOMSFROM SAMPLE ?EXCITE EMISSION (AE)
WITH ADDITIONAL SOURCE:-ABS. (AA) FROM LOWER STATE (USUALLY GROUND STATE)-FLUORESCENCE (AF)

Winge, ICP-AES, An Atlas of Spectral Lines

C. E. MOORE ATOMIC ENERGY LEVELS
Singlet → singlet allowedP → S allowedOne line35051 cm-1 = 285.3 nm
Triplet → singletForbidden, no lines
TRANSITIONS TO GROUND STATE

C. E. MOORE ATOMIC ENERGY LEVELSTRANSITIONS TOGROUND STATE
Doublet → doublet allowedP → S allowedTwo J values in upper state, Two lines
35760 & 35669 cm-1
279.63 & 280.36 nm
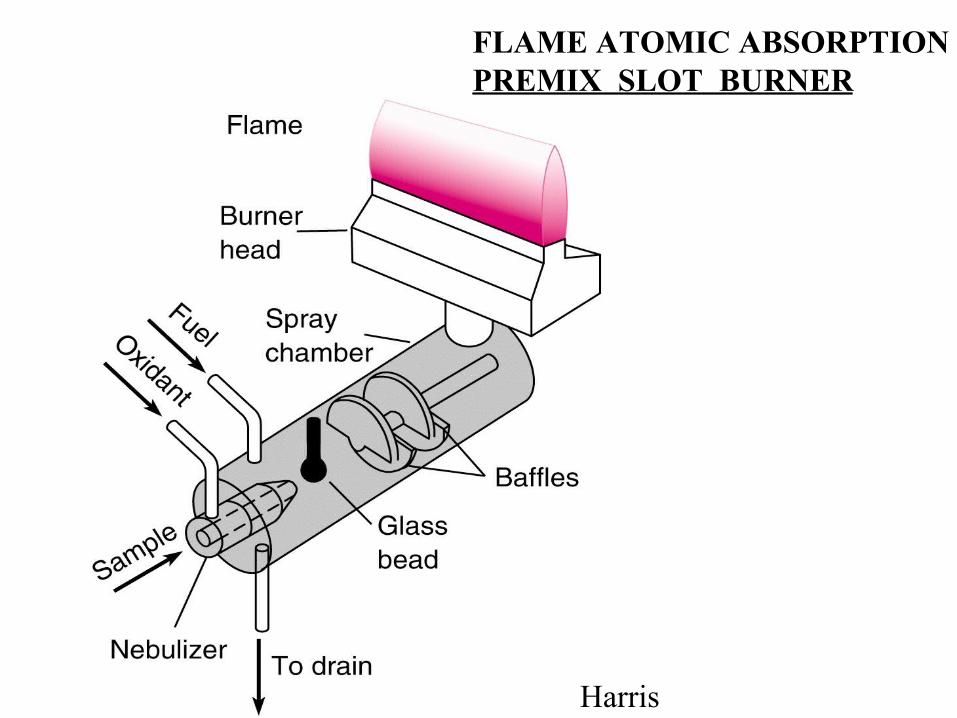
FLAME ATOMIC ABSORPTIONPREMIX SLOT BURNER
Harris

Harris
FURNACE ATOMIC ABSORPTION

COLD VAPOR AAS FOR Hg
Sample
AddNaBH4
Skoog et al., 5th ed.

INDUCTIVELY COUPLED PLASMA – ATOMIC EMISSION SPECTROMETRY
ICP-AES

INDUCTIVELY COUPLED PLASMA (ICP)
NORMAL ANALYTICAL ZONE (blue)
INITIAL RAD. ZONE (red)
INDUCTION REGION
OUTER GAS FLOW
AEROSOL GAS FLOW INTO AXIAL CHANNEL
LOADCOIL
TORCH

NEBULIZATIONBrowner & Boorn, Anal. Chem. 1984, 56, 786A, 875A.Sharp, J. Anal. Atomic Spectrom. 1988, 3, 613, 939.Sneddon, Sample Intro in Atomic Spectroscopy, Elsevier, 1990.
Pneumatic Nebulizer - liquid disrupted by gas flow
LIQ.1 mL/minusual, as lowas 20 μL/min
GASICP - Ar, ~ 1 L/minFlame - oxidant, ~ 5 L/min air, O2, N2O
CONCENTRIC NEB., MEINHARD NEB.
Notreq’d.

Aerosol out
Coolant
Fig. 21. Cooled spray chambers for solvent removal. a) cooled double pass Scott chamber b) Cyclone chamber, side and top views. In both chambers, most of the large droplets are deposited at the bends, while fine droplets pass out to the plasma.
Drain

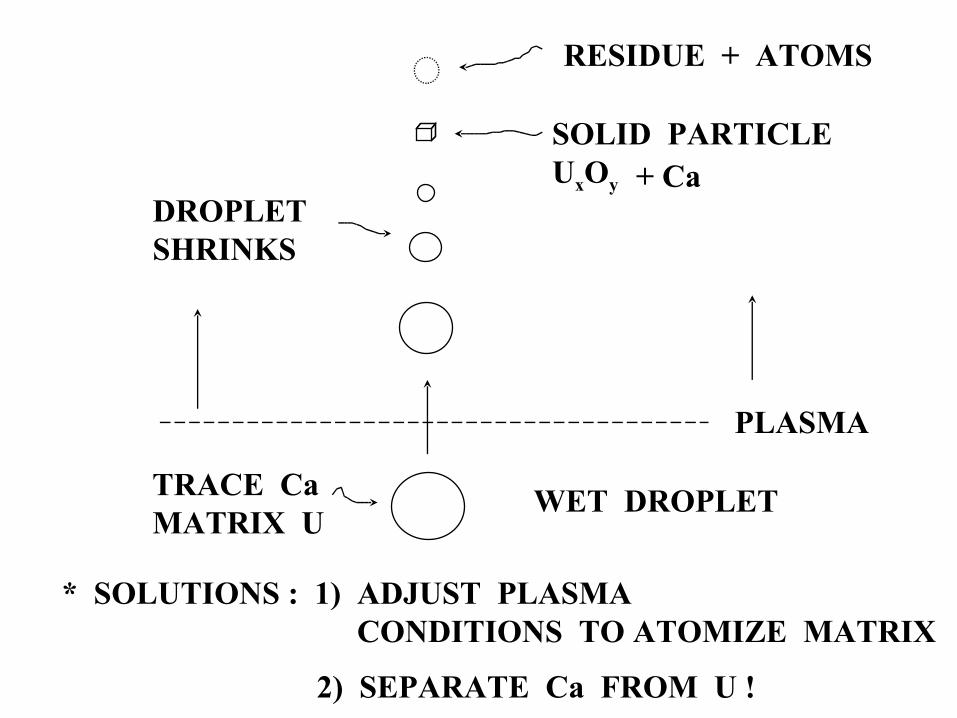
RESIDUE + ATOMS
SOLID PARTICLEUxOy
PLASMA
DROPLETSHRINKS
WET DROPLETTRACE CaMATRIX U
* SOLUTIONS : 1) ADJUST PLASMA CONDITIONS TO ATOMIZE MATRIX
+ Ca
2) SEPARATE Ca FROM U !
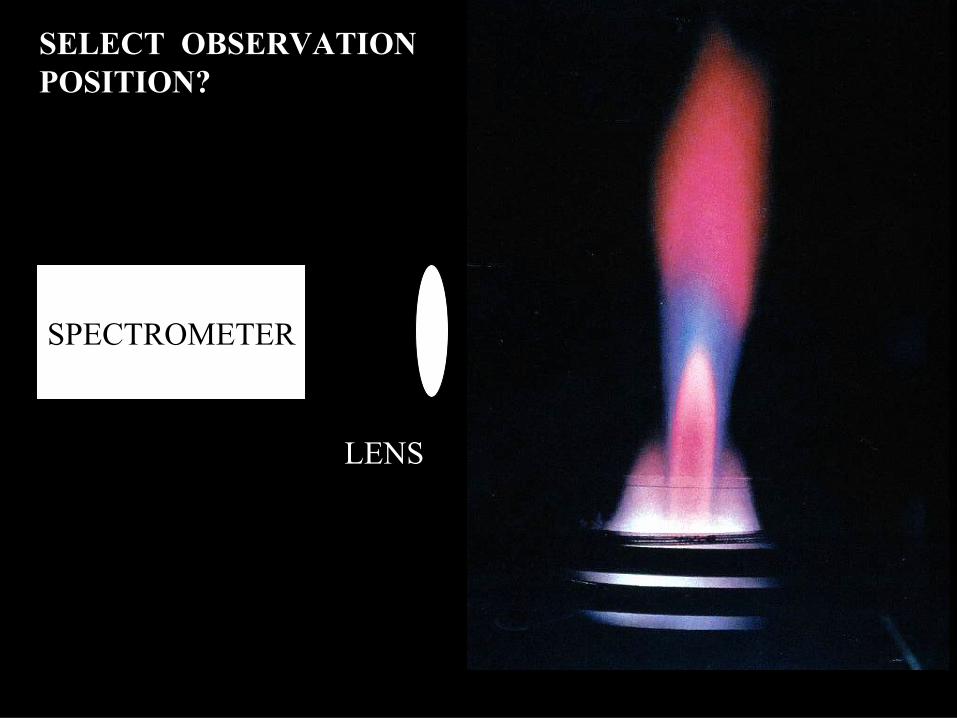
SELECT OBSERVATIONPOSITION?
SPECTROMETER
LENS

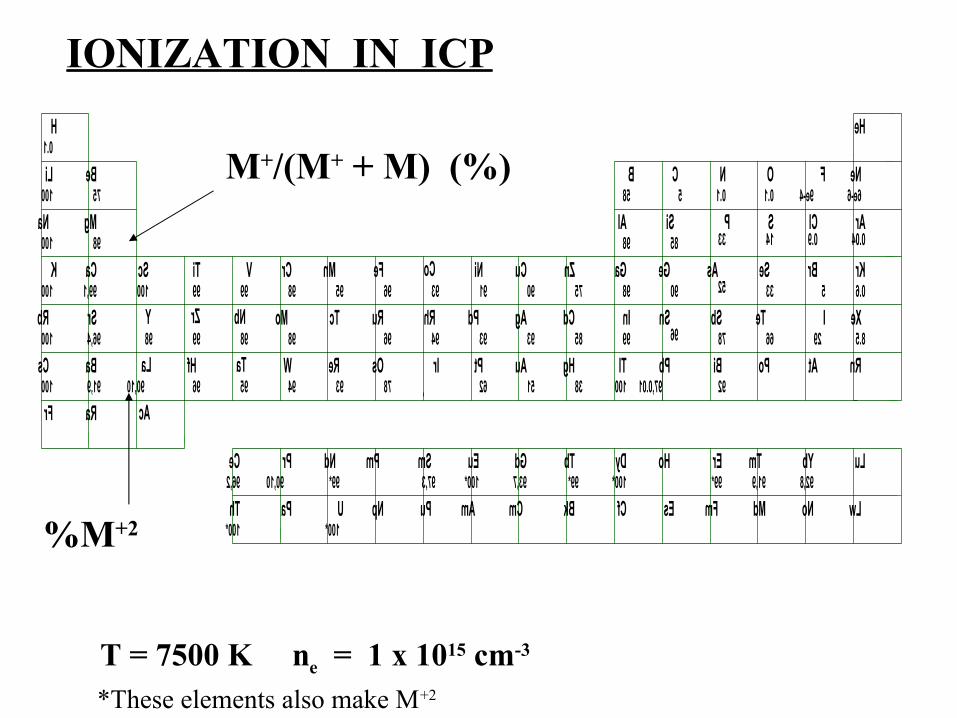
IONIZATION IN ICP
T = 7500 K ne = 1 x 1015 cm-3
Y Zr Nb
La Ta
Ac
Co Cu Zn
B C N O F
He
Ne
Al Si P S Cl Ar
Ga Ge As Se Br Kr
Mo Tc Ru Rh Pd Ag Cd In Sn Sb Te I Xe
W Re Os Ir Pt Au Hg Tl Pb Po At Rn
Cr Mn Fe Ni
Hf Bi
Fr Ra
Ce Pr Nd Pm Sm Eu Gd Tb Dy Ho Er Tm Yb Lu
Th Pa U Np Pu Am Cm Bk Cf Es Fm Md No Lw
H
Li Be
Na
K Ca
Rb Sr
Cs Ba
VSc Ti
0.1
100 75
100 98Mg
100 100 99 99 98 95 96 93 91 90 75 90
98
98
98 94 93 93 8596
94 93 78 62 51 38 100
99 96 78 66 29 8.5
92
58 5 0.1 0.1 9e-4 6e-6
85 33 14 0.9 0.04
52 33 5 0.6
100
100
96,4
91,9
98
90,10
99,1
97,0.0196 95
96,2 90,10 99* 97,3 100* 93,7 99* 100*
100* 100*
99* 91,9 92,8
99 98
*These elements also make M+2
M+/(M+ + M) (%)
%M+2

Winge et al.ICP Atomic Emission SpectroscopyAn Atlas of Spectral InfoElsevier, 1985
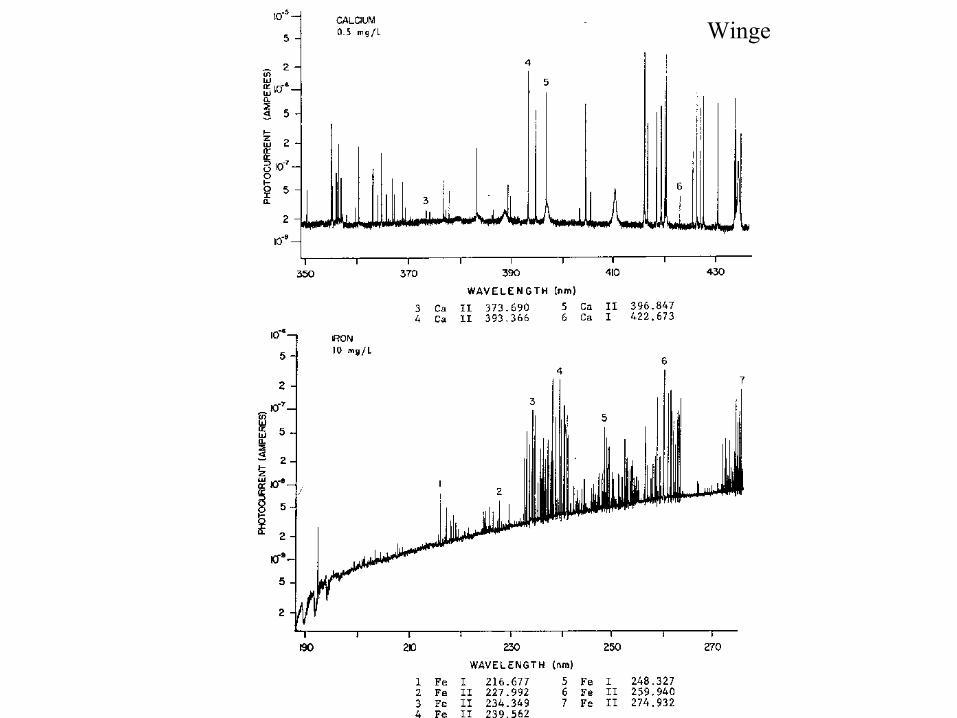
Winge


*Other matricesmay not show samecancellation effect!

0.7
0.8
0.9
1
1.1
Relative in
ten
sity
012345% NaCl
BaBa/ScCuCu/ScSrSr/Sc
Role of Sc II as internal standard

Sequential ICPMonochromator

CONCAVE GRATINGFOCUSES COMPONENTS ONTO CIRCLE
ONE EXIT SLIT & PMT FOR EACH LINE DESIRED,PRESET DIFF. ANGLES
SIMULTANEOUS MEAS.OF AS MANY LINES AS PMTs
SHORT SCAN THRU EACHλ REGION WITH QUARTZREFRACTOR PLATE
(p. 121)
Ent. slit
TYPES OF GRATING SPECTROMETERROWLAND CIRCLE MOUNT PASCHEN - RUNGE MOUNT, DIRECT READER
Entranceslit
PMT
PMT

PASCHEN-RUNGE MOUNT, SPECTRO CIROS

HIGH RESOLUTION? LARGE LINEAR DISPERSION
Dl = f Da = f m / (d cos β F/n = f/Dp
Ω = Ap / f2 = π /4 (F/n)2
1. LARGE f (LARGE f-NUMBER, SMALL Ω LOW THROUGHPUT, LARGER INST. HARDER TO MAKE, LESS STABLE THERMALLY, ... )
2. FINELY-RULED GRATING, SMALL d (MECH. DIFFICULT)
3. LARGE ORDER m (LOW FSR = λ / m , ORDERS OVERLAP )
4. β 90O, cos β SMALL (DISP. CHANGES WITH λ, λ SCALE NONLINEAR).
SOLUTION:USE V. LARGE m ~ 50 - 100 β ~ 50o - 70o
MEDIUM f LARGE d
ECHELLE SPECTROMETER *V. SHORT FSR?
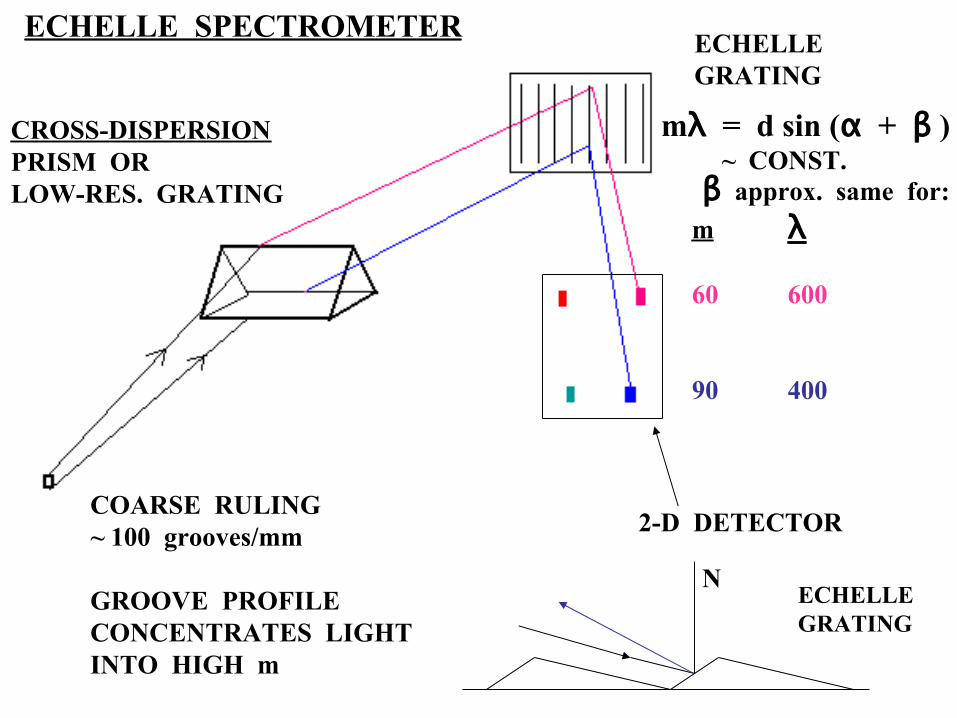
CROSS-DISPERSIONPRISM ORLOW-RES. GRATING
ECHELLE GRATING
mλ = d sin (α + β ) ~ CONST.
β approx. same for:m λ
60 600
90 400
2-D DETECTOR
N
COARSE RULING~ 100 grooves/mm
GROOVE PROFILECONCENTRATES LIGHTINTO HIGH m
ECHELLEGRATING
ECHELLE SPECTROMETER

ECHELLE SPECTRUM


AXIAL VIEWING+ ECHELLE + CCD


BAND STRUCTURE OF SEMICONDUCTORSE
nerg
y
VALENCE BANDELECTRONS LOCALIZEDON SPECIFIC ATOMS
CONDUCTION BANDELECTRONS “FREE”
BANDGAP = E OF PHOTON HIGHEST λ

CHARGE TRANSFER DETECTORSDENTON et al ANAL. CHEM. 1988, 60, 282A, 327A. REQD.
p - Si
SiO2hν metal gates, all + 15 V+ 15
1. INTEGRATE SPECTRUM# e- Φ tunder each λgate region
-+
+15
2. READOUT SHIFT CHARGE MEASURE CHARGE EACH PIXEL
0

CHARGE COUPLED DETECTOR - CCD
SERIALREGISTER
AMP
p-doped Si e- collected & shiftedNo multiplexing circuitryDark current v. low 0.03 to < 0.001 e-/sShift chg. sequentially down to serial registerRead out WHOLE LINECan’t read individual detector element
1-D SPECTRUM? USE BINNING:-sum, read out all charges on single line.-noise of one read only.
hν
C hargeC onsumedD

CHARGE INDUCED DETECTOR CID - INTEGRATE STEP
++++ +
hν+ 15 0
collectingelements
sensingelements
n-doped Si*Collect holes under collecting element.
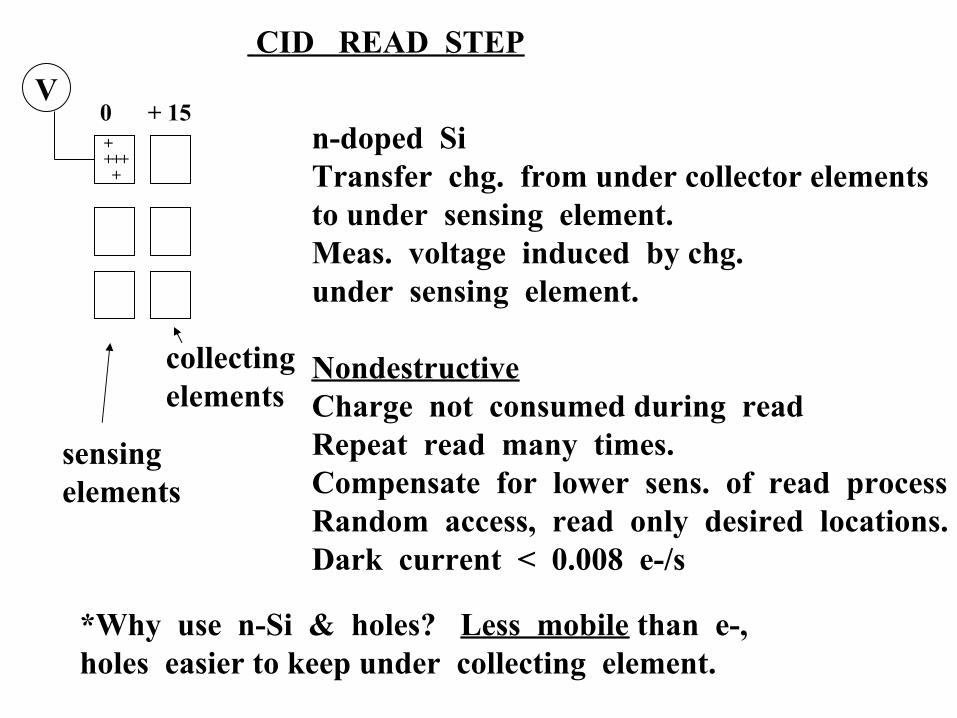
n-doped SiTransfer chg. from under collector elements to under sensing element.Meas. voltage induced by chg. under sensing element.
Nondestructive Charge not consumed during readRepeat read many times.Compensate for lower sens. of read processRandom access, read only desired locations.Dark current < 0.008 e-/s
*Why use n-Si & holes? Less mobile than e-, holes easier to keep under collecting element.
CID READ STEP
collectingelements
V+++++
0 + 15
sensingelements
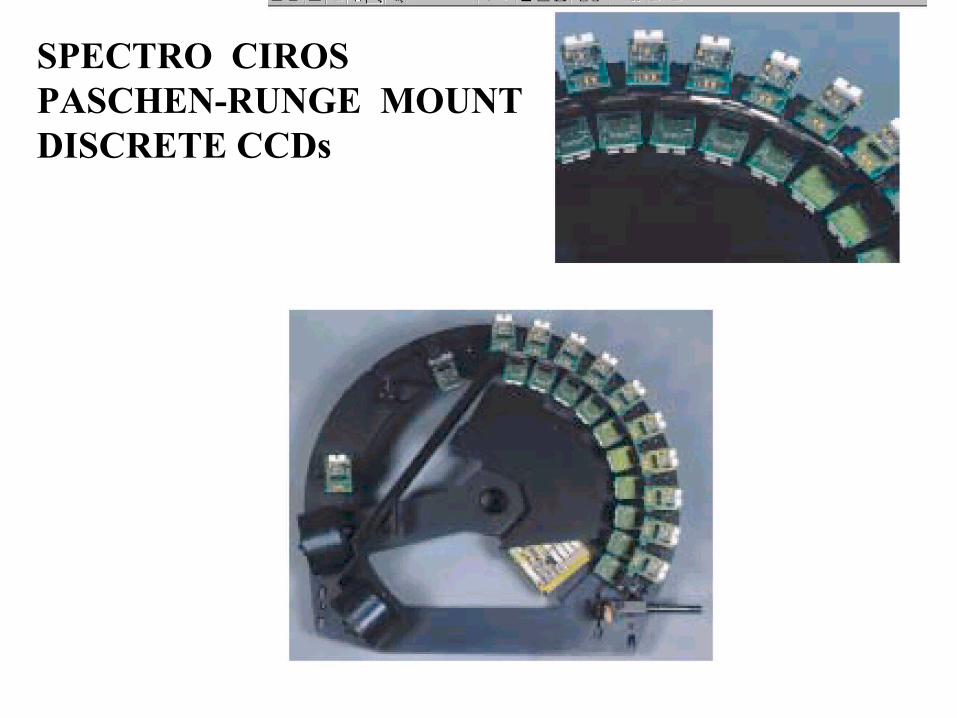
SPECTRO CIROSPASCHEN-RUNGE MOUNTDISCRETE CCDs


“RADIAL” AXIALLODs 1-10 ppb 20 – 200 ppt
LINEAR ~1e6 ~1e6RANGE(FROM LOD)
SOLUTE 1% SOLNS. 0.1% ATLEVEL & NO PROBLEM BEST DLMATRIXINTERFERENCE 1% OK
IF ACCEPT MATRIX EFFECT OR SACRIFICE LOD TO 0.1 – 1 ppb
SPECTRAL SUBSTANTIALINTERFERENCE EITHER METHOD

CHALLENGES FOR ICP-AES
• Improving LODs to subppb• Reduce matrix effects due to EIS, Ca, acids,
organics• Improve precision and accuracy• On-line sample treatment (preconcentration,
matrix elimination, decomposition)• Direct solids analysis using lasers
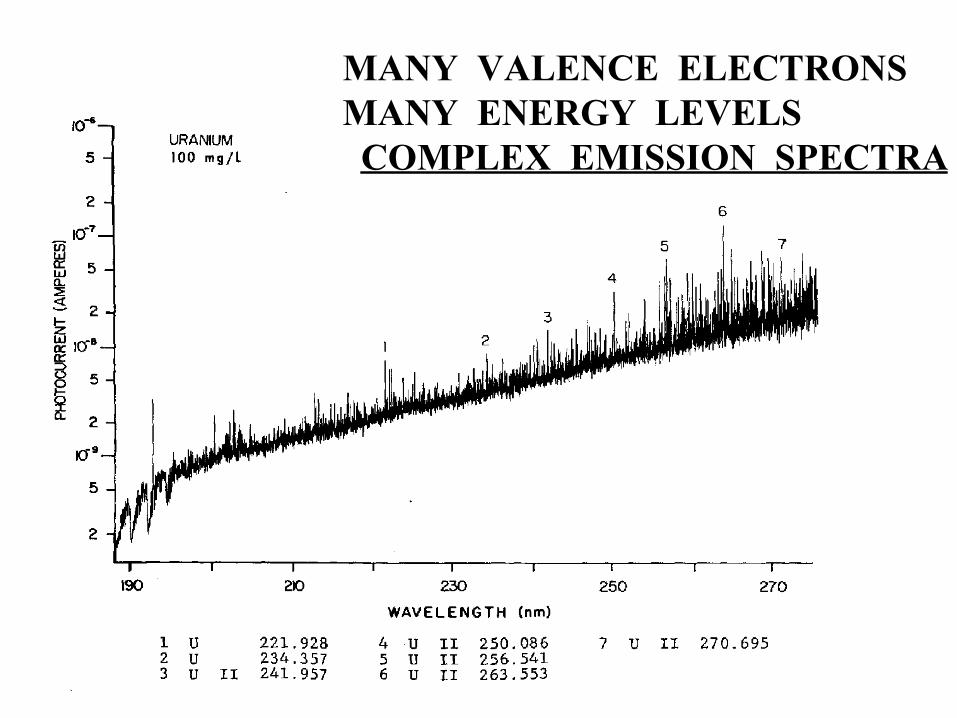
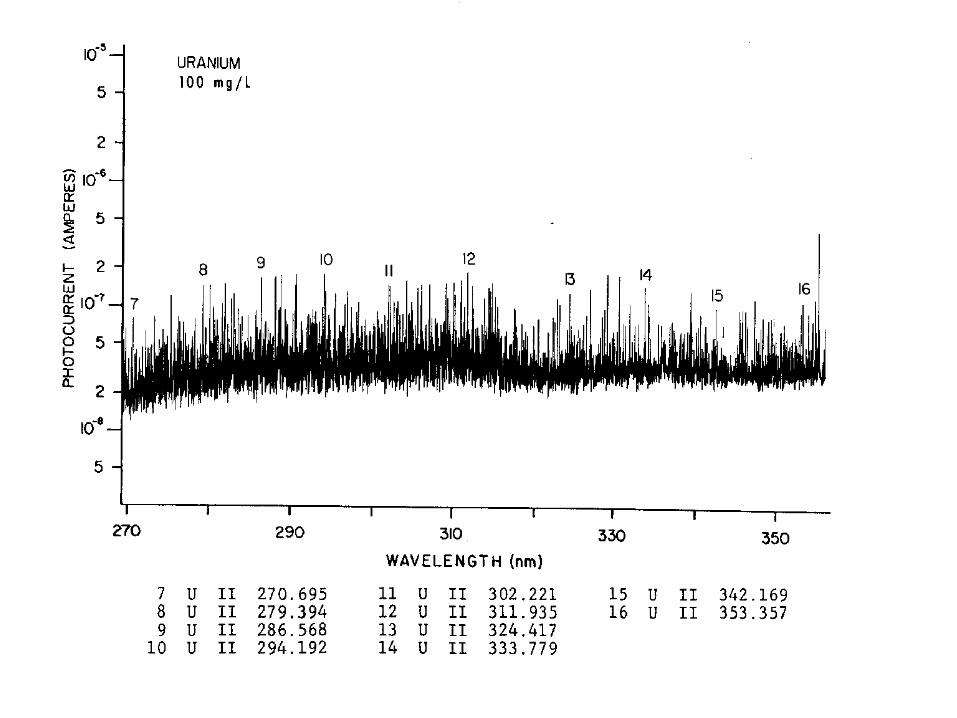
MANY VALENCE ELECTRONSMANY ENERGY LEVELS COMPLEX EMISSION SPECTRA


Signal / Background Ratio larger for smaller spectral band pass
(right)

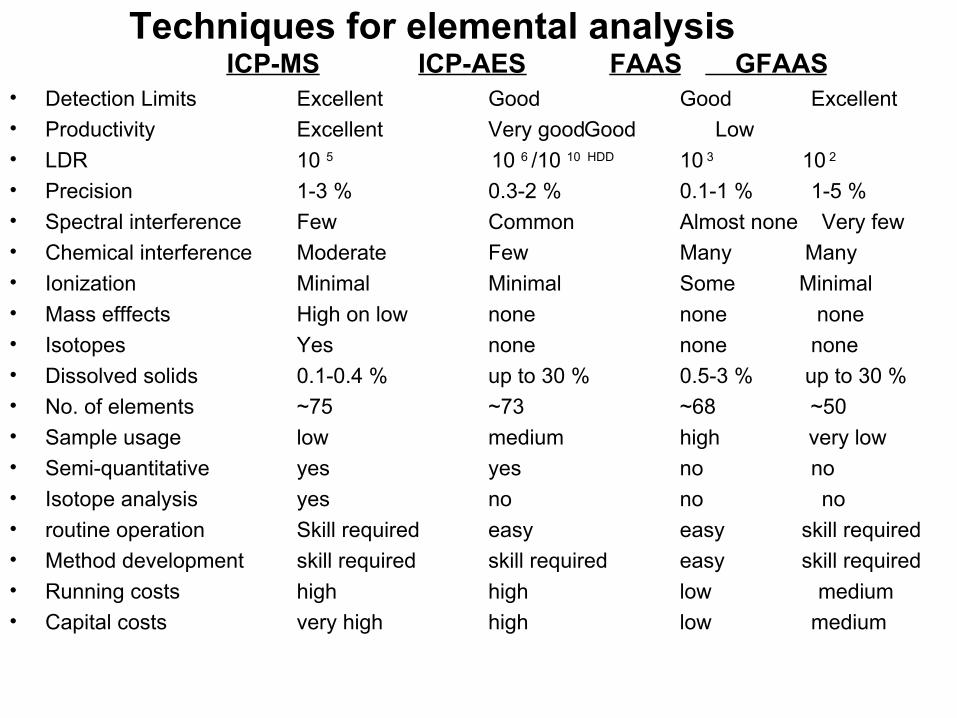
Techniques for elemental analysis ICP-MS ICP-AES FAAS GFAAS
• Detection Limits Excellent Good Good Excellent• Productivity Excellent Very goodGood Low• LDR 10 5 10 6 /10 10 HDD 10 3 10 2
• Precision 1-3 % 0.3-2 % 0.1-1 % 1-5 %• Spectral interference Few Common Almost none Very few• Chemical interference Moderate Few Many Many• Ionization Minimal Minimal Some Minimal• Mass efffects High on low none none none• Isotopes Yes none none none• Dissolved solids 0.1-0.4 % up to 30 % 0.5-3 % up to 30 %• No. of elements ~75 ~73 ~68 ~50• Sample usage low medium high very low• Semi-quantitative yes yes no no• Isotope analysis yes no no no• routine operation Skill required easy easy skill required• Method development skill required skill required easy skill required• Running costs high high low medium• Capital costs very high high low medium


