General Electric CAUTION CONCERNING FORWARD-LOOKING STATEMENTS: This document contains "forward-looking statements" – that is, statements related to future events that by their nature address matters that are, to different degrees, uncertain. For details on the uncertainties that may cause our actual future results to be materially different than those expressed in our forward-looking statements, see http://www.ge.com/investor-relations/disclaimer-caution-concerning-forward-looking-statements as well as our annual reports on Form 10-K and quarterly reports on Form 10-Q. We do not undertake to update our forward-looking statements. This document also includes certain forward-looking projected financial information that is based on current estimates and forecasts. Actual results could differ materially. NON-GAAP FINANCIAL MEASURES: In this document, we sometimes use information derived from consolidated financial data but not presented in our financial statements prepared in accordance with U.S. generally accepted accounting principles (GAAP). Certain of these data are considered “non-GAAP financial measures” under the U.S. Securities and Exchange Commission rules. These non-GAAP financial measures supplement our GAAP disclosures and should not be considered an alternative to the GAAP measure. The non-GAAP financial measures we use in this document include Industrial net debt and the ratio of Industrial net debt to EBITDA. We cannot provide an equivalent GAAP guidance range for our Industrial net debt to EBITDA targets, which are calculated based on rating agency methodologies, without unreasonable effort. Industrial net debt reflects the total of gross debt, after-tax pension contributions, adjustments for operating lease obligations, and adjustments for 50% of preferred stock, less 75% of GE’s cash balance. There is significant uncertainty on the timing and amount of events that could give rise to items included in the determination of this metric, including the timing of pension funding, proceeds from dispositions, and the impact of interest rates on our pension assets and liabilities. EBITDA excludes Oil & Gas EBITDA, but it includes the BHGE dividend, and it also excludes other income, non-operating benefits costs, and adjustments for operating lease income or cost. There is significant uncertainty on the timing and amount of events that could give rise to items included in the determination of this metric, including the timing and magnitude of restructuring activities and the timing of dispositions. General Electric Capital Corporation (GECC) was merged into GE in 2015 and our financial services business is now operated by GE Capital Global Holdings LLC (GECGH). In this document, we refer to GECC and GECGH as “GE Capital”. We refer to the industrial businesses of the Company including GE Capital on an equity basis as “GE”. “GE (ex-GE Capital)” and /or “Industrial” refer to GE excluding GE Capital. GE’s Investor Relations website at www.ge.com/investor and our corporate blog at www.gereports.com , as well as GE’s Facebook page and Twitter accounts, contain a significant amount of information about GE, including financial and other information for investors. GE encourages investors to visit these websites from time to time, as information is updated and new information is posted. TRANSACTION-RELATED INFORMATION: For important information about securities laws and forward looking statements involving the GE Transportation and Wabtec transaction, see https://www.ge.com/investor-relations/special-transaction-disclaimer-securities-laws-and-forward-looking-statements. Company Update June 26, 2018
Transcript
General Electric
CAUTION CONCERNING FORWARD-LOOKING STATEMENTS:This document contains "forward-looking statements" – that is, statements related to future events that by their nature address matters that are, to different degrees, uncertain. For details on the uncertainties that may cause our actual future results to be materially different than those expressed in our forward-looking statements, see http://www.ge.com/investor-relations/disclaimer-caution-concerning-forward-looking-statements as well as our annual reports on Form 10-K and quarterly reports on Form 10-Q. We do not undertake to update our forward-looking statements. This document also includes certain forward-looking projected financial information that is based on current estimates and forecasts. Actual results could differ materially.
NON-GAAP FINANCIAL MEASURES:In this document, we sometimes use information derived from consolidated financial data but not presented in our financial statements prepared in accordance with U.S. generally accepted accounting principles (GAAP). Certain of these data are considered “non-GAAP financial measures” under the U.S. Securities and Exchange Commission rules. These non-GAAP financial measures supplement our GAAP disclosures and should not be considered an alternative to the GAAP measure. The non-GAAP financial measures we use in this document include Industrial net debt and the ratio of Industrial net debt to EBITDA. We cannot provide an equivalent GAAP guidance range for our Industrial net debt to EBITDA targets, which are calculated based on rating agency methodologies, without unreasonable effort. Industrial net debt reflects the total of gross debt, after-tax pension contributions, adjustments for operating lease obligations, and adjustments for 50% of preferred stock, less 75% of GE’s cash balance. There is significant uncertainty on the timing and amount of events that could give rise to items included in the determination of this metric, including the timing of pension funding, proceeds from dispositions, and the impact of interest rates on our pension assets and liabilities. EBITDA excludes Oil & Gas EBITDA, but it includes the BHGE dividend, and it also excludes other income, non-operating benefits costs, and adjustments for operating lease income or cost. There is significant uncertainty on the timing and amount of events that could give rise to items included in the determination of this metric, including the timing and magnitude of restructuring activities and the timing of dispositions.
General Electric Capital Corporation (GECC) was merged into GE in 2015 and our financial services business is now operated by GE Capital Global Holdings LLC (GECGH). In this document, we refer to GECC and GECGH as “GE Capital”. We refer to the industrial businesses of the Company including GE Capital on an equity basis as “GE”. “GE (ex-GE Capital)” and /or “Industrial” refer to GE excluding GE Capital.
GE’s Investor Relations website at www.ge.com/investor and our corporate blog at www.gereports.com, as well as GE’s Facebook page and Twitter accounts, contain a significant amount of information about GE, including financial and other information for investors. GE encourages investors to visit these websites from time to time, as information is updated and new information is posted.
TRANSACTION-RELATED INFORMATION:For important information about securities laws and forward looking statements involving the GE Transportation and Wabtec transaction, see https://www.ge.com/investor-relations/special-transaction-disclaimer-securities-laws-and-forward-looking-statements.
• Focusing portfolio for growth & shareholder value creation– GE will be a premier high-tech industrial company … Aviation, Power & Renewable Energy – Creating a standalone GE Healthcare company over the next 12-18 months– Orderly separation of BHGE over the next 2-3 years– Separating Transportation in conjunction with previously announced Wabtec transaction
Making GE a simpler, stronger and more focused company
• Strengthening balance sheet a top priority … <2.5x Industrial net debt/EBITDA in 2020– ~$25B Industrial net debt reduction – Higher cash balances and less use of commercial paper– Materially shrinking GE Capital balance sheet
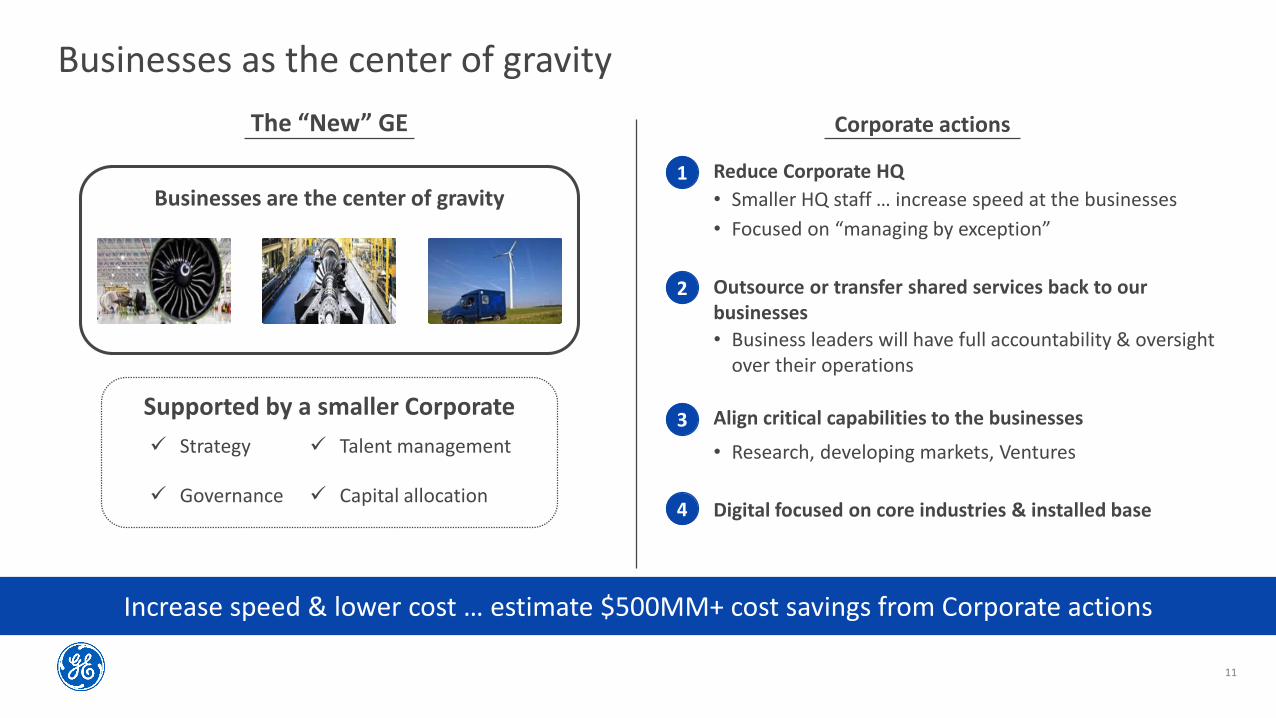
• Running the company with the businesses as the center of gravity – Corporate focused on strategy & execution, capital allocation, talent development & governance– $500MM+ in incremental Corporate cost out– Central services aligned to business units
• Larry Culp to succeed Jack Brennan as Lead Director
Focusing portfolio for growth & shareholder value creation
- GE will be a premier high-tech industrial company
- Creating a standalone GE Healthcare company
- Orderly separation of BHGE
4
Portfolio philosophy
Shift in culture and philosophyPosition businesses to reach full potential
• Position businesses for organic & inorganic growth … optimize performance for each of our businesses
From Protocol driven Too much data, in too many different places
Costly and risky R&D Complex and unguided Patients only monitored when sick
To Highly personalized Integrated, longitudinal,fueled by AI
Precisely targetedclinical trials
Complex processes simplified. Precision
interventions. Additive
Proactive approach to wellness beyond the
hospital
We are leading industry in journey to deliver on promise of Precision Health … better outcomes delivered more efficiently
Each patient ... digitally connected
Only GE Healthcare can do this … combining our expertise & leadership across Diagnostics, Monitoring and Digital to serve the needs of Providers, Pharma and Med-tech
17
Building the future of Precision Health($ in billions)
In pursuit of a bolder agenda …
• Attractive, highly-visible returns
• Accelerate investments in core franchises
• Cycle into higher growth adjacencies, leveraging core