46


2019-2020 Polk State College FactBook iCONTENTS.doc
C O N T E N T S
GENERAL INFORMATION About Polk State College ....................................................................................................................... i through iv Programs of Study 2018-19 ............................................................................................................................... 1.1 Programs of Study 2019-20 ............................................................................................................................... 1.2 Credit Course Fees: 3-Year Profile ................................................................................................................... 1.3 FTE FTE Enrollment ............................................................................................................................................. 2.1 Enrollment Profile (Fall) ..................................................................................................................................... 2.2 Enrollment Profile (Annual) ........................................................................................................................ 2.3 Hours & FTE by Campus (Fall) ....................................................................................................................... 2.4 Hours & FTE by Campus (Annual) ............................................................................................................... 2.5 HEADCOUNT Unduplicated Headcount by ICS Code ......................................................................................................... 3.1 Baccalaureate Program Enrollment (Unduplicated Headcount by ICS Code) ................................................ 3.1a Baccalaureate Program Enrollment (Unduplicated Headcounty by ICS Code) Summary .............................. 3.1b Unduplicated Headcount by ICS Code: 5-Year Profile ..................................................................................... 3.2 Unduplicated Headcount by Campus (Annual) ............................................................................................ 3.3 COMPLETIONS - Annual Polk State Completions History .................................................................................................................. 4.1 Degree Completions by Award Type ............................................................................................................. 4.2 AA1A Enrollment and Completions Detail .................................................................................................... 4.3 AA1A Enrollment and Completions Summary ............................................................................................... 4.4 DEMOGRAPHICS Unduplicated Credit Headcount by Age (Fall) .............................................................................................. 5.1 Unduplicated Credit Headcount by Age (Annual) ........................................................................................ 5.2 Unduplicated Credit Headcount by Ethnicity (Fall) ....................................................................................... 5.3 Unduplicated Credit Headcount by Ethnicity (Annual) ................................................................................. 5.4 Unduplicated Credit Headcount by Gender (Fall) ........................................................................................ 5.5 Unduplicated Credit Headcount by Gender (Annual) .................................................................................. 5.6 Unduplicated Credit Headcount by FT/PT and Ethnicity (Fall) ........................................................................ 5.7 Unduplicated Credit Headcount by FT/PT and Ethnicity (Annual) .................................................................. 5.8 Unduplicated Credit Headcount by FT/PT and Gender (Fall) ......................................................................... 5.9 Unduplicated Credit Headcount by FT/PT and Gender (Annual) ................................................................ 5.10 GLOSSARY
2019-2020 Polk State College Factbook Source: 2020-2021 Catalog, SDB, and SAS
2020-2021 District Board of Trustees
Cynthia “Cindy” Hartley Ross, Chair Ashley Bell Barnett, Vice Chair
Dan Dorrell Greg Littleton
Teresa V. Martinez Mark G. Turner
________________
President
Angela M. Garcia Falconetti
Accreditation Polk State College is accredited by the Southern Association of Colleges and Schools Commission on Colleges (SACSCOC) to award baccalaureate and associate degrees, diplomas, and certificates. Contact the Southern Association of Colleges and Schools Commission on Colleges at 1866 Southern Lane, Decatur, Georgia 30033-4097 or call 404-679-4500 for questions about the accreditation of Polk State College. The Commission is to be contacted only if there is evidence of an institution’s significant non-compliance with a requirement or standard.
Other Accreditations The Commission on Accreditation of Allied Health Education Programs (CAAHEP) The Accreditation Commission for Education in Nursing (ACEN) The Commission on Accreditation in Physical Therapy Education (CAPTE) The Committee on Accreditation of Educational Programs for the Emergency Medical Services
Professions (CoAEMSP) The Accreditation Council for Occupational Therapy Education (ACOTE) The Joint Review Committee on Education in Radiologic Technology (JRCERT) The Commission on Accreditation for Law Enforcement Agencies, Inc., (CALEA®) Public Safety
Training Academy Accreditation The Commission on Accreditation for Respiratory Care (CoARC) The Joint Review Committee on Education in Cardiovascular Technology (JRC-CVT)
i.

2019-2020 Polk State College Factbook Source: 2020-2021 Catalog, SDB, and SAS
History Polk State College, the first public higher education institution in Polk County, opened its doors in 1964 at a former World War II Army Air Force Base in Bartow.
During its first semester of operation, the College served nearly 1,200 students —twice the number expected — and it has continued to grow ever since.
In 1966, ground was broken for Polk State’s first permanent campus, Polk State Winter Haven, located on the shores of Lake Elbert. Within a decade, the campus had expanded to include numerous buildings, accommodating a growing student body and increased program offerings.
By 1988, Polk State’s footprint in the county had grown to include a second campus, Polk State Lakeland, located on a former orange grove along U.S. 98 South between Lakeland and Bartow. In the years that followed, Polk State expanded its Lakeland campus and added the Polk State Airside Center, located in South Lakeland. Polk State continued to grow throughout the first decade of 2000, expanding access to higher education in the southeast Polk County with the addition of the Polk State JD Alexander Center in downtown Lake Wales.
Aside from expanding its physical presence in the county, in recent years the College has also added a suite of baccalaureate programs to its degree options. These include the Bachelor of Applied Science in Supervision and Management, the Bachelor of Science in Nursing, the Bachelor of Science in Criminal Justice, the Bachelor of Science in Aerospace Sciences, the Bachelor of Science in Early Childhood Education, and the Bachelor of Science in Elementary Education.
To reflect its new status as a baccalaureate institution, in 2009 the College changed its name to Polk State; previously it had been known as Polk Community College and, earlier in its history, Polk Junior College. Two years later, the College rebranded, adopting the Eagle as its mascot — chosen based on Polk County’s large eagle population — and a red, black, and white color scheme.
In 2014, the College expanded again, adding the Polk State Clear Springs Advanced Technology Center. The 45,000 square-foot facility off State Road 60 in Bartow houses high-tech degree programs and the Polk State Corporate College, which provides workforce training.
The growth continues at Polk State. In 2016, the Polk State Center for Public Safety opened in Winter Haven. The state-of-the-art facility houses the Polk State Kenneth C. Thompson Institute for Public Safety, as well as the College’s other public safety training and degree programs. The College also recently added a second location in South Lakeland, Polk State Airside Center East, to house its Aerospace Program; the original Airside location is now called Polk State Airside West and is home to the College’s medical imaging programs.
ii.

2019-2020 Polk State College Factbook Source: 2020-2021 Catalog, SDB, and SAS
Locations Lake Wales JD Alexander Center 152 E. Central Avenue Lake Wales, Florida 33853
Lakeland Lakeland Campus 3425 Winter Lake Road Lakeland, Florida 33803
Winter Haven Winter Haven Campus 999 Avenue H, NE Winter Haven, Florida 33881
Center for Public Safety 1251 Jim Keene Boulevard Winter Haven, Florida 33880
Airside West 3515 Aviation Drive Lakeland, Florida 33811
Airside East 2949 Airside Center Drive Lakeland, Florida 33811
Bartow Clear Springs Advanced Tech. Center 310 Technology Drive Bartow, Florida 33830
Mission Polk State College, a quality-driven institution serving Polk County and beyond, transforms students’ lives through the power of teaching and lifelong learning by providing access to affordable associate and baccalaureate degrees, career certificates and workforce employment programs, delivered through various modalities and innovative technologies and by diverse, qualified faculty and staff.
Updated and approved by Polk State College’s District Board of Trustees on December 2, 2019 Vision Polk State College will be the first choice for higher education in Polk County. Student Success Polk State College defines student success as the completion of individual higher education and career goals. Strategic Goals 1. Promote Retention - By Academic Year 2021-2022, Fall- to-Fall retention will increase by 2 percentage points. Objectives
• Use data-informed decision making and continuous improvement to increase transparency, inclusivity, and innovation throughout the College.
• Ensure financial, physical, and technological resources are adequate to support institutional programs and departments.
2. Support Completion - By Academic Year 2021-2022, the total number of academic awards earned will increase by 5 percent. Objectives
• Provide students with a program of study that contains a clear, effective path from entry to graduation. (FCS Goal 3.1)
iii.

2019-2020 Polk State College Factbook Source: 2020-2021 Catalog, SDB, and SAS
2020-2021 Degrees Offered Bachelor of Applied Science (BAS) 1 Bachelor of Science (BS) 4 Bachelor of Science in Nursing (BSN) 1 Associate of Arts (AA) 1 Associate of Science (AS) 28 Associate of Applied Science (AAS) 1 Advanced Technical Certificate (ATC) 4 Credit and Vocational Certificate (VC) 24 Educator Preparation Certificate (EPI) 1
Headcount Enrollment for 2019-2020 Total Annual Headcount for Credit 15,144 Upper-Level Credit Headcount 1,849 Lower-Level Credit Headcount 13,565
Fees for 2020-2021 (per credit hour) Florida Resident (Lower Level) $112.22 Florida Resident (Upper Level) $123.89 Non-Florida Resident (Lower Level) $409.06 Non-Florida Resident (Upper Level) $469.70
iv.

2019-2020 PROGRAMS OF STUDY
Bachelor of Applied Science (BAS)
U5030 Supervision and Management - Business Administration U5130 Supervision and Management - Public Administration U5330 Supervision and Management - Healthcare Administration U5430 Supervision and Management - Business Information Tech.
Bachelor of Science and Bachelor of Nursing (BS and BSN)
S6100 Criminal Justice – from Earned AS S6150 Criminal Justice – from Earned AA S6200 Aerospace Sciences – Professional Pilot S6210 Aerospace Sciences – Aerospace Administration S6300 Early Childhood Education S6310 Elementary Education V6100 Nursing - RN to BSN V6110 Nursing - Concurrent Enrollment in 25515 or 25615
Associate of Arts (AA)
11000 Liberal Arts 11520 Liberal Arts to BAS Track Healthcare Administration 11530 Liberal Arts to BAS Track Business Information Technology 11540 Liberal Arts to BAS Track Business Administration, Public Admin,
Public Safety Management 11910 Liberal Arts to USF Track (Recent FTIC Only) Psychology 11920 Liberal Arts to USF Track (Recent FTIC Only) Biological Health Sciences 11930 Liberal Arts to USF Track (Recent FTIC Only) Aging Health Sciences 11940 Liberal Arts to USF Track (Recent FTIC Only) Social & Behavioral
Health Sciences 11950 Liberal Arts to USF Track (Recent FTIC Only) Health Management 11960 Liberal Arts to USF Track (Recent FTIC Only) Health Information
Technology 11970 Liberal Arts to USF Track (Recent FTIC Only) Information Technology
Associate in Science (AS)
25020 Accounting Technology 25031 Business Administration 25050 Business Operational Management 25240 Computer Systems and Business Analysis 25275 Network Systems Engineering Technology 25320 Early Childhood Education and Management 25450 Emergency Medical Services 25515 Nursing - Generic Option 25535 Occupational Therapy Assistant 25545 Physical Therapist Assistant 25565 Cardiovascular Technology 25575 Radiography 25585 Respiratory Care 25595 Diagnostic Medical Sonography 25615 Nursing – Transition Option 25670 Engineering Technology - Mechanical Design and Fabrication 25690 Engineering Technology - Advanced Manufacturing 25710 Supply Chain Management 25841 Digital Media Technology - Web Production 25842 Digital Media Technology - Video Production 25843 Digital Media Technology - Graphic Design 25900 Criminal Justice Technology 25980 Fire Science Technology
2018-2019 Polk State College Factbook 1.1 Source: 2019-2020 Catalog
26110 Professional Pilot Science 26130 Aerospace Administration 26140 Aviation Maintenance Administration
Associate in Applied Science (AAS)
A5745 Electrical Distribution Technology
Credit Certificate
68000 Child Care Center Management 68010 Preschool 68020 Child Development Early Intervention 68030 Medical Coding Specialist 68040 Bookkeeping Operations 68050 Entrepreneurship 68070 Logistics and Transportation Specialist 68100 Engineering Technology Support Specialist 68130 Emergency Medical Technology 68160 Paramedic 68315 Network Support Technician 68325 Network Infrastructure 68335 Network Server Administration 68400 Graphic Design 68410 Video Production 68420 Web Production Operations
Advanced Technical Certificate (ATC)
41000 Healthcare Administration 41100 Public Safety Management 41200 Business Information Technology 45000 Cardiovascular Technology 47000 Computed Tomography
Vocational Certificate (VC)
58500 Florida CMS Correctional Basic Recruit Training 58510 Correctional Officer Crossover Training to Florida CMS Law
Enforcement Basic Recruit Training 58610 CMS Law Enforcement Basic Recruit 58640 Law Enforcement Auxiliary Officer Basic Recruit Training 58660 Correctional Probation Officer Crossover Training to Florida
CMS Law Enforcement Basic Recruit Crossover Training 58670 Law Enforcement Officer Crossover Training to Florida CMS
Correctional Basic Recruit Training
Educator Preparation Certificate
F9025 Educator Preparation Institute
Note: Some programs are listed with the same title, but have a track subtitle, and are listed on this page with different program numbers. Those programs are identical with the exception of a specialty concentration. However, for tracking and reporting purposes, they have the same CIP code. CIP codes are a classification assigned by the National Center for Education Statistics.

2020-2021 PROGRAMS OF STUDY
Bachelor of Applied Science (BAS)
U5030 Supervision and Management - Business Administration U5130 Supervision and Management - Public Administration U5330 Supervision and Management - Healthcare Administration U5430 Supervision and Management - Business Information Tech. Bachelor of Science and Bachelor of Nursing (BS and BSN) S6100 Criminal Justice – from Earned AS S6150 Criminal Justice – from Earned AA S6200 Aerospace Sciences – Professional Pilot S6210 Aerospace Sciences – Aerospace Administration S6300 Early Childhood Education S6310 Elementary Education V6100 Nursing - RN to BSN V6110 Nursing - Concurrent Enrollment in 25515 or 25615 Associate of Arts (AA) 11000 Liberal Arts 11520 Liberal Arts to BAS Track Healthcare Administration 11530 Liberal Arts to BAS Track Business Information Technology 11540 Liberal Arts to BAS Track Business Administration, Public Admin,
Public Safety Management 11910 Liberal Arts to USF Track (Recent FTIC Only) Psychology 11920 Liberal Arts to USF Track (Recent FTIC Only) Biological Health Sciences 11930 Liberal Arts to USF Track (Recent FTIC Only) Aging Health Sciences 11940 Liberal Arts to USF Track (Recent FTIC Only) Social & Behavioral Health
Sciences 11950 Liberal Arts to USF Track (Recent FTIC Only) Health Management 11960 Liberal Arts to USF Track (Recent FTIC Only) Health Information Technology 11970 Liberal Arts to USF Track (Recent FTIC Only) Information Technology Associate in Science (AS) 25020 Accounting Technology 25031 Business Administration 25050 Business Operational Management 25240 Computer Systems and Business Analysis 25271 25276
Network Systems Engineering Technology - Infrastructure Network Systems Engineering Technology - Security
25320 Early Childhood Education and Management 25450 Emergency Medical Services 25515 Nursing - Generic Option 25535 Occupational Therapy Assistant 25545 Physical Therapist Assistant 25565 Cardiovascular Technology 25575 Radiography 25585 Respiratory Care 25595 Diagnostic Medical Sonography 25615 Nursing – Transition Option 25670 Engineering Technology - Mechanical Design and Fabrication 25690 Engineering Technology - Advanced Manufacturing 25710 Supply Chain Management 25841 Digital Media Technology - Web Production 25842 Digital Media Technology - Video Production 25843 Digital Media Technology - Graphic Design 25900 Criminal Justice Technology 25980 Fire Science Technology
2019-2020 Polk State College Factbook 1.2 Source: 2020-2021 Catalog
26110 Professional Pilot Science 26130 Aerospace Administration 26140 Aviation Maintenance Administration
Associate in Applied Science (AAS)
A5745 Electrical Distribution Technology
Credit Certificate
68000 Child Care Center Management 68010 Preschool 68020 Child Development Early Intervention 68030 Medical Coding Specialist 68040 Bookkeeping Operations 68050 Entrepreneurship 68070 Logistics and Transportation Specialist 68100 Engineering Technology Support Specialist 68130 Emergency Medical Technology 68160 Paramedic 68325 Network Infrastructure 68400 Graphic Design 68410 Video Production 68420 Web Production Operations
Advanced Technical Certificate (ATC)
41000 Healthcare Administration 41100 Public Safety Management 41200 Business Information Technology 47000 Computed Tomography
Vocational Certificate (VC)
58500 Florida CMS Correctional Basic Recruit Training 58510 Correctional Officer Crossover Training to Florida CMS Law
Enforcement Basic Recruit Training 58610 CMS Law Enforcement Basic Recruit 58640 Law Enforcement Auxiliary Officer Basic Recruit Training 58660 Correctional Probation Officer Crossover Training to Florida
CMS Law Enforcement Basic Recruit Crossover Training 58670 Law Enforcement Officer Crossover Training to Florida CMS
Correctional Basic Recruit Training
Educator Preparation Certificate
F9025 Educator Preparation Institute
Note: Some programs are listed with the same title, but have a track subtitle, and are listed on this page with different program numbers. Those programs are identical with the exception of a specialty concentration. However, for tracking and reporting purposes, they have the same CIP code. CIP codes are a classification assigned by the National Center for Education Statistics.

CREDIT COURSE FEES 3-YEAR PROFILE
Lower-Level Course Fees
Florida ResidentFees
Percent Change Fees
Percent Change Fees
Percent Change
Course Fees per Credit Hour $82.78 0.0% $82.78 0.0% $82.78 0.0%
Required Fees per Credit Hour $29.44 0.0% $29.44 0.0% $29.44 0.0%
Total Fees per Cr. Hr. $112.22 0.0% $112.22 0.0% $112.22 0.0%
Annual Full Time (30 Hrs.) $3,366.60 0.0% $3,366.60 0.0% $3,366.60 0.0%
Non-Florida Resident
Course Fees per Credit Hour $331.11 0.0% $331.11 0.0% $331.11 0.0%
Required Fees per Credit Hour $77.95 0.0% $77.95 0.0% $77.95 0.0%
Total Fees per Cr. Hr. $409.06 0.0% $409.06 0.0% $409.06 0.0%
Annual Full Time (30 Hrs.) $12,271.80 0.0% $12,271.80 0.0% $12,271.80 0.0%
Upper-Level Course Fees
Florida ResidentFees
Percent Change Fees
Percent Change Fees
Percent Change
Course Fees per Credit Hour $91.79 0.0% $91.79 0.0% $91.79 0.0%
Required Fees per Credit Hour $32.10 0.0% $32.10 0.0% $32.10 0.0%
Total Fees per Cr. Hr. $123.89 0.0% $123.89 0.0% $123.89 0.0%
Annual Full Time (30 Hrs.) $3,716.70 0.0% $3,716.70 0.0% $3,716.70 0.0%
Non-Florida Resident
Course Fees per Credit Hour $381.10 0.0% $381.10 0.0% $381.10 0.0%
Required Fees per Credit Hour $88.60 0.0% $88.60 0.0% $88.60 0.0%
Total Fees per Cr. Hr. $469.70 0.0% $469.70 0.0% $469.70 0.0%
Annual Full Time (30 Hrs.) $14,091.00 0.0% $14,091.00 0.0% $14,091.00 0.0%
2019-2020
2019-2020
2017-2018
2017-2018
2018-2019
2018-2019
NOTES:1. "Florida Resident" for tuition purposes is defined by Florida Statute 240.1201 as one who has maintained legal residence in the state of Florida for at least 12 months prior to paying fees.2. Required fees include student services, technology, financial aid, student activities, and capital improvement as approved by District Board of Trustees Rule 4.06.3. Some courses have lab fees in addition to matriculation credit-hour fees and required fees.
2019-2020 Polk State College Factbook 1.3 Source: Business Office

FTE ENROLLMENT5-YEAR PROFILE
SUMMER FALL SPRING TOTAL YEAR % Diff of Prev Yr
ADVANCED & PROFESSIONAL (A&P)
2020 572.6 1,849.2 1,578.4 4,000.2 2.1%2019 558.6 1,767.0 1,591.7 3,917.3 -0.6%2018 525.8 1,832.1 1,582.0 3,939.9 0.3%2017 526.7 1,796.3 1,606.6 3,929.6 -12.1%2016 659.7 1,972.3 1,838.2 4,470.2 -3.3%
POSTSECONDARY VOCATIONAL (PV)
2020 238.9 669.6 654.2 1,562.7 -2.5%2019 245.4 688.7 668.8 1,602.9 4.1%2018 232.5 663.2 644.6 1,540.3 -1.5%2017 231.8 674.1 657.9 1,563.8 -4.3%2016 222.9 714.8 696.2 1,633.9 -4.5%
COLLEGE PREP (CP)2020 22.6 67.9 51.2 141.7 -1.5%2019 17.5 73.6 52.7 143.8 -0.2%2018 22.0 65.7 56.4 144.1 -15.1%2017 25.3 86.1 58.3 169.7 -15.5%2016 31.7 98.8 70.4 200.9 -24.3%
ESL/EAP 2020 2.5 5.5 4.9 12.9 -39.2%2019 2.1 10.4 8.7 21.2 82.8%2018 1.3 4.5 5.8 11.6 -5.7%2017 1.2 6.5 4.6 12.3 5.1%2016 2.6 5.8 3.3 11.7 -32.0%
EPI (EDUCATOR PREPARATION INSTITUTE)2020 13.2 25.7 29.0 67.9 -3.0%2019 9.7 28.7 31.6 70.0 25.4%2018 10.9 20.3 24.6 55.8 -2.6%2017 15.2 19.2 22.9 57.3 -29.2%2016 12.2 30.3 38.4 80.9 -2.2%
TOTAL COLLEGE CREDIT (A&P, PV, CP,ESL, EPI)2020 849.8 2,617.9 2,317.7 5,785.4 0.5%2019 833.3 2,568.4 2,353.5 5,755.2 -0.5%2018 814.0 2,613.3 2,358.2 5,785.5 -0.4%2017 824.7 2,603.0 2,382.1 5,809.8 -9.2%2016 929.1 2,822.0 2,646.5 6,397.6 -4.5%
POSTSECONDARY ADULT VOCATIONAL (PSAV) 2020 26.7 47.0 32.8 106.5 19.4%2019 12.1 33.2 43.9 89.2 -4.9%2018 21.5 27.5 44.8 93.8 4.9%2017 25.7 27.3 36.4 89.4 5.9%2016 24.3 28.9 31.2 84.4 -1.2%
TOTAL LOWER-LEVEL FTE 2020 849.8 2,075.2 2,317.7 5,242.7 -10.3%2019 845.5 2,601.6 2,397.4 5,844.5 1.0%2018 814.0 2,613.3 2,358.2 5,785.5 -0.4%2017 824.7 2,603.0 2,382.1 5,809.8 -10.4%2016 953.4 2,850.9 2,677.7 6,482.0 -4.5%
BACCALAUREATE UPPER-LEVEL FTE2020 139.0 311.2 312.7 762.9 0.2%2019 139.2 322.4 299.4 761.0 1.8%2018 128.3 315.3 303.9 747.5 -3.2%2017 141.9 324.7 305.6 772.2 6.4%2016 117.7 302.1 306.1 725.9 2.1%
TOTAL LOWER and UPPER-LEVELS FTE2020 988.8 2,386.4 2,630.4 6,005.6 2.8%2019 845.5 2,601.6 2,397.4 5,844.5 -10.7%2018 953.0 2,924.5 2,670.9 6,548.4 -0.5%2017 966.6 2,927.7 2,687.7 6,582.0 -8.7%2016 1,071.1 3,153.0 2,983.8 7,207.9 -3.8%
REPORTING YEAR
2019-2020 Polk State College Factbook 2.1 Source: SDB FTE (FTCOLFF)

ENROLLMENTFALL
5-YEAR PROFILE
EoT % Chg EoT EoT % Chg EoT EoT % Chg EoT EoT % Chg EoT EoT % Chg EoT
1,972.3 -4.1% 1,796.3 -8.9% 1,832.1 2.0% 1,767.0 -3.6% 1,849.2 4.7%
302.1 3.0% 324.7 7.5% 315.3 -2.9% 322.4 2.3% 311.2 -3.5%
714.8 -4.8% 474.1 -33.7% 663.2 39.9% 688.7 3.8% 669.6 -2.8%
104.6 -23.0% 86.1 -17.7% 70.2 -18.5% 84.0 19.7% 73.4 -12.6%
30.3 2.7% 19.2 -36.6% 20.3 5.7% 28.7 41.4% 25.7 -10.5%
28.9 -11.1% 27.3 -5.5% 27.5 0.7% 33.2 20.7% 47.0 41.6%3,153.0 -4.4% 2,727.7 -13.5% 2,928.6 7.4% 2,924.0 -0.2% 2,976.1 1.8%
8,569 -7.8% 8,081 -5.7% 8,034 -0.6% 7,819 -2.7% 8,048 2.9%
1,279 9.0% 1,389 8.6% 1,403 1.0% 1,331 -5.1% 1,303 -2.1%
3,888 -7.0% 3,590 -7.7% 3,680 2.5% 3,695 0.4% 3,611 -2.3%
783 -23.2% 730 -6.8% 639 -12.5% 677 5.9% 563 -16.8%
143 10.0% 82 -42.7% 71 -13.4% 84 18.3% 79 -6.0%
94 0.0% 87 -7.4% 104 19.5% 77 -26.0% 106 37.7%11,718 -3.6% 11,042 -5.8% 11,015 -0.2% 10,817 -1.8% 10,899 0.8%
NOTES:1. EOT = End of Term2. Non-Credit - Lower FTE = PSAV FTE after 2010
PSV
College Prep
Total
Headcount Unduplicated by ICS Type
College Prep
EPI
PSAV
A&P Lower
A&P Upper
Total
EPI
PSAV
2016-2017 2017-2018 208-2019 2019-2020
FTE
2015-2016
A&P Lower
A&P Upper
PSV
2019-2020 Polk State College Factbook 2.2 Source: SDB FTCOLFF and HDCCR-HCF21

ENROLLMENTANNUAL
5-YEAR PROFILE
EoY % CHG EoY EoY % CHG EoY EoY % CHG EoY EoY % CHG EoY EoY % CHG EoY
A&P Upper 725.9 2.1% 772.2 6.4% 747.5 -3.2% 761.0 1.8% 762.9 0.2%
A&P Lower 4,470.2 -3.3% 3,929.6 -12.1% 3,939.9 0.3% 3,917.3 -0.6% 4,000.2 2.1%
PSV 1,633.9 -4.5% 1,563.8 -4.3% 1,540.3 -1.5% 1,602.9 4.1% 1,562.7 -2.5%
College Prep 212.6 -24.8% 169.7 -20.2% 155.7 -8.2% 165.0 6.0% 154.6 -6.3%
EPI 80.9 -1.6% 57.3 -29.2% 55.8 -2.6% 70.0 25.4% 67.9 -3.0%
PSAV 84.4 -0.8% 89.4 5.9% 93.8 4.9% 89.2 -4.9% 106.5 19.4%
Total 7,207.9 -3.8% 6,582.0 -8.7% 6,533.0 -0.7% 6,605.4 1.1% 6,654.8 0.7%
EoY % CHG EoY EoY % CHG EoY EoY % CHG EoY EoY % CHG EoY EoY % CHG EoY
A&P Upper 1,783 1.0% 1,913 7.3% 1,952 2.0% 1,845 -5.5% 1,849 0.2%
A&P Lower 12,387 -6.1% 12,733 2.8% 12,291 -3.5% 12,259 -0.3% 12,265 0.0%
PSV 6,320 -4.3% 6,091 -3.6% 6,274 3.0% 6,387 1.8% 6,279 -1.7%
College Prep 1,349 -22.2% 1,213 -10.1% 1,161 -4.3% 1,123 -3.3% 1,016 -9.5%
EPI 218 -11.7% 156 -28.4% 123 -21.2% 136 10.6% 130 -4.4%
PSAV 144 6.7% 171 18.8% 163 -4.7% 189 16.0% 187 -1.1%
Total 15,755 -5.1% 16,018 1.7% 15,461 -3.5% 15,647 1.2% 21,726 38.9%
2016-2017 2017-2018 2018-2019 2019-2020
FTE
2015-2016
2019-2020
Headcount Unduplicated by ICS Type
2015-2016 2016-2017 2017-2018 2018-2019
2019-2020 Polk State College Factbook 2.3 Source: SDB FTE (FTCOLFF) and SAS

HOURS AND FTE by CAMPUSFALL
3-YEAR PROFILE
YEAR CAMPUSSSH Lower
CreditSSH Lower
Credit %ChgCHE Non-Credit
LowerCHE Lower Non-
Credit %ChgTotal Lower
HoursTotal Lower Hours %Chg
SSH Upper Credit
SSH Upper Credit %Chg
Total Lower and Upper Credit
Total Lower and Upper Credit
%Chg
2017-2018 2,303.0 14.3% 0.0 0.0% 2,303.0 14.3% 307.0 82.7% 2,610.0 19.6%
2018-2019 2,688.0 16.7% 0.0 0.0% 2,688.0 16.7% 319.0 3.9% 3,007.0 15.2%
2019-2020 2,765.0 2.9% 0.0 0.0% 2,765.0 2.9% 484.0 51.7% 3,249.0 8.0%
2017-2018 216.0 17.4% 0.0 0.0% 216.0 17.4% 0.0 0.0% 216.0 17.4%
2018-2019 166.0 -23.1% 0.0 0.0% 166.0 -23.1% 0.0 0.0% 166.0 -23.1%
2019-2020 184.0 10.8% 0.0 0.0% 184.0 10.8% 162.0 0.0% 346.0 108.4%
2017-2018 3,124.0 -2.4% 0.0 0.0% 3,124.0 -2.4% 180.0 -62.7% 3,304.0 -10.3%
2018-2019 3,072.0 -1.7% 0.0 0.0% 3,072.0 -4.0% 126.0 -30.0% 3,198.0 -3.2%
2019-2020 2,944.0 -4.2% 0.0 0.0% 2,944.0 -5.8% 162.0 28.6% 3,106.0 -2.9%
2017-2018 39,766.0 3.2% 0.0 0.0% 39,766.0 3.2% 5,565.0 8.4% 45,331.0 3.8%
2018-2019 39,197.0 -1.4% 0.0 0.0% 39,197.0 -1.4% 5,977.0 7.4% 45,174.0 -0.3%
2019-2020 40,630.0 3.7% 0.0 0.0% 40,630.0 3.7% 5,668.0 -5.2% 46,298.0 2.5%
2017-2018 32,167.0 -3.6% 826.1 1.0% 32,993.1 -3.4% 3,409.0 -13.8% 36,402.1 -4.5%
2018-2019 31,915.0 -0.8% 997.5 20.7% 32,912.5 -0.2% 3,253.0 -4.6% 36,165.5 -0.6%
2019-2020 32,028.0 0.4% 1,409.0 41.3% 33,437.0 1.6% 3,071.0 -5.6% 36,508.0 0.9%
YEAR CAMPUS Lower CreditLower Credit
%ChgNon-Credit
LowerNon-Credit %Chg
Total Lower Credit
Total Lower Credit %Chg
Upper CreditUpper Credit
%ChgTotal Lower and
Upper Credit
Total Lower and Upper Credit
%Chg
2018-2019 76.8 13.9% 0.0 0.0% 76.8 13.9% 10.2 82.1% 87.0 19.2%
2018-2019 89.6 16.7% 0.0 0.0% 89.6 16.7% 10.6 3.9% 100.2 15.2%
2019-2020 92.2 2.9% 0.0 0.0% 92.2 2.9% 14.8 39.6% 107.0 6.8%
2017-2018 7.2 18.0% 0.0 0.0% 7.2 18.0% 0.0 0.0% 7.2 18.0%
2018-2019 5.6 -22.2% 0.0 0.0% 5.6 -22.2% 0.0 0.0% 5.6 -22.2%
2019-2020 6.1 8.9% 0.0 0.0% 6.1 8.9% 0.0 0.0% 6.1 8.9%
2017-2018 104.1 -3.2% 0.0 0.0% 104.1 -3.2% 6.0 -62.7% 110.1 -10.9%
2018-2019 102.4 -1.6% 0.0 0.0% 102.4 -1.6% 4.2 -30.0% 106.6 -3.2%
2019-2020 98.1 -4.2% 0.0 0.0% 98.1 -4.2% 5.1 21.4% 103.2 -3.2%
2017-2018 1,325.6 3.2% 0.0 0.0% 1,325.6 3.2% 185.5 8.4% 1,511.1 3.8%
2018-2019 1,306.7 -1.4% 0.0 0.0% 1,306.7 -1.4% 199.2 7.4% 1,505.9 -0.3%
2019-2020 1,354.1 3.6% 0.0 0.0% 1,354.1 3.6% 188.9 -5.2% 1,543.0 2.5%
2017-2018 1,072.1 -3.6% 20.3 -25.6% 1,099.6 -3.5% 113.6 -13.8% 1,213.2 -4.5%
2018-2019 1,064.1 -0.7% 33.2 63.5% 1,097.3 -0.2% 105.8 -6.9% 1,203.1 -0.8%
2019-2020 1,067.4 0.3% 47.0 41.6% 1,114.4 1.6% 102.4 -3.2% 1,216.8 1.1%
NOTE:% Change = Difference from one academic year to the next academic year.
HO
URS
BY
CAM
PUS
FTE
BY C
AMPU
S
Winter Haven
Airside Center
Clear Springs
Lake Wales
Lakeland
Winter Haven
Airside Center
Clear Springs
Lake Wales
Lakeland
2019-2020 Polk State College Factbook 2.4 Source: SDB FTSIFF and FTSITSF

HOURS and FTE by CAMPUSANNUAL
3-YEAR PROFILE
YEAR CAMPUSSSH Lower
CreditSSH Lower
Credit %ChgCHE Non-Credit
LowerCHE Lower Non-
Credit %ChgTotal Lower
HoursTotal Lower Hours %Chg
SSH Upper Credit
SSH Upper Credit %Chg
Total Lower and Upper Credit
Total Lower and Upper Credit
%Chg
2017-2018 5,448.0 18.4% 0.0 #DIV/0! 5,448.0 18.4% 579.0 24.0% 6,027.0 18.9%2018-2019 6,025.0 10.6% 0.0 #DIV/0! 6,025.0 10.6% 702.0 21.2% 6,727.0 11.6%2019-2020 6,344.0 5.3% 0.0 #DIV/0! 6,344.0 5.3% 956.0 36.2% 7,300.0 8.5%2017-2018 536.0 -2.0% 0.0 #DIV/0! 536.0 -2.0% 0.0 #DIV/0! 536.0 -2.0%2018-2019 448.0 -16.4% 0.0 #DIV/0! 448.0 -16.4% 0.0 #DIV/0! 448.0 -16.4%2019-2020 493.0 10.0% 0.0 #DIV/0! 493.0 10.0% 0.0 #DIV/0! 493.0 10.0%2017-2018 6,622.0 -3.8% 0.0 #DIV/0! 6,622.0 -3.8% 618.0 -43.1% 7,240.0 -9.2%2018-2019 6,107.0 -7.8% 0.0 #DIV/0! 6,107.0 -7.8% 432.0 -30.1% 6,539.0 -9.7%2019-2020 5,615.0 -8.1% 0.0 #DIV/0! 5,615.0 -8.1% 405.0 -6.3% 6,020.0 -7.9%2017-2018 87,201.0 1.8% 74.7 -49.6% 87,275.7 1.7% 12,603.0 6.3% 99,878.7 2.3%2018-2019 88,710.0 1.7% 0.0 -100.0% 88,710.0 1.6% 13,577.0 7.7% 102,287.0 2.4%2019-2020 90,554.0 2.1% 0.0 #DIV/0! 90,554.0 2.1% 13,719.0 1.0% 104,273.0 1.9%2017-2018 70,932.0 -4.1% 2,741.7 8.2% 73,673.7 -3.7% 8,626.0 -11.6% 82,299.7 -4.6%2018-2019 71,357.0 0.6% 2,675.9 -2.4% 74,032.9 0.5% 8,122.0 -5.8% 82,154.9 -0.2%2019-2020 70,473.0 -1.2% 3,194.0 19.4% 73,667.0 -0.5% 7,809.0 -3.9% 81,476.0 -0.8%
YEAR CAMPUS Lower CreditLower Credit
%ChgNon-Credit
LowerNon-Credit
%ChgTotal Lower
CreditTotal Lower Credit %Chg
Upper CreditUpper Credit
%ChgTotal Lower and
Upper Credit
Total Lower and Upper Credit
%Chg2017-2018 181.7 18.5% 0.0 #DIV/0! 181.7 18.5% 19.3 23.7% 201.0 19.0%2018-2019 200.9 10.6% 0.0 #DIV/0! 200.9 10.6% 23.4 21.2% 224.3 11.6%2019-2020 211.4 5.2% 0.0 #DIV/0! 211.4 5.2% 31.8 35.9% 243.2 8.4%2017-2018 17.8 -1.7% 0.0 -100.0% 17.8 -1.7% 0.0 #DIV/0! 17.8 -1.7%2018-2019 15.0 -15.7% 0.0 #DIV/0! 15.0 -15.7% 0.0 #DIV/0! 15.0 -15.7%2019-2020 16.5 10.0% 0.0 #DIV/0! 16.5 10.0% 0.0 #DIV/0! 16.5 10.0%2017-2018 220.8 -3.7% 0.0 #DIV/0! 220.8 -3.7% 20.6 -43.1% 241.4 -9.1%2018-2019 203.5 -7.8% 0.0 #DIV/0! 203.5 -7.8% 14.4 -30.1% 217.9 -9.7%2019-2020 187.0 -8.1% 0.0 #DIV/0! 187.0 -8.1% 13.5 -6.3% 200.5 -8.0%2017-2018 2,907.0 1.8% 2.5 -49.0% 2,909.5 1.7% 420.1 6.3% 3,329.6 2.3%2018-2019 2,957.2 1.7% 0.0 -100.0% 2,957.2 1.6% 452.5 7.7% 3,409.7 2.4%2019-2020 3,021.7 2.2% 0.0 #DIV/0! 3,021.7 2.2% 457.3 1.1% 3,479.0 2.0%2017-2018 2,364.4 -4.1% 91.3 8.0% 2,455.7 -3.7% 287.5 -11.6% 2,743.2 -4.6%2018-2019 2,378.6 0.6% 89.2 -2.3% 2,467.8 0.5% 270.7 -5.8% 2,738.5 -0.2%2019-2020 2,348.8 -1.3% 106.5 19.4% 2,455.3 -0.5% 260.3 -3.8% 2,715.6 -0.8%
FTE
BY C
AMPU
S
Airside Center
Clear Springs
Lake Wales
Lakeland
Winter Haven
HOU
RS B
Y CA
MPU
S Airside Center
Clear Springs
Lake Wales
Lakeland
Winter Haven
2019-2020 Polk State College Factbook 2.5 Source: SDB FTSIFF and FTSITSF
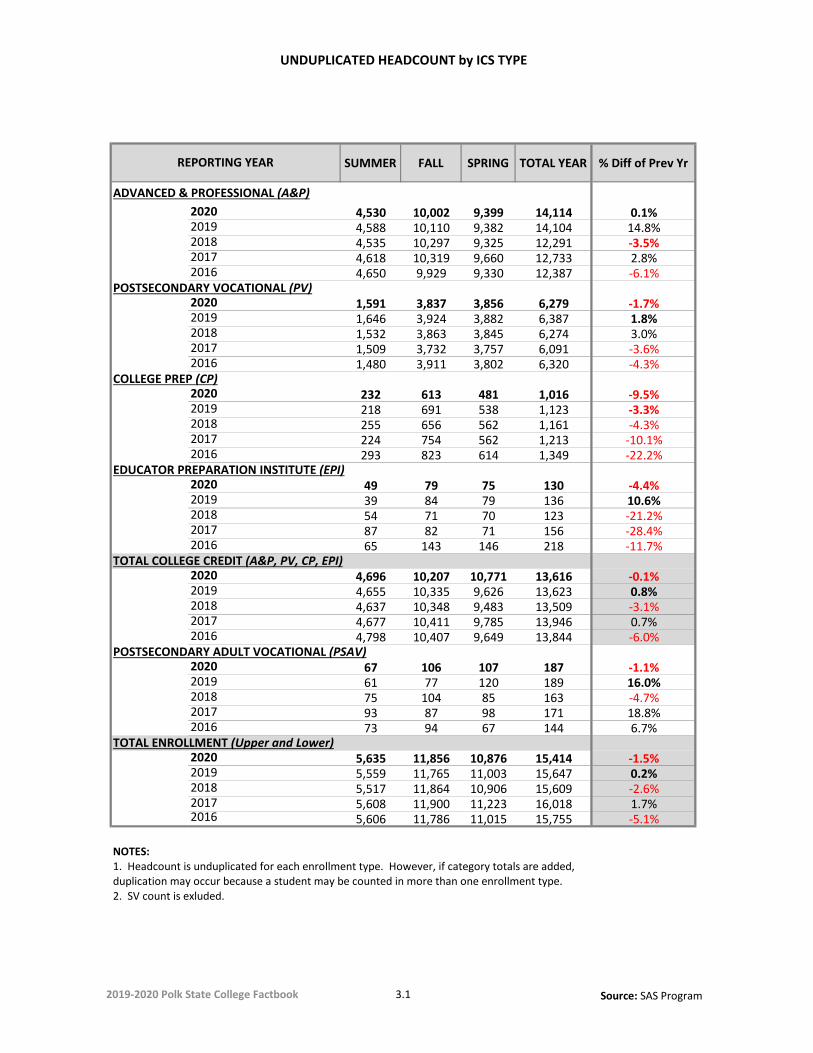
UNDUPLICATED HEADCOUNT by ICS TYPE
SUMMER FALL SPRING TOTAL YEAR % Diff of Prev Yr
2020 4,530 10,002 9,399 14,114 0.1%2019 4,588 10,110 9,382 14,104 14.8%2018 4,535 10,297 9,325 12,291 -3.5%2017 4,618 10,319 9,660 12,733 2.8%2016 4,650 9,929 9,330 12,387 -6.1%
2020 1,591 3,837 3,856 6,279 -1.7%2019 1,646 3,924 3,882 6,387 1.8%2018 1,532 3,863 3,845 6,274 3.0%2017 1,509 3,732 3,757 6,091 -3.6%2016 1,480 3,911 3,802 6,320 -4.3%
2020 232 613 481 1,016 -9.5%2019 218 691 538 1,123 -3.3%2018 255 656 562 1,161 -4.3%2017 224 754 562 1,213 -10.1%2016 293 823 614 1,349 -22.2%
2020 49 79 75 130 -4.4%2019 39 84 79 136 10.6%2018 54 71 70 123 -21.2%2017 87 82 71 156 -28.4%2016 65 143 146 218 -11.7%
2020 4,696 10,207 10,771 13,616 -0.1%2019 4,655 10,335 9,626 13,623 0.8%2018 4,637 10,348 9,483 13,509 -3.1%2017 4,677 10,411 9,785 13,946 0.7%2016 4,798 10,407 9,649 13,844 -6.0%
2020 67 106 107 187 -1.1%2019 61 77 120 189 16.0%2018 75 104 85 163 -4.7%2017 93 87 98 171 18.8%2016 73 94 67 144 6.7%
2020 5,635 11,856 10,876 15,414 -1.5%2019 5,559 11,765 11,003 15,647 0.2%2018 5,517 11,864 10,906 15,609 -2.6%2017 5,608 11,900 11,223 16,018 1.7%2016 5,606 11,786 11,015 15,755 -5.1%
NOTES:1. Headcount is unduplicated for each enrollment type. However, if category totals are added,duplication may occur because a student may be counted in more than one enrollment type.2. SV count is exluded.
TOTAL COLLEGE CREDIT (A&P, PV, CP, EPI)
POSTSECONDARY ADULT VOCATIONAL (PSAV)
TOTAL ENROLLMENT (Upper and Lower)
REPORTING YEAR
ADVANCED & PROFESSIONAL (A&P)
POSTSECONDARY VOCATIONAL (PV)
COLLEGE PREP (CP)
EDUCATOR PREPARATION INSTITUTE (EPI)
2019-2020 Polk State College Factbook 3.1 Source: SAS Program

BACCALAUREATE PROGRAM ENROLLMENT UNDUPLICATED HEADCOUNT by ICS TYPE
SUMMER FALL SPRING TOTAL YEAR % DIFF of PREV YEAR
ADVANCED & PROFESSIONAL (A&P) UPPER2020 505 796 789 1,095 -0.7%2019 536 830 759 1,103 -7.8%2018 530 894 830 1,196 -4.4%2017 566 934 876 1,251 9.6%2016 464 835 856 1,141 2.3%
ADVANCED & PROFESSIONAL (A&P) LOWER2020 141 253 237 468 -2.3%2019 150 253 245 479 -10.0%2018 163 279 265 532 -9.1%2017 174 316 283 585 -4.6%2016 181 327 333 613 4.3%
POSTSECONDARY ADULT VOCATIONAL (PSV)2020 122 194 209 397 7.3%2019 121 189 184 370 -8.4%2018 106 212 213 404 -1.2%2017 123 209 195 409 -12.6%2016 150 237 252 468 -3.7%
TOTAL ENROLLMENT (A&P Upper and PSV Lower)2020 538 834 821 1,125 -2.6%2019 582 870 813 1,155 -6.7%2018 583 937 868 1,238 -5.6%2017 620 987 929 1,311 -2.8%2016 606 984 1,020 1,349 1.7%
ADVANCED & PROFESSIONAL (A&P) UPPER2020 146 222 207 320 -6.2%2019 165 229 215 341 -10.0%2018 159 259 252 379 9.2%2017 162 250 236 347 -6.0%2016 170 264 258 369 -5.1%
ADVANCED & PROFESSIONAL (A&P) LOWER2020 39 65 50 122 -20.3%2019 62 79 71 153 -15.5%2018 57 88 84 181 30.2%2017 43 74 71 139 -24.0%2016 66 100 69 183 -20.4%
POSTSECONDARY ADULT VOCATIONAL (PSV)2020 1 17 16 22 22.2%2019 0 13 11 18 -28.0%2018 3 18 15 25 13.6%2017 0 12 15 22 -15.4%2016 1 24 21 26 100.0%
TOTAL ENROLLMENT (A&P Upper and PSV Lower)2020 174 258 233 355 -8.0%2019 200 278 251 386 -14.4%2018 192 365 303 451 13.0%2017 186 293 279 399 -12.9%2016 214 336 311 458 -7.5%
ADVANCED & PROFESSIONAL (A&P) UPPER2020 78 139 132 188 -9.2%2019 96 140 133 207 -6.3%2018 81 146 143 221 8.9%2017 67 145 149 203 -1.5%2016 77 154 142 206 9.0%
ADVANCED & PROFESSIONAL (A&P) LOWER2020 29 38 36 75 -11.8%2019 30 50 40 85 16.4%2018 14 50 45 73 1.4%2017 24 41 45 72 -25.8%2016 34 57 55 97 38.6%
POSTSECONDARY ADULT VOCATIONAL (PSV)2020 27 50 44 95 18.8%2019 33 29 37 80 -14.0%2018 26 53 53 93 38.8%2017 24 35 35 67 4.7%2016 23 25 31 64 18.5%
TOTAL ENROLLMENT (A&P Upper and PSV Lower)2020 102 156 146 211 -7.0%2019 119 162 145 227 -5.0%2018 99 175 169 239 9.6%2017 88 160 167 218 -5.2%2016 103 174 165 230 13.3%
CRIM
INAL
JUST
ICE
BS (I
CS 1
1043
0104
1)
SUPE
RVIS
ION
AN
D M
ANAG
EMEN
TN
URS
ING
BAS
(ICS
1105
2029
91)
BSN
(ICS
110
5138
012)
3.1a Page 1 of 2

BACCALAUREATE PROGRAM ENROLLMENT UNDUPLICATED HEADCOUNT by ICS TYPE
SUMMER FALL SPRING TOTAL YEAR % DIFF of PREV YEAR
ADVANCED & PROFESSIONAL (A&P) UPPER2020 25 46 48 63 31.3%2019 11 36 41 48 29.7%2018 10 32 25 37 12.1%2017 13 18 27 33 120.0%2016 0 8 15 15 87.5%
ADVANCED & PROFESSIONAL (A&P) LOWER2020 18 18 19 38 15.2%2019 9 18 21 33 65.0%2018 8 8 12 20 33.3%2017 5 8 12 15 200.0%2016 1 3 3 5 25.0%
POSTSECONDARY ADULT VOCATIONAL (PSV)2020 2 9 4 11 -26.7%2019 2 10 7 15 66.7%2018 4 1 5 9 -18.2%2017 2 8 6 11 175.0%2016 0 2 3 4 -33.3%
TOTAL ENROLLMENT (A&P Upper and PSV Lower)2020 28 50 50 65 22.6%2019 17 42 44 53 29.3%2018 15 32 30 41 13.9%2017 16 24 31 36 111.8%2016 1 11 16 17 70.0%
ADVANCED & PROFESSIONAL (A&P) UPPER2020 2 13 12 15 -6.3%2019 0 13 15 16 100.0%2018 2 7 8 8 700.0%2017 0 1 1 1 0.0%2016 0 0 0 0 0.0%
ADVANCED & PROFESSIONAL (A&P) LOWER2020 6 3 2 9 50.0%2019 0 5 2 6 100.0%2018 2 1 0 3 0.0%2017 0 1 0 0 0.0%2016 0 0 0 0 0.0%
POSTSECONDARY ADULT VOCATIONAL (PSV)2020 1 5 3 7 16.7%2019 0 4 4 6 20.0%2018 1 4 4 5 0.0%2017 0 1 0 0 0.0%2016 0 0 0 0 0.0%
TOTAL ENROLLMENT (A&P Upper and PSV Lower)2020 7 15 12 17 6.3%2019 0 13 15 16 100.0%2018 2 7 8 8 700.0%2017 0 1 1 1 0.0%2016 0 0 0 0 0.0%
ADVANCED & PROFESSIONAL (A&P) UPPER2020 35 79 75 101 17.4%2019 23 73 66 86 50.9%2018 6 42 52 57 216.7%2017 0 13 19 18 0.0%2016 0 0 0 0 0.0%
ADVANCED & PROFESSIONAL (A&P) LOWER2020 0 2 1 2 -60.0%2019 1 2 3 5 66.7%2018 1 2 2 3 0.0%2017 0 1 0 0 0.0%2016 0 0 0 0 0.0%
POSTSECONDARY ADULT VOCATIONAL (PSV)2020 0 0 1 1 -50.0%2019 0 1 1 2 100.0%2018 0 1 0 1 0.0%2017 0 0 0 0 0.0%2016 0 0 0 0 0.0%
TOTAL ENROLLMENT (A&P Upper and PSV Lower)2020 35 80 77 103 18.4%2019 24 73 98 87 52.6%2018 7 44 52 57 216.7%2017 0 14 19 18 0.0%2016 0 0 0 0 0.0%
NOTES:1. Headcount is unduplicated within each category. However, if category totals are added, duplication may occur because an individual may becounted in more than one category.2. SV count is excluded.
EARL
Y CH
ILD
HO
OD
ED
UCA
TIO
N
BS (C
IP 1
1013
1210
1)
ELEM
ENTA
RY E
DU
CATI
ON
BS (C
IP 1
1013
1220
21)
AERO
SPAC
E
BS (I
CS 1
1049
0101
1)
2019-2020 Polk State College Factbook 3.1aPage 2 of 2
Source: SAS Program

BACCALAUREATE PROGRAM ENROLLMENT and HEADCOUNT SUMMARY by ICS TYPEAcademic Year 2019-2020
Discipline Credit Type Summer Fall Spring Year Total
BAS - Supervision & Management A & P Upper 505 796 789 1,095CIP 1105202991 A & P Lower 141 253 237 468
PSV 122 194 209 397Total 538 834 821 1,125
BSN - Nursing A & P Upper 146 222 207 320CIP 1105138012 A & P Lower 39 65 50 122
PSV 1 17 16 22Total 174 258 233 355
BS - Criminal Justice A & P Upper 78 139 132 188CIP 1104301041 A & P Lower 29 38 36 75
PSV 27 50 44 95Total 102 156 146 211
BS - Aerospace Sciences A & P Upper 25 46 48 63CIP 1104901011 A & P Lower 18 18 19 38
PSV 2 9 4 11Total 28 50 50 65
BS - Early Childhood Education A & P Upper 2 13 12 15CIP 1101312101 A & P Lower 6 3 2 9
PSV 1 5 3 7Total 7 15 12 17
BS - Elementary Education A & P Upper 35 79 75 101CIP 11013122021 A & P Lower 0 2 1 2
PSV 0 0 1 1Total 35 80 77 103
2019-2020 Polk State College Factbook 3.1b Source: SAS Program

BAS/BS/BSN ENROLLMENTAcademic Year 2019-2020
0
100
200
300
400
500
600
700
800
A & P Upper A & P Upper A & P Upper A & P Upper A & P Upper A & P Lower A & P LowerBAS - Supervision& Management
BSN - Nursing BS - CriminalJustice
BS - AerospaceSciences
BS - EarlyChildhoodEducation
CIP 1101312101 CIP 11013122021
Summer 505 146 78 25 2 6 0Fall 796 222 139 46 13 3 2Spring 789 207 132 48 12 2 1
2018-2019 Polk State College Factbook Source: Page 3.1b

UNDUPLICATED HEADCOUNT by ICS TYPE5-YEAR PROFILE
UPPER AND LOWER-LEVEL ENROLLMENT 2015-2016 2016-2017 2017-2018 2018-2019 2019-2020
Advanced & Professional (A&P - Upper & Lower) 14,170 14,646 14,243 14,104 14,114
Postsecondary Vocational (PV) 6,320 6,091 6,274 6,387 6,279
College Prep (CP) 1,349 1,213 1,161 1,123 1,016
Educator Preparation Institute (EPI) 218 156 123 136 130
Postsecondary Adult Vocational (PSAV) 144 171 163 189 187
Supplemental Vocational (SV) 0 0 0 0 0
TOTAL A&P, PV, and BAS 15,179 15,509 15,161 15,152 14,951
TOTAL COLLEGE CREDIT (A&P, PV, CP, EPI, and BAS) 15,627 15,859 15,461 15,468 15,239TOTAL NON-CREDIT (PSAV, SV) 143 171 163 189 187TOTAL UPPER AND LOWER-LEVEL ENROLLMENT 15,755 16,018 15,609 15,647 15,414
NOTES: 1. Headcount is unduplicated within each category. However, if category totals are added, duplication may occur because an individual may be counted in more than one category. Example: One College Prep student may also take an A&P course and be counted in each category but only once in total overall. 2. Upper Level started January 2010.
2019-2020 Polk State College Factbook 3.2 Source: SAS Program

UNDUPLICATED HEADCOUNT by ICS TYPE5-YEAR PROFILE
2015-2016 2016-2017 2017-2018 2018-2019 2019-2020 Advanced & Professional (Upper & Lower) 14,170 14,646 14,243 14,104 14,114 Postsecondary Vocational (PV) 6,320 6,091 6,274 6,387 6,279 College Prep (CP) 1,349 1,213 1,161 1,123 1,016
0
2,000
4,000
6,000
8,000
10,000
12,000
14,000
16,000
2019-2020 Polk State college Factbook Source: Page 3.2

COMPLETIONS HISTORY
AA AS AS/Cert PSAV ATC ATD AAS EPI BAS TOTALSince 1964 14,893 5,470 20,363Fall 1998 117 85 202Spring 1999 168 100 51 319Summer 1999 156 19 20 195Fall 1999 119 77 90 286Spring 2000 161 98 26 285Summer 2000 147 16 21 184Fall 2000 144 80 24 248Spring 2001 185 93 1 279Summer 2001 192 24 629 87 932Fall 2001 152 88 38 278Spring 2002 182 93 9 42 15 341Summer 2002 176 28 7 52 9 9 281Fall 2002 172 80 1 46 19 21 339Spring 2003 156 68 4 42 27 7 304Summer 2003 166 20 17 101 11 9 324Fall 2003 153 74 8 47 25 32 339Spring 2004 163 47 4 16 23 17 270Summer 2004 165 23 15 85 7 295Fall 2004 147 57 3 34 11 36 288Spring 2005 196 84 1 33 19 16 349Summer 2005 139 15 3 49 10 216Fall 2005 170 97 16 26 26 24 359Spring 2006 220 93 3 56 20 15 407Summer 2006 185 24 5 17 12 243Fall 2006 177 92 6 60 12 30 1 378Spring 2007 216 105 4 26 16 20 387Summer 2007 165 26 35 33 34 10 44 347Fall 2007 235 96 7 55 57 39 22 511Spring 2008 254 109 3 43 25 14 41 489Summer 2008 228 12 21 30 7 65 363Fall 2008 235 96 7 55 57 39 22 511Spring 2009 244 113 4 42 39 15 69 526Summer 2009 254 63 22 54 23 11 96 523Fall 2009 322 101 19 71 32 27 44 616Spring 2010 311 113 9 43 42 12 57 587Summer 2010 212 56 18 67 43 3 66 0 465Fall 2010 339 110 47 64 33 30 68 4 695Spring 2011 409 112 31 38 26 18 35 18 687Summer 2011 298 51 38 46 33 9 56 5 536Fall 2011 464 122 61 37 35 44 35 26 824Spring 2012 415 143 29 58 42 26 37 25 775Summer 2012 291 56 17 22 13 14 28 19 460Fall 2012 352 151 17 33 27 37 17 53 687Spring 2013 418 132 11 42 29 27 31 44 734Summer 2013 279 43 32 34 15 7 29 37 476Fall 2013 389 144 4 74 9 32 13 74 739Spring 2014 556 145 41 32 30 9 39 82 934Summer 2014 238 65 21 34 16 4 41 73 492Fall 2014 347 165 100 30 32 9 17 119 819Spring 2015 531 151 18 77 15 4 29 142 967Summer 2015 275 65 22 19 7 2 26 67 483Fall 2015 321 190 45 48 9 2 24 99 738Spring 2016 508 132 4 27 8 0 12 136 827Summer 2016 256 72 49 28 2 15 0 26 85 533Fall 2016 288 189 13 45 1 15 0 7 172 730Spring 2017 583 142 12 26 6 15 0 34 131 949Summer 2017 352 78 256 36 94 11 0 27 103 957Fall 2017 365 181 64 54 2 13 0 23 168 871Spring 2018 597 164 64 61 1 21 0 27 179 1,114Summer 2018 326 70 44 29 1 19 0 26 96 611Fall 2018 347 180 70 70 2 15 0 19 180 883Spring 2020 645 128 63 31 2 0 0 23 174 1,066
TOTAL 33,140 11,545 2,244 2,795 120 1,150 713 1,395 2,752 45,502
Note: Use C:\Users\mfreeman\Desktop\I Drive\MiscInformation\GraduationNumbers\2017\GraduationNumbers2017Final.sas
2019-2020 Polk State College Factbook 4.1 Source: SAS Program - Graduates

COMPLETIONSby AWARD TYPE 5-YEAR PROFILE
2015-2016 2015-2016 2016-2017 2016-2017 2017-2018 2017-2018 2018-2019 2018-2019 2019-2020 2019-2020
AWARD TYPE Totals % Chg Totals % Chg Totals % Chg Totals % Chg Totals % Chg
AA Degrees 1,103 -1.2% 1,127 2.2% 1,314 16.6% 1,271 -3.3% 1,321 3.9%
BAS Degrees 302 -9.6% 388 28.5% 450 16.0% 452 0.4% 439 -2.9%
AS and AAS Degrees 392 -1.5% 403 2.8% 425 5.5% 441 3.8% 385 -12.7%
AT Diploma 22 -65.6% 45 104.5% 45 0.0% 57 26.7% 31 -45.6%
PSV Certificates 111 -20.1% 99 -10.8% 97 -2.0% 213 119.6% 193 -9.4%
PSAV Certificates 71 -49.6% 89 25.4% 151 69.7% 142 -6.0% 135 -4.9%
EPI Certificates 62 -28.7% 68 9.7% 77 13.2% 97 26.0% 70 -27.8%GRAND TOTALS 2,063 -9.5% 2,219 7.6% 2,559 15.3% 2,673 4.5% 2,574 -3.7%
NOTE: Baccalaureate (BAS) Programs were started January 2010.
2019-2020 Polk State College Factbook 4.2 Source: SDB AA1A (Spring final)

COMPLETIONS by AWARD TYPE 5-YEAR PROFILE
0 200 400 600 800 1000 1200 1400
AA Degrees
BAS Degrees
AS and AAS Degrees
AT Diploma
PSV Certificates
PSAV Certificates
EPI Certificates
AA Degrees BAS Degrees AS and AAS Degrees AT Diploma PSV Certificates PSAV Certificates EPI Certificates2019-2020 1,321 439 385 31 193 135 702017-2018 1,314 450 425 45 97 151 772018-2019 1,271 452 441 57 213 142 97
2019-2020 Polk State College Factbook Source: Page 4.2

AA1A ENROLLMENT AND COMPLETIONS DETAIL5-YEAR PROFILE
Enrolled Completed Enrolled Completed Enrolled Completed Enrolled Completed Enrolled Completed
TOTAL AA DEGREES 1924010101 5,164 1,103 4,342 1,127 5,316 1,314 5,328 1,271 5,297 1,321BACCALAUREATE DEGREESSupervision and Management - Bus Admin 11052029901 1,345 214 1,313 274 1,241 281 1,157 266 1,127 241Aerospace Sciences 11049010101 17 0 36 8 41 14 53 7 66 20Elementary Education 11013120201 19 0 57 0 87 16 103 33Early Childhooe Education 11013121001 1 0 8 0 17 6 18 5Criminal Justice 11043010401 231 35 219 32 239 47 228 60 212 47Nursing 11051380102 460 53 400 74 451 108 387 97 355 93
2,053 302 1,988 388 2,037 450 1,929 452 1,881 439
Emergency Medical Technology 0351090403 40 22 48 44 66 45 93 57Medical Records Transcription 0351070706 0 0 4 1 0 0 0 0Emergency Medical Technician 0351090408 66 25
40 22 52 45 66 45 93 57 66 25
Radiography 0351090767 8 2 10 7 8 3 7 7 5 3Business Administration ATC 352020166 1 0 5 2 53 94 4 1 7 3Cardiovascular Technology 0351090166 1 0Database Technology 511010368 1 0
9 2 15 9 61 97 11 8 14 6
Allied HealthCardiovascular/Cardiopulmonary 1351090100 32 7 31 8 32 10 29 8 34 10Emergency Medical Services - EMS 1351090402 70 8 68 12 62 10 56 10 53 9Radiography 1351090700 61 19 58 21 54 19 50 15 53 23Diagnostic Medical Sonography 1351091000 25 8Diagnostic Medical Sonography 1351091004 11 0 34 10 34 11 34 10 38 12Occupational Therapy Assistant 1351080300 69 22 69 14 76 23 44 0Occupational Therapy Assistant 1351080303 71 32 73 23Physical Therapist Assistant 1351080601 48 17 50 20 48 21 44 23 50 0Respiratory Care 1351090800 19 6 23 10 26 7 24 13 14 9
335 87 333 95 332 101 352 111 315 86Health ServicesNursing R.N. (601 & 603) 1351380100 473 147 477 145 436 162 435 141 449 143
473 147 477 145 436 162 435 141 449 143Vocational Home EconomicsEarly Childhood Mgmt 1419070800 114 12Early Childhood Mgmt 1419070802 68 7 177 23 171 12 187 21 163 18
182 19 177 23 171 12 187 21 163 18Business Administration SupportAccounting Technology 1552030200 59 8Accounting Technology 1552030201 33 4 77 9 66 11 60 8 70 8Business Administration 1552020102 359 27 357 33 354 38 306 40 244 32Computer Program & Analysis 1511020100 54 11Computer Program & Analysis 1511020101 18 0 75 13 70 14 69 10 72 5Network Systems Technology 1511100111 64 4 71 6 68 7 2 1 2 1Network Systems Technology 1511100112 67 11 68 13Internet Services Technology 1511080102 9 0 8 2 9 0 3 0 1 0Office Administration 1507040100 0 0
596 54 588 63 567 70 507 70 457 59Communications TechnologyDigital/Multimedia Technology 1609070212
Digital/Multimedia Technology 1611080102 110 5 108 10 105 12 30 3Digital/Multimedia Technology 1611080103 87 24 70 7
110 5 108 10 105 12 117 27 70 7Engineering and Engineering TechnologyEngineering Technology 1615000001 73 10 69 7 73 8 81 5 69 3Computer Engineering Technology 1615040200 50 14 13 5 2 0 1 0
123 24 82 12 75 8 82 5 69 3Industrial Management TechnologyIndustrial Management Technology 1652020501 1 1 3 0 5 0 6 0
1 1 0 0 3 0 5 0 6 0Professional Pilot TechnologyAviation Administration 1649010402 9 0Aviation Administration 1649010403 17 0 31 6 33 6 39 11 42 12Aviation Maintenance Administration 1647060700 6 0 8 1 15 4 17 3Professional Pilot Technology 1649010200 54 6 77 7 99 6 109 13 130 17
80 6 114 13 140 13 163 28 189 32Protective ServicesCriminal Justice Technology 1743010302 113 14 228 36 206 40 186 28 157 24Fire Science Technology 1743020100 16 2 14 3 17 4 20 4 13 3
293 43 242 39 223 44 206 32 170 27Supply Chain ManagementSupply Chain Management 1652020901 14 0 31 3 31 2 37 6 34 9
34 2 31 3 31 2 37 6 34 92,227 388 2,152 403 2,083 424 2,091 441 1,922 384
Totals 2019-2020PROGRAM TITLE
CIP Totals 2015-2016 Totals 2016-2017 Totals 2017-2018 Totals 2018-2019
TOTAL APPLIED TECHNOLOGY DIPLOMASADVANCED TECHNICAL CERTIFICATES
TOTAL ADVANCED TECHNICAL CERTIFICATESAS DEGREES
Allied Health Subtotal
Health Services Subtotal
Voc Home Economics Subtotal
Business Adm Support Subtotal
Communications Tech Subtotal
Engineering and Eng Tech Subtotal
Industrial Management Tech Subtotal
Professional Pilot Tech Subtotal
Protective Services Subtotal
Supply Chain Management SubtotalTOTAL AS DEGREES
APPLIED TECHNOLOGY DIPLOMATOTAL BACCALAUREATE DEGREES
AA DEGREES
2019-2020 Polk State College Factbook 4.3 SOURCE: SDB AA1A (Spring Final)

AA1A ENROLLMENT AND COMPLETIONS DETAIL5-YEAR PROFILE
Enrolled Completed Enrolled Completed Enrolled Completed Enrolled Completed Enrolled CompletedTotals 2019-2020
PROGRAM TITLECIP Totals 2015-2016 Totals 2016-2017 Totals 2017-2018 Totals 2018-2019
Electrical Distribution Technology 0646030104 3 0 3 0 4 1 4 0 1 119 4 7 0 4 1 4 0 1 1
Allied HealthParamedic Certificate 0351090405 26 7 28 13 28 11 65 16 43 29Medical Information Coder/Biller 0351070707 78 6 107 5 118 18 130 28 134 30
104 13 135 18 146 29 195 44 177 59Information TechnologyMicrosoft Certified MCSD 0511020310 0 0Cisco CCNA 0611020301 0 0MicroComputer Repair/Installer 0647010406 5 2 5 1Network Server Admnistration CCC 0511100112 2 0 11 12 7 8 2 1Network Support Technician CCC 0511100121 1 0 2 0 1 1 3 0Network Infrastructure CCC 0511100114 1 0 39 48 8 7 2 2Engineering Support Specialist 0615000007 9 7 17 19 12 11 9 7 17 15
14 9 26 20 64 71 25 23 24 18Communications TechnologyDigital Multimedia Video Production 0609070210 5 1 2 0 13 14 2 3 4 1Digital Media/Multimedia Production 0610010507 7 0 7 2 21 19 20 22 13 12Digital Media/Multimedia Web Production 0650010208 1 0 1 0 3 0 1 0 4 0
13 1 10 2 37 33 23 25 21 13Business Management & Admin.Accounting Technology Operations 0552030203 8 4 9 3 25 29 19 13 26 20Entrepreneurship 0552070309 0 0Entrepreneurship 0552070308 4 3 3 2 16 17 12 13 9 6
12 7 12 5 41 46 31 26 35 26Education & TrainingChild Care Center Management 0419070904 1 1Child Care Center Management 0419070906 40 37 25 18 116 151 28 34 39 33Preschool 0419070908 8 1 22 21 101 150 35 42 38 29
48 38 47 39 217 301 64 77 77 62Logistics & TransportationLogistics & Transportation Specialist 0652020901 4 3 13 17 9 10 19 15
4 3 0 0 13 17 9 10 19 15195 71 230 84 518 497 347 205 353 193
Protective ServicesX-over from Law Enf Officer to Corr Officer 0743010205 37 36 30 15 26 25 2 0 2 0Correctional Officer 0743010200 14 9 14 11 52 46 106 65 60 56X-over from Correctional Probation Off to Law Enf 0743010703 1 0X-over from Correctional Officer to Law Enforcement 0743010702 13 0 42 11 25 49 55 22Auxillary Law Enforcement Officer 0743010709 1 0Law Enforcement 0743010700 111 66 125 73 90 69 80 28 122 57
162 111 183 99 210 151 213 142 240 135
EPI 5551399990 219 62 163 68 121 77 138 97 138 70219 62 163 68 121 77 138 97 138 70
10,088 2,065 9,132 2,223 10,416 3,056 10,154 2,673 9,912 2,574NOTE:
AAS DEGREES
TOTAL AAS DEGREESPSV CERTIFICATES
Allied Health Subtotal
Communications Technology Subtotal
TOTAL EPI CERTIFICATESGRAND TOTAL
An enrolled student is a program enrollee who has completed 25 percent of the program (if an AA degree) or selected courses (if an AS degree).
Logistics & Transportation SubtotalTOTAL PSV CERTIFICATESPSAV CERTIFICATES
TOTAL PSAV CERTIFICATESEPI CERTIFICATES (Teacher Certification)
Business Management & Admin Subtotal
Education & Training Subtotal
Information Technology Subtotal
2019-2020 Polk State College Factbook 4.3 SOURCE: SDB AA1A (Spring Final)

AA1A ENROLLMENT and COMPLETIONS DETAILSUMMARY
Enrolled Completed % Completers Enrolled Completed % Completers Enrolled Completed % Completers Enrolled Completed % Completers Enrolled Completed % Completers
AA DEGREESTotal AA Degrees 5,164 1,103 21% 4,342 1,127 26% 5,316 1,314 25% 5,328 1,271 24% 5,297 1,321 25%BACCALAUREATE DEGREESTotal Baccalaureate Degrees 2,053 302 15% 1,988 388 20% 2,037 450 22% 1,929 452 23% 1,881 439 23%APPLIED TECHNOLOGY DIPLOMATotal Applied Technology Diploma 40 22 55% 52 45 87% 66 45 68% 93 57 61% 66 25 38%ADVANCED TECHNICAL CERTIFICATESTotal Advanced Technical Certificates 9 2 22% 15 9 60% 61 97 159% 11 8 73% 14 6 43%AS DEGREESTotal AS Degrees 2,227 388 17% 2,152 403 19% 2,083 424 20% 2,091 441 21% 1,922 384 20%AAS DEGREESTotal AAS Degrees 19 4 21% 7 0 0% 4 1 25% 4 0 0% 1 1 100%PSV CERTIFICATESTotal PSV Certificates 195 71 36% 240 89 37% 518 497 96% 347 205 59% 353 193 55%PSAV CERTIFICATES (Protective Services)Total PSAV Certificates 162 111 69% 183 99 54% 210 151 72% 213 142 67% 240 135 56%EPI CERTIFICATES (Teacher Certification)Total EPI Certificates 219 62 28% 163 68 42% 121 77 64% 138 97 70% 138 70 51%
GRAND TOTAL 10,088 2,065 20% 9,142 2,228 24% 10,416 3,056 29% 10,154 2,673 26% 9,912 2,574 26%
NOTE: An enrolled student is a program enrollee who has completed 25 percent of the program (if an AA degree) or selected courses (if an AS degree).
PROGRAM TITLE
2019-20202015-2016 2016-2017 2017-2018 2018-2019
2019-2020 Polk State College Factbook 4.4 Source: SDB AA1A (Spring Final)

AA, AS, and BA ENROLLMENTS
Enrolled Enrolled Enrolled Enrolled Enrolled2015-2016 2016-2017 2017-2018 2018-2019 2019-2020
Total AA Degrees 5,164 4,342 5,316 5,328 5,297Total AS Degrees 2,227 2,152 2,083 2,091 1,922Total Baccalaureate Degrees 2,053 1,988 2,037 1,929 1,881
0
1,000
2,000
3,000
4,000
5,000
6,000
2019-2020 Polk State College Factbook Source: Page 4.4

AA, AS, and BA COMPLETIONS
Completed Completed Completed Completed Completed2015-2016 2016-2017 2017-2018 2018-2019 2019-2020
Total AA Degrees 1,103 1,127 1,314 1,271 1,321Total AS Degrees 388 403 424 441 384Total Baccalaureate Degrees 302 388 450 452 439
0
200
400
600
800
1,000
1,200
1,400
1,600
2019-2020 Polk State College Factbook Source: Page 4.4

AA, AS, and BA PERCENTAGE OF COMPLETERS
% Completers % Completers % Completers % Completers % Completers2015-2016 2016-2017 2017-2018 2018-2019 2019-2020
Total AA Degrees 21% 26% 25% 24% 25%Total AS Degrees 17% 19% 20% 21% 20%Total Baccalaureate Degrees 15% 20% 22% 23% 23%
2019-2020 Polk State College Factbook Source: Page 4.4

UNDUPLICATED CREDIT HEADCOUNT by AGEFALL
5-YEAR PROFILE
TOTAL
2015-2016 4,253 37.4% 1,715 15.1% 1,412 12.4% 1,373 12.1% 828 7.3% 607 5.3% 811 7.1% 384 3.4% 11,383
2016-2017 4,703 40.7% 1,702 14.7% 1,396 12.1% 1,243 10.8% 814 7.0% 613 5.3% 746 6.5% 343 3.0% 11,560
2017-2018 4,784 41.4% 1,759 15.2% 1,405 12.2% 1,355 11.7% 715 6.2% 537 4.7% 659 5.7% 332 2.9% 11,546
2018-2019 4,744 41.0% 1,768 15.3% 1,400 12.1% 1,342 11.6% 758 6.6% 560 4.8% 687 5.9% 307 2.7% 11,566
2019-2020 5,068 43.1% 1,810 15.4% 1,463 12.5% 1,247 10.6% 783 6.7% 525 4.5% 568 4.8% 284 2.4% 11,748
NOTE: 1. Numbers reflected above may vary from numbers reflected on page 3.1, Headcount Enrollment Unduplicated. Data from the above are pulled from the SDBPETENS report, while data
40-49 50 and Over
for page 3.1 are pulled from a SAS program.
Under 20 20 - 21 22 - 24 25-29 30-34 35-39
2019-2020 Polk State College Factbook 5.1 Source: SDBPETENS (Fall Final)

UNDUPLICATED CREDIT HEADCOUNT by AGEANNUAL
5-YEAR PROFILE and AVERAGE
TOTAL Age
Average
2014-2015 6,235 37.8% 2,314 14.0% 2,028 12.3% 1,909 11.6% 1,302 7.9% 899 5.5% 1,249 7.6% 554 3.4% 16,490 25.8
2015-2016 5,933 37.7% 2,293 14.6% 1,976 12.5% 1,940 12.3% 1,130 7.2% 842 5.3% 1,112 7.1% 529 3.4% 15,755 25.5
2016-2017 6,429 40.1% 2,261 14.1% 1,934 12.1% 1,870 11.7% 1,138 7.1% 838 5.2% 1,052 6.6% 496 3.1% 16,018 25.1
2017-2018 6,384 40.9% 2,235 14.3% 1,908 12.2% 1,886 12.1% 1,016 6.5% 761 4.9% 944 6.0% 475 3.0% 15,609 24.8
2018-2019 6,456 41.3% 2,264 14.5% 1,876 12.0% 1,875 12.0% 1,033 6.6% 765 4.9% 929 5.9% 449 2.9% 15,647 24.7
2019-2020 6,509 42.2% 2,258 14.6% 1,917 12.4% 1,737 11.3% 1,064 6.9% 702 4.6% 807 5.2% 420 2.7% 15,414 24.7
50 and OverUnder 20 22-2420-21 40-4935-3930-3425-29
2019-2020 Polk State College Factbook 5.2 SOURCE: SAS Program

UNDUPLICATED CREDIT HEADCOUNT by AGEACADEMIC YEAR 2018-2019
42%
15%
12%
11%
7% 5% 5% 3%
Under 20 20-21 22-24 25-29 30-34 35-39 40-49 50 Plus
2019-2018 Polk Staet College Factbook Source: Page 5.2
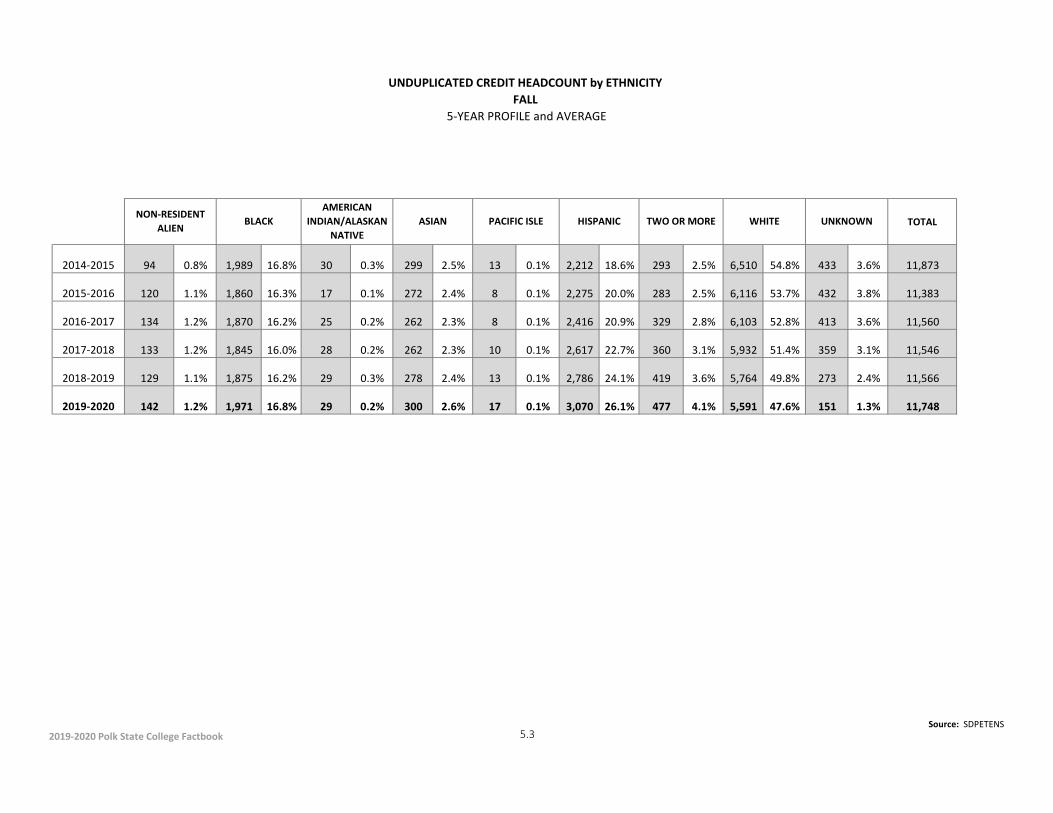
UNDUPLICATED CREDIT HEADCOUNT by ETHNICITYFALL
5-YEAR PROFILE and AVERAGE
TOTAL
2014-2015 94 0.8% 1,989 16.8% 30 0.3% 299 2.5% 13 0.1% 2,212 18.6% 293 2.5% 6,510 54.8% 433 3.6% 11,873
2015-2016 120 1.1% 1,860 16.3% 17 0.1% 272 2.4% 8 0.1% 2,275 20.0% 283 2.5% 6,116 53.7% 432 3.8% 11,383
2016-2017 134 1.2% 1,870 16.2% 25 0.2% 262 2.3% 8 0.1% 2,416 20.9% 329 2.8% 6,103 52.8% 413 3.6% 11,560
2017-2018 133 1.2% 1,845 16.0% 28 0.2% 262 2.3% 10 0.1% 2,617 22.7% 360 3.1% 5,932 51.4% 359 3.1% 11,546
2018-2019 129 1.1% 1,875 16.2% 29 0.3% 278 2.4% 13 0.1% 2,786 24.1% 419 3.6% 5,764 49.8% 273 2.4% 11,566
2019-2020 142 1.2% 1,971 16.8% 29 0.2% 300 2.6% 17 0.1% 3,070 26.1% 477 4.1% 5,591 47.6% 151 1.3% 11,748
TWO OR MORE WHITE UNKNOWNNON-RESIDENT
ALIENBLACK
AMERICAN INDIAN/ALASKAN
NATIVEASIAN PACIFIC ISLE HISPANIC
2019-2020 Polk State College Factbook 5.3Source: SDPETENS

UNDUPLICATED CREDIT HEADCOUNT by ETHNICITYANNUAL
5-YEAR PROFILE
TOTAL
2015-2016 170 1.1% 25 0.2% 12 0.1% 363 2.3% 3,050 19.4% 8,329 52.9% 2,567 16.3% 388 2.5% 851 5.4% 15,755
2016-2017 171 1.1% 37 0.2% 15 0.1% 383 2.4% 3,280 20.5% 8,198 51.2% 2,687 16.8% 441 2.8% 806 5.0% 16,018
2017-2018 177 1.1% 34 0.2% 17 0.1% 343 2.2% 3,452 22.1% 7,833 50.2% 2,567 16.4% 470 3.0% 716 4.6% 15,609
2018-2019 177 1.1% 34 0.2% 17 0.1% 359 2.3% 3,777 24.1% 7,662 49.0% 2,602 16.6% 573 3.7% 446 2.9% 15,647
2019-2020 174 1.1% 37 0.2% 20 0.1% 395 2.6% 3,949 25.6% 7,363 47.8% 2,630 17.1% 602 3.9% 244 1.6% 15,414
NOTE:
1. Numbers reflected in the above chart may vary from chart 3.1, Headcount Enrollment Unduplicated. Data for this chart are pulled from EF2 using a SAS Program.
2. If an ethnicity group enrollment percentage is less than 1.5%, it is not included in the following chart.
UNKNOWNAMERICAN
INDIAN/ALASKAN NATIVE
NON-RESIDENT ALIEN
BLACKHISPANIC WHITEASIAN MULTIPACIFIC ISLE
2019-2020 Polk State College Factbook 5.4 Source: SAS Program

UNDUPLICATED CREDIT HEADCOUNT by ETHNICITYANNUAL
0
1,000
2,000
3,000
4,000
5,000
6,000
7,000
8,000
9,000
ASIAN HISPANIC WHITE BLACK MULTI UNKNOWN
2017-2018 2018-2019 2019-2020
2019-2020 Polk State College Factbook Source: Page 5.4

UNDUPLICATED CREDIT HEADCOUNT by GENDERFALL
5-YEAR PROFILE and AVERAGE
Male % Female % TOTAL
2015-2016 4,268 37.5% 7,115 62.5% 11,383
2016-2017 4,283 37.1% 7,277 62.9% 11,560
2017-2018 4,310 37.3% 7,236 62.7% 11,546
2018-2019 4,089 35.4% 7,477 64.6% 11,566
2019-2020 4,122 35.1% 7,626 64.9% 11,748
5-YR AVG 6,008 36.7% 10,369 63.3% 16,376
2019-2020 Polk State College Factbook 5.5 Source: SDPETENS (Fall Final)

UNDUPLICATED CREDIT HEADCOUNT by GENDERANNUAL
5-YEAR PROFILE and AVERAGE
Male % Female % Unknown % TOTAL
2015-2016 5,661 35.9% 9,540 60.6% 554 3.5% 15,755
2016-2017 5,822 36.3% 9,732 60.8% 464 2.9% 16,018
2017-2018 5,651 36.2% 9,545 61.2% 413 2.6% 15,609
2018-2019 5,537 35.4% 9,854 63.0% 256 1.6% 15,647
2019-2020 5,435 35.3% 9,840 63.8% 139 0.9% 15,414
5-YR AVG 8,034 35.9% 13,809 61.6% 564 2.5% 22,406
2019-2020 Polk State College Factbook 5.6 Source: SAS Program
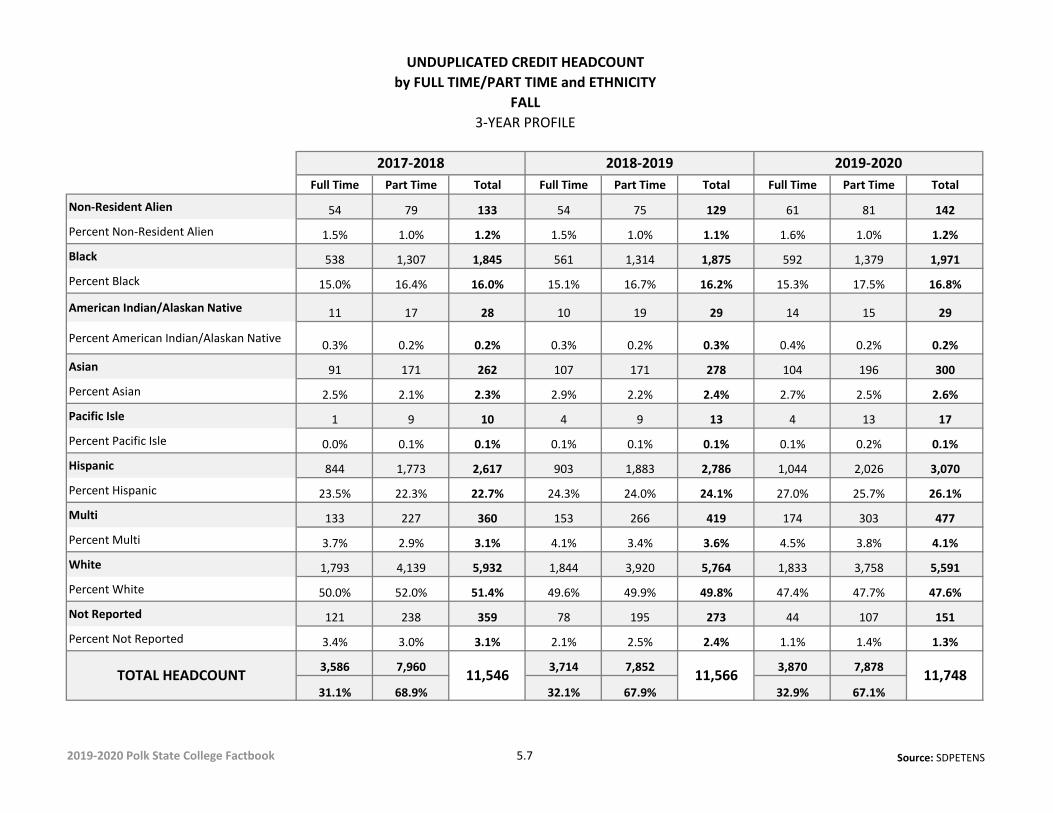
UNDUPLICATED CREDIT HEADCOUNTby FULL TIME/PART TIME and ETHNICITY
FALL3-YEAR PROFILE
Full Time Part Time Total Full Time Part Time Total Full Time Part Time Total
Non-Resident Alien 54 79 133 54 75 129 61 81 142
Percent Non-Resident Alien 1.5% 1.0% 1.2% 1.5% 1.0% 1.1% 1.6% 1.0% 1.2%
Black 538 1,307 1,845 561 1,314 1,875 592 1,379 1,971
Percent Black 15.0% 16.4% 16.0% 15.1% 16.7% 16.2% 15.3% 17.5% 16.8%
American Indian/Alaskan Native 11 17 28 10 19 29 14 15 29
Percent American Indian/Alaskan Native 0.3% 0.2% 0.2% 0.3% 0.2% 0.3% 0.4% 0.2% 0.2%
Asian 91 171 262 107 171 278 104 196 300
Percent Asian 2.5% 2.1% 2.3% 2.9% 2.2% 2.4% 2.7% 2.5% 2.6%
Pacific Isle 1 9 10 4 9 13 4 13 17
Percent Pacific Isle 0.0% 0.1% 0.1% 0.1% 0.1% 0.1% 0.1% 0.2% 0.1%
Hispanic 844 1,773 2,617 903 1,883 2,786 1,044 2,026 3,070
Percent Hispanic 23.5% 22.3% 22.7% 24.3% 24.0% 24.1% 27.0% 25.7% 26.1%
Multi 133 227 360 153 266 419 174 303 477
Percent Multi 3.7% 2.9% 3.1% 4.1% 3.4% 3.6% 4.5% 3.8% 4.1%
White 1,793 4,139 5,932 1,844 3,920 5,764 1,833 3,758 5,591
Percent White 50.0% 52.0% 51.4% 49.6% 49.9% 49.8% 47.4% 47.7% 47.6%
Not Reported 121 238 359 78 195 273 44 107 151
Percent Not Reported 3.4% 3.0% 3.1% 2.1% 2.5% 2.4% 1.1% 1.4% 1.3%
3,586 7,960 3,714 7,852 3,870 7,878
31.1% 68.9% 32.1% 67.9% 32.9% 67.1%
2019-2020
11,748
2018-2019
11,566TOTAL HEADCOUNT
2017-2018
11,546
2019-2020 Polk State College Factbook 5.7 Source: SDPETENS

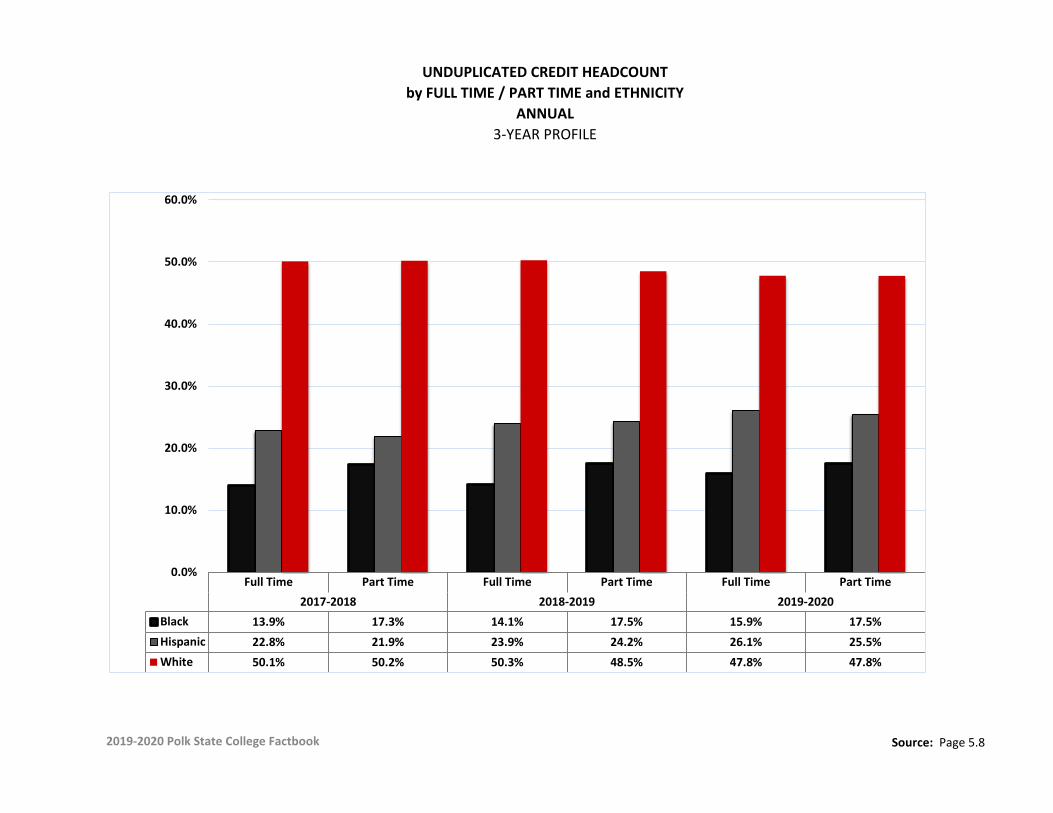
UNDUPLICATED CREDIT HEADCOUNTby FULL TIME / PART TIME and ETHNICITY
ANNUAL3-YEAR PROFILE
Full Time Part Time Total Full Time Part Time Total Full Time Part Time Total
Non-Resident Alien 63 114 177 54 123 177 59 115 174
Percent Non-Resident Alien 1.6% 1.0% 1.1% 1.3% 1.1% 1.1% 1.5% 1.0% 1.1%
Black 554 2,013 2,567 581 2,021 2,602 635 1,995 2,630
Percent Black 13.9% 17.3% 16.4% 14.1% 17.5% 16.6% 15.9% 17.5% 17.1%
American Indian/Alaskan Native 13 21 34 12 22 34 11 26 37Percent American Indian/Alaskan Native 0.3% 0.2% 0.2% 0.3% 0.2% 0.2% 0.3% 0.2% 0.2%
Asian 98 245 343 118 241 359 125 270 395
Percent Asian 2.5% 2.1% 2.2% 2.9% 2.1% 2.3% 3.1% 2.4% 2.6%
Pacific Isle 5 12 17 7 10 17 6 14 20
Percent Pacific Isle 0.1% 0.1% 0.1% 0.2% 0.1% 0.1% 0.1% 0.1% 0.1%
Hispanic 908 2,544 3,452 986 2,791 3,777 1,045 2,904 3,949
Percent Hispanic 22.8% 21.9% 22.1% 23.9% 24.2% 24.1% 26.1% 25.5% 25.6%
Multi 136 334 470 162 411 573 155 447 602
Percent Multi 3.4% 2.9% 3.0% 3.9% 3.6% 3.7% 3.9% 3.9% 3.9%
White 1,992 5,841 7,833 2,073 5,589 7,662 1,914 5,449 7,363
Percent White 50.1% 50.2% 50.2% 50.3% 48.5% 49.0% 47.8% 47.8% 47.8%
Not Reported 207 509 716 130 316 446 55 189 244
Percent Not Reported 5.2% 4.4% 4.6% 3.2% 2.7% 2.9% 1.4% 1.7% 1.6%
3,976 11,633 4,123 11,524 4,005 11,409
25.5% 74.5% 26.4% 73.6% 26.0% 74.0%15,609
2019-2020
15,414
2018-2019
15,647
2017-2018
TOTAL HEADCOUNT
2019-2020 Polk State College Factbook 5.8 Source: SAS Program
UNDUPLICATED CREDIT HEADCOUNTby FULL TIME / PART TIME and ETHNICITY
ANNUAL3-YEAR PROFILE
Full Time Part Time Full Time Part Time Full Time Part Time2017-2018 2018-2019 2019-2020
Black 13.9% 17.3% 14.1% 17.5% 15.9% 17.5%Hispanic 22.8% 21.9% 23.9% 24.2% 26.1% 25.5%White 50.1% 50.2% 50.3% 48.5% 47.8% 47.8%
0.0%
10.0%
20.0%
30.0%
40.0%
50.0%
60.0%
2019-2020 Polk State College Factbook Source: Page 5.8

UNDUPLICATED CREDIT HEADCOUNTby FULL TIME / PART TIME and GENDER
FALL3-YEAR PROFILE
Male % Female % Total %
Full Time 1,416 39.5% 2,170 60.5% 3,586 31.1%
Part Time 2,894 36.4% 5,066 63.6% 7,960 68.9%
TOTAL 4,310 37.3% 7,236 62.7% 11,546 100.0%
Full Time 1,410 38.0% 2,304 62.0% 3,714 32.1%
Part Time 2,679 34.1% 5,173 65.9% 7,852 67.9%
TOTAL 4,089 35.4% 7,477 64.6% 11,566 100.0%
Full Time 1,467 37.9% 2,403 62.1% 3,870 32.9%
Part Time 2,655 33.7% 5,223 66.3% 7,878 67.1%
TOTAL 4,122 35.1% 7,626 64.9% 11,748 100.0%
2019
-202
020
18-2
019
2017
-201
8
2019-2020 Polk State College Factbook 5.9Source: SDPETENS
UNDUPLICATED CREDIT HEADCOUNTby FULL TIME / PART TIME and GENDER
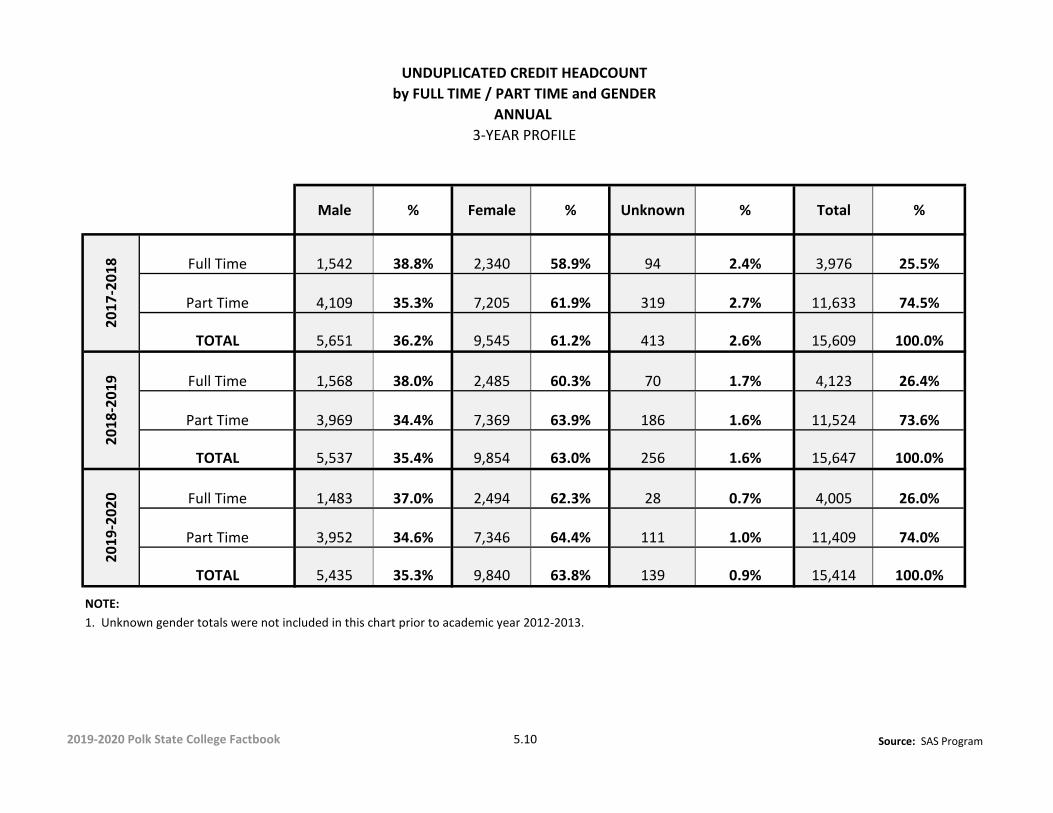
ANNUAL3-YEAR PROFILE
Male % Female % Unknown % Total %
Full Time 1,542 38.8% 2,340 58.9% 94 2.4% 3,976 25.5%
Part Time 4,109 35.3% 7,205 61.9% 319 2.7% 11,633 74.5%
TOTAL 5,651 36.2% 9,545 61.2% 413 2.6% 15,609 100.0%
Full Time 1,568 38.0% 2,485 60.3% 70 1.7% 4,123 26.4%
Part Time 3,969 34.4% 7,369 63.9% 186 1.6% 11,524 73.6%
TOTAL 5,537 35.4% 9,854 63.0% 256 1.6% 15,647 100.0%
Full Time 1,483 37.0% 2,494 62.3% 28 0.7% 4,005 26.0%
Part Time 3,952 34.6% 7,346 64.4% 111 1.0% 11,409 74.0%
TOTAL 5,435 35.3% 9,840 63.8% 139 0.9% 15,414 100.0%
NOTE: 1. Unknown gender totals were not included in this chart prior to academic year 2012-2013.
2017
-201
820
19-2
020
2018
-201
9
2019-2020 Polk State College Factbook 5.10 Source: SAS Program

UNDUPLICATED CREDIT HEADCOUNTby FULL TIME/PART TIME AND GENDER
ANNUAL3-YEAR COMPARISON
0.0%
10.0%
20.0%
30.0%
40.0%
50.0%
60.0%
70.0%
Full Time Part Time Full Time Part Time Full Time Part Time2017-2018 2018-2019 2019-2020
Male 38.8% 35.3% 38.0% 34.4% 37.0% 34.6%Female 58.9% 61.9% 60.3% 63.9% 62.3% 64.4%Unknown 2.4% 2.7% 1.7% 1.6% 0.7% 1.0%
2019-2020 Polk State College Factbook Source: Page 5.10

GLOSSARY OF TERMS
A&P: Advanced and Professional
AA: Associate of Arts Degree
AS: Associate of Science Degree
ATC: Advanced Technical Certificate
ATD: Advanced Technical Diploma
BAS: Bachelor of Applied Science Degree
BS: Bachelor of Science Degree
BSN: Bachelor of Science in Nursing Degree
CIP Code: The Classification of Instructional Programs.
Completer: A student that has completed a program and graduated.
CWE: Continuing Workforce Education
Duplicated Headcount: A count of students in which a student may be counted more than once. Example: Number of students by ICS Type is counted in an A&P course as well as a PSV course, if they are taking classes in both categories.
Fall Term: August through December
FTE: Full-Time Equivalent - a metric used for measuring enrollment in colleges and universities.
FTIC: First Time in College – a student enrolled in their first semester in college after high school graduation. Students enrolled as dual enrolled while concurrently enrolled in high school are NOT defined as FTIC until after they return to the college after high school graduation.
ICS Type: The International Classification for Standards (ICS) is a convention managed by the International Organization for Standardization (ISO) and used in catalogues of international, regional, and national standards and other normative documents. ICS Type is associated with a course.
IPEDS: The Integrated Postsecondary Education Data System
Lower Division: Courses that lead to an Associate Degree
PSAV: Post Secondary Advanced Vocational
PSV: Post Secondary Vocational
SDB: Student Data Base – a collection of official college data submitted for state reporting. Data is subsequently used by the state to submit to IPEDS.
Spring Term: January through May
SSH: Semester Student Headcount
Summer Term: May through August
Unduplicated Headcount: A count of students in which each student is counted only once.
Upper Division: Courses that lead to a Bachelor Degree.
VC: Vocational Certificate
2018-2019 Polk State College Factbook


