CCF Summary 2012 Update November 2013 1 General Insights from Analysis of Common-Cause Failure Data at U.S. Nuclear Power Plants 1997–2012 The common-cause failure (CCF) study uses operating experience to characterize the frequency and nature of component failure data from operating U.S. commercial nuclear power plants. The evaluation is based on the operating experience from 1997 through 2012. The data sources for this report include: License Event Reports (LERs), 1997 to 2012 Equipment Performance and Information Exchange (EPIX), 1997 to 2012 The CCF database is a rich source of information on various aspects of CCF. Exploring the full potential of the database merits a dedicated activity and is outside the scope of the current effort, which has focused on building the infrastructure for such analyses. Nevertheless, some general observations have been made on the character of CCF events, including their causes and shared cause factors, and frequency of occurrence. Some of these insights are summarized in this section. Table 1 lists the systems and component types for which CCF events have been collected and entered into the database. The events are further classified by failure modes (e.g., pump fails to start, valve fails to open). Basic information about the nature of CCF events is displayed in Figure 1 and Figure 2. These figures illustrate the distribution of CCF event proximate causes and coupling factors, respectively. This information provides a general picture of the types of events that may be expected to occur, and what design features might be most susceptible to CCF events. These figures also illustrate the different characteristics of partial CCF events and complete CCF events (events with timing factor, shared cause factor, and component degradation values for each component in the common-cause component group (CCCG) = 1.0). Figure 3 and Figure 4 display the number of CCF events by year of occurrence. Figure 5 and Figure 6 show the distribution of CCF events by system. Figure 7 and Figure 8 show the distribution of CCF events by component. A general review of the actual events and the distributions provided in Figure 1 and Figure 2 reveals the following insights regarding CCF events: Human errors related to procedures caused a small percentage of the total events, but the impact of the individual events is usually greater, since human errors have overridden the programmatic controls. This is illustrated by comparing Figure 1, the All CCF events case with the Complete CCF events case, which shows that human error causes a larger portion of complete CCF events than all CCF events. The examples of events caused by human error are all EDG day tanks simultaneously drained for chemistry surveillance, and two pump breakers racked out as the plant changed modes from shutdown to power. A vast majority of All CCF events are not due to multiple failures in response to an operational demand, but result from a “condition of equipment.” The most common is inspection or surveillance test of one component revealing a deficiency that prompts the licensee to inspect/test the redundant component, resulting in the discovery that the same
Transcript
CCF Summary 2012 Update
November 2013
1
General Insights from Analysis of Common-Cause Failure Data at U.S. Nuclear Power Plants
1997–2012
The common-cause failure (CCF) study uses operating experience to characterize the frequency
and nature of component failure data from operating U.S. commercial nuclear power plants. The
evaluation is based on the operating experience from 1997 through 2012. The data sources for this report
include:
License Event Reports (LERs), 1997 to 2012
Equipment Performance and Information Exchange (EPIX), 1997 to 2012
The CCF database is a rich source of information on various aspects of CCF. Exploring the full
potential of the database merits a dedicated activity and is outside the scope of the current effort, which
has focused on building the infrastructure for such analyses. Nevertheless, some general observations
have been made on the character of CCF events, including their causes and shared cause factors, and
frequency of occurrence. Some of these insights are summarized in this section.
Table 1 lists the systems and component types for which CCF events have been collected and
entered into the database. The events are further classified by failure modes (e.g., pump fails to start,
valve fails to open).
Basic information about the nature of CCF events is displayed in Figure 1 and Figure 2. These
figures illustrate the distribution of CCF event proximate causes and coupling factors, respectively. This
information provides a general picture of the types of events that may be expected to occur, and what
design features might be most susceptible to CCF events. These figures also illustrate the different
characteristics of partial CCF events and complete CCF events (events with timing factor, shared cause
factor, and component degradation values for each component in the common-cause component group
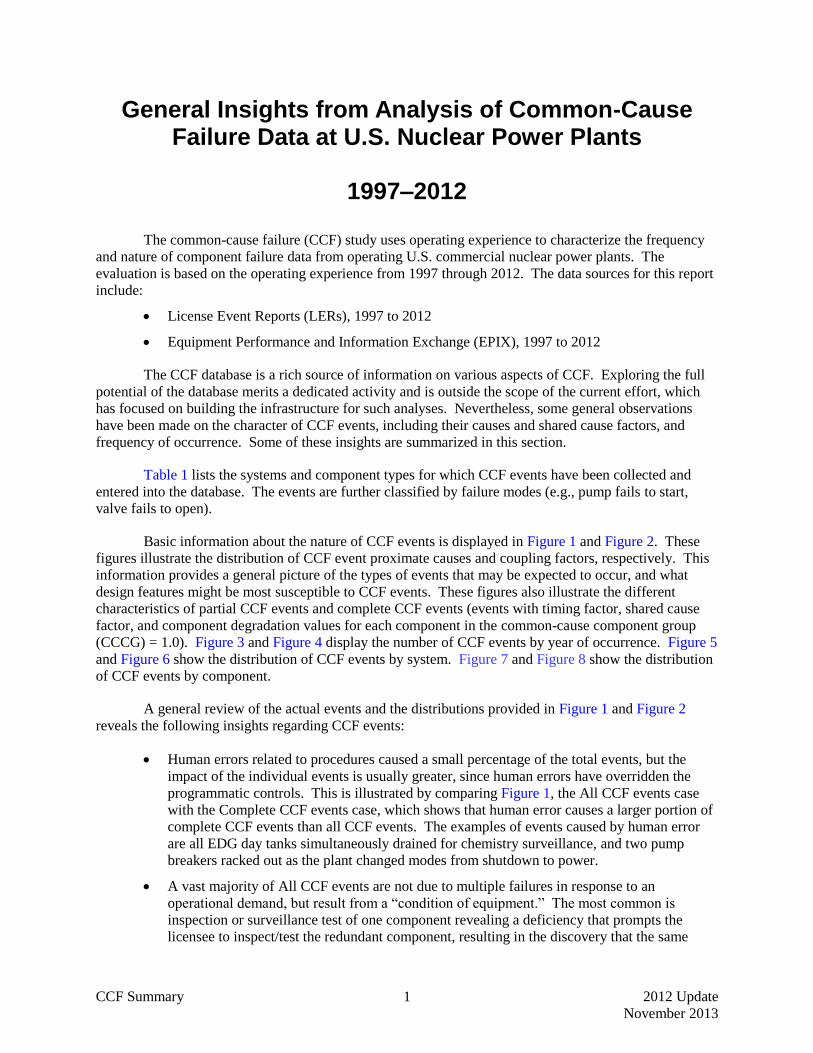
(CCCG) = 1.0). Figure 3 and Figure 4 display the number of CCF events by year of occurrence. Figure 5
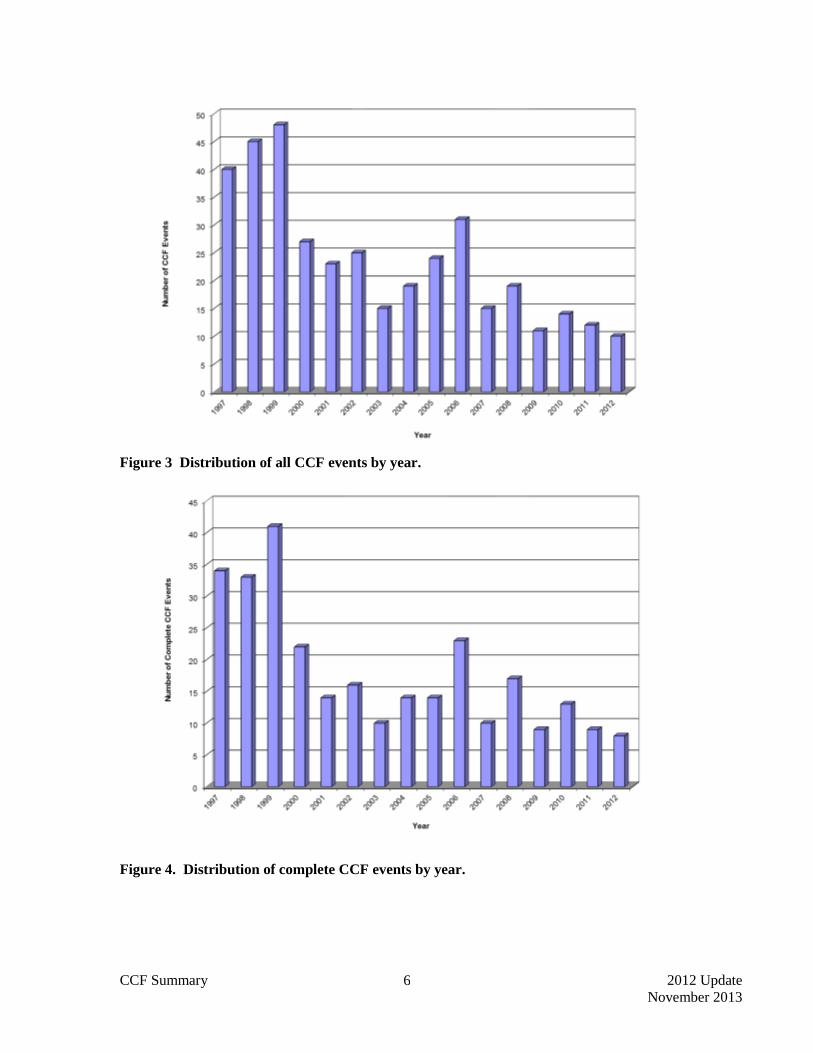
and Figure 6 show the distribution of CCF events by system. Figure 7 and Figure 8 show the distribution
of CCF events by component.
A general review of the actual events and the distributions provided in Figure 1 and Figure 2
reveals the following insights regarding CCF events:
Human errors related to procedures caused a small percentage of the total events, but the
impact of the individual events is usually greater, since human errors have overridden the
programmatic controls. This is illustrated by comparing Figure 1, the All CCF events case
with the Complete CCF events case, which shows that human error causes a larger portion of
complete CCF events than all CCF events. The examples of events caused by human error
are all EDG day tanks simultaneously drained for chemistry surveillance, and two pump
breakers racked out as the plant changed modes from shutdown to power.
A vast majority of All CCF events are not due to multiple failures in response to an
operational demand, but result from a “condition of equipment.” The most common is
inspection or surveillance test of one component revealing a deficiency that prompts the
licensee to inspect/test the redundant component, resulting in the discovery that the same
CCF Summary 2012 Update
November 2013
2
defective condition exists on both components. This demonstrates that detection of failures
during the testing and surveillance program prevents CCF events from occurring during
actual demand situations.
A major contributor to CCF events is programmatic maintenance practices. The frequency of
scheduling has been a factor in the numerous wear-caused and aging-caused events.
Additionally, the quality of the maintenance, both in the procedures and in performance of
the maintenance activities, is an essential factor. Similar events have occurred at different
plants—lubrication of circuit breakers (too much, too little, or too long between lubrications),
improperly set torque and limit switches on MOVs that are reported as misadjustments and
not setpoint drift. This indicates that there are maintenance practices that need to be reviewed
to reduce CCF potential. However, the maintenance issue generally does not cause complete
CCF events.
Among complete CCF events, design problems are an important contributor. Many of the
design-related events resulted from a design modification, indicating that perhaps the
modification review processes were not rigorous and resulted in CCF susceptibilities.
The CCF database contains several examples where both CCF and independent events recur
at some, but not all, plants, perhaps indicating ineffective root cause analysis and corrective
action. Examples of repeated events are water in compressed air systems, pump seal wear-
out, and turbine governor misadjustments. Additionally, not all plants experience the same
type of recurring event. This indicates that plant-to-plant variability exists in the CCF
parameters that might cause the CCF parameter estimates for some plants to be higher than
the industry average, for some component and system combinations. Thus, it is very
important to perform plant-specific CCF parameter estimations for plant-specific PRAs and
reliability studies.
The trends show that All CCF events and Complete CCF events have been decreasing with
time.
With respect to quantification of CCFs, the overall conclusion is that, based on the evaluation of
over 20 years of operating experience data, CCF parameters for similar components vary among systems
and failure modes. In addition, the CCF failure parameters have decreased over time.
CCF Summary 2012 Update
November 2013
3
Table 1. Component types and systems analyzed for CCF events (1997–2012).
Component Type System
Air Operated Valve Auxiliary feedwater
High pressure injection
Isolation condenser
Main feedwater
Main steam
Residual Heat Removal (LCI in BWRs; LPI in PWRs)
Battery dc power
Battery Charger dc power
Check Valve Auxiliary feedwater
Containment spray recirculation
Normally operating service water
Reactor core isolation
Residual Heat Removal (LCI in BWRs; LPI in PWRs)
Circuit Breaker Plant ac power
Reactor protection
Compressor Instrument air
Generator Emergency power supply
Heat Exchanger Component cooling water
Hydraulic Operated Valve
Auxiliary feedwater
Residual Heat Removal (LCI in BWRs; LPI in PWRs)
Low Capacity Relief Valve
Chemical and volume control
Component cooling water
Normally operating service water
Residual Heat Removal (LCI in BWRs; LPI in PWRs)
Main Steam Stop Valve
Main steam
Component Type System
Motor Driven Pump Auxiliary feedwater
Chemical and volume control
Component cooling water
Containment spray recirculation
High pressure injection
Main feedwater
Motor Driven Pump Normally operating service water
Residual Heat Removal (LCI in BWRs; LPI in PWRs)
Standby liquid control
Standby service water
Motor Operated Valve
Auxiliary feedwater
High pressure injection
Low pressure core spray
Reactor core isolation
Residual Heat Removal (LCI in BWRs; LPI in PWRs)
Power Operated Relief Valve
Main steam
Reactor coolant
Safety Relief Valve (Dual Actuation)
Main steam
Safety Valve (Single Acting)
Main steam
Strainer Circulating water system
Normally operating service water
Standby service water
Turbine Driven Pump Auxiliary feedwater
Reactor core isolation
Vacuum Breaker Vapor suppression
CCF Summary 2012 Update
November 2013
4
Figure 1. Distribution of CCF events by proximate cause.
CCF Summary 2012 Update
November 2013
5
Figure 2 Distribution of CCF events by coupling factor.
CCF Summary 2012 Update
November 2013
6
Figure 3 Distribution of all CCF events by year.
Figure 4. Distribution of complete CCF events by year.
CCF Summary 2012 Update
November 2013
7
Figure 5. Distribution of all CCF events by system.
Figure 6. Distribution of complete CCF events by system.
CCF Summary 2012 Update
November 2013
8
Figure 7. Distribution of all CCF events by component type.
Figure 8. Distribution of complete CCF events by component type.
CCF Summary 2012 Update
November 2013
9
Component Type System Failure Mode Count by Component Type
and Failure Mode
Count by Component
Type
CCF Events Independent
Events
CCF
Events
Independent
Events Air Operated Valve Auxiliary feedwater Fail to Close 2 34 21 238
Fail to Open 3 36 Fail to Open/Close 1 2 Fail to Operate 1 3 UA (Maint) 1 9 High pressure injection Fail to Close 1 3 Isolation condenser Fail to Close 1 Main feedwater Fail to Close 2 35 Main steam Fail to Close 2 22 Fail to Control 3 26 Fail to Open 1 47 Residual Heat Removal (LCI in BWRs;
LPI in PWRs)
Fail to Open 1 21
UA (Other Comp) 2 Battery dc power Fail to Operate 1 40 1 40
Battery Charger dc power Fail to Operate 9 292 9 292
Check Valve Auxiliary feedwater Fail to Close 1 6 9 40
Leak (Internal) 2 11 Containment spray recirculation Leak (Internal) 1 6 Normally operating service water Fail to Close 1 4 Reactor core isolation Leak (Internal) 1 2
Residual Heat Removal (LCI in BWRs; LPI in PWRs)
Leak (Internal) 3 11
Circuit Breaker Plant ac power Fail to Close 1 148 14 301
Fail to Open 6 50 Spurious Operation 3 60 UA (Maint) 3 23 Reactor protection Fail to Close 1 20
Compressor Instrument air Fail to Run 4 450 6 643
Fail to Start 2 193 Generator Emergency power supply Fail to Load/Run 3 265 17 1307
Fail to Run 5 188 Fail to Start 4 281 UA (Maint) 5 573
Heat Exchanger Component cooling water Loss of Heat Transfer 2 25 2 25
CCF Summary 2012 Update
November 2013
10
Component Type System Failure Mode Count by Component Type
Motor Driven Pump Auxiliary feedwater Fail to Run <1H 2 8 55 1049
Fail to Start 2 39 UA (Other Comp) 1 10 Chemical and volume control Fail to Run 2 150 UA (Maint) 3 63 UA (Other Comp) 1 14 Component cooling water Fail to Run 2 62 Containment spray recirculation Fail to Start 3 31 High pressure injection Fail to Run >1H 3 19 Fail to Start 1 51 Main feedwater Fail to Run 2 13 Normally operating service water Fail to Run 3 63 Fail to Run >1H 1 Residual Heat Removal (LCI in BWRs;
LPI in PWRs)
Fail to Run <1H 1 8
Fail to Run >1H 1 23 Fail to Start 8 67 Standby liquid control Fail to Start 1 15 Standby service water Fail to Run <1H 1 22 Fail to Run >1H 6 99
Fail to Start 8 131
CCF Summary 2012 Update
November 2013
11
Component Type System Failure Mode Count by Component Type
and Failure Mode
Count by Component
Type
CCF Events Independent
Events
CCF
Events
Independent
Events
UA (Maint) 3 161 Motor Operated Valve Auxiliary feedwater Fail to Close 2 31 16 399
Fail to Open 1 37 Fail to Operate 1 2 High pressure injection Leak (Internal) 1 5 Low pressure core spray Fail to Close 1 13 Spurious Operation 1 1 Reactor core isolation Fail to Close 1 17 Fail to Open 2 22 Leak (Internal) 2 13 Residual Heat Removal (LCI in BWRs;
LPI in PWRs)
Fail to Close 1 84
Fail to Open 2 146 Leak (Internal) 1 28
Power Operated Relief Valve Main steam Automatic Close 1 1 39 243
Control Function 1 19 Fail to Close 1 32 Fail to Open 7 90 Setpoint 18 12 Spurious Operation 1 22 UA (Maint) 1 14 UA (Other Comp) 1 18
Reactor coolant Automatic Open 1 3
Fail to Open 2 20 Leak (Internal) 2 9 Low Pressure 2 1 UA (Maint) 1 2
Safety Relief Valve (Dual Actuation)
Main steam Automatic Open 1 1 46 99
Fail to Open 6 23 Leak (Internal) 4 23 Setpoint 33 38 Spurious Operation 1 11 UA (Other Comp) 1 3
CCF Summary 2012 Update
November 2013
12
Component Type System Failure Mode Count by Component Type
and Failure Mode
Count by Component
Type
CCF Events Independent
Events
CCF
Events
Independent
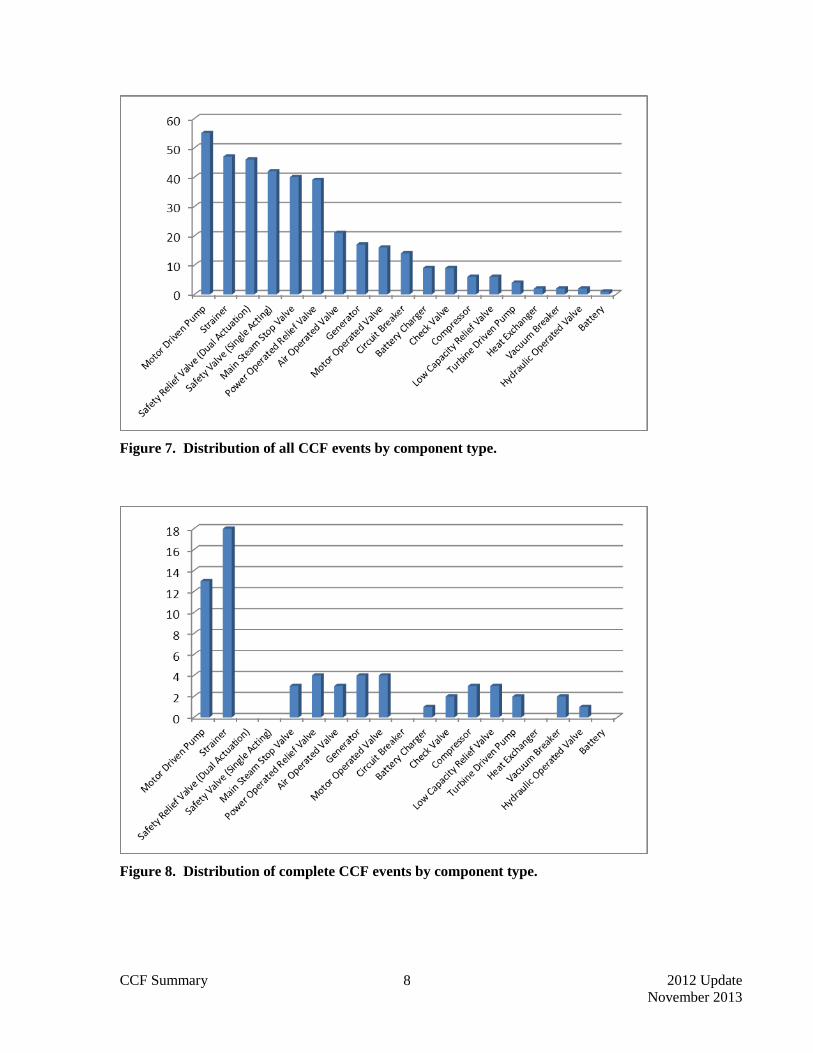
Events Safety Valve (Single Acting) Main steam Fail to Close 1 6 42 54
Fail to Open 3 1 Setpoint 38 47
Strainer Circulating water system Bypass 2 3 47 250
Fail to Operate 19 53 Plug 16 35 Normally operating service water Fail to Operate 3 107 Plug 4 40 Standby service water Plug 3 12
Turbine Driven Pump Auxiliary feedwater Fail to Run <1H 1 43 4 191
Fail to Start 1 82 UA (Other Comp) 1 15
Reactor core isolation Fail to Start 1 51 Vacuum Breaker Vapor suppression Fail to Open 1 9 2 12