GENERAL INSTRUCTIONS Marks in the mark scheme are explicitly designated as M, A, B, E or G. M marks ("method") are for an attempt to use a correct method (not merely for stating the method). A marks ("accuracy") are for accurate answers and can only be earned if corresponding M mark(s) have been earned. Candidates are expected to give answers to a sensible level of accuracy in the context of the problem in hand. The level of accuracy quoted in the mark scheme will sometimes deliberately be greater than is required, when this facilitates marking. B marks are independent of all others. They are usually awarded for a single correct answer. Typically they are available for correct quotation of points such as 1.96 from tables. E marks ("explanation") are for explanation and/or interpretation. These will frequently be sub divisible depending on the thoroughness of the candidate's answer. G marks ("graph") are for completing a graph or diagram correctly. • Insert part marks in right-hand margin in line with the mark scheme. For fully correct parts tick the answer. For partially complete parts indicate clearly in the body of the script where the marks have been gained or lost, in line with the mark scheme. • Please indicate incorrect working by ringing or underlining as appropriate. • Insert total in right-hand margin, ringed, at end of question, in line with the mark scheme. • Numerical answers which are not exact should be given to at least the accuracy shown. Approximate answers to a greater accuracy may be condoned. • Probabilities should be given as fractions, decimals or percentages. • FOLLOW-THROUGH MARKING SHOULD NORMALLY BE USED WHEREVER POSSIBLE. There will, however, be an occasional designation of 'c.a.o.' for "correct answer only". • Full credit MUST be given when correct alternative methods of solution are used. If errors occur in such methods, the marks awarded should correspond as nearly as possible to equivalent work using the method in the mark scheme. • The following notation should be used where applicable: PMT
Transcript
GENERAL INSTRUCTIONS Marks in the mark scheme are explicitly designated as M, A, B, E or G. M marks ("method") are for an attempt to use a correct method (not merely for stating the method). A marks ("accuracy") are for accurate answers and can only be earned if corresponding M mark(s) have been earned. Candidates are expected to give answers to a sensible level of accuracy in the context of the problem in hand. The level of accuracy quoted in the mark scheme will sometimes deliberately be greater than is required, when this facilitates marking. B marks are independent of all others. They are usually awarded for a single correct answer. Typically they are available for correct quotation of points such as 1.96 from tables. E marks ("explanation") are for explanation and/or interpretation. These will frequently be sub divisible depending on the thoroughness of the candidate's answer. G marks ("graph") are for completing a graph or diagram correctly.
• Insert part marks in right-hand margin in line with the mark scheme. For fully correct parts tick the answer. For partially complete parts indicate clearly in the body of the script where the marks have been gained or lost, in line with the mark scheme.
• Please indicate incorrect working by ringing or underlining as appropriate.
• Insert total in right-hand margin, ringed, at end of question, in line with the mark
scheme.
• Numerical answers which are not exact should be given to at least the accuracy shown. Approximate answers to a greater accuracy may be condoned.
• Probabilities should be given as fractions, decimals or percentages.
• FOLLOW-THROUGH MARKING SHOULD NORMALLY BE USED
WHEREVER POSSIBLE. There will, however, be an occasional designation of 'c.a.o.' for "correct answer only".
• Full credit MUST be given when correct alternative methods of solution are used.
If errors occur in such methods, the marks awarded should correspond as nearly as possible to equivalent work using the method in the mark scheme.
• The following notation should be used where applicable:
PMT
Question 1 (i)
Uniform average rate of occurrence;
Successive arrivals are independent.
Suitable arguments for/against each assumption: Eg Rate of occurrence could vary depending on the weather (any reasonable suggestion)
E1,E1 for suitable assumptions E1, E1 must be in context
4
(ii)
Mean = xfnΣ = 39 40 36 32 15
100+ + + + =162
100 = 1.62
Variance = ( )2211
fx nxn
Σ −−
= ( 21 430 100 1.6299
− × )= 1.69 (to 2 d.p.)
B1 for mean NB answer given M1 for calculation
A1
3
(iii) Yes, since mean is close to variance B1FT 1
(iv) P(X = 2) = e−1.62
21.622!
= 0.260 (3 s.f.)
Either: Thus the expected number of 2’s is 26 which is reasonably close to the observed value of 20.
Or: This probability compares reasonably well with the relative frequency 0.2
M1 for probability calc. M0 for tables unless interpolated A1 B1 for expectation of 26 or r.f. of 0.2 E1
4
(v)
λ = 5×1.62 = 8.1
Using tables: P(X ≥ 10) = 1 – P(X ≤ 9)
= 1 – 0.7041 = 0.2959
B1FT for mean (SOI)
M1 for probability from using tables to find 1 – P(X 9) ≤ A1 FT
3
(vi)
Mean no. of items in 1 hour = 360 × 1.62 = 583.2
Using Normal approx. to the Poisson,
X ~ N(583.2, 583.2):
P(X ≤ 550.5) = P 550.5 583.2583.2
Z −⎛ ≤⎜⎝ ⎠
⎞⎟
= P(Z ≤ -1.354) = 1 - Φ(1.354) = 1 – 0.9121
B1 for Normal approx. with correct parameters (SOI)
B1 for continuity corr. M1 for probability
4
PMT
= 0.0879 (3 s.f.)
using correct tail A1 CAO, (but FT wrong or omitted CC)
M1 for prob. with tables and correct tail A1 CAO (min 2 s.f.)
4
(ii) From tables Φ-1 ( 0.90 ) = 1.282
38.5 1.2824
x −= −
x = 38.5 – 1.282 × 4 = 33.37
So 33.4 should be quoted
B1 for 1.282 seen M1 for equation in x and negative z-value A1 CAO
3
(iii)
Y ~ N(51.2, σ2)
From tables Φ-1 ( 0.75 ) = 0.6745
55 51.2 0.6745σ−
=
3.8 = 0.6745 σ
σ = 5.63
B1 for 0.6745 seen M1 for equation in σ with z-value A1 NB answer given
3
(iv)
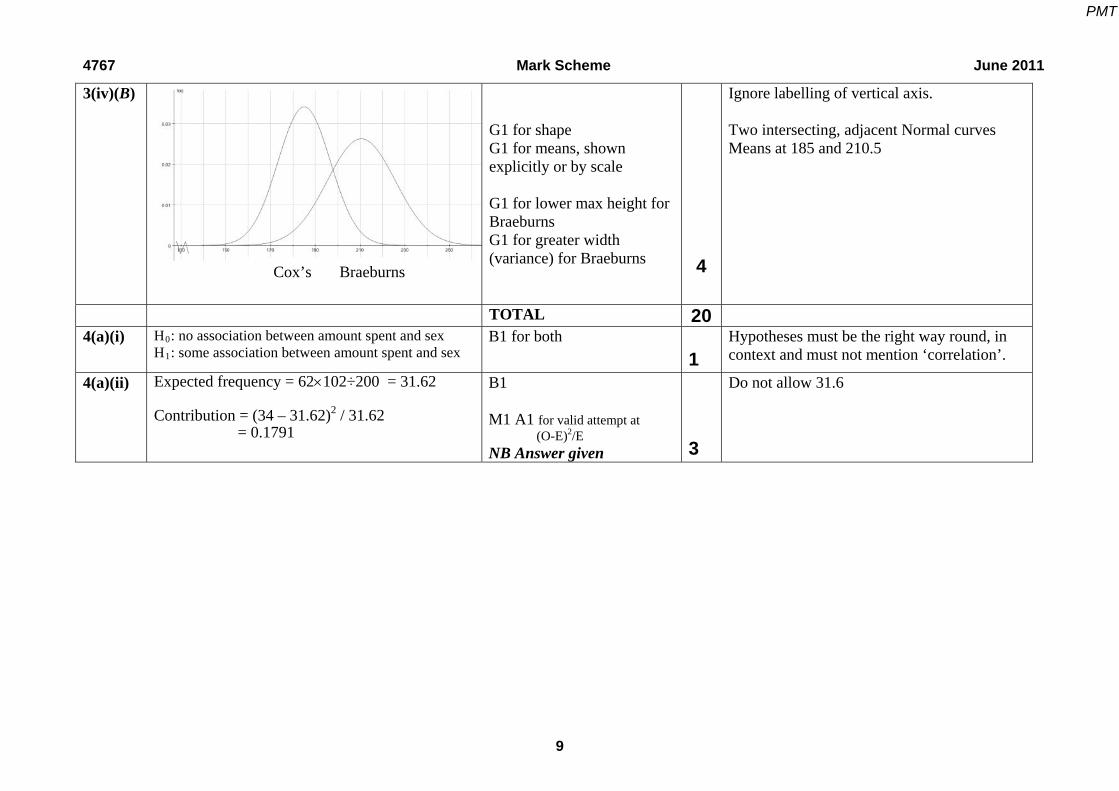
G1 for shape G1 for means, shown explicitly or by scale G1 for lower max height in diesel G1 for higher variance in diesel
4
(v)
P(Diesel > 45) = 45 51.2P5.63−⎛ ⎞>⎜ ⎟
⎝ ⎠Z
M1 for prob. calc. for diesel
PMT
= P( Z > -1.101) = Φ(1.101) = 0.8646 P(At least one over 45) = 1 – P(Both less than 45) = 1 - (1 - 0.0521) x (1 - 0.8646) = 1 - 0.9479 x 0.1354 = 0.8717 NB allow correct alternatives based on: P(D over, P under)+P(D under, P over)+ P(both over) or P(D over) + P(P over) – P(both over)
M1 for correct structure M1dep for correct probabilities A1 CAO (2 s.f. min)
4
18 Question 3 (i)
x = 4.5, y = 26.85
b = SxySxx
=2
983.6 36 214.8 / 8204 36 / 8− ×
− = 17
42 = 0.405
OR b = 2
983.6 / 8 4.5 26.85204 / 8 4.5
− ×
− = 2.125
5.25 = 0.405
hence least squares regression line is: y − y = b(x − x ) y – 26.85 = 0.405(x – 4.5) ⇒ y = 0.405x + 25.03 ⇒
B1 for x and y used
(SOI) M1 for attempt at
gradient (b) A1 for 0.405 cao M1 indep for equation
of line A1FT for complete equation
5
(ii) x = 4 ⇒ predicted y = 0.405 × 4 + 25.03 = 26.65 Residual = 27.5 – 26.65 = 0.85
M1 for prediction A1FT for ± 0.85 B1FT for sign (+)
3
(iii) The new equation would be preferable, since the equation in part (i) is influenced by the unrepresentative point (4,27.5)
B1 E1
2
(iv)
H0: ρ = 0; H1: ρ > 0 where ρ represents the population correlation coefficient
Critical value at 5% level is 0.3783
Since 0.209 < 0.3783, there is not sufficient evidence to reject H0, i.e. there is not sufficient evidence to conclude that there is any correlation between cycling and swimming times.
B1 for H0 and H1
B1 for defining ρ
B1 for 0.3783
M1 for comparison leading to conclusion A1dep on cv for conclusion in words
5
PMT
in context (v) Underlying distribution must be bivariate normal.
The distribution of points on the scatter diagram should be approximately elliptical.
B1 E1
2
17 Question 4 (a) (i)
H0: μ = 166500; H1: μ > 166500 Where μ denotes the mean selling price in pounds of the population of houses on the large estate
B1 for both correct B1 for definition of μ
2
(ii) n = 6, Σx = 1018500, x = £169750
Test statistic = 169750 166500 3250579714200 / 6
−=
= 0.5606 5% level 1 tailed critical value of z = 1.645 0.5606 < 1.645 so not significant. There is insufficient evidence to reject H0 It is reasonable to conclude that houses on this estate are not more expensive than in the rest of the suburbs.
B1CAO M1 must include √6 A1FT B1 for 1.645 M1 for comparison
leading to a conclusion
A1 for conclusion in
words in context
6
PMT
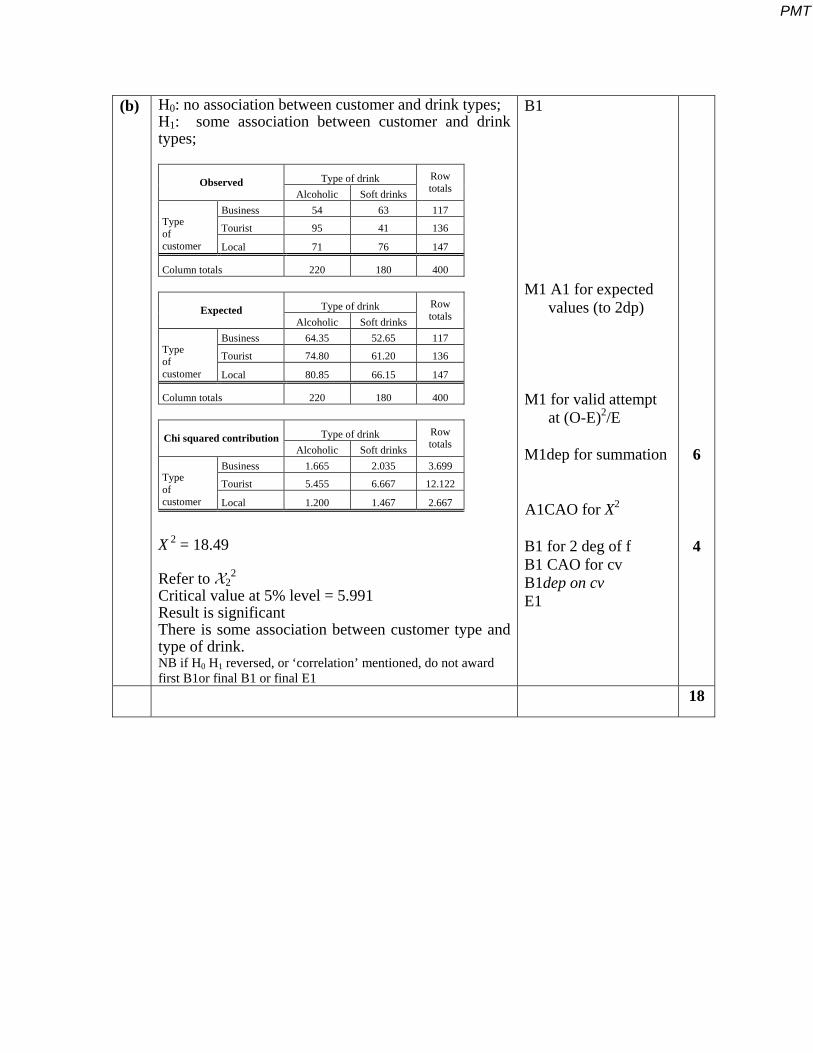
(b) H0: no association between customer and drink types; H1: some association between customer and drink types;
Type of drink Observed Alcoholic Soft drinks
Row totals
Business 54 63 117
Tourist 95 41 136 Type of customer Local 71 76 147
Column totals 220 180 400
Type of drink Expected Alcoholic Soft drinks
Row totals
Business 64.35 52.65 117
Tourist 74.80 61.20 136 Type of customer Local 80.85 66.15 147
Column totals 220 180 400
Type of drink Chi squared contribution Alcoholic Soft drinks
Row totals
Business 1.665 2.035 3.699
Tourist 5.455 6.667 12.122 Type of customer Local 1.200 1.467 2.667 X 2 = 18.49 Refer to X2
2 Critical value at 5% level = 5.991 Result is significant There is some association between customer type and type of drink. NB if H0 H1 reversed, or ‘correlation’ mentioned, do not award first B1or final B1 or final E1
B1 M1 A1 for expected
values (to 2dp) M1 for valid attempt
at (O-E)2/E M1dep for summation A1CAO for X2
B1 for 2 deg of f B1 CAO for cv B1dep on cv E1
6 4
18
PMT
4767 Mark Scheme January 2006 Question 1 (i)
Faults are detected randomly and independently
Uniform (mean) rate of occurrence
B1 B1
2
(ii) (A) P(X = 0) = e−0.15
00.150!
= 0.8607
(B) P(X ≥ 2) = 1 – 0.8607 – e−0.1510.15
1!
= 1 – 0.8607 – 0.1291 = 0.0102
M1 for probability
calc. M0 for tables unless
interpolated A1 M1 A1
4
(iii) λ = 30 × 0.15 = 4.5
Using tables: P(X ≤ 3) = 0.3423
B1 for mean (SOI)
M1 attempt to find
P(X ≤ 3)
A1
3
(iv) Poisson distribution with λ = 10 × (0.15 + 0.05) = 2
B1 for continuity corr. M1 for probability using correct tail A1 cao, (but FT wrong or omitted CC)
5
18
PMT
4767 Mark Scheme January 2006 Question 2 (i) (A)
X ~ N(42,32)
P(X > 50.0) = 50.0 42.0P3.0
Z −⎛ ⎞>⎜ ⎟⎝ ⎠
= P( Z > 2.667)
= 1 - Φ(2.667) = 1 – 0.9962 = 0.0038
M1 for standardizing M1 for prob. calc. with correct tail A1 NB answer given
3
(i) (B)
P( not positive) = 0.9962 P(At least one is out of 7 is positive) = 1 – 0.99627 = 1 – 0.9737 = 0.0263
B1 for use of 0.9962 in binomial expression M1 for correct method
A1 CAO
3
(i) (C)
If an innocent athlete is tested 7 times in a year there is a reasonable possibility (1 in 40 chance) of testing positive. Thus it is likely that a number of innocent athletes may come under suspicion and suffer a suspension so the penalty could be regarded as unfair. Or this is a necessary evil in the fight against performance enhancing drugs in sport.
E1 comment on their probability in (i) B E1 for sensible contextual conclusion consistent with first comment
2
(ii) (A)
B(1000, 0.0038)
B1 for B( , ) or Binomial B1 dep for both parameters
2
(ii) (B)
A suitable approximating distribution is Poisson(3.8)
P(at least 10 positive tests) = P(X ≥ 10) = 1 – P(X ≤ 9) = 1 – 0.9942 = 0.0058 NB Do not allow use of Normal approximation.
B1 for Poisson soi
B1FT dep for λ = 3.8
M1 for attempt to use
1 – P(X ≤ 9)
A1 FT
4
(iii) P( not testing positive) = 0.995 From tables z = Φ-1 ( 0.995 ) = 2.576
48.0 2.5762.0
h −=
h = 48.0 + 2.576 × 2.0 = 53.15
B1 for 0.995 seen (or implied by 2.576) B1 for 2.576 (FT their 0.995) M1 for equation in h and positive z-value A1 CAO
4
18
PMT
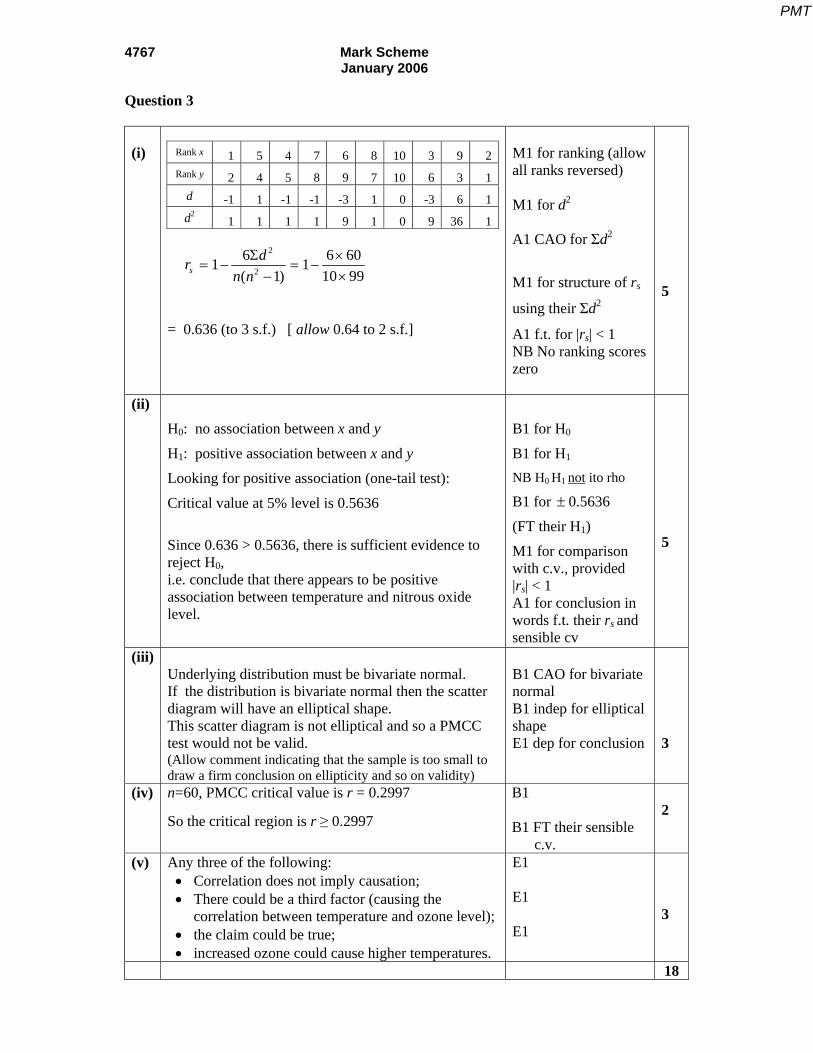
4767 Mark Scheme January 2006 Question 3 (i)
2
2
6 6 601 110 99( 1)s
drn n
Σ ×= − = −
×−
= 0.636 (to 3 s.f.) [ allow 0.64 to 2 s.f.]
M1 for ranking (allow all ranks reversed) M1 for d2 A1 CAO for Σd2
M1 for structure of rs
using their Σd2
A1 f.t. for |rs| < 1 NB No ranking scores zero
5
(ii)
H0: no association between x and y
H1: positive association between x and y
Looking for positive association (one-tail test):
Critical value at 5% level is 0.5636
Since 0.636 > 0.5636, there is sufficient evidence to reject H0, i.e. conclude that there appears to be positive association between temperature and nitrous oxide level.
B1 for H0
B1 for H1 NB H0 H1 not ito rho
B1 for ± 0.5636
(FT their H1)
M1 for comparison with c.v., provided |rs| < 1 A1 for conclusion in words f.t. their rs and sensible cv
5
(iii)
Underlying distribution must be bivariate normal. If the distribution is bivariate normal then the scatter diagram will have an elliptical shape. This scatter diagram is not elliptical and so a PMCC test would not be valid. (Allow comment indicating that the sample is too small to draw a firm conclusion on ellipticity and so on validity)
B1 CAO for bivariate normal B1 indep for elliptical shape E1 dep for conclusion
3
(iv) n=60, PMCC critical value is r = 0.2997
So the critical region is r ≥ 0.2997
B1 B1 FT their sensible
c.v.
2
(v)
Any three of the following: • Correlation does not imply causation; • There could be a third factor (causing the
correlation between temperature and ozone level); • the claim could be true; • increased ozone could cause higher temperatures.
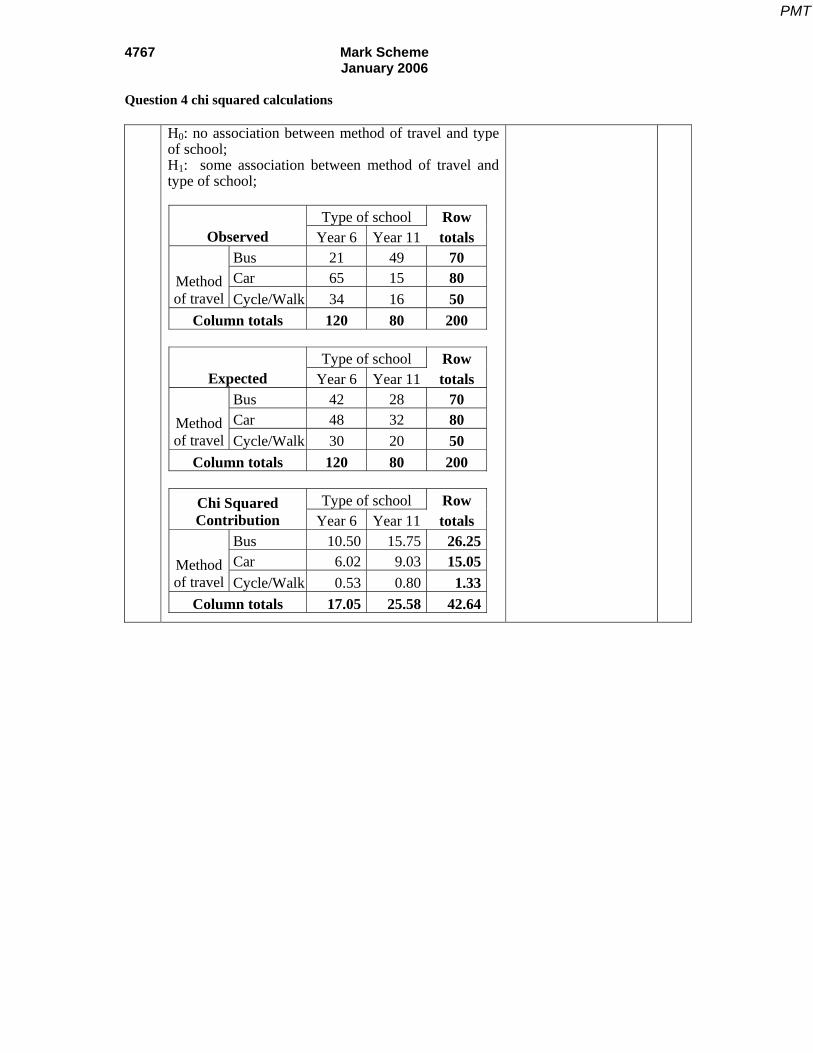
4767 Mark Scheme January 2006 Question 4 (i) H0: no association between method of travel and type
of school; H1: some association between method of travel and type of school;..
B1 for both 1
(ii) Expected frequency = 120/200 × 70 = 42 Contribution = (21 – 42)2 / 42 = 10.5
M1 A1 M1 for valid attempt
at (O-E)2/E A1 FT their 42
provided O = 21 (at least 1 dp)
4
(iii) X 2 = 42.64 Refer to X2
2 Critical value at 5% level = 5.991 Result is significant There appears to be some association between method of travel and year group. NB if H0 H1 reversed, or ‘correlation’ mentioned, do not award first B1or final E1
B1 for 2 deg of f(seen) B1 CAO for cv B1 for significant (FT
their c.v. provided consistent with their d.o.f.
E1
4
(iv)
H0: μ = 18.3; H1: μ ≠ 18.3 Where μ denotes the mean travel time by car for the whole population.
Test statistic z = 22.4 18.3 4.11.7898.0 / 20
−=
= 2.292 10% level 2 tailed critical value of z is 1.645 2.292 > 1.645 so significant. There is evidence to reject H0 It is reasonable to conclude that the mean travel time by car is different from that by bus.
B1 for both correct B1 for definition of μ M1 (standardizing
sample mean) A1 for test statistic B1 for 1.645 M1 for comparison leading to a conclusion A1 for conclusion in words and context
7
(v) The test suggests that students who travel by bus get to school more quickly. This may be due to their journeys being over a shorter distance. It may be due to bus lanes allowing buses to avoid congestion. It is possible that the test result was incorrect (ie implication of a Type I error). More investigation is needed before any firm conclusion can be reached.
E1, E1 for any two
valid comments
2 18
PMT
4767 Mark Scheme January 2006 Question 4 chi squared calculations H0: no association between method of travel and type
of school; H1: some association between method of travel and type of school;
= 0.1434 NB Allow full marks for use of N(12,12) as an approximation to Poisson(12) leading to 1 - Φ(1.010) = 1 – 0.8438 = 0.1562
B1 for correct continuity correction. M1 for probability using correct tail A1 cao, (but FT wrong or omitted CC)
3
(vi)
From tables Φ-1 ( 0.99 ) = 2.326
0.5 12 2.32610.8
x + −≥
x = 11.5 + 2.326 × 10.8 ≥ 19.14 So 20 breakfasts should be carried NB Allow full marks for use of N(12,12) leading to x ≥ 11.5 + 2.326 × 12 = 19.56
B1 for 2.326 seen M1 for equation in x and positive z-value A1 CAO (condone 19.64) A1FT for rounding appropriately (i.e. round up if c.c. used o/w rounding should be to nearest integer)
4
18
PMT
4767 Mark Scheme June 2006
Question 2 (i)
X ~ N(49.7,1.62)
(A) P(X > 51.5) = 51.5 49.7P
1.6Z −⎛ ⎞>⎜ ⎟
⎝ ⎠
= P( Z > 1.125)
= 1 - Φ(1.125) = 1 – 0.8696 = 0.1304
(B) P(X < 48.0) = 48.0 49.7P
1.6Z −⎛ ⎞<⎜ ⎟
⎝ ⎠
= P( Z < -1.0625) = 1 - Φ(1.0625)
= 1 – 0.8560 = 0.1440
P(48.0 < X < 51.5) = 1 - 0.1304 - 0.1440 = 0.7256
M1 for standardizing
M1 for prob. calc.
A1 (at least 2 s.f.) M1 for appropriate
prob’ calc.
A1 (0.725 – 0.726)
5
(ii) P(one over 51.5, three between 48.0 and 51.5)
= 41
⎛ ⎞⎜ ⎟⎝ ⎠
¬ 0.7256 ¬ 0.27443 = 0.0600
M1 for coefficient M1 for 0.7256 ¬ 0.27443 A1 FT (at least 2 sf)
3 (iii)
From tables,
Φ-1 ( 0.60 ) = 0.2533, Φ-1 ( 0.30 ) = -0.5244
49.0 = μ + 0.2533 σ
47.5 = μ – 0.5244 σ
1.5 = 0.7777 σ
σ = 1.929, μ = 48.51
B1 for 0.2533 or 0.5244 seen M1 for at least one correct equation μ & σ M1 for attempt to solve two correct equations A1 CAO for both
4
(iv)
Where μ denotes the mean circumference of the entire population of organically fed 3-year-old boys. n = 10,
Test statistic Z = 50.45 49.7 0.75 1.482
0.50601.6 / 10−
= =
10% level 1 tailed critical value of z is 1.282 1.482 > 1.282 so significant. There is sufficient evidence to reject H0 and conclude that organically fed 3-year-old boys have a higher mean head circumference.
E1 M1 A1(at least 3sf) B1 for 1.282 M1 for comparison
leading to a conclusion
A1 for conclusion in context
6 18
PMT
4767 Mark Scheme June 2006
Question 3 (i) EITHER:
Sxy = 1xy x yn
Σ − Σ Σ = 6235575 –1
10× 4715 × 13175
= 23562.5
Sxx = ( )22 1x xn
Σ − Σ = 2237725 – 1
10× 47152 =
14602.5
Syy = ( )22 1y yn
Σ − Σ = 17455825 – 1
10× 131752 =
97762.5
r = S
S Sxy
xx yy
= 23562.5
14602.5 97762.5× = 0.624
OR:
cov (x,y) = xy
x yn
−∑ = 6235575/10 – 471.5×1317.5
= 2356.25
rmsd(x) = xxSn
= √(14602.5/10) =√1460.25 = 38.21
rmsd(y) = yySn
= √(97762.5/10) =√9776.25 = 98.87
r = cov(x,y)( ) ( )rmsd x rmsd y
= 2356.25
38.21 98.87× = 0.624
M1 for method for Sxy M1 for method for at least one of Sxx or Syy A1 for at least one of Sxy , Sxx or Syy correct M1 for structure of r A1 (0.62 to 0.63) M1 for method for cov (x,y) M1 for method for at least one msd A1 for at least one of Sxy , Sxx or Syy correct M1 for structure of r A1 (0.62 to 0.63)
5
(ii) H0: ρ = 0 H1: ρ ≠ 0 (two-tailed test)
where ρ is the population correlation coefficient
For n = 10, 5% critical value = 0.6319 Since 0.624 < 0.6319 we cannot reject H0: There is not sufficient evidence at the 5% level to suggest that there is any correlation between length and circumference.
B1 for H0, H1 in symbols B1 for defining ρ
B1FT for critical value M1 for sensible comparison leading to a conclusion A1 FT for result B1 FT for conclusion
in context
6
(iii) (A) This is the probability of rejecting H0 when it is in fact true.
(B) Advantage of 1% level – less likely to reject H0 when it is true.
Disadvantage of 1% level – less likely to accept H1 when H0 is false.
B1 for ‘P(reject H0)’ B1 for ‘when true’ B1, B1 Accept
answers in context
2
2
PMT
4767 Mark Scheme June 2006
(iv) The student’s approach is not valid.
If a statistical procedure is repeated with a new sample, we should not simply ignore one of the two outcomes. The student could combine the two sets of data into a single set of twenty measurements.
E1 E1 – allow suitable
alternatives. E1 for combining
samples.
3 18
PMT
4767 Mark Scheme June 2006
Question 4
(i)
H0: no association between musical preference and age; H1: some association between musical preference and age;
2 Critical value at 5% level = 9.488 Result is significant There is some association between age group and musical preference. NB if H0 H1 reversed, or ‘correlation’ mentioned, do not award first B1or final E1
B1
M1 A2 for expected
values (at least 1
dp) (allow A1 for at
least one row or
column correct)
M1 for valid attempt at
(O-E)2/E A1 for all correct M1dep for summation A1 for X2 (27.7 – 27.8) B1 for 4 deg of f
B1 CAO for cv B1FT E1 (conclusion in
context)
1 7 4
PMT
4767 Mark Scheme June 2006
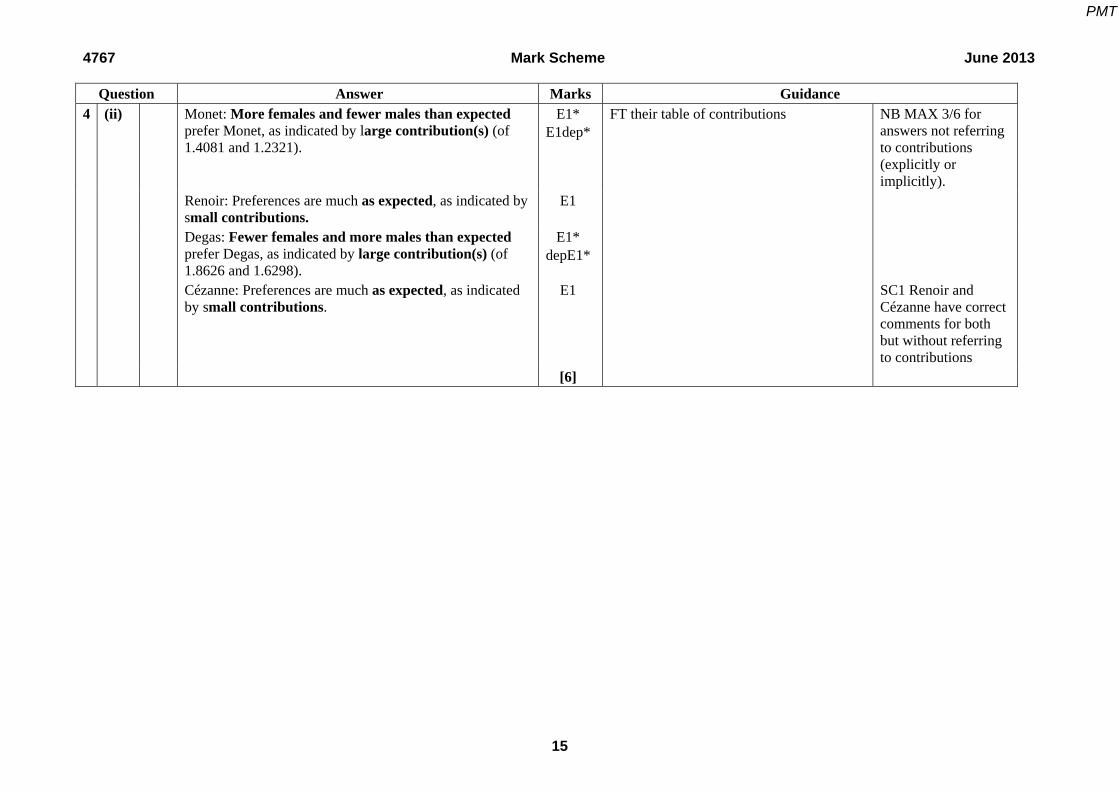
(ii) The values of 6.25 and 7.77 show that under 25’s have a strong positive association with pop whereas over 50’s have a strong negative association with pop. The values of 4.51 and 2.94 show that over 50’s have a reasonably strong positive association with both classical and jazz. The values of 2.70 and 3.30 show that under 25’s have a reasonably strong negative associations with both classical and jazz. The 25-50 group’s preferences differ very little from the overall preferences.
B1, B1 for specific reference to a value from the table of contributions followed by an appropriate comment B1, B1 (as above for
second value ) B1, B1 (as above for
third value)
6
18
PMT
4767 Mark Scheme Jan 2007
70
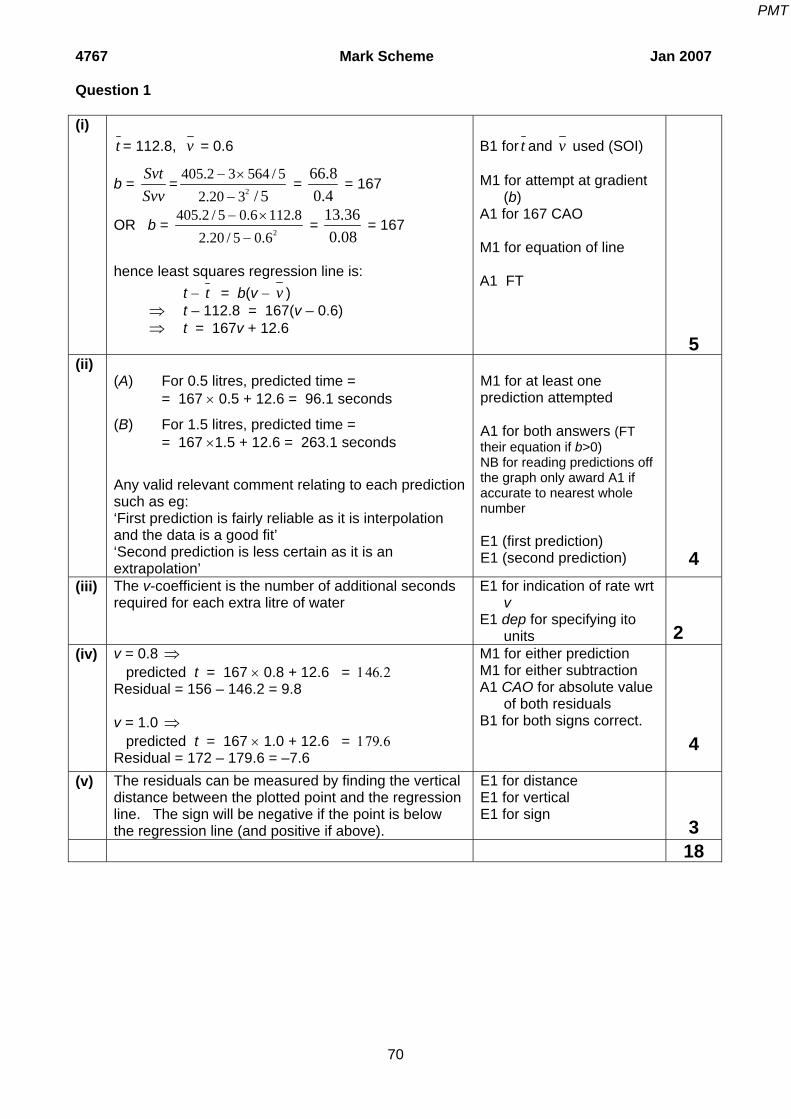
Question 1 (i)
t = 112.8, v = 0.6
b = SvtSvv
=2
405.2 3 564 / 52.20 3 / 5
− ×
− =
66.80.4
= 167
OR b = 2
405.2 / 5 0.6 112.82.20 / 5 0.6
− ×
− =
13.360.08
= 167
hence least squares regression line is: t − t = b(v − v ) ⇒ t – 112.8 = 167(v – 0.6) ⇒ t = 167v + 12.6
B1 for t and v used (SOI) M1 for attempt at gradient
(b) A1 for 167 CAO M1 for equation of line A1 FT
5 (ii)
(A) For 0.5 litres, predicted time = = 167 × 0.5 + 12.6 = 96.1 seconds
(B) For 1.5 litres, predicted time = = 167 ×1.5 + 12.6 = 263.1 seconds
Any valid relevant comment relating to each prediction such as eg: ‘First prediction is fairly reliable as it is interpolation and the data is a good fit’ ‘Second prediction is less certain as it is an extrapolation’
M1 for at least one prediction attempted A1 for both answers (FT their equation if b>0) NB for reading predictions off the graph only award A1 if accurate to nearest whole number E1 (first prediction) E1 (second prediction)
4
(iii) The v-coefficient is the number of additional seconds required for each extra litre of water
M1 for either prediction M1 for either subtraction A1 CAO for absolute value
of both residuals B1 for both signs correct.
4
(v) The residuals can be measured by finding the vertical distance between the plotted point and the regression line. The sign will be negative if the point is below the regression line (and positive if above).
M1 for prob. with tables and correct structure A1 CAO (min 3 s.f., to include use of difference column)
4 (ii) 25000 ×0.7357 ×0.1 = £1839
25000 ×0.1587 ×0.05 = £198
Total = £1839 + £198 = £2037
M1 for either product, (with or without price) M1 for sum of both products with price A1 CAO awrt £2040
3 (iii)
X ~ N(k, 16)
From tables Φ-1 ( 0.95 ) = 1.645
33 1.6454−
=k
33 – k = 1.645 × 4
k = 33 – 6.58
k = 26.42 (4 s.f.) or 26.4 (to 3 s.f.)
B1 for ±1.645 seen M1 for correct equation in k with positive z-value A1 CAO
3
(b) (i)
H0: μ = 0.155; H1: μ > 0.155 Where μ denotes the mean weight in kilograms of the population of onions of the new variety
B1 for both correct & ito μ B1 for definition of μ
2
(ii)
Mean weight = 4.77/25 = 0.1908
Test statistic = 01414.00358.0
25005.0155.01908.0
=−
= 2.531 1% level 1-tailed critical value of z = 2.326 2.531 > 2.236 so significant. There is sufficient evidence to reject H0 It is reasonable to conclude that the new variety has a higher mean weight.
B1 M1 must include √25 A1FT B1 for 2.326 M1 For sensible comparison leading to a conclusion A1 for correct, consistent conclusion in words and in context
6 18
PMT
4767 Mark Scheme Jan 2007
72
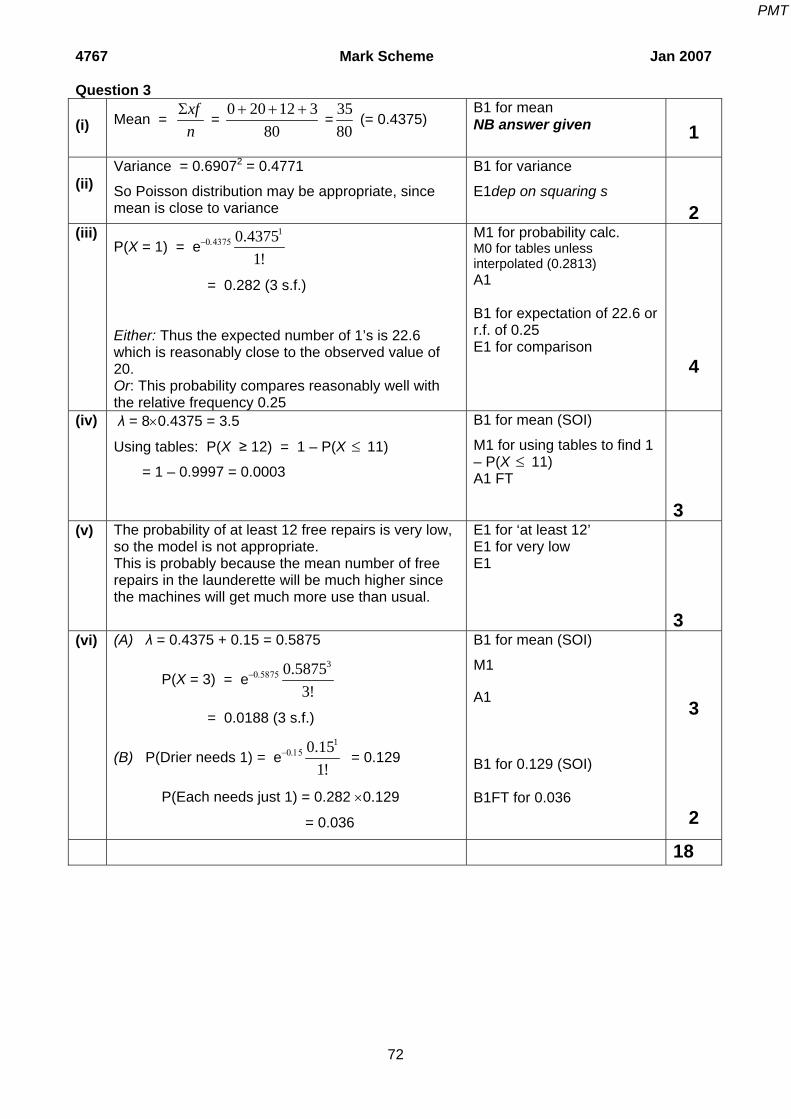
Question 3 (i) Mean =
xfn
Σ =
0 20 12 380
+ + + =
3580
(= 0.4375)
B1 for mean NB answer given
1
(ii)
Variance = 0.69072 = 0.4771
So Poisson distribution may be appropriate, since mean is close to variance
B1 for variance
E1dep on squaring s
2
(iii) P(X = 1) = e−0.4375
10.43751!
= 0.282 (3 s.f.)
Either: Thus the expected number of 1’s is 22.6 which is reasonably close to the observed value of 20. Or: This probability compares reasonably well with the relative frequency 0.25
M1 for probability calc. M0 for tables unless interpolated (0.2813) A1 B1 for expectation of 22.6 or r.f. of 0.25 E1 for comparison
4
(iv) λ = 8×0.4375 = 3.5
Using tables: P(X ≥ 12) = 1 – P(X ≤ 11)
= 1 – 0.9997 = 0.0003
B1 for mean (SOI)
M1 for using tables to find 1 – P(X ≤ 11) A1 FT
3
(v) The probability of at least 12 free repairs is very low, so the model is not appropriate. This is probably because the mean number of free repairs in the launderette will be much higher since the machines will get much more use than usual.
E1 for ‘at least 12’ E1 for very low E1
3 (vi) (A) λ = 0.4375 + 0.15 = 0.5875
P(X = 3) = e−0.587530.5875
3!
= 0.0188 (3 s.f.)
(B) P(Drier needs 1) = e−0.1510.15
1! = 0.129
P(Each needs just 1) = 0.282 ×0.129
= 0.036
B1 for mean (SOI)
M1 A1 B1 for 0.129 (SOI) B1FT for 0.036
3
2 18
PMT
4767 Mark Scheme Jan 2007
73
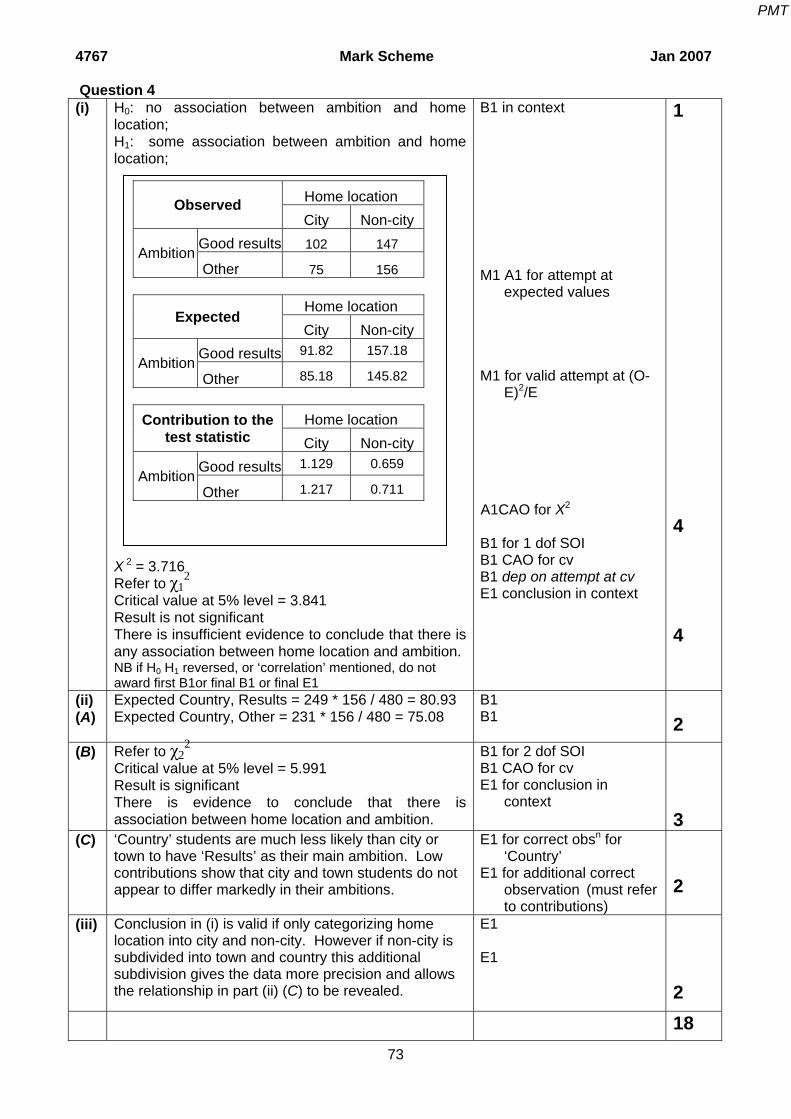
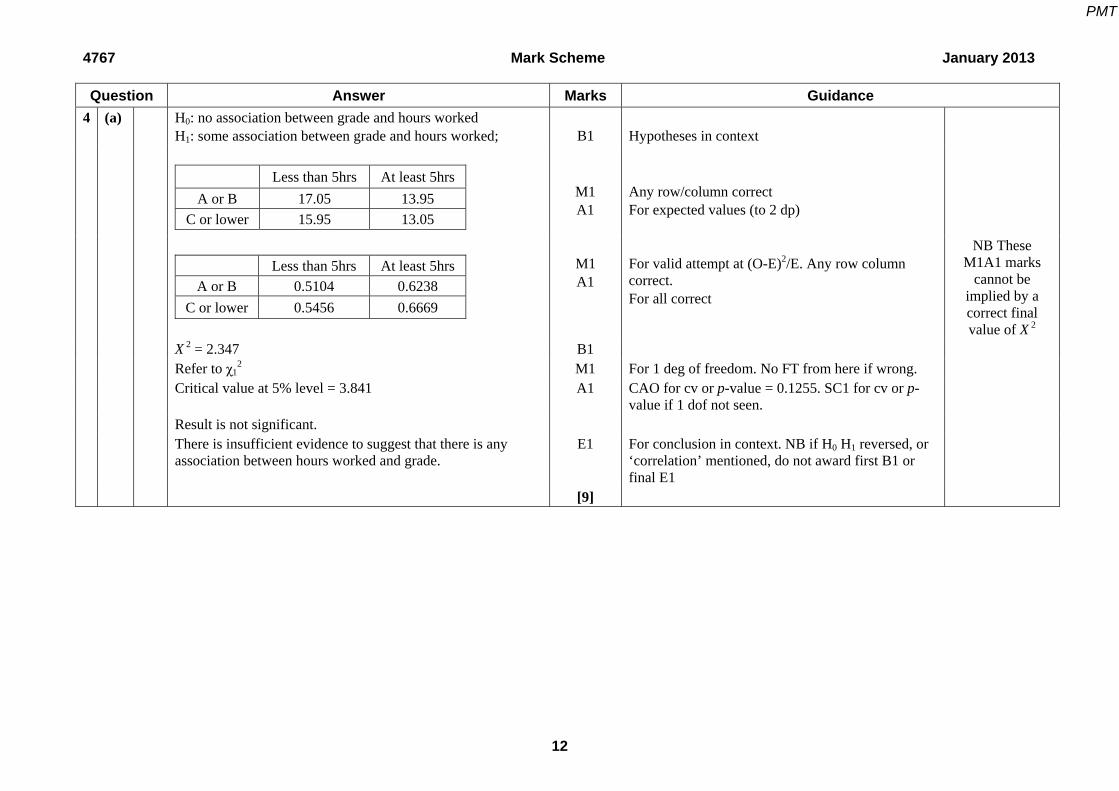
Question 4 (i) H0: no association between ambition and home
location; H1: some association between ambition and home location; X 2 = 3.716 Refer to χ1
2 Critical value at 5% level = 3.841 Result is not significant There is insufficient evidence to conclude that there is any association between home location and ambition. NB if H0 H1 reversed, or ‘correlation’ mentioned, do not award first B1or final B1 or final E1
B1 in context M1 A1 for attempt at
expected values M1 for valid attempt at (O-
E)2/E A1CAO for X2 B1 for 1 dof SOI B1 CAO for cv B1 dep on attempt at cv E1 conclusion in context
Critical value at 5% level = 5.991 Result is significant There is evidence to conclude that there is association between home location and ambition.
B1 for 2 dof SOI B1 CAO for cv E1 for conclusion in
context
3
(C) ‘Country’ students are much less likely than city or town to have ‘Results’ as their main ambition. Low contributions show that city and town students do not appear to differ markedly in their ambitions.
E1 for correct obsn for ‘Country’
E1 for additional correct observation (must refer to contributions)
2
(iii) Conclusion in (i) is valid if only categorizing home location into city and non-city. However if non-city is subdivided into town and country this additional subdivision gives the data more precision and allows the relationship in part (ii) (C) to be revealed.
E1 E1
2
18
Home location Observed City Non-city
Good results 102 147 Ambition Other 75 156
Home location
Expected City Non-city
Good results 91.82 157.18 Ambition
Other 85.18 145.82
Home location Contribution to the test statistic City Non-city
Good results 1.129 0.659 Ambition
Other 1.217 0.711
PMT
Question 1 (i)
X ~ N(11,32)
P(X < 10) = 10 11P
3−⎛ ⎞<⎜ ⎟
⎝ ⎠Z
= P( Z < –0.333)
= Φ(–0.333) = 1 – Φ(0.333) = 1 – 0.6304 = 0.3696
M1 for standardizing
M1 for use of tables with their z-value M1 dep for correct tail A1CAO (must include use of differences)
4
(ii) P(3 of 8 less than ten)
= 83⎛ ⎞⎜ ⎟⎝ ⎠
× 0.36963 × 0.63045 = 0.2815
M1 for coefficient M1 for 0.36963 × 0.63045 A1 FT (min 2sf)
M1 for Normal approximation with correct (FT) parameters B1 for continuity corr. M1 for standardizing and using correct tail A1 CAO (FT 50.5 or omitted CC)
4
(iv)
H0: μ = 11; H1: μ > 11 Where μ denotes the mean time taken by the new hairdresser
B1 for H0, as seen. B1 for H1, as seen. B1 for definition of μ
3
(v) Test statistic =
12.34 11 1.340.63/ 25
−=
= 2.23 5% level 1 tailed critical value of z = 1.645 2.23 > 1.645, so significant. There is sufficient evidence to reject H0 It is reasonable to conclude that the new hairdresser does take longer on average than other staff.
M1 must include √25 A1 (FT their μ)
B1 for 1.645 M1 for sensible comparison
leading to a conclusion A1 for conclusion in words
M1 for ranking (allow all ranks reversed) M1 for d2 A1 for Σd2 = 68
M1 for method for rs
A1 f.t. for |rs| < 1 NB No ranking scores zero
5
(ii)
H0: no association between x and y
H1: positive association between x and y
Looking for positive association (one–tail test): critical value at 5% level is 0.5636
Since 0.588> 0.5636, there is sufficient evidence to reject H0, i.e. conclude that there is positive association between true weight x and estimated weight y.
B1 for H0, in context.
B1 for H1, in context.
NB H0 H1 not ito ρB1 for ± 0.5636
M1 for sensible comparison with c.v., provided |rs| < 1 A1 for conclusion in words & in context, f.t. their rs and sensible cv
M1 for method for Sxy M1 for method for at least one of Sxx or Syy A1 for at least one of Sxy, Sxx, Syy correct. M1 for structure of r A1 (awrt 0.76)
5
(iv) Use of the PMCC is better since it takes into account not just the ranking but the actual value of the weights.Thus it has more information than Spearman’s and will therefore provide a more discriminatory test. Critical value for rho = 0.5494 PMCC is very highly significant whereas Spearman’s is only just significant.
E1 for has values, not just ranks E1 for contains more information Allow alternatives. B1 for a cv E1 dep
4
19
PMT
Question 3 (i)
(A) P(X = 1) = 0.1712 – 0.0408 = 0.1304
OR = e-3.213.2
1! = 0.1304
(B) P(X ≥ 6) = 1 – P(X ≤ 5) = 1 – 0.8946
= 0.1054
M1 for tables
A1 (2 s.f. WWW) M1 A1
4
(ii) (A) λ = 3.2 ÷ 5 = 0.64
P(X =1) = e-0.6410.64
1! = 0.3375
(B) P(exactly one in each of 5 mins) = 0.33755 = 0.004379
B1 for mean (SOI)
M1 for probability
A1 B1 (FT to at least 2 s.f.)
4
(iii)
Mean no. of calls in 1 hour = 12 × 3.2 = 38.4
Using Normal approx. to the Poisson,
X ~ N(38.4, 38.4)
P(X ≤ 45.5) = P45.5 38.4
38.4−⎛ ⎞≤⎜ ⎟
⎝ ⎠Z
= P(Z ≤ 1.146) = Φ(1.146) = 0.874 (3 s.f.)
B1 for Normal approx. with correct parameters (SOI)
B1 for continuity corr. M1 for probability using correct tail A1 CAO, (but FT 44.5 or omitted CC)
4
(iv)
(A) Suitable arguments for/against each assumption: (B) Suitable arguments for/against each assumption:
E1, E1 E1, E1
4
16
PMT
Question 4 (i) H0: no association between age group and sex;
H1: some association between age group and sex;
X 2 = 11.84 Refer to Ξ2
2 Critical value at 5% level = 5.991 Result is significant There is some association between age group and sex . NB if H0 H1 reversed, or ‘correlation’ mentioned, do not award first B1or final E1
Sex Expected Male Female
Row totals
Under 40 81.84 42.16 124
40 – 49 73.92 38.08 112 Age group
50 and over 42.24 21.76 64
Column totals 198 102 300
Sex
Contribution to test statistic
Male Female Under 40 1.713 3.325
40 – 49 0.059 0.114 Age group
50 and over 2.255 4.378
B1 (in context) M1 A1 for expected
values (to 2dp) M1 for valid attempt at
(O–E)2/E M1dep for summation A1CAO for X2
B1 for 2 deg of f B1 CAO for cv B1 dep on their cv & X2
E1 (conclusion in context)
6 4
(ii) The analysis suggests that there are more females in the under 40 age group and less in the 50 and over age group than would be expected if there were no association. The reverse is true for males. Thus these data do support the suggestion.
E1 E1 E1dep (on at least one of the previous E1s)
3
(iii) Binomial(300, 0.03) soi n = 300, p = 0.03 so EITHER: use Poisson approximation to Binomial with λ = np = 9 Using tables: P(X ≥ 12) = 1 – P(X ≤ 11)
= 1 – 0.8030 = 0.197
OR: use Normal approximation N(9, 8.73)
P(X > 11.5) = P11.5 9
8.73Z −⎛ ⎞>⎜ ⎟⎝ ⎠
= P(Z > 0.846)) = 1 – 0.8012 = 0.199
B1 CAO EITHER: B1 for Poisson B1dep for Poisson(9) M1 for using tables to find 1 – P(X ≤ 11) A1 OR: B1 for Normal B1dep for parameters M1 for using tables with correct tail (cc not required for M1) A1
5
18
PMT
4767 Mark Scheme January 2008
50
4767 Statistics 2
Question 1 (i)
x is independent, y is dependent since the values of x are chosen by the student but the values of y are dependent on x
B1 E1 dep E1 dep
3
(ii) x = 2.5, y = 80.63
b = SxxSxy
= 12/3090
12/6.967303.25302−
×−=
153.111
=7.42
OR b = 250.212/9063.8050.212/3.2530
−×−
= 25.1275.9
=7.42
Hence least squares regression line is: y - y = b(x - x ) ⇒ y – 80.63 =7.42(x – 2.5) ⇒ y = 7.42x + 62.08
B1 for x and y used (SOI) M1 for attempt at gradient (b) A1 for 7.42 cao M1 for equation of line A1 FT (b>0) for complete equation
5
(iii) (A) For x = 1.2, predicted growth = 7.42 × 1.2 + 62.08 = 71.0
(B) For x = 4.3, predicted growth = 7.42 × 4.3 + 62.08 = 94.0
Valid relevant comments relating to the predictions such as : Comment re interpolation/extrapolation Comment relating to the fact that x = 4.3 is only just beyond the existing data. Comment relating to size of residuals near each predicted value (need not use word ‘residual’)
M1 for at least one prediction attempted. A1 for both answers (FT their equation if b>0) E1 (first comment) E1 (second comment)
(v) This point is a long way from the regression line. The line may be valid for the range used in the experiment but then the relationship may break down for higher concentrations, or the relationship may be non linear.
E1 E1 for valid in range E1 for either ‘may break down’ or ‘could be non linear’ or other relevant
comment
3
18
PMT
4767 Mark Scheme January 2008
51
Question 2 (i) Binomial (94,0.1) B1 for binomial
B1 dep for parameters 2
(ii) n is large and p is small B1, B1 Allow appropriate numerical ranges
2
(iii) λ = 94 × 0.1 = 9.4
(A) P(X = 4) = e−9.4 !4
4.9 4
= 0.0269 (3 s.f.)
or from tables = 0.0429 − 0.0160 = 0.0269 cao (B) Using tables: P(X ≥ 4) = 1 − P(X ≤ 3)
= 1 − 0.0160 = 0.9840 cao
B1 for mean M1 for calculation or use of tables A1 M1 for attempt to find P(X ≥ 4) A1 cao
5
(iv) P(sufficient rooms throughout August) = 0.984031 = 0.6065
B1 for 0.8220 or 0.1780 B1 for 0.2743 or 0.7257 M1 for either product M1 for sum of both products A1 CAO
5
(iii)
0.00
0.01
0.02
0.03
0.04
0.05
0.06
0.07
30 35 40 45 50 55 60 65 70 75 80 85 90 95 100
G1 for shape G1 for means, shown explicitly or by scale G1 for lower max height in young adults G1 for greater variance in young adults
4
(iv)
Y ~ N(82,σ2) From tables Φ−1(0.88) = 1.175
σ8262 −
= −1.175
−20 = −1.175 σ σ = 17.0
B1 for 1.175 seen M1 for equation in σ with z-value M1 for correct handling of LH tail A1 cao
4
17
PMT
4767 Mark Scheme January 2008
53
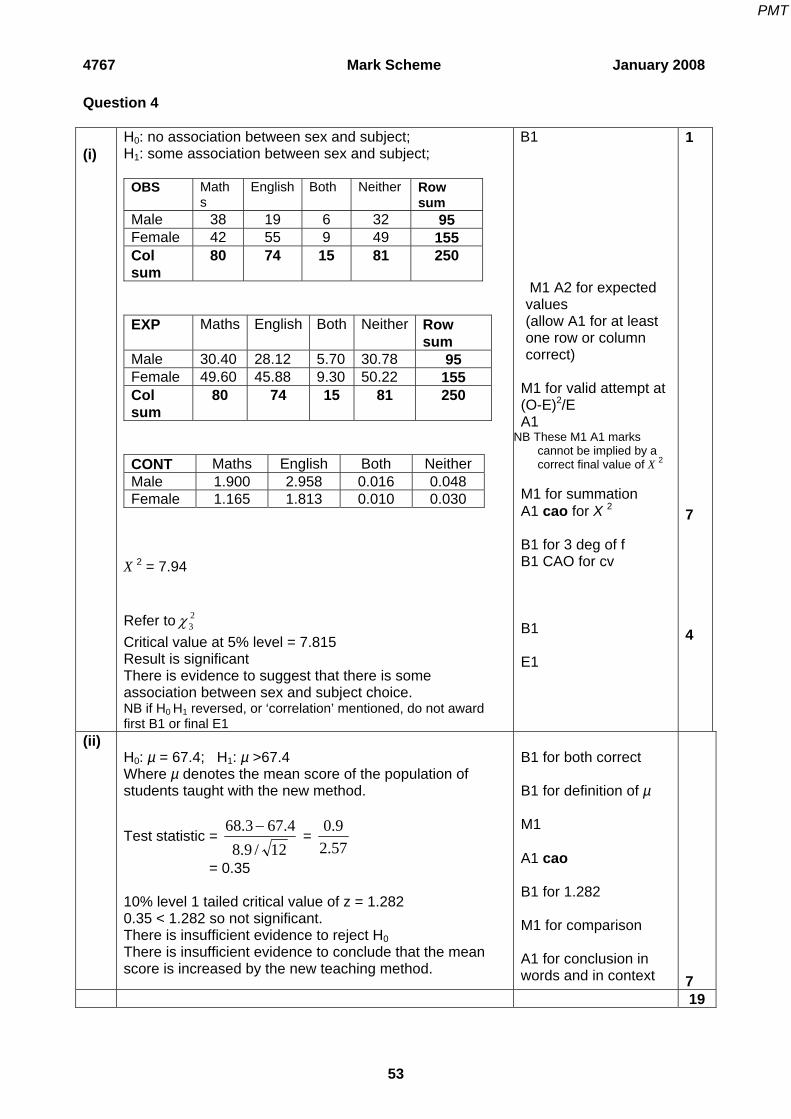
Question 4 (i)
H0: no association between sex and subject; H1: some association between sex and subject;
OBS Maths
English Both Neither Row sum
Male 38 19 6 32 95 Female 42 55 9 49 155 Col sum
80 74 15 81 250
EXP Maths English Both Neither Row
sum Male 30.40 28.12 5.70 30.78 95 Female 49.60 45.88 9.30 50.22 155 Col sum
80 74 15 81 250
CONT Maths English Both Neither Male 1.900 2.958 0.016 0.048 Female 1.165 1.813 0.010 0.030
X 2 = 7.94 Refer to 2
3χ Critical value at 5% level = 7.815 Result is significant There is evidence to suggest that there is some association between sex and subject choice. NB if H0 H1 reversed, or ‘correlation’ mentioned, do not award first B1 or final E1
B1 M1 A2 for expected values (allow A1 for at least one row or column correct)
M1 for valid attempt at (O-E)2/E A1
NB These M1 A1 marks cannot be implied by a correct final value of X 2
M1 for summation A1 cao for X 2 B1 for 3 deg of f B1 CAO for cv B1 E1
1 7 4
(ii) H0: µ = 67.4; H1: µ >67.4 Where µ denotes the mean score of the population of students taught with the new method.
Test statistic = 12/9.8
4.673.68 − =
57.29.0
= 0.35 10% level 1 tailed critical value of z = 1.282 0.35 < 1.282 so not significant. There is insufficient evidence to reject H0 There is insufficient evidence to conclude that the mean score is increased by the new teaching method.
B1 for both correct B1 for definition of µ M1 A1 cao B1 for 1.282 M1 for comparison A1 for conclusion in words and in context
7 19
PMT
4767 Mark Scheme June 2008
4767 Statistics 2 Question 1 (i) EITHER:
Sxy = 1xy xn
Σ − Σ Σy = 880.1 –148
× 781.3 × 57.8
= –60.72
Sxx = ( )22 1x xn
Σ − Σ = 14055 – 148
× 781.32 = 1337.7
Syy = ( )22 1yn
Σ − Σy = 106.3 – 148
× 57.82 = 36.70
r = S
S Sxy
xx yy
= 60.72
1337.7 36.70−
× = – 0.274
OR:
cov (x,y) = xy
x yn
−∑ = 880.1/48 – 16.28×1.204
= –1.265
rmsd(x) = xxSn
= √ (1337.7/48) =√ 27.87 = 5.279
rmsd(y) = yySn
= √ (36.70/48) =√ 0.7646 = 0.8744
r = cov(x,y)( ) ( )rmsd x rmsd y
= 1.265
5.279 0.8744−
× = – 0.274
M1 for method for Sxy M1 for method for at least one of Sxx or Syy A1 for at least one of Sxy, Sxx, Syy. correct M1 for structure of r A1 CAO (–0.27 to –0.28) M1 for method for cov (x,y) M1 for method for at least one msd A1 for at least one of cov/msd. correct M1 for structure of r A1 CAO (–0.27 to –0.28)
5
(ii) H0: ρ = 0 H1: ρ < 0 (one-tailed test)
where ρ is the population correlation coefficient
For n = 48, 5% critical value = 0.2403 Since | – 0.274 | > 0.2403 we can reject H0: There is sufficient evidence at the 5% level to suggest that there is negative correlation between education spending and population growth.
B1 for H0, H1 in symbols
B1 for defining ρ
B1FT for critical value M1 for sensible comparison leading to a conclusion A1 for result (FT r<0) E1 FT for conclusion in
words
6
(iii) Underlying distribution must be bivariate Normal. If the distribution is bivariate Normal then the scatter diagram will have an elliptical shape.
B1 CAO for bivariate Normal B1 indep for elliptical shape
2
(iv) • Correlation does not imply causation • There could be a third factor • increased growth could cause lower spending. Allow any sensible alternatives, including example of a possible third factor.
E1 E1 E1
3
(v)
Advantage – less effort or cost Disadvantage – the test is less sensitive (ie is less likely to detect any correlation which may exist)
E1 E1
2
18
67
PMT
4767 Mark Scheme June 2008
Question 2 (i) (A) P(X = 2) = e−0.37
20.372!
= 0.0473
(B) P(X > 2)
= 1 – (e−0.3720.37
2! + e−0.37
10.371!
+ e−0.3700.37
0!)
= 1 – (0.0473 + 0.2556 + 0.6907) = 0.0064
M1
A1 (2 s.f.) M1 for P(X = 1) and P(X = 0) M1 for complete method A1 NB Answer given
5
(ii) P(At most one day more than 2)
= × 0.993629 × 0.0064 + 0.993630 = 301
⎛ ⎞⎜ ⎟⎝ ⎠
= 0.1594 + 0.8248 = 0.9842
M1 for coefficient M1 for 0.993629 × 0.0064 M1 for 0.993630 A1 CAO (min 2sf)
4
(iii) λ = 0.37 ×10 = 3.7
P(X > 8) = 1 – 0.9863
= 0.0137
B1 for mean (SOI)
M1 for probability
A1 CAO
3
(iv)
Mean no. per 1000ml = 200 × 0.37 = 74 Using Normal approx. to the Poisson,
A1 for -0.625 M1 dep for correct tail A1CAO (must include use of differences)
4
(ii) P(7 of 10 last more than 25000)
= × 0.73407 × 0.26603 = 0.2592 107
⎛ ⎞⎜ ⎟⎝ ⎠
M1 for coefficient M1 for 0.73407 × 0.26603 A1 FT (min 2sf)
3
(iii) From tables Φ-1 ( 0.99 ) = 2.326
27500 2.3264000
−= −
k
x = 27500 – 2.326 × 4000 = 18200
B1 for 2.326 seen M1 for equation in k and negative z-value A1 CAO for awrt 18200
3
(iv)
H0: μ = 27500; H1: μ > 27500 Where μ denotes the mean lifetime of the new tyres.
B1 for use of 27500 B1 for both correct B1 for definition of μ
3
(v) Test statistic =
28630 27500 11301032.84000 / 15
−=
= 1.094 5% level 1 tailed critical value of z = 1.645 1.094 < 1.645 so not significant. There is not sufficient evidence to reject H0 There is insufficient evidence to conclude that the new tyres last longer.
M1 must include √ 15 A1 FT B1 for 1.645 M1 dep for a sensible
comparison leading to a conclusion
A1 for conclusion in words
in context
5
18
69
PMT
4767 Mark Scheme June 2008
70
Question 4 (i) H0: no association between location and species.
H1: some association between location and species. B1 for both
1
(ii) Expected frequency = 38/160 × 42 = 9.975 Contribution = (3 – 9.975)2 / 9.975 = 4.8773
M1 A1 M1 for valid attempt at (O-E)2/E A1 NB Answer given
4
(iii) Refer to 2
4χCritical value at 5% level = 9.488 Test statistic X 2 = 32.85 Result is significant There appears to be some association between location and species NB if H0 H1 reversed, or ‘correlation’ mentioned, do not award first B1or final E1
B1 for 4 deg of f(seen) B1 CAO for cv M1 Sensible comparison,
using 32.85, leading to a conclusion
A1 for correct conclusion (FT their c.v.)
E1 conclusion in context
5
(iv)
• Limpets appear to be distributed as expected
throughout all locations. • Mussels are much more frequent in exposed
locations and much less in pools than expected.
• Other shellfish are less frequent in exposed locations and more frequent in pools than expected.
E1 E1, E1 E1, E1
5
(v) 24 32 16 0.084953 65 42
× × =
M1 for one fraction M1 for product of all 3 A1 CAO
M1 for attempt at ranking (allow all ranks reversed) M1 for d2 A1 for Σd2 = 12 M1 for method for rs
A1 f.t. for |rs| < 1 NB No ranking scores zero
5
(ii)
H0: no association between X and Y in the population
H1: some association between X and Y in the population
Two tail test critical value at 5% level is 0.7381
Since 0.857> 0. 7381, there is sufficient evidence to reject H0, i.e. conclude that the evidence suggests that there is association between population size X and average walking speed Y.
B1 for H0
B1 for H1
B1 for population SOI
NB H0 H1 not ito ρ B1 for ± 0. 7381
M1 for sensible comparison with c.v., provided |rs| < 1 A1 for conclusion in words f.t. their rs and sensible cv
6
(iii)
t = 45, w = 2.2367
b = StwStt
=2
584.6 270 13.42 / 613900 270 / 6
− ×
− =
17503.19−
= -0.011
OR b = 2
584.6 / 6 45 2.236713900 / 6 45
− ×
− =
3.218291.6667−
= -0.011
hence least squares regression line is:
73.2011.0
)45(011.02367.2)(
+−=⇒−−=−⇒
−=−
twtw
ttbww
B1 for t and w used
(SOI) M1 for attempt at
gradient (b) A1 CAO for -0.011 M1 for equation of line A1 FT for complete equation
5
PMT
4767 Mark Scheme January 2009
55
(iv)
(A) For t = 80, predicted speed = -0.011 × 80 + 2.73 = 1.85
(B) The relationship relates to adults, but a ten year old will not be fully grown so may walk more slowly.
NB Allow E1 for comment about extrapolation not in context
M1 A1 FT provided b < 0 E1 extrapolation o.e. E1 sensible contextual comment
4
TOTAL 20 Question 2 (i)
Binomial(5000,0.0001)
B1 for binomial B1 dep, for parameters
2
(ii) n is large and p is small
λ = 5000 × 0.0001 = 0.5
B1, B1 (Allow appropriate numerical ranges) B1
3
(iii)
P(X ≥ 1) = 1 – e�00.5
0! = 1 – 0.6065 = 0.3935
or from tables = 1 – 0.6065 = 0.3935
M1 for correct calculation or correct use of tables A1
2
(iv) P(9 of 20 contain at least one)
= 209
⎛ ⎞⎜ ⎟⎝ ⎠
× 0.39359 × 0.606511
= 0.1552
M1 for coefficient M1 for p9 × (1 – p) 11, p from part (iii) A1
3
(v) Expected number = 20 × 0.3935 = 7.87 M1 A1 FT 2 (vi)
Mean = xfn
Σ =
7 420+
=1120
= 0.55
Variance = ( )2211
fx nxn
Σ −−
= ( )21 15 20 0.5519
− × = 0.471
B1 for mean
M1 for calculation
A1 CAO
3
(vii) Yes, since the mean is close to the variance,
and also as the expected frequency for ‘at least one’, i.e. 7.87,
is close to the observed frequency of 9.
B1 E1 for sensible comparison B1 for observed frequency = 7 + 2 = 9
A1 CAO (min 3 sf, to include use of difference column) M1 for standardizing both 100 & 110 M1 for correct structure in calcn
A1 CAO B1 for ±1.282 seen M1 for equation in k and negative z-value A1 CAO
3
3
3 (ii)
From tables,
Φ-1 ( 0.70 ) = 0.5244, Φ-1 ( 0.15 ) = – 1.036
180 = μ + 0.5244 σ
140 = μ – 1.036 σ
40 = 1.5604 σ
σ = 25.63, μ = 166.55
B1 for 0.5244 or ±1.036 seen M1 for at least one equation in μ and σ and Φ-1 value M1 dep for attempt to solve two equations A1 CAO for both
4 (iii) Φ-1 ( 0.975 ) = 1.96
a = 166.55 – 1.96 × 25.63 = 116.3
b = 166.55 + 1.96 × 25.63 = 216.8
B1 for ±1.96 seen M1 for either equation A1 A1 [Allow other correct intervals]
4
TOTAL 17
PMT
4767 Mark Scheme January 2009
57
Question 4 (i)
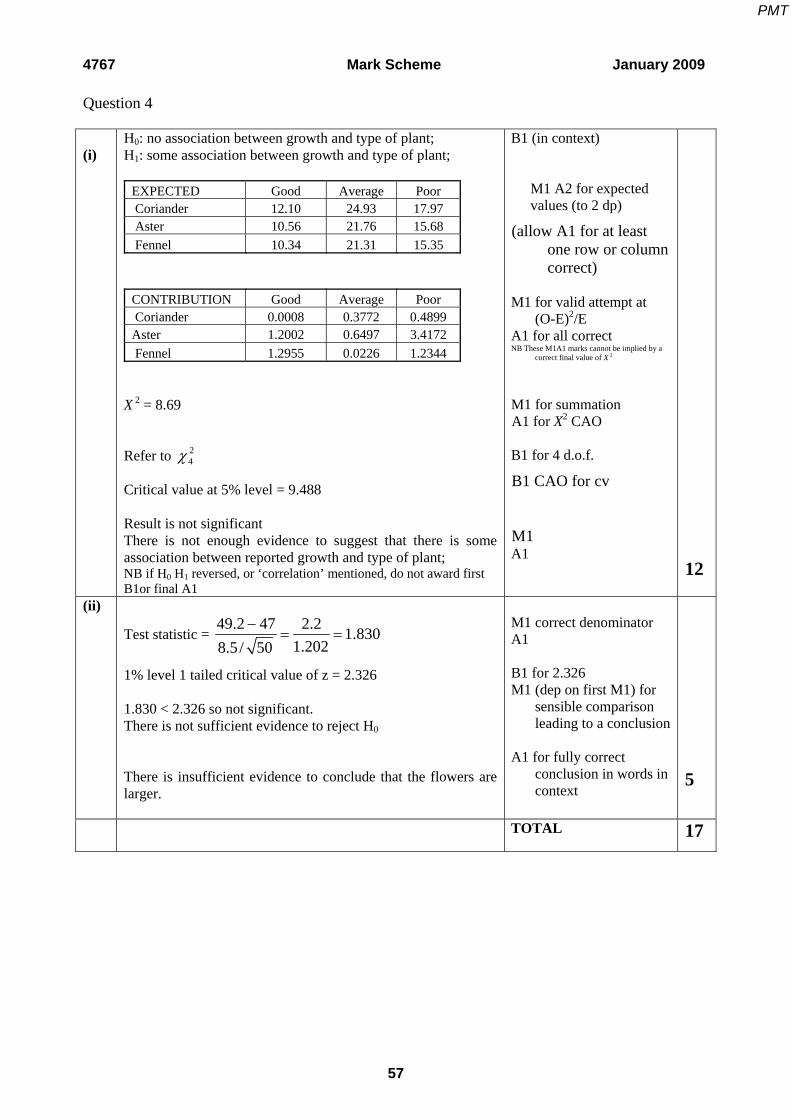
H0: no association between growth and type of plant; H1: some association between growth and type of plant;
EXPECTED Good Average Poor Coriander 12.10 24.93 17.97 Aster 10.56 21.76 15.68 Fennel 10.34 21.31 15.35 CONTRIBUTION Good Average Poor Coriander 0.0008 0.3772 0.4899 Aster 1.2002 0.6497 3.4172 Fennel 1.2955 0.0226 1.2344
X 2 = 8.69 Refer to 2
4χ Critical value at 5% level = 9.488 Result is not significant There is not enough evidence to suggest that there is some association between reported growth and type of plant; NB if H0 H1 reversed, or ‘correlation’ mentioned, do not award first B1or final A1
B1 (in context)
M1 A2 for expected values (to 2 dp)
(allow A1 for at least one row or column correct)
M1 for valid attempt at
(O-E)2/E A1 for all correct NB These M1A1 marks cannot be implied by a
correct final value of X 2
M1 for summation A1 for X2 CAO B1 for 4 d.o.f.
B1 CAO for cv M1 A1
12
(ii)
Test statistic = 49.2 47 2.2 1.830
1.2028.5/ 50−
= =
1% level 1 tailed critical value of z = 2.326 1.830 < 2.326 so not significant. There is not sufficient evidence to reject H0 There is insufficient evidence to conclude that the flowers are larger.
M1 correct denominator A1 B1 for 2.326 M1 (dep on first M1) for
sensible comparison leading to a conclusion
A1 for fully correct
conclusion in words in context
5
TOTAL 17
PMT
4767 Mark Scheme June 2009
71
4767 Statistics 2
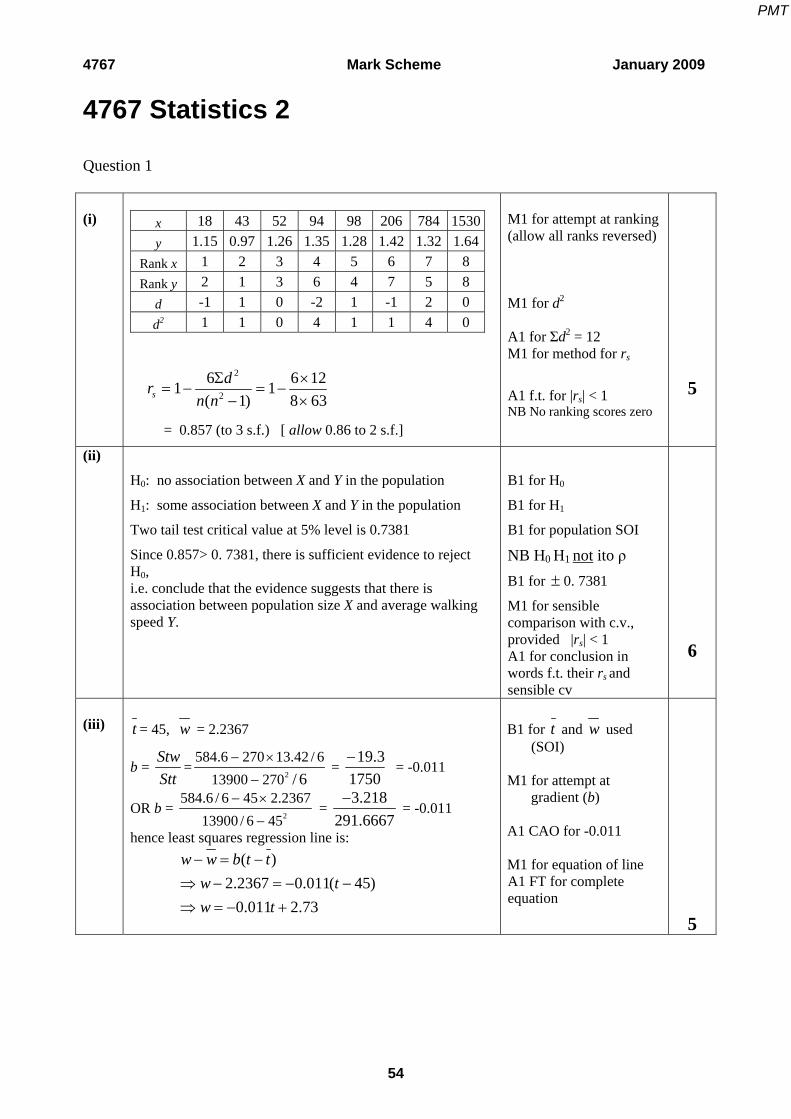
Question 1 (i) EITHER:
Sxy = 1xy x yn
Σ − Σ Σ = 316345 – 150
× 2331.3 × 6724.3
= 2817.8
Sxx = ( )22 1x x
nΣ − Σ = 111984 – 1
50× 2331.32 = 3284.8
Syy = ( )22 1y y
nΣ − Σ = 921361 – 1
50× 6724.32 = 17036.8
r = S
S Sxy
xx yy
= 2817.8
3284.8 17036.8× = 0.377
OR:
cov (x,y) = xy
x yn
−∑ = 316345/50 – 46.626 × 134.486
= 56.356
rmsd(x) = xxSn
= √(3284.8/50) =√65.696 = 8.105
rmsd(y) = yySn
= √(17036.8/50) =√340.736 = 18.459
r = cov(x,y)( ) ( )rmsd x rmsd y
= 56.356
8.105 18.459× = 0.377
M1 for method for Sxy M1 for method for at least one of Sxx or Syy A1 for at least one of Sxy, Sxx or Syy correct M1 for structure of r A1 (AWRT 0.38) M1 for method for cov (x,y) M1 for method for at least one msd A1 for at least on of cov(x,y), rmsd(x) or rmsd(y) correct M1 for structure of r A1 (AWRT 0.38)
5
(ii) H0: ρ = 0 H1: ρ ≠ 0 (two-tailed test)
where ρ is the population correlation coefficient
For n = 50, 5% critical value = 0.2787 Since 0.377 > 0.2787 we can reject H0: There is sufficient evidence at the 5% level to suggest that there is correlation between oil price and share cost
B1 for H0, H1 in symbols B1 for defining ρ
B1FT for critical value M1 for sensible comparison leading to a conclusion A1 for result
1 B1 FT for conclusion in context
6
(iii) Population The scatter diagram has a roughly elliptical shape, hence the assumption is justified.
B1 B1 elliptical shape E1 conclusion
3
(iv) Because the alternative hypothesis should be decided without referring to the sample data and there is no suggestion that the correlation should be positive rather than negative.
E1 E1
2
TOTAL 16
PMT
4767 Mark Scheme June 2009
72
Question 2 (i)
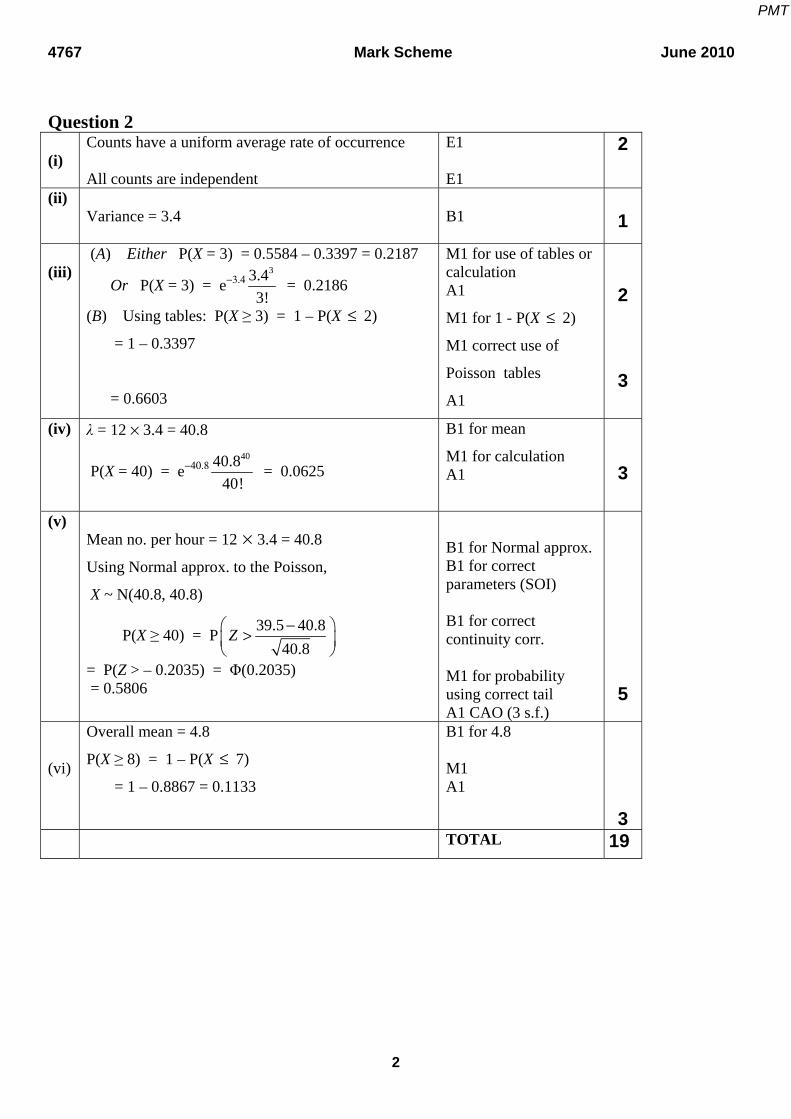
Meteors are seen randomly and independently
There is a uniform (mean) rate of occurrence of meteor sightings
B1 B1
2
(ii)
(A) Either P(X = 1) = 0.6268 – 0.2725 = 0.3543
Or P(X = 1) = e �11.3
1! = 0.3543
(B) Using tables: P(X ≥ 4) = 1 – P(X ≤ 3)
= 1 – 0.9569
= 0.0431
M1 for appropriate use of tables or calculation A1
M1 for appropriate
probability calculation
A1
4
(iii)
λ = 10 × 1.3 = 13
P(X = 10) = e �1013
10! = 0.0859
B1 for mean
M1 for calculation A1 CAO
3
(iv)
Mean no. per hour = 60 × 1.3 = 78 Normal approx. to the Poisson, X ~ N(78, 78)
B1 for Normal approx. B1 for correct parameters (SOI) B1 for continuity corr. M1 for correct Normal probability calculation using correct tail A1 CAO, (but FT wrong or omitted CC)
5
(v) Either
P(At least one) = 1 - e λ 0
0!λ
= 1 - e λ ≥ 0.99
eλ ≤ 0.01
–λ ≤ ln 0.01, so λ ≥ 4.605
1.3 t ≥ 4.605, so t ≥ 3.54
Answer t = 4
Or
t = 1, λ = 1.3, P(At least one) = 1 - e 1.3 = 0.7275
t = 2, λ = 2.6, P(At least one) = 1 - e 2.6 = 0.9257
t = 3, λ = 3.9, P(At least one) = 1 - e 3.9 = 0.9798
t = 4, λ = 5.2, P(At least one) = 1 - e 5.2 = 0.9944
Answer t = 4
M1 formation of equation/inequality using P(X ≥ 1) = 1 – P(X = 0) with Poisson distribution. A1 for correct equation/inequality M1 for logs A1 for 3.54 A1 for t (correctly justified) M1 at least one trial with any value of t A1 correct probability. M1 trial with either t = 3 or t = 4 A1 correct probability of t = 3 and t = 4 A1 for t
B1 B1 B1 for correct continuity corr. M1 for correct Normal probability calculation using correct tail A1 CAO, (but FT wrong or omitted CC)
5
(iv)
H0: μ = 1720; H1 is of this form since the consumer organisation suspects that the mean is below 1720 μ denotes the mean intensity of 25 Watt low energy bulbs made by this manufacturer.
B1 E1 B1 for definition of μ
3
(v) Test statistic =
1703 1720 1720.1290 / 20
− −=
= – 0.8447 Lower 5% level 1 tailed critical value of z = – 1.645 – 0.8447 > – 1.645 so not significant. There is not sufficient evidence to reject H0 There is insufficient evidence to conclude that the mean intensity of bulbs made by this manufacturer is less than 1720
M1 must include √20 A1FT B1 for –1.645 No FT
from here if wrong. Must be –1.645 unless it is clear that absolute values are being used. M1 for sensible comparison leading to a conclusion. FT only candidate’s test statistic A1 for conclusion in words in context
5
TOTAL 20
PMT
4767 Mark Scheme June 2009
74
Question 4 (i)
H0: no association between type of car and sex; H1: some association between type of car and sex; EXPECTED Male Female Hatchback 83.16 48.84 Saloon 70.56 41.44 People carrier 51.66 30.34 4WD 17.01 9.99 Sports car 29.61 17.39 CONTRIBUTION Male Female Hatchback 1.98 3.38 Saloon 0.59 1.00 People carrier 3.61 6.15 4WD 0.23 0.40 Sports car 1.96 3.33
X2 = 22.62 Refer to X4
2 Critical value at 5% level = 9.488 22.62 > 9.488 Result is significant There is evidence to suggest that there is some association between sex and type of car. NB if H0 H1 reversed, or ‘correlation’ mentioned, do not award first B1or final A1
B1
M1 A2 for expected
values (to 2 dp)
(allow A1 for at least one row or column correct)
M1 for valid attempt at
(O-E)2/E A1 for all correct NB These M1A1 marks
cannot be implied by a correct final value of X 2
M1 for summation A1 for X2 CAO B1 for 4 deg of f
B1 CAO for cv M1 sensible comparison leading to a conclusion A1
12
(ii)
• In hatchbacks, male drivers are more frequent
than expected. • In saloons, male drivers are slightly more frequent
than expected. • In people carriers, female drivers are much more
frequent than expected. • In 4WDs the numbers are roughly as expected • In sports cars, female drivers are more frequent
than expected.
E1 E1 E1 E1 E1
5
TOTAL 17
Deleted: 
PMT
4767 Mark Scheme January 2010
50
4767 Statistics 2 1 (i)
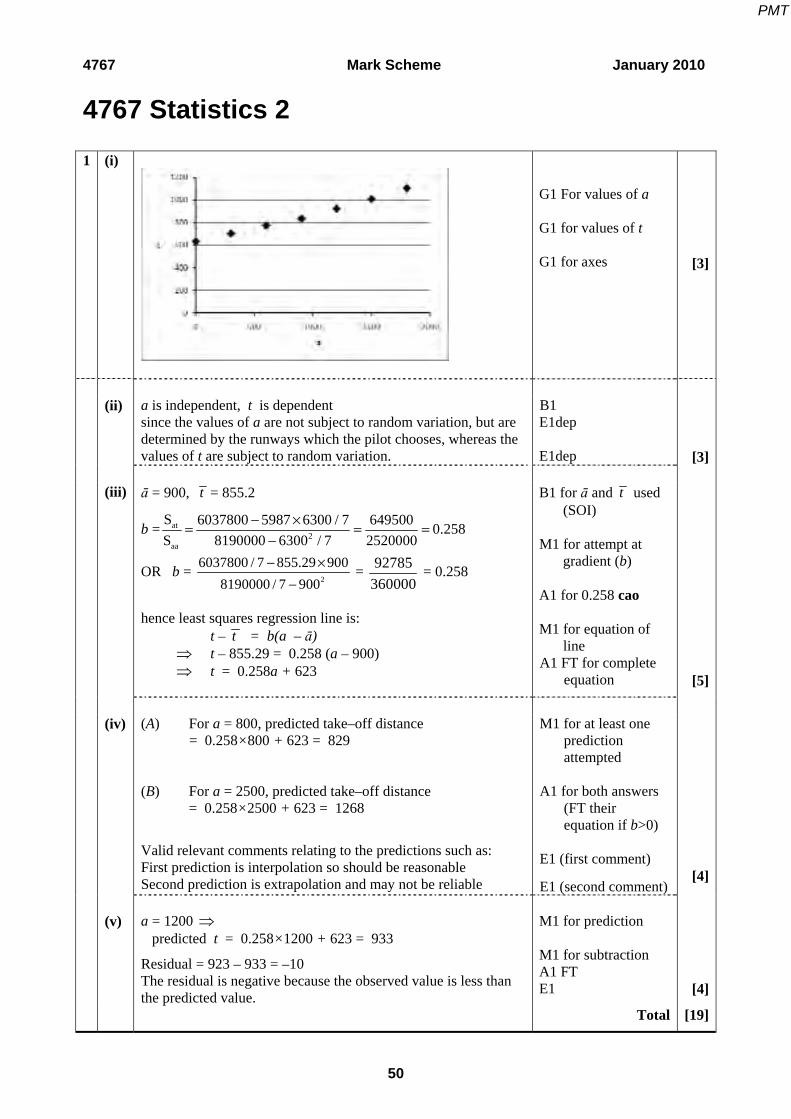
G1 For values of a G1 for values of t G1 for axes [3]
(ii) a is independent, t is dependent
since the values of a are not subject to random variation, but are determined by the runways which the pilot chooses, whereas the values of t are subject to random variation.
hence least squares regression line is: t – t = b(a – ā) t – 855.29 = 0.258 (a – 900) t = 0.258a + 623
B1 for ā and t used (SOI)
M1 for attempt at
gradient (b) A1 for 0.258 cao M1 for equation of
line A1 FT for complete
equation [5]
(iv) (A) For a = 800, predicted take–off distance
= 0.258×800 + 623 = 829 (B) For a = 2500, predicted take–off distance = 0.258×2500 + 623 = 1268
Valid relevant comments relating to the predictions such as: First prediction is interpolation so should be reasonable Second prediction is extrapolation and may not be reliable
M1 for at least one prediction attempted
A1 for both answers
(FT their equation if b>0)
E1 (first comment)
E1 (second comment)
[4]
(v) a = 1200
predicted t = 0.258×1200 + 623 = 933
Residual = 923 – 933 = –10 The residual is negative because the observed value is less than the predicted value.
M1 for prediction M1 for subtraction A1 FT E1
[4]
Total [19]
PMT
4767 Mark Scheme January 2010
51
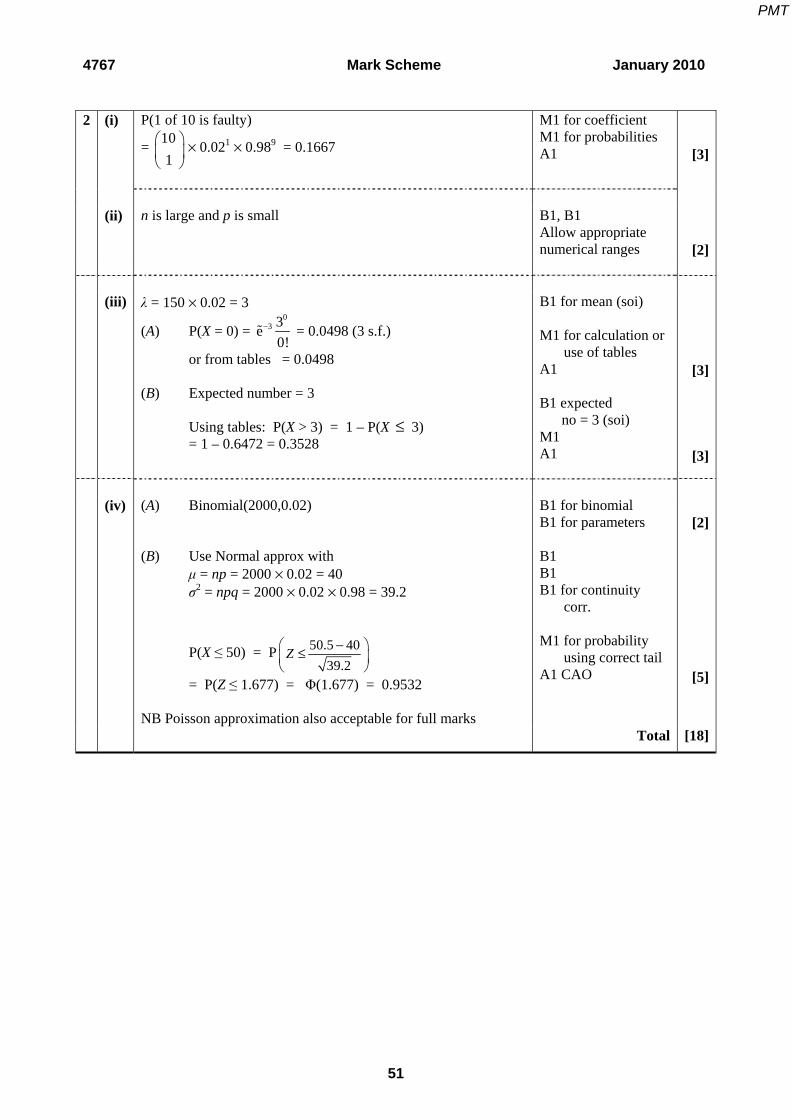
2 (i) P(1 of 10 is faulty)
= 101
× 0.021 × 0.989 = 0.1667
M1 for coefficient M1 for probabilities A1 [3]
(ii) n is large and p is small B1, B1
Allow appropriate numerical ranges [2]
(iii) λ = 150 × 0.02 = 3
(A) P(X = 0) = 0
3 3e0!
− = 0.0498 (3 s.f.)
or from tables = 0.0498 (B) Expected number = 3 Using tables: P(X > 3) = 1 – P(X ≤ 3) = 1 – 0.6472 = 0.3528
B1 for mean (soi) M1 for calculation or
use of tables A1 B1 expected no = 3 (soi) M1 A1
[3]
[3]
(iv) (A) Binomial(2000,0.02)
(B) Use Normal approx with μ = np = 2000 × 0.02 = 40 σ2 = npq = 2000 × 0.02 × 0.98 = 39.2
P(X ≤ 50) = P 50.5 4039.2
Z − ≤
= P(Z ≤ 1.677) = Φ(1.677) = 0.9532 NB Poisson approximation also acceptable for full marks
B1 for binomial B1 for parameters B1 B1 B1 for continuity
corr. M1 for probability
using correct tail A1 CAO
[2]
[5]
Total [18]
PMT
4767 Mark Scheme January 2010
52
3 (i)
(A) P(X < 50)
= 50 45.3P11.5
Z − <
= P( Z < 0.4087) = Φ(0.4087)
= 0.6585
(B) P( 45.3 < X < 50) = 0.6585 – 0.5
=0.1585
M1 for standardising M1 for correct structure of probability calc’ A1 CAO inc use of diff
tables NB When a candidate’s answers suggest that (s)he appears to have neglected to use the difference column of the Normal distribution tables penalise the first occurrence only
M1 A1
[3]
[2]
(ii) From tables Φ-1 ( 0.9 ) = 1.282
45.3 1.28211.5
k −=
k = 45.3 + 1.282 × 11.5 = 60.0
B1 for 1.282 seen M1 for equation in k
A1 CAO
[3]
(iii) P(score = 111)
=P(110.5 < Y < 111.5)
= 110.5 100 111.5 100P15 15
Z− − < <
= P(0.7< Z < 0.7667) = Φ(0.7667) – Φ(0.7)
= 0.7784 – 0.7580 = 0.0204
B1 for both continuity corrections
M1 for standardising M1 for correct structure of probability calc’ A1 CAO
[4]
(iv) From tables,
Φ-1 ( 0.3 ) = –0.5244, Φ-1 ( 0.8 ) = 0.8416
22 = μ + 0.8416 σ
15 = μ – 0.5244 σ
7 = 1.3660 σ
σ = 5.124, μ = 17.69
B1 for 0.5244 or 0.8416 seen
M1 for at least one equation in z, μ & σ
A1 for both correct M1 for attempt to solve
two appropriate equations
A1 CAO for both
[5]
TOTAL [17]
PMT
4767 Mark Scheme January 2010
53
4 (i) H0: no association between size of business and recycling
service used. H1: some association between size of business and recycling service used.
B1 for both [1]
(ii) Expected frequency = 78/285 × 180 = 49.2632
Contribution = (52 – 49.2632)2 / 49.2632 = 0.1520
M1 A1 M1 for valid attempt at
(O-E)2/E A1 NB Answer given Allow 0.152
[4]
(iii) Test statistic X 2 = 0.6041
Refer to 2
2 Critical value at 5% level = 5.991 Result is not significant There is no evidence to suggest any association between size of business and recycling service used. NB if H0 H1 reversed, or ‘correlation’ mentioned in part (i), do not award B1in part (i) or E1 in part (iii).
B1 B1 for 2 deg of f(seen) B1 CAO for cv B1 for not significant E1
[5]
(iv) H0: μ = 32.8; H1: μ < 32.8
Where μ denotes the population mean weight of rubbish in the bins.
Test statistic = 30.9 32.8 1.9 3.951
0.48083.4 / 50−
= − = −
5% level 1 tailed critical value of z = –1.645 –3.951 < –1.645 so significant. There is sufficient evidence to reject H0
There is evidence to suggest that the weight of rubbish in dustbins has been reduced.
B1 for use of 32.8 B1 for both correct B1 for definition of μ M1 must include √50 A1 B1 for ±1.645 M1 for sensible
M1 for standardizing M1 for structure A1 CAO (min 3 s.f.), NB When a candidate’s answers suggest that (s)he appears to have neglected to use the difference column of the Normal distribution tables penalise the first occurrence only
M1 for standardizing both M1 for correct structure A1 CAO 3s.f.
3
3
(ii) P(All 5 between 60 and 65) = 0.36785 = 0.00673
M1 A1 FT (min 2sf)
2 (iii) From tables Φ-1 ( 0.95 ) = 1.645
63 1.6455.2
k −= −
x = 63 – 5.2 × 1.645 = 54.45 mins
B1 for ±1.645 seen M1 for correct equation in k A1 CAO
3 (iv)
H0: μ = 63 minutes; H1: μ < 63 minutes. Where μ denotes the population mean time on the new course.
Test statistic = 61.7 63 1.31.34265.2 / 15
− −=
= –0.968 5% level 1 tailed critical value of z = 1.645 –0.968 > –1.645 so not significant. There is not sufficient evidence to reject H0 There is insufficient evidence to conclude that the new course results in lower times.
B1 for use of 63 B1 for both correct B1 for definition of μ M1 must include √15 A1 B1 for ±1.645 M1 for sensible
comparison leading to a conclusion
A1 FT for correct conclusion in words in context
3
5 19
PMT
4767 Mark Scheme June 2010
4
Question 4 (i)
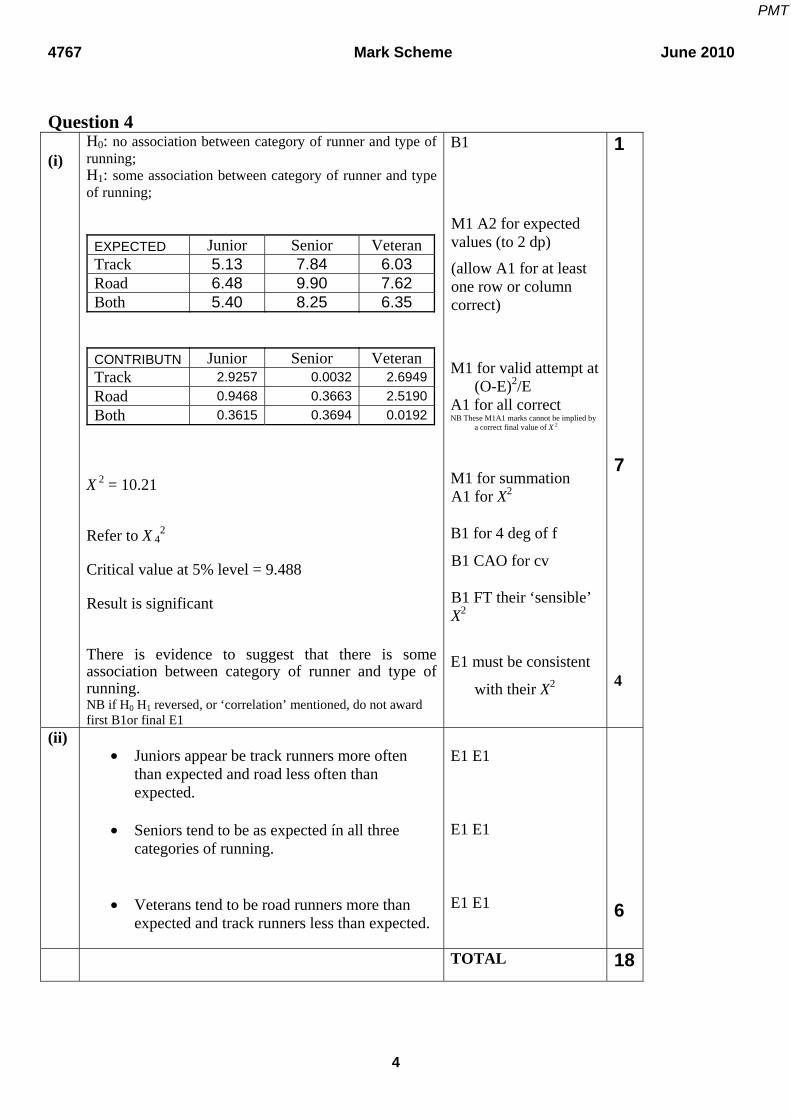
H0: no association between category of runner and type of running; H1: some association between category of runner and type of running;
2 Critical value at 5% level = 9.488 Result is significant There is evidence to suggest that there is some association between category of runner and type of running. NB if H0 H1 reversed, or ‘correlation’ mentioned, do not award first B1or final E1
B1
M1 A2 for expected values (to 2 dp)
(allow A1 for at least one row or column correct)
M1 for valid attempt at
(O-E)2/E A1 for all correct NB These M1A1 marks cannot be implied by
a correct final value of X 2
M1 for summation A1 for X2 B1 for 4 deg of f
B1 CAO for cv B1 FT their ‘sensible’ X2
E1 must be consistent
with their X2
1 7 4
(ii) • Juniors appear be track runners more often
than expected and road less often than expected.
• Seniors tend to be as expected ín all three
categories of running.
• Veterans tend to be road runners more than
expected and track runners less than expected.
E1 E1 E1 E1 E1 E1
6
TOTAL 18
PMT
4767 Mark Scheme January 2011
1
Question 1 (i) EITHER:
Sxy = 1xy x yn
= 1398.56 – 114 139.8 140.4
= –3.434
Sxx = 22 1x xn
= 1411.66 – 114
139.82 = 15.657
Syy = 22 1y yn
= 1417.88 – 114
140.42 = 9.869
r = S
S Sxy
xx yy
= -3.434
15.657 9.869
= –0.276 OR:
cov (x,y) = xy
x yn
= 1398.56/14 – 9.9857 10.0286
= –0.2454
rmsd(x) = xxSn
= √(15.657/14) =√1.1184 = 1.0575
rmsd(y) = yySn
= √(9.869/14) =√0.7049 = 0.8396
r = cov(x,y)( ) ( )rmsd x rmsd y
= -0.2454
1.0575 0.8396
= –0.276 NB: using only 3dp in calculating and x y leads to answer of 0.284 which is still in the acceptable range
M1 for method for Sxy M1 for method for at least one of Sxx or Syy A1 for at least one of
Sxy, Sxx, Syy correct M1 for structure of r A1 (-0.27 to -0.28 to 2dp) M1 for method for cov (x,y) M1 for method for at least one msd A1 for at least one of cov (x,y), msd(x), msd(y) correct M1 for structure of r A1 (-0.27 to -0.28 to 2dp)
5
If and x y used in rounded form, be generous with first A1 Structure of r needs to be fully correct in all parts – the first two M1
marks must have been earned and r = S
S Sxy
xx yy
applied.
If and x y used in rounded form, be generous with first A1 Structure of r needs to be fully correct in all parts – the first two M1
marks must have been earned and r = cov(x,y)( ) ( )rmsd x rmsd y
applied.
PMT
4767 Mark Scheme January 2011
2
(ii) H0: ρ = 0 H1: ρ 0 (two-tailed test) where ρ is the population correlation coefficient For n = 14, 5% critical value = –0.5324 Since –0.276 > –0.5324 the result is not significant. Thus we do not have sufficient evidence to reject H0 There is not sufficient evidence at the 5% level to suggest that there is correlation between birth rate and death rate
B1 for H0, H1 in symbols B1 for defining ρ
B1 for critical value (+ or -) M1 for a sensible comparison leading to a conclusion (provided that -1 < r < 1) A1 for correct result ft their r B1 ft for conclusion in
context
6
Condone hypotheses written in words and context. e.g. allow H0: There is no correlation between x & y, H1: There is correlation between x & y. (i.e. allow x & y as ‘context’ since these are defined in the question) NB If hypotheses given only in words and ‘association’ mentioned then do not award first B1 and last B1 For hypotheses written in words, candidates must make it clear that they are testing for evidence of correlation in the population. One-tailed test cv = (-) 0.4575 Comparison should be between the candidate’s value of r from part (i) and an appropriate cv (i.e. the sign of the cv and the sign of r should be the same). NOTE If result not stated but final conclusion is correct award SC1 to replace the final A1 B1
(iii) The underlying population must have a bivariate Normal distribution. Since the scatter diagram has a roughly elliptical shape.
B1 E1 for elliptical shape
2
Not bivariate and Normal
(iv) Because this data point is a long way from the other data and it is below and to the right of the other data. It does bring the validity of the test into question since this extra data point is so far from the other points and so there is less evidence of ellipticity.
E1 for a long way E1 for below and to the right of. E1 for does cast doubt on validity E1 for less elliptical
4
Indication that the point is (possibly) an outlier For identifying the position of this point (allow in terms of x and y) Allow ‘no’ but only with with suitable explanation e.g. the sample is still too small to provide evidence either for or against the presence of ellipticity.
TOTAL 17
PMT
4767 Mark Scheme January 2011
3
Question 2 (i)
Mean = xfn = 0 15 24 27 16 10
50
= 9250
= 1.84
Variance = 2211
fx nxn
= 21 258 50 1.8449
= 1.81 (to 2 d.p.)
B1 for mean M1 for calculation
A1
3
Use of MSD gets M1 A0 Standard deviation gets M0 A0 unless “Variance = 1.81” is seen.
(ii) Because the mean is close to the variance
B1 1
Must compare mean and their variance as found in part (i)
(iii) (A) P(No sultanas) = e
01.840!
= 0.159 (3 s.f.)
(B) P(At least two sultanas) =
1 – e01.84
0! – e
11.841!
=1 – 0.159 – 0.292 = 0.549
M1 for probability calc.
A1 M1 for P(1) M1 for 1 – [P(0) + P(1)] used A1 cao
5
[1.8 leads to 0.1653] Or attempt to find P(2) + P(3) + P(4) + …+ P(8) Use of λ = 1.8 loses both accuracy marks [1.8 leads to 1 – 0.4296 = 0.5372]
M1 for standardising M1 for correct structure A1 CAO M1 for standardising both M1 for correct structure A1 CAO
3
3
NB When a candidate’s answers suggest that (s)he appears to have neglected to use the difference column of the Normal distribution tables penalise the first occurrence only Ignore spurious continuity corrections & allow reversal of numerator i.e. correct tail (including below a negative z) Allow answers which round to 0.282 Penalise spurious continuity corrections Allow 0.663 if penalised inappropriate table use already Use of standard deviation = √52 or 522 can earn M1 for structure only in each part – max 2/6
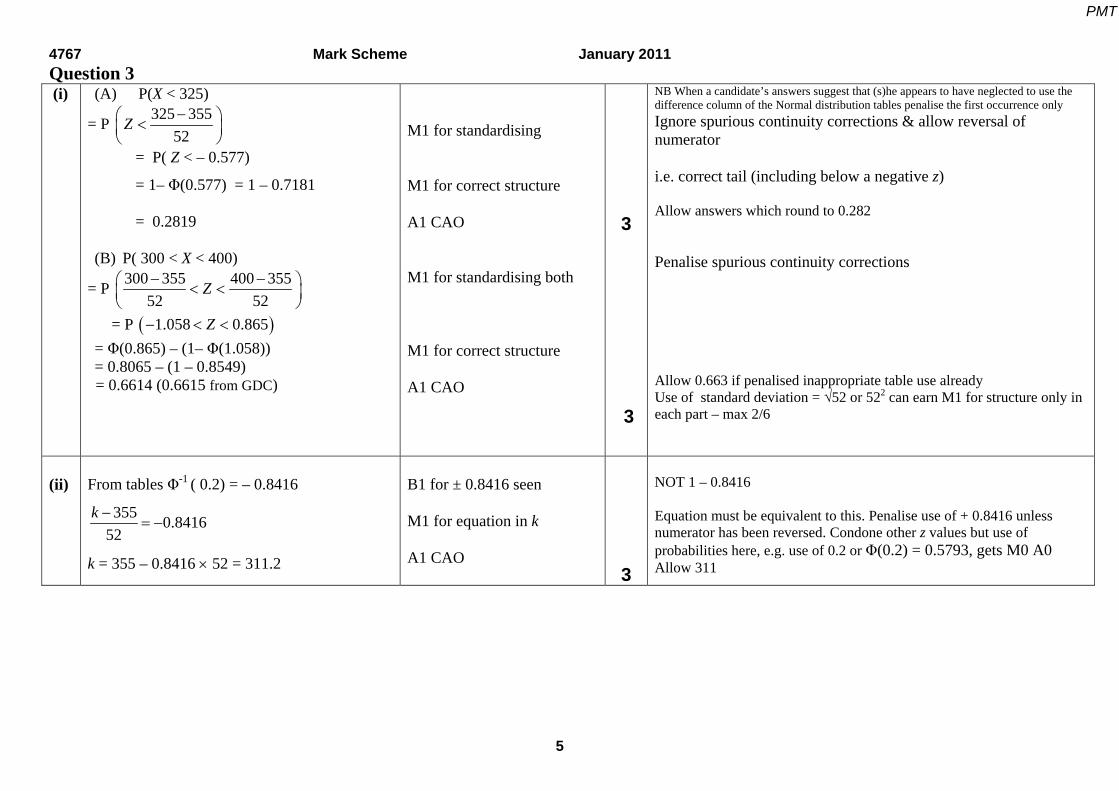
(ii)
From tables Φ-1 ( 0.2) = – 0.8416
355 0.841652
k
k = 355 – 0.8416 52 = 311.2
B1 for ± 0.8416 seen M1 for equation in k A1 CAO
3
NOT 1 – 0.8416 Equation must be equivalent to this. Penalise use of + 0.8416 unless numerator has been reversed. Condone other z values but use of probabilities here, e.g. use of 0.2 or Φ(0.2) = 0.5793, gets M0 A0 Allow 311
PMT
4767 Mark Scheme January 2011
6
(iii)
H0: μ = 355; H1: μ ≠ 355. Where μ denotes the population mean (reaction time for women)
Test statistic = 344 355 11 1.05810.452 / 25
5% level 2 tailed critical value of z = 1.96 –1.058 > –1.96 so not significant. There is not sufficient evidence to reject H0 There is insufficient evidence to conclude that women have a different reaction time from men in this experiment.
B1 for use of 355 in hypotheses B1 for both correct B1 for definition of μ M1 must include √25 A1 B1 for 1.96 M1 for a sensible comparison
leading to a conclusion A1 for correct conclusion in words in context
8
Use of 355 in hypotheses and hypotheses given in terms of μ not p or x, etc. unless letter used is clearly defined as population mean Allow + 1.058 only if later compared with + 1.96 Or -1.96 Do not accept ‘men and women have same reaction time’
TOTAL 17
PMT
4767 Mark Scheme January 2011
7
Question 4 (i)
H0: no association between pebble size and site H1: some association between pebble size and site;
EXPECTED Site A Site B Site C Large 13.70 9.44 13.86 Medium 33.33 22.96 33.70 Small 42.96 29.60 43.44 CONTRIB’N Site A Site B Site C Large 0.1226 0.6940 1.0731 Medium 0.8533 1.5484 3.7861 Small 0.3793 0.3913 1.2744
X 2 = 10.12 Refer to X4
2 Critical value at 5% level = 9.488 Result is significant There is evidence to suggest that there is some association between pebble size and site
B1
M1 A2 for expected values (to 2 dp)
(allow A1 for at least one row or column correct)
M1 for valid attempt at
(O-E)2/E A1 M1 for summation A1 for X2 B1 for 4 deg of freedom
B1 CAO for cv B1 ft their ‘sensible’ X2 and critical value
E1 must be consistent with their X2
12
Must be in context NB if H0 H1 reversed, or ‘correlation’ mentioned, do not award first B1 or final E1 1d.p.can get M1A1A0 M1A2 can be implied by correct contributions/final answer NB These (M1A1) marks cannot be implied by a correct final value of X 2. A1 for at least 1 row/column correct Dependent on previous M1 Award only if no incorrect working seen Allow reject H0. B0 if critical value of 0.711 (lower tail) or 2.776 (t distribution) used. Dependent on previous B1 SC1 (to replace B1E1 if first B1B1 earned where ‘significant’ not stated but final statement is correct)
PMT
4767 Mark Scheme January 2011
8
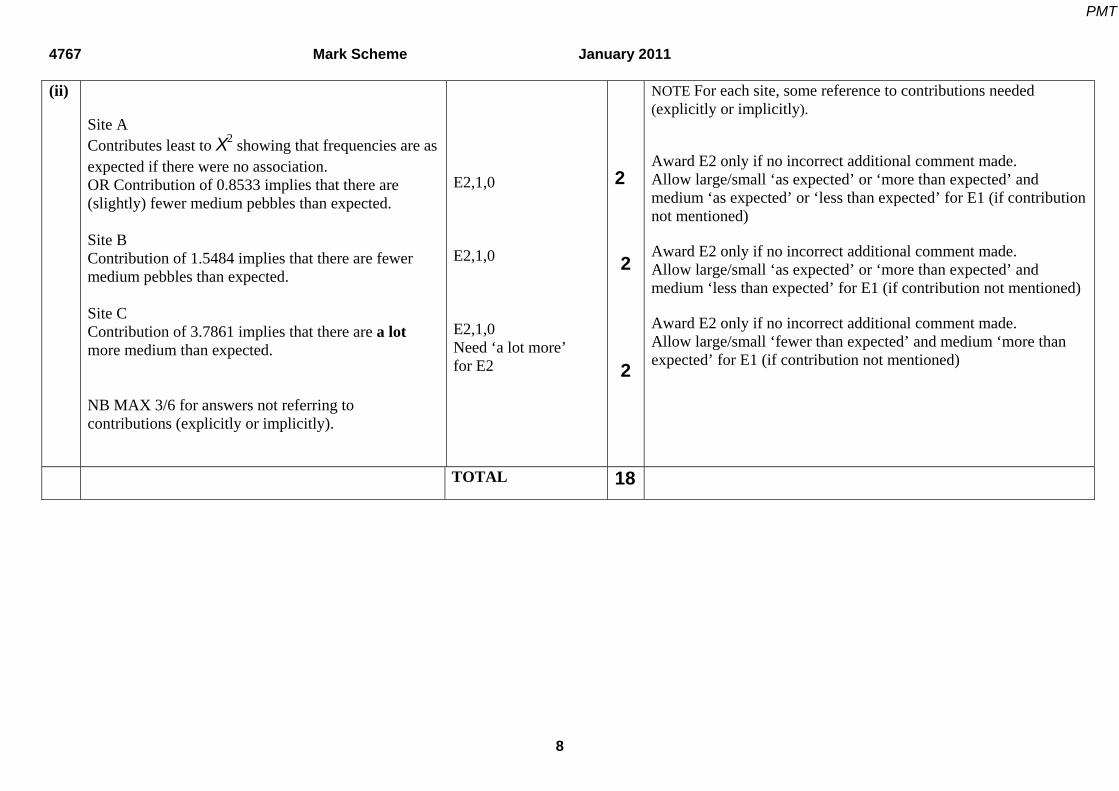
(ii)
Site A Contributes least to X2 showing that frequencies are as expected if there were no association. OR Contribution of 0.8533 implies that there are (slightly) fewer medium pebbles than expected. Site B Contribution of 1.5484 implies that there are fewer medium pebbles than expected. Site C Contribution of 3.7861 implies that there are a lot more medium than expected. NB MAX 3/6 for answers not referring to contributions (explicitly or implicitly).
E2,1,0 E2,1,0 E2,1,0 Need ‘a lot more’ for E2
2
2
2
NOTE For each site, some reference to contributions needed (explicitly or implicitly). Award E2 only if no incorrect additional comment made. Allow large/small ‘as expected’ or ‘more than expected’ and medium ‘as expected’ or ‘less than expected’ for E1 (if contribution not mentioned) Award E2 only if no incorrect additional comment made. Allow large/small ‘as expected’ or ‘more than expected’ and medium ‘less than expected’ for E1 (if contribution not mentioned) Award E2 only if no incorrect additional comment made. Allow large/small ‘fewer than expected’ and medium ‘more than expected’ for E1 (if contribution not mentioned)
TOTAL 18
PMT
4767 Mark Scheme January 2011
9
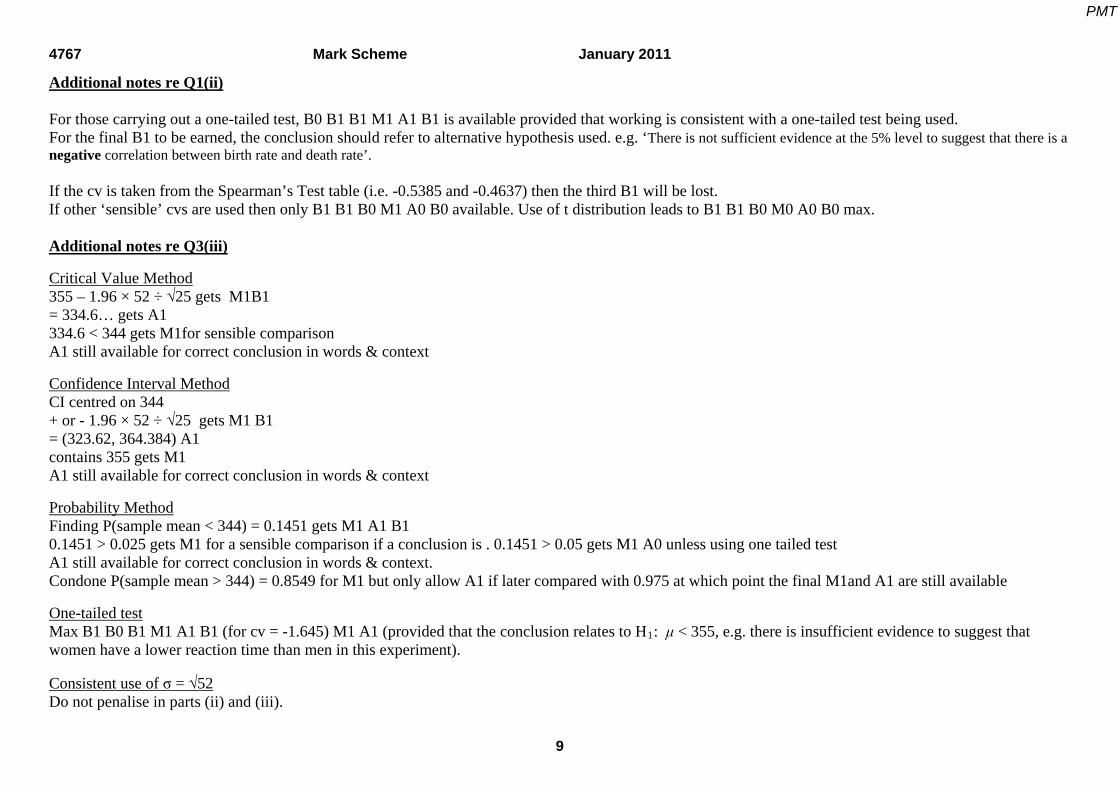
Additional notes re Q1(ii) For those carrying out a one-tailed test, B0 B1 B1 M1 A1 B1 is available provided that working is consistent with a one-tailed test being used. For the final B1 to be earned, the conclusion should refer to alternative hypothesis used. e.g. ‘There is not sufficient evidence at the 5% level to suggest that there is a negative correlation between birth rate and death rate’. If the cv is taken from the Spearman’s Test table (i.e. -0.5385 and -0.4637) then the third B1 will be lost. If other ‘sensible’ cvs are used then only B1 B1 B0 M1 A0 B0 available. Use of t distribution leads to B1 B1 B0 M0 A0 B0 max. Additional notes re Q3(iii) Critical Value Method 355 – 1.96 × 52 ÷ √25 gets M1B1 = 334.6… gets A1 334.6 < 344 gets M1for sensible comparison A1 still available for correct conclusion in words & context Confidence Interval Method CI centred on 344 + or - 1.96 × 52 ÷ √25 gets M1 B1 = (323.62, 364.384) A1 contains 355 gets M1 A1 still available for correct conclusion in words & context Probability Method Finding P(sample mean < 344) = 0.1451 gets M1 A1 B1 0.1451 > 0.025 gets M1 for a sensible comparison if a conclusion is . 0.1451 > 0.05 gets M1 A0 unless using one tailed test A1 still available for correct conclusion in words & context. Condone P(sample mean > 344) = 0.8549 for M1 but only allow A1 if later compared with 0.975 at which point the final M1and A1 are still available One-tailed test Max B1 B0 B1 M1 A1 B1 (for cv = -1.645) M1 A1 (provided that the conclusion relates to H1: μ < 355, e.g. there is insufficient evidence to suggest that women have a lower reaction time than men in this experiment). Consistent use of σ = √52 Do not penalise in parts (ii) and (iii).
PMT
Oxford Cambridge and RSA Examinations
GCE
Unit 4767: Statistics 2
Advanced GCE
Mathematics (MEI)
Mark Scheme for June 2011
PMT
4767 Mark Scheme June 2011
1 (i)
G1 for axes G1 For values of x G1 for values of y
3
Condone axes drawn either way. Axes should show some indication of scale. If not then Max G1 if points ‘visibly correct’. If axes are scaled and only one point is incorrectly plotted, allow max G2/3.
1 (ii) x = 60, y = 4.26
b = xy
xx
SS
= 2
1803 300 21.3 / 527000 300 / 5
= 5259000
= 0.0583
OR b = 2
1803/ 5 60 4.2627000 / 5 60
= 1051800
= 0.0583
hence least squares regression line is: y y = b(x x ) y – 4.26 = 0.0583 (x – 60) y = 0.0583x + 0.76
B1 for x and y used appropriately (SOI)
M1 for attempt at gradient
(b) A1 for 0.0583 cao M1 for equation of line A1 FT for complete
equation
5
B1 for means can be implied by a correct value of b using either method. Allow y = 4.3 Attempt should be correct – e.g. evidence of either of the two suggested methods should be seen.
Allow 0.058 Condone 0.058 and 3 7120
Dependent on first M1. Values must be substituted to earn M1. Condone use of their b for FT provided b>0. Final equation must be simplified. b = 0.058 leads to y = 0.058x + 0.78
1 (iii) Regression line plotted on graph The fit is good
G1 G1 E1 for good fit
3
Line must pass through their ( x , y ) and y-intercept. E0 for notably inaccurate graphs/lines
5
PMT
4767 Mark Scheme June 2011
6
1 (iv) x = 30 predicted y = 0.0583×30 + 0.76 = 2.509
Residual = 2.5 – 2.509 = –0.009
B1 for prediction M1 for subtraction A1 FT
3
Using their equation Subtraction can be ‘either way’ but for the final mark the sign of the residual must be correct. FT sensible equations only – e.g. no FT for y = 0.071x leading to +0.37. [c = 0.78 leads to a residual of -0.02]
1 (v) (A) For x = 45, y = 0.0583×45 + 0.76 = 3.4 (B) For x = 150, y = 0.0583×150 + 0.76 = 9.5
M1 for at least one prediction attempted A1 for both answers (FT their equation provided their b>0)
2
Prediction obtained from their equation.
1 (vi) This is well below the predicted value … …suggesting that the model breaks down for larger values of x.
E1 for well below E1 extrapolation
2
Some indication that the value (8.7) is significantly below what is expected (9.5) is required for the first E1. Simply pointing out that it is ‘below’ is not sufficient. The second E1 is available for a suitable comment relating to the model being suitable only for values within the domain of the given points. Allow other sensible comments for either E1. E.g. The data might be better modelled by a curve’, ‘there may be other factors affecting yield’,
18
PMT
4767 Mark Scheme June 2011
2 (i) Independently means that the arrival time of each car is unrelated to the arrival time of any other car. Randomly means that the arrival times of cars are not predictable. At a uniform average rate means that the average rate of car arrivals does not vary over time.
E1 E1 E1
3
NOTE Each answer must be ‘in context’ and ‘clear’ Allow sensible alternative wording. SC1 For ALL answers not in context but otherwise correct.
2 (ii) P(At most 1 car) = e
00.620!
+ e10.62
1!
= 0.5379… + 0.3335… = 0.871
M1 for either M1 for sum of both A1 CAO
3
1.62e-0.62 Allow 0.8715 not 0.872 or 0.8714 Allow 0.87 without wrong working seen
2 (iii) New λ = 10 0.62 = 6.2 P(more than 5 in 10 mins) = 1 – 0.4141 = 0.5859
B1 for mean (SOI) M1 for probability A1 CAO
3
Use of 1 – P(X ≤ 5) with any λ Allow 0.586
2 (iv) Poisson with mean 37.2 B1 for Poisson B1 for mean 37.2
B1 for Normal (SOI) B1 for parameters B1 for 39.5 M1 for correct use of Normal approximation using correct tail A1 cao
5
Allow 0.353
16
7
PMT
4767 Mark Scheme June 2011
3 (i)
P(Apple weighs at least 220g)
= P 220 210.515.2
Z
= P( Z > 0.625) = 1– Φ(0.625) = 1 – 0.7340
= 0.2660
M1 for standardising M1 for correct structure A1 CAO inc use of diff tables
3
Condone numerator reversed but penalise continuity corrections i.e. 1 – Φ(positive z value) Allow 0.266 but not 0.27
3 (ii) P(All 3 weigh at least 220g) = 0.26603 = 0.0188 M1 A1 FT 2 M1 for their answer to part (i) cubed
Allow 0.019 and 0.01882 3 (iii) (A) Binomial (100, 0.0188)
(B) Use a Poisson distribution with λ = 100×0.0188 = 1.88
P(At most one) = e01.88
0! + e
11.881!
= 0.1525 + 0.2869 = 0.4394 (C) n is large and p is small
B1 for binomial B1 for parameters B1 for Poisson SOI B1 for Poisson mean M1 for either probability M1 for sum of both A1 CAO For 0.44 or better
B1
2
5 1
Second B1 dependent on first B1 FT their answer to part (ii) for second B1 Consistent with p < 0.1 from part (iii) (A) FT answer to part (ii) with p < 0.1 Dependent on both previous B1 marks Allow 0.4395 but not 0.4337 Dependent on use of Poisson in part (iii) B Allow n is large and np <10 & n is large and
npqnp 3(iv)(A) Φ-1 ( 0.1 ) = – 1.282
170 185 1.282
1.282 σ = 15
σ = 11.70
B1 for ±1.282 M1 for correct equation as written o.e. A1 CAO
3
Do not allow 1 – 1.282 Allow M1 if different z-value used Without incorrect working seen. Allow 11.7
8
PMT
4767 Mark Scheme June 2011
9
3(iv)(B)
G1 for shape G1 for means, shown explicitly or by scale G1 for lower max height for Braeburns G1 for greater width (variance) for Braeburns
4
Ignore labelling of vertical axis. Two intersecting, adjacent Normal curves Means at 185 and 210.5
TOTAL 20 4(a)(i) H0: no association between amount spent and sex
H1: some association between amount spent and sex B1 for both
1 Hypotheses must be the right way round, in context and must not mention ‘correlation’.
B1 M1 A1 for valid attempt at (O-E)2/E NB Answer given
3
Do not allow 31.6
Cox’s Braeburns
PMT
4767 Mark Scheme June 2011
4(a)(iii) Refer to X42
Critical value at 5% level = 9.488 3.205 < 9.488 Result is not significant There is insufficient evidence to suggest any association between amount spent and sex. .
B1 for 4 deg of freedom B1 CAO for cv M1 A1 for not significant E1
5
Allow p = 0.524 0.524 > 0.05 Conclusion must be stated to earn A1 here. Allow ‘do not reject H0’ and condone ‘accept H0’ or ‘reject H1’. FT if cv consistent with their d.o.f. Dependent on previous A1 and final comment must be in context and not mention correlation. SC1 for correct final conclusion where previous A1 omitted but M1 awarded.
4 (b) H0: μ = 400; H1: μ < 400 Where μ denotes the population mean (weight of the loaves). x = 396.5
Test statistic = 396.5 400 3.5 1.5042.3275.7 / 6
5% level 1 tailed critical value of z = –1.645 –1.504 > –1.645 so not significant. There is insufficient evidence to reject H0 There is insufficient evidence to suggest that the true mean weight of the loaves is lower than the minimum specified value of 400 grams.
B1 for H0 B1 for H1 B1 for definition of μ B1 for sample mean M1 must include √6 A1FT their sample mean
B1 for ±1.645
M1 for sensible comparison leading to a conclusion A1 for conclusion in context
9
Hypotheses in words must refer to population mean. Condone numerator reversed for M1 but award A1 only if test statistic of 1.504 is compared with a positive z-value. Dependent on previous M1 FT their sample mean only if hypotheses are correct.
TOTAL 18
10
PMT
4767 Mark Scheme June 2011
Additional notes re Q1 parts (ii), (iv) and (v) Part (ii) ‘x on y’ max B1 Part (iv) x = 16.9y – 12.02 leads to a prediction of x = 30.23 and a residual of -0.23 B1 M1 A1 available. Part (v) ‘x on y’ not appropriate here so award 0 if ‘x on y’ used. Additional notes re Q2 parts (i) & (v) Part (i) Independent – Allow ‘not linked to’ or ‘no association’ or ‘unrelated’ ‘not affected by’, ‘not connected to’, ‘not influenced by’ DO NOT ACCEPT ‘not together’ or ‘not dependent’ Random – Allow ‘not predictable’ or ‘no pattern’ or ‘could happen at any time’ or ‘not specific time’ Uniform average rate – Allow ‘average (rate) is constant over time’ DO NOT ACCEPT ‘average constant’ or ‘average rate and uniform’ – be generous over defining ‘average’ and/or ‘rate’. Part (v) If Binomial distribution stated in part (iv), allow B1 B0 B1 M0 A0 max Additional notes re Q3 part (iii) where p > 0.1 (iii) B – as scheme unless a Normal approximation is more suitable (p > 0.1). If so, award B1 B1 for Normal and correct parameters. The remaining marks are dependent on both these B1 marks being awarded. M1 for the correct continuity correction (P(X < 1.5) ) and depM1 for the correct tail but award A0. (iii) C – ‘n is large and p is not too small’ or ‘np > 10’
11
PMT
4767 Mark Scheme June 2011
12
Additional notes re Q4(b) σ estimated sample mean, 7.079… used in place of 5.7, the given value of the population mean, leads to a test statistic of -1.212… This gets M1A0 & the remaining marks are still available. Critical Value Method 400 – 1.645 × 5.7 ÷ √6… gets M1B1 …= 396.17…gets A1 400 + 1.645 × 5.7 ÷ √6 gets M1B1A0. 396.5 > 396.2 gets M1for sensible comparison (and B1 for 396.5) A1 still available for correct conclusion in words & context 90% Confidence Interval Method CI centred on 396.5 (gets B1 for 396.5) + or – 1.645 × 5.7 ÷ √6 gets M1 B1 = (392.67, 400.33) A1 contains 400 gets M1 A1 still available for correct conclusion in words & context Probability Method Finding P(sample mean < 396.5) = 0.0663 gets M1 A1 (and B1 for 396.5) 0.0663 > 0.05 gets M1 for a sensible comparison if a conclusion is made and also gets the B1 for 0.0663 (to replace the B1 for cv = 1.645). A1 still available for correct conclusion in words & context. Condone P(sample mean >396.5) = 0.9337 for M1 and B1 for 0.9337 but only allow A1 if later compared with 0.95 at which point the final M1and A1 are still available Two-tailed test Max B1 B0 B1 B1 M1 A1 B1 (for cv = -1.96) M1 A0
PMT
4767 Mark Scheme June 2012
Question Answer Marks Guidance 1 (i) EITHER
Sxy = 1xy x y = 600.41 –n
101
× 113.69 × 52.81 = 0.01311
M1 For method for Sxy
Sxx = 22 1x x
n = 1292.56 –
101
× 113.692 = 0.01839
M1 For method for at least one of Sxx or Syy
Syy = 22 1y y
n = 278.91 –
101
× 52.812 = 0.02039 A1 For at least one of Sxy, Sxx or Syy correct
r =
S
S Sxy
xx yy
= 02039.001839.0
01311.0
= 0.677 M1 A1
For fully correct structure of r For answer rounding to 0.68
OR
cov (x,y) = xy
x yn
= 600.41/10 – 11.369 5.281 = 0.001311 M1 For method for cov (x,y)
rmsd(x) = xxS
n= √(0.01839/10) =√0.001839 = 0.04288
M1 For method for at least one msd or rmsd
rmsd(y) = yyS
n= √(0.02039/10) =√0.002039 = 0.04516
A1 For at least one of cov (x,y), msd or rmsd correct
r =
cov(x,y)( ) ( )rmsd x rmsd y
= 04516.004288.0
001311.0 = 0.677
M1 A1
For fully correct structure of r For answer rounding to 0.68
Methods mixed – max M0M1A1M0A0 [5] 1 (ii) H0: ρ = 0
H1: ρ 0 (two-tailed test) B1 For H0, H1 in symbols. Hypotheses in words must refer to
population. Do not allow alternative symbols unless clearly defined as the population correlation coefficient.
where ρ is the population correlation coefficient B1 For defining ρ. Condone omission of “population” if correct
notation ρ is used, but if ρ is defined as the sample correlation coefficient then award B0.
For n = 10, 10% critical value = 0.5494 B1 CAO Note that critical values for a one-tailed test at the 10% level are not available in tables.
5
PMT
4767 Mark Scheme June 2012
Since 0.677 > 0.5494 the result is significant. M1 For sensible comparison leading to a conclusion provided that |r| < 1. The comparison can be in the form of a diagram as long as it is clear and unambiguous. Sensible comparison: e.g. 0.677 > 0.5494 is ‘sensible’ whereas 0.677 > - 0.5494 is ‘not sensible’. Reversed inequality sign e.g. 0.677 < 0.5494 etc. gets max M1 A0.
(Thus we have sufficient evidence to) reject H0 A1* For reject H0 o.e. FT their r and critical value from 10% 2-tail column.
There is sufficient evidence at the 10% level to suggest that there is correlation between times for the first and last sections.
E1dep* For correct, non-assertive conclusion in context. Allow ‘x and y’ for context. E0 if H0 and H1 not stated, reversed or mention a value other than zero for ρ in H0. Do not allow ‘positive correlation’ or ‘association’
[6] 1 (iii) The underlying population must have a bivariate Normal
distribution. B1 Condone “bivariate Normal distribution”, “underlying
bivariate Normal distribution”, but do not allow “the data have a bivariate Normal distribution”
The points in the scatter diagram should have a roughly elliptical shape.
E1 Condone ‘oval’ or suitable diagram
[2] 1 (iv) The hypothesis test has shown that there appears to be correlation. E1 For relevant comment relating to the test result or positive
value of r in supporting (unless FT leads to not supporting) the commentator’s suggestion. Or correlation does not imply causation. There may be a third factor. For questioning the use of the word ‘must’
However it could be that there is a third causal factor E1 Allow any two suitable, statistically based comments. [2] 1 (v) (A) Yes because the critical value at the 1% level is 0.7646 B1* B1 for 0.7646 seen which is larger than the test statistic E1dep* E1 for comment consistent with their (ii) provided r| < 1 [2]
6
PMT
4767 Mark Scheme June 2012
1 (v) (B) One advantage of a 1% level is that one is less likely to reject the null hypothesis when it is true.
E1 o.e. Wording must be clear.
One disadvantage of a 1% level is that one is more likely to E1 o.e. accept the null hypothesis when it is false. [2] 2 (i) Binomial(1200,1/300) B1 For binomial. B1dep For parameters [2] Allow B(1200, 1/300) and B(1200, 0.00333) 2 (ii) Because n is large and p is small E1, E1 Allow n is large and np < 10. Allow “sample is large” for n is large and “mean ≈
variance” for “p is small”
[2] 2 (iii) λ = 1200 1/300 = 4 B1 For λ FT their p
(A) P(X = 1) = !1
414e = 0.0733 (3 s.f.)
M1
For attempt to find P(X = 1) using Poisson p.d.f. or tables
or from tables = 0.0916 – 0.0183 = 0.0733 A1 Allow answers which round to 0.073 www. FT their λ (= np). No FT for λ = 1/300.
(B) Using tables: P(X > 4) = 1 – P(X 4) M1 For finding 1 – P(X 4) = 1 – 0.6288 = 0.3712 A1 CAO For answers rounding to 0.371 www [5] 2 (iv) µ = 80 B1 If symbols/words used then they must be correct. σ2 = 80 B1 Allow σ2 rounding to 79.7 from original binomial. FT their λ (= np) [2] 2 (v) (A)
P(Y ≥ 90) = P
80805.89Z
B1 M1
For correct continuity correction. For probability using correct tail and structure (condone omission of c.c.)
Allow 0.144 www. NOTE 0.1441 from B(24000, 1/300) gets 0/3
[3]
7
PMT
4767 Mark Scheme June 2012
2 (v) (B) P(Y ≤ k) > 0.05 From tables Φ-1 ( 0.05 ) = -1.645 B1 For ±1.645 seen
8080)5.0( k
= -1.645 M1
For correct equation in k seen or equivalent – e.g. allow +1.645 used if numerator reversed. FT their µ, σ2 and z-value. Condone omission of, or incorrect, continuity correction.
k + 0.5 = 80 – (1.645 × √80) = 65.29 k > 64.79
A1 A1 for 65.29 or 64.79 or 65.79 (σ2 = 79.73 leads to 65.31 or 64.81 or 65.81) Allow 3s.f.
So least value of k = 65 A1 For rounding 64.79 or 64.81 up to give k = 65. See additional notes for alternative method [4] 3 (i)
P(X ≥ 750) = P
5.2
Z 4.751750
M1 M1
For standardizing For correct structure (M0 if continuity correction used)
= P(Z > -0.56) = Φ(0.56) = 0.7123 A1 CAO Allow 0.712 www [3] 3 (ii) P(all 6 at least 750ml) = 0.71236 M1 For (their answer to part (i))6 = 0.1306 A1 FT 3s.f. [2] 3 (iii)
P(Y=0) = (= 0.0302) 258694.0025
M1
For using Binomial(25, p) with their p from part (ii)
P(Y=1) = (= 0.1135) 1306.08694.0
125 24
M1 For correct structure of either P(Y = 0) or P(Y = 1) with their p from part (ii) M0 if p and q reversed
P(Y=0) + P(Y=1) = 0.144 P(Y ≥ 2) = 1 – 0.144 M1dep For 1 – sum of both probabilities =0.856 A1 CAO [4]
8
PMT
4767 Mark Scheme June 2012
3 (iv) P(Z <
5.2750
) = 0.02
Φ-1 (0.02) = -2.054 B1 For ±2.054 seen. Allow ±2.055
5.2750
= -2.054 M1 For correct equation as seen or equivalent. FT σ = √2.5. M0
if c.c. used.
= 750 + 2.054 × 2.5 M1 For correctly rearranging their equation (if 750 used in numerator) for µ, FT their z
= 755.1 A1 cao Condone 755 or 5 s.f. rounding to 755.1 www [4] 3 (v)
P(Z <
4.751750 ) = 0.02
4.751750
= -2.054
054.24.1
M1
M1
For correct equation as seen or equivalent For correctly rearranging their equation (if 750 used in numerator) for σ unless this leads to σ < 0
= 0.682 A1 cao Allow answers rounding to 0.68 www [3] 3 (vi) Probably easier to change the mean (as reducing the standard. E1 deviation would require a much more accurate filling process). However increasing the mean would result in fewer bottles being filled overall and so less profit for the owners, so reducing the
standard deviation would be preferable to the vineyard owners. E1 For “preferable to reduce the standard deviation” with valid
reason.
[2] 4 (a) (i) Expected frequency = 67/150 57 = 25.46 B1 For 25.46 Contribution = (34 – 25.46)2 / 25.46 M1 For valid attempt at (O-E)2/E = 2.8646 A1 Correct values used to give answer which rounds to 2.8646
NB Answer given
[3]
9
PMT
4767 Mark Scheme June 2012
4 (a) (ii) H0: no association between type of cake and classification of B1 For both hypotheses in context person. H1: some association between type of cake and classification of person. Test statistic X 2 = 12.86 Refer to X 32 B1 For 3 degrees of freedom Critical value at 1% level = 11.34 B1 CAO For cv. No FT from here if wrong/omitted Result is significant B1 For significant There is evidence to suggest association between type of cake and E1 For correct, non-assertive conclusion, in context. classification of person. NB if H0 H1 reversed, omitted or ‘correlation’ mentioned, do not
award first B1 or final E1
[5] 4 (b) = 4.995 B1 For 4.995 seen H0: μ = 5 B1 For use of 5 in hypotheses. H1 : μ < 5 B1 For both correct. Hypotheses in words must refer to
population. Do not allow alternative symbols unless clearly defined as the population mean.
Where μ denotes the mean content of the bags of flour (in the population)
B1 For definition of μ in context. Condone omission of “population” if correct notation μ is used, but if μ is defined as the sample mean then award B0.
Test statistic = 964.1002546.0
005.08/0072.00.5995.4
M1* A1
must include √8 FT their . Allow +1.964 only if later compared with +1.645
Lower 5% level 1 tailed critical value of z = – 1.645 B1* For –1.645 No FT from here if wrong. Must be –1.645 unless it is clear that absolute values are being used.
– 1.964 < – 1.645 so significant. M1 dep*
For sensible comparison with correct c.v. leading to a conclusion.
There is sufficient evidence to reject H0 There is sufficient evidence to suggest that the average contents
of bags is less than 5kg. A1 For non-assertive conclusion in words and in context. No FT
here.
See additional notes. [9]
10
PMT
4767 Mark Scheme June 2012
11
ADDITIONAL NOTES REGARDING QUESTION 2 (v) B M1 for using a trial and improvement method with N(80,80) or N(80, 79.73) to find P(Y ≤ k) for any k. The distribution being used needs to be made clear. A1 for P(Y ≤ 66) = 0.0587… (0.0584… from σ2 = 79.73) or P(Y ≤ 65) = 0.0467… (0.0464… from σ2 = 79.73) A1 for both Final A1 not available if 66 and 65 used Or A1 for P(Y ≤ 65.5) = 0.0524… (0.0521… from σ2 = 79.73) or P(Y ≤ 64.5) = 0.0415… (0.0412… from σ2 = 79.73) A1 for both A1 for least value of k = 65, dependent on previous two A marks earned. ADDITIONAL NOTES REGARDING QUESTION 4 (b) Critical Value Method 5 – 1.645 × 0.0072 ÷ √8 gets M1*B1* = 4.9958… gets A1 4.995 < 4.99581.. gets M1dep* for sensible comparison A1 still available for correct conclusion in words & context “Confidence Interval” Method 4.995 + 1.645 × 0.0072 ÷ √8 gets M1* B1* = 4.9991.. gets A1 NOTE that the final M1dep* A1 available only if 1.645 used. 5 > 4.9991… gets M1 A1 still available for correct conclusion in words & context Probability Method Finding P(sample mean < 4.995) = 0.0248 gets M1* A1 B1 0.0248 < 0.05* gets M1dep* for a sensible comparison if a conclusion is made. A1 available for a correct conclusion in words & context. Condone P(sample mean > 4.995) = 0.9752 for M1 but only allow A1 B1 if later compared with 0.95, at which point the final M1and A1 are still available ADDITIONAL NOTE REGARDING OVER-SPECIFICATION OF ANSWERS Over-specification by providing final answers correct to 5 or more significant figures will be penalised. When this applies, candidates may lose no more than 2 marks per question and no more than 4 marks in total. The only exception to this rule is in Question 3 part (iv) – see guidance note.
PMT
4767 Mark Scheme January 2013
6
Question Answer Marks Guidance 1 (i)
G1
G2,1,0
G1 For axes suitably labelled with some indication of linear scale provided. G2 for points plotted correctly. G1 if 4 points plotted correctly. G0 if two or more incorrectly plotted/omitted points. Special Case SC1 for points visibly correct on axes where no indication of scale has been provided.
Allow x & y Allow axes reversed.
[3] 1 (ii) Thickness is the independent variable since the values of
‘Thickness’ are not subject to random variation, but are determined by the manufacturer.
E1
Allow explanations referring to thickness being “controlled” by the manufacturer. Allow equivalent interpretations.
[1] 1 (iii) t = 60, h = 1.548
B1 For t and h used. SOI
(e.g. can be implied by b = 0.0206)
b = th
tt
SS
= 2
546.8 (300 7.74 / 5)22000 300 / 5
= 82.44000
= M1* For attempt at calculating gradient (b) for h on t.
0.0206 A1 For 0.0206 cao
OR b = 2
546.8 / 5 (60 1.548)22000 / 5 60
= 16.48800
=
0.0206 hence least squares regression line is: h – h = b(t – t )
PMT
4767 Mark Scheme January 2013
7
Question Answer Marks Guidance h – 1.548 = 0.0206 (t – 60) M1
dep*
For equation of line, using their b, b > 0, and passing through their ( t , h )
h = 0.0206 t + 0.312 A1 Final equation must have h as the subject. CAO Allow h = 0.021 t + 0.31, Allow h = 0.021 t + 0.288 NOTE If equation given in terms of y and x then A0 unless x & y defined appropriately
Likely to be reliable as interpolation E1 [2] 1 (iv) (B) (0.0206 ×120) + 0.312 = 2.784 B1 Allow 2.78
FT their equation provided b > 0
Could be unreliable as extrapolation E1 Condone “reliable as 120 is not too far away from the data used to produce the equation”
[2] 1 (v) Thickness = 40 predicted max height = (0.0206 × 40) + 0.312 = 1.136 M1 For prediction. FT their equation provided b > 0 Residual = 1.09 – 1.136 M1 For difference between 1.09 and prediction. = –0.046 A1 Allow –0.05 [3] 1 (vi) Regression line gives a prediction of
(0.0206 × 200) + 0.312 = 4.432 B1*
B1 for obtaining a prediction from regression equation or from graph
This is well above the observed value. E1 dep*
E1 for noting the large difference between prediction and actual value
It could be that the relationship breaks down for larger thickness, or that the relationship is not linear
E1 E1 for suitable interpretation regarding the relationship between maximum height and thickness
M1 for use of correct structure. i.e. M0 for use of 1 – P(X ≤2) or 1 – 0.6796 Using λ = 2.0 leading to 1 – 0.4060 gets M1
= 0.6204 A1 CAO Allow 0.6203, 0.620 [2] 2 (i) (C) New λ = 5 2.1 = 10.5 B1 For mean (SOI) P(Between 5 and 10 in 5 mins) = 0.5207 – 0.0211 M1 For P(X ≤10) – P(X ≤4) used. e.g. 1 – 0.9379
leads to B0M1A0
= 0.4996 A1 CAO Allow 0.500, 0.50. Condone 0.5 www. [3] 2 (ii) Mean number in 60 minutes = 60 × 2.1 = 126 Using Normal approx. to the Poisson, B1 For Normal approx. X ~ N(126, 126) B1 For correct parameters (SOI)
P(X ≥ 130) = P 129.5 126126
Z
B1 For correct continuity correction
= P(Z > 0.3118) = 1 – Φ(0.3118) M1 For correct probability structure = 1 – 0.6224 = 0.3776 A1 CAO, (Do not FT wrong or omitted CC).
Allow 0.378www & 0.3775
[5]
PMT
4767 Mark Scheme January 2013
9
Question Answer Marks Guidance 2 (iii) (Because if butterflies are blown in pairs,) the events
will no longer be occurring singly. E1
Accept ‘not independent’
[1] 2 (iv) P(3 or fewer) = P(3 or fewer individuals and no pairs) +
P(0 or 1 individual and 1 pair)
M1 For P(0 pairs) (= 0.8187)
= (0.9068 × 0.8187) + (0.4932 × (0.9825 – 0.8187)) M1 For P(1 pair) (= 0.1638 or 0.1637) First two M1s can be awarded
for 0.9825 = (0.9068 × 0.8187) + (0.4932 × 0. 1638) M2 For structure M2 for correct 6 combinations
identified and their probabilities added, M1 for 5 combinations identified and their probabilities added.
= 0.7424 + 0.0808 = 0.8232
Or using D for the number of pairs and S for the number of singles P(D = 0) × P(S = 0) = e–0.2 × e–1.7 = 0.1495… P(D = 0) × P(S = 1) = e–0.2 × 1.7e–1.7 = 0.2542… P(D = 0) × P(S = 2) = e–0.2 × 1.72e–1.7÷2 = 0.2161… P(D = 0) × P(S = 3) = e–0.2 × 1.73e–1.7 ÷ 3! = 0.1224… P(D = 1) × P(S = 0) = 0.2e–0.2 × e–1.7 = 0.0299… P(D = 1) × P(S = 1) = 0.2e–0.2 × 1.7e–1.7 = 0.0508… Or P(D = 0) × P(S = 3) + P(D = 1) × P(S = 1) P(D = 0) × P(S = 2) + P(D = 1) × P(S = 0) P(D = 0) × P(S = 1) P(D = 0) × P(S = 0)
2 d.p. µ = 350 + (0.8416 × 18.84) = 365.85 A1 Allow 365.86, 366, 365.9 [5] 3 (iv) Φ-1 ( 0.975 ) = 1.96 B1 For using a suitable pair of z values e.g. ± 1.96 a = 365.85 – (1.96 18.84) M1 For either equation provided that a suitable pair of z-
values is used. e.g. +2.326 and –1.751
= 328.9 A1
FT their µ and σ to 2 d.p. (A0 if ‘continuity
correction’ used)
Accept any correct values of
a and b. b = 365.85 + (1.96 18.84) = 402.8 A1 FT their µ and σ to 2 d.p. (A0 if ‘continuity
correction’ used)
[4]
PMT
4767 Mark Scheme January 2013
12
Question Answer Marks Guidance 4 (a) H0: no association between grade and hours worked
H1: some association between grade and hours worked;
B1 Hypotheses in context
Less than 5hrs At least 5hrs
A or B 17.05 13.95 C or lower 15.95 13.05
M1 A1
Any row/column correct For expected values (to 2 dp)
Less than 5hrs At least 5hrs
A or B 0.5104 0.6238 C or lower 0.5456 0.6669
M1 A1
For valid attempt at (O-E)2/E. Any row column correct. For all correct
NB These M1A1 marks
cannot be implied by a correct final value of X 2
X 2 = 2.347 B1 Refer to χ1
2 M1 For 1 deg of freedom. No FT from here if wrong. Critical value at 5% level = 3.841 A1 CAO for cv or p-value = 0.1255. SC1 for cv or p-
value if 1 dof not seen.
Result is not significant. There is insufficient evidence to suggest that there is any
association between hours worked and grade. E1 For conclusion in context. NB if H0 H1 reversed, or
‘correlation’ mentioned, do not award first B1 or final E1
[9]
PMT
4767 Mark Scheme January 2013
13
Question Answer Marks Guidance 4 (b) x = 417.79 B1 For x
H0: μ = 420; B1 For use of 420 in hypotheses. Hypotheses in words must refer to population. Do not allow alternative symbols unless clearly defined as the population mean.
H1 : μ ≠ 420 B1 For both correct Where μ denotes the mean volume of the cans of tomato purée
(in the population) B1 For definition of μ. Condone omission of
“population” if correct notation μ is used, but if μ is defined as the sample mean then award B0.
Test statistic = 417.79 420 2.21 1.997
1.1073.5 / 10
M1* A1
must include √10 FT their
Lower 1% level 2 tailed critical value of z = – 2.576
B1* For –2.576 Must be –2.576 unless it is clear that absolute values are being used.
–1.997 > – 2.576 So not significant. There is insufficient evidence to reject H0
M1 dep*
For sensible comparison leading to a conclusion.
There is insufficient evidence to suggest that the average volumes of the cans of tomato purée is not 420ml
A1 For conclusion in words in context provided that correct cv used. FT only candidate’s test statistic.
[9]
PMT
4767 Mark Scheme January 2013
14
ADDITIONAL NOTES REGARDING QUESTION 4 (b) Critical Value Method 420 – 2.576 × 3.5 ÷ √10 gets M1*B1* = 417.148… gets A1 417.79 > 417.148.. gets M1dep* for sensible comparison A1 still available for correct conclusion in words & context Confidence Interval Method CI centred on 417.79 + or – 2.5756 × 3.5 ÷ √10 gets M1* B1* = (414.93…, 420.64..) gets A1 NOTE that the final M1dep* A1 available only if 2.576 used. “Contains 420” gets M1dep* A1 still available for correct conclusion in words & context Probability Method Finding P(sample mean < 417.79) = 0.0229 gets M1* A1 B1* 0.0229 > 0.005* gets M1dep* for a sensible comparison if a conclusion is made. A1 available for a correct conclusion in words & context. Condone P(sample mean > 417.79) = 0.9771 for M1* but only allow A1 B1* if sensible comparison made, at which point the final M1dep* and A1 are still available ADDITIONAL NOTE REGARDING OVER-SPECIFICATION OF ANSWERS Over-specification by providing final answers correct to 5 or more significant figures will be penalised. When this applies, candidates may lose no more than 2 marks per question and no more than 4 marks in total. The only exception to this rule is in Question 3 parts (iii) & (iv) – see guidance notes.
PMT
4767 Mark Scheme June 2013
8
Question Answer Marks Guidance 1 (i) EITHER:
Sxy = 1xy x yn
= 40.66 – 160
× 43.62 × 55.15
= 0.56595
M1*
For method for Sxy
Sxx = 22 1x x
n = 32.68 – 1
60× 43.622
= 0.96826
M1*
For method for at least one of Sxx or Syy
Syy = 22 1y y
n = 51.44 – 1
60× 55.152
= 0.74796
A1
For at least one of Sxy, Sxx or Syy (to 2 sf) Note Allow 0.57322 for Sxy and 0.76634 for Syy from rounding mean of y to 0.919.
r = xy
xx yy
SS S
= 0.565950.96826 0.74796
= 0.665 M1
dep* A1
For structure of r For answer rounding to 0.66 or 0.67
OR: [5]
cov(x,y) = xy
x yn
= 40.66/60 – (43.62/60 55.15/60)
= 0.0094325
M1*
For method for cov (x,y)
rmsd(x) = xxS
n= √(0.96826/60) = √0.016137… = 0.1270
M1*
A1
For method for at least one msd or rmsd
For at least one of cov (x,y), msd or rmsd correct (to 2 sf)
rmsd(y) = yyS
n= √(0.74796/60) = √0.012466 = 0.1117
r = cov( , )
rmsd( )rmsd( )x y
x y = 0.0094325
0.1270 0.1117 = 0.665
M1 dep*
For structure of r
A1 For answer rounding to0.66 or 0.67
[5]
Methods mixed – max M0M1A1M0A0
PMT
4767 Mark Scheme June 2013
9
Question Answer Marks Guidance 1 (ii) H0: ρ = 0
H1: ρ > 0 (one-tailed test) B1 For H0, H1 in symbols. Hypotheses in words must
refer to population. Do not allow alternative symbols unless clearly defined as the population correlation coefficient.
where ρ is the population correlation coefficient B1 For defining ρ. Condone omission of “population” if correct notation ρ is used, but if ρ is defined as the sample correlation coefficient then award B0. Allow “ρ is the pmcc”.
For n = 60, 5% critical value = 0.2144
B1 For critical value
Since 0.665 > 0.2144, the result is significant. M1 For sensible comparison leading to a conclusion provided that |r| < 1. The comparison can be in the form of a diagram as long as it is clear and unambiguous. Sensible comparison: e.g. 0.665 > 0.2144 is ‘sensible’ whereas 0.665 > - 0.2144 is ‘not sensible’. Reversed inequality sign e.g. 0.665 < 0.2144 etc. gets max M1 A0.
Thus we have sufficient evidence to reject H0 A1 For reject H0 o.e. FT their r and critical value from 5% 1-tail column.
There is sufficient evidence at the 5% level to suggest that there is positive correlation between FEV1 before and after the two-week course.
E1 For correct, non-assertive conclusion in context (allow ‘x and y’ for context). E0 if H0 and H1 not stated, reversed or mention a value other than zero for ρ in H0.
[6]
PMT
4767 Mark Scheme June 2013
10
Question Answer Marks Guidance 1 (iii) The underlying population must have a bivariate
Normal distribution. B1 Condone “bivariate Normal distribution”,
“underlying bivariate Normal distribution”, but do not allow “the data have a bivariate Normal distribution”
Yes, since the scatter diagram appears to have a roughly elliptical shape.
E1 Condone ‘oval’ or suitable diagram
[2] 1 (iv) The significance level is the probability of
rejecting the null hypothesis when in fact it is true.
E1*
E1dep*
For “probability of rejecting H0” or “probability of a significant result”. For “when H0 is true”
M1 for attempt to find P(Mark ≥ integer) A1 for 0.1135 A1 for 0.0982 M1 for comparisons
www
[5] 3 (v) P(Y ≤ 50) = 0.2
P(Z ≤ 50.512
) = 0.2
B1
For 50.5 used
50.512
= Φ-1 (0.2) = –0.8416 B1
M1
For –0.8416. Condone – 0.842 Condone 0.8416 if numerator reversed. For structure.
µ = 50.5 + (12 × 0.8416) = 60.6 A1 CAO [4]
PMT
4767 Mark Scheme June 2013
14
Question Answer Marks Guidance 4 (i) H0: no association between sex and artist preferred
H1: some association between sex and artist preferred B1 For both hypotheses in context
EXPECTED Monet Renoir Degas Cézanne Male 12.13 28 13.07 16.8 Female 13.87 32 14.93 19.2
M1 A2
For expected values (to 2 dp where appropriate) (allow A1 for at least one row or column correct)
CONTRIB’N Monet Renoir Degas Cézanne Male 1.4081 0.3214 1.8626 0.2881
Female 1.2321 0.2813 1.6298 0.2521
M1 A2
For valid attempt at (O–E)2/E For all correct (to 2 dp) and presented in a table or clear list. (Allow A1 for at least one row or column correct)
NB:These three marks cannot be implied by a correct final value of X 2
X 2 = 7.28 B1 Allow 7.27 www Refer to χ3
2 B1
for 3 deg of f
Critical value at 10% level = 6.251 B1
CAO for cv No FT from here if wrong or omitted, unless p-value used instead
B1 for p-value = 0.0636
Result is significant B1
FT their X2
There is evidence to suggest that there is some association between sex and artist preferred NB if H0 H1 reversed, or ‘correlation’ mentioned, do not award first B1 or final E1
E1
[12]
For correct (FT their X2), non-assertive conclusion, in context.
PMT
4767 Mark Scheme June 2013
15
Question Answer Marks Guidance 4 (ii) Monet: More females and fewer males than expected
prefer Monet, as indicated by large contribution(s) (of 1.4081 and 1.2321).
E1* E1dep*
FT their table of contributions NB MAX 3/6 for answers not referring to contributions (explicitly or implicitly).
Renoir: Preferences are much as expected, as indicated by small contributions.
E1
Degas: Fewer females and more males than expected prefer Degas, as indicated by large contribution(s) (of 1.8626 and 1.6298).
E1* depE1*
Cézanne: Preferences are much as expected, as indicated by small contributions.
E1 SC1 Renoir and Cézanne have correct comments for both but without referring to contributions