42
General Manager’s Report July 17, 2013

General Manager’s Report
July 17, 2013

Table of Contents
i
Products and Services Call Center ...........................................................................................................................1 Interactive Voice Response System (IVRS)........................................................................1 Delinquent Accounts Chart..................................................................................................2 Water Production Chart .......................................................................................................3 Wastewater Treatment Chart ...............................................................................................3
Infrastructure Asset Management Water & Wastewater Permit Compliance............................................................................4 Treated Final Effluent Spill at Piscataway ..........................................................................4 Trial Application for Reducing THMs ................................................................................4 New Wastewater Storage Facility .......................................................................................4 State Highway Administration FY 2014 Recreational Trails Program Grant .....................4 Sewer System Overflows Chart ...........................................................................................5 Basement Backups Chart .....................................................................................................5 Water Main Breaks / Leaks by Pipe Material & Size Chart................................................6 Water Main Breaks / Leaks Reported by Age Chart ...........................................................6 Water Main Breaks and Leaks Chart...................................................................................7 Water Main Reconstruction Charts .....................................................................................8 Sewer Main Repair & Replacement Charts.........................................................................9 Sewer Lateral Lines Charts................................................................................................10
Workforce Management Vacancies vs. Active Recruitments Chart..........................................................................11 Recruitment – Cumulative Average Year-to-Date time to Fill Vacancies Chart ..............12 Recruitment – May 2013 Average Time to Fill Vacancies Chart .....................................12 Voluntary and Involuntary Separations Chart ...................................................................13 Eligible Retirements Chart.................................................................................................13 Retirement Eligibility Projections Chart............................................................................14
Small, Local, Minority Business Enterprise SLMBE Office Outreach ...................................................................................................15 SLMBE Dashboard............................................................................................................17
Accomplishments and Community Outreach 64th Annual Short Courses for Water and Wastewater Operators ....................................18 Go Green Campaign ..........................................................................................................18 Employee Appreciation Day..............................................................................................18 Sewer Science Training .....................................................................................................18 Community Outreach Events.............................................................................................18
Budget Report Budget Charts ....................................................................................................................21

Products and Services
Call Center Operations In June 2013, the Call Center answered 89% of the 41,768 calls received, which is 2% lower than in June 2012. The answer rate being lower than 95% can be attributed to six days of training for the Go Green Campaign, as well as vacancies that have not yet been filled.
92% 92% 94% 96% 94% 91% 90% 93% 89% 89% 91% 89%
0%
10%
20%
30%
40%
50%
60%
70%
80%
90%
100%
Jul Aug Sep Oct Nov Dec Jan Feb Mar Apr May Jun
Percent of Calls Answered
FY 2012 FY 2013 Target
Interactive Voice Response System (IVRS) In June 2013, the IVRS processed 9,598 payments, for a total of $1,800,733. The average number of monthly payments processed through the IVRS in Fiscal Year 2013 was 8,923.
4,62
3
4,58
7
5,22
5
5,64
7
5,36
7
5,22
6
6,45
7
5,66
8
6,57
9
6,05
6
5,79
4
6,12
9
3,02
2
2,69
8 3,26
9
3,56
6
3,03
3
3,00
3
3,64
1
2,95
0 3,58
1
3,31
8
3,11
2
3,35
8
90
62
97 92
94
67
115
90
102
104
99 111
- 500
1,000 1,500 2,000 2,500 3,000 3,500 4,000 4,500 5,000 5,500 6,000 6,500 7,000 7,500 8,000 8,500 9,000 9,500
10,000 10,500
Jul Aug Sep Oct Nov Dec Jan Feb Mar Apr May Jun
FY 2013 IVRS Payments Received
Credit Card Payments Received Check-by-Phone Payments Received
Debit Card Payments Received Payments Received in FY 2012
1

Products and Services
0
1,000,000
2,000,000
3,000,000
4,000,000
5,000,000
6,000,000
7,000,000
8,000,000
9,000,000
January February March April May June
Delinquent Accounts(Accounts are considered delinquent seventeen days beyond the due date)
TOTAL AMOUNT DUE ‐ ACTIVE & SUSPENDED ACCOUNTS(Montgomery and Prince George's Counties)
Commercial Government Multi‐Family Units Residential
January February March April May June
Commercial 1,184,033.54$ 1,143,864.62$ 1,085,069.21$ 1,041,632.47$ 934,572.16$ 1,115,408.43$ Government 176,284.22$ 115,648.00$ 107,446.27$ 187,865.81$ 188,880.36$ 168,196.00$ Multi‐Family Units 380,352.10$ 416,231.89$ 563,415.79$ 449,836.86$ 525,644.71$ 443,343.61$ Residential 6,747,368.07$ 6,306,216.86$ 6,314,982.71$ 6,217,928.65$ 6,071,163.81$ 6,486,802.46$ TOTAL 8,488,037.93$ 7,981,961.37$ 8,070,913.98$ 7,897,263.79$ 7,720,261.04$ 8,213,750.50$
2

Products and Services
July Aug Sept Oct Nov Dec Jan Feb Mar Apr May JunFY 2012 Actual 201.8 182.9 168.1 161.1 155.1 153.3 153.6 151.2 151.1 162.3 167.6 181.2FY 2013 Actual 188.8 178.0 169.1 158.9 153.4 150.5 153.3 152.9 149.5 153.3 158.8 166.8FY 2013 Budget 170.0 170.0 170.0 170.0 170.0 170.0 170.0 170.0 170.0 170.0 170.0 170.0
0
25
50
75
100
125
150
175
200
225
250
Mill
ion
Gal
lons
per
Day
Water Production
July Aug Sept Oct Nov Dec Jan Feb Mar Apr May JunFY 2012 Actual 163.5 173.2 218.0 190.6 184.8 203.8 190.3 180.7 184.9 174.5 171.6 167.9FY 2013 Actual 162.7 161.1 160.5 178.3 177.1 177.8 183.5 182.2 190.9 181.8 179.7FY 2013 Budget 214.5 214.5 214.5 214.5 214.5 214.5 214.5 214.5 214.5 214.5 214.5 214.5
0
25
50
75
100
125
150
175
200
225
250
Mill
ion
Gal
lons
Per
Day
Wastewater Treatment(Includes wastewater treated at Blue Plains Facility)
3

Infrastructure Asset Management
Water & Wastewater Permit Compliance In the month of June there were zero violations for both drinking water quality permits and wastewater effluent permits. Treated Final Effluent Spill at Piscataway On June 26, 2013 there was a 7,000-gallon discharge onto the ground of treated final effluent at the Piscataway Wastewater Treatment Plant (WWTP). The spill occurred while pumping the effluent back to the head of the plant after it had been diverted to the ponds to facilitate inspection of the 108-inch effluent pipe in support of the Piscataway Facility Plan. This was reported to MDE and the Prince George’s County Health Department. Trial Application for Reducing Trihalomethanes (THMs) A Grid-Bee water mixing system was installed in the Fort Washington Elevated Tank on June 27, 2013. This trial installation will test the effectiveness of removing THMs (chemical compounds that are considered environmental pollutants) from the water in the tank. Trihalomethanes are formed as a by-product predominantly when chlorine is used to disinfect water for drinking. They represent one group of chemicals generally referred to as disinfection by-products. THMs result from the reaction of chlorine and/or bromine with organic matter present in the water being treated. Under the new Stage 2 Disinfectants and Disinfection Byproducts (DBP) rule, WSSC is required to meet stricter THM limits throughout our entire distribution systems and not just an average for the system as was required in the past. The Grid Bee trial is to determine if THMs can be reduced in our elevated tanks which are required under the Stage 2 rule. If the data supports that it works, we will utilize Grid Bee (or similar) systems at those elevated tanks where THMs are regularly a problem, usually on the fringes of our distribution system. New Wastewater Storage Facility
Testing of the new Anacostia Storage Facility was successfully completed and substantial completion was issued on June 27, 2013. This new facility is now available for use and will provide seven-million gallons of sewer overflow storage to address weather-related sanitary sewer overflows at the Anacostia II Wastewater Pumping Station (WWPS). State Highway Administration (SHA) FY 2014 Recreational Trails Program Grant
WSSC submitted a grant application to the SHA FY 2014 Recreational Trails Program requesting funding to improve signage on the various trails around the Triadelphia and Rocky Gorge reservoirs.
4

Infrastructure Asset Management
July Aug Sept Oct Nov Dec Jan Feb Mar Apr May JuneFY 2013 Other 0 0 0 2 1 0 0 0 0 0 0 0FY 2013 Overflowing Manholes 6 9 10 10 18 5 12 15 13 22 8 125-Year Avg By Month 14 11 10 12 10 16 16 14 19 12 16 12FY 2012 Actual 14 19 15 11 6 27 15 11 19 8 6 16
0
5
10
15
20
25
30
# of S
SOs
Sanitary Sewer Overflows
Please Note: "Other" includes clean outs, force mains, wastewater pumping station overflows, etc.
July Aug Sept Oct Nov Dec Jan Feb Mar Apr May JuneFY 2013 Svc Line (Laterals) 31 32 27 50 87 50 60 72 60 74 54 36FY 2013 Mainline 21 12 20 33 20 19 29 25 32 34 15 345-Year Avg By Month 56 62 66 65 78 88 83 77 82 82 77 71FY 2012 Actual 58 84 83 73 88 100 89 83 67 76 44 63
0
50
100
150
Num
ber o
f Bac
kups
Basement Backups
5

Infrastructure Asset Management
0
10
20
30
40
50
60
70
80
90
100
Total By Material By Pipe Size
50
38
12
44
6
# of
Wat
er M
ain
Bre
aks
and
Leak
s
Water Main Breaks / Leaks by Material and Size
Under 12"12" to 34"36" and aboveOther
Total Breaks and Leaks
Cast IronDuctile PCCPUnknown
There were 50 breaks and leaks reported in the month of June. The data shows that 76% of the breaks and leaks resulted from pipes made of cast iron material and 88% of the pipes were under 12 inches in diameter.
0
10
20
30
40
50
60
70
80
90
100
1
50
2
2820#
of W
ater
Mai
n B
reak
san
d Le
aks
Water Main Breaks/Leaks by Pipe Age
Total Breaks/Leaks Under 25 Years 25-50 Years Over 50 Years
There were 50 breaks and leaks reported in the month of June. The data shows that 56% of the breaks and leaks reported, occurred in pipes 25-50 years old.
6

Infrastructure Asset Management
Jul Aug Sep Oct Nov Dec Jan Feb Mar Apr May JunFY 2012 Actual 59 84 97 160 187 227 301 84 55 41 46 61FY 2013 Actual 55 62 91 188 316 302 348 155 84 59 41 505-Year Avg. by Month 58 63 83 180 265 403 394 127 58 46 42 55
0
50
100
150
200
250
300
350
400
450
# of
Bre
aks
& L
eaks
Water Main Breaks & LeaksBreaks and leaks for the reporting month are unconfirmed, pending field verification
7

Infrastructure Asset Management
Jul Aug Sept Oct Nov Dec Jan Feb Mar Apr May JunContract Work 3.26 3.58 2.88 4.96 2.21 3.24 3.13 2.49 1.97 3.66 4.15 4.80In-House Work 0.75 1.08 0.95 0.77 0.79 0.75 0.98 0.83 1.25 1.38 1.26 1.22FY 2013 Goal - Monthly 5.0 5.0 5.5 5.0 4.0 2.5 0.5 0.5 2.5 5.0 5.0 5.5
0
1
2
3
4
5
6
7
8#
of M
iles
Water Main Reconstruction Completed
Jul Aug Sept Oct Nov Dec Jan Feb Mar Apr May JunMiles Constructed 4.01 8.67 12.50 18.23 21.23 25.22 29.33 32.65 35.87 40.91 46.32 52.34FY 2013 Goal - Cumulative 5.0 10.0 15.5 20.5 24.5 27.0 27.5 28.0 30.5 35.5 40.5 46.0
0
5
10
15
20
25
30
35
40
45
50
Cum
ulat
ive
# of
Mile
s
Cumulative Water Main Reconstruction Completed
8

Infrastructure Asset Management
July Aug Sept Oct Nov Dec Jan Feb Mar Apr May JunGrouting/Point Repairs 0.47 1.34 2.06 1.59 2.5 1.24 3.82 1.4 0.71 2.68 2.77 0.24Main Line Bursting 0.15 0.18 0.06 0.21 0.18 0.1 0.25 0.38 0.29 0.33 0.34 0.44Main Line Lining 0.81 3.21 4.06 2.69 4.85 1.64 2.11 0.79 0.28 1.65 1.21 5.52Main Line Replacement 0.18 0.35 0.4 0.34 0.29 0.16 0.89 0.28 0.39 0.46 0.29 1.03FY 2013 Goal - Monthly 4.42 4.42 4.42 4.42 4.42 4.42 4.42 4.42 4.42 4.42 4.42 4.42
0
2
4
6
8
10#
of M
iles
Sewer Main Repair & Replacement Completed
July Aug Sept Oct Nov Dec Jan Feb Mar Apr May JunSewer Main - Cumulative 1.61 6.69 13.27 18.1 25.92 29.06 36.13 38.98 40.65 45.77 50.38 57.61FY 2013 Goal - Cumulative 4.42 8.84 13.26 17.68 22.10 26.52 30.94 35.36 39.78 44.20 48.62 53.04
0
5
10
15
20
25
30
35
40
45
50
55
60
Cum
ulat
ive
# o
f Mile
s
Cumulative Sewer Repair & Replacement Completed
9
Infrastructure Asset Management
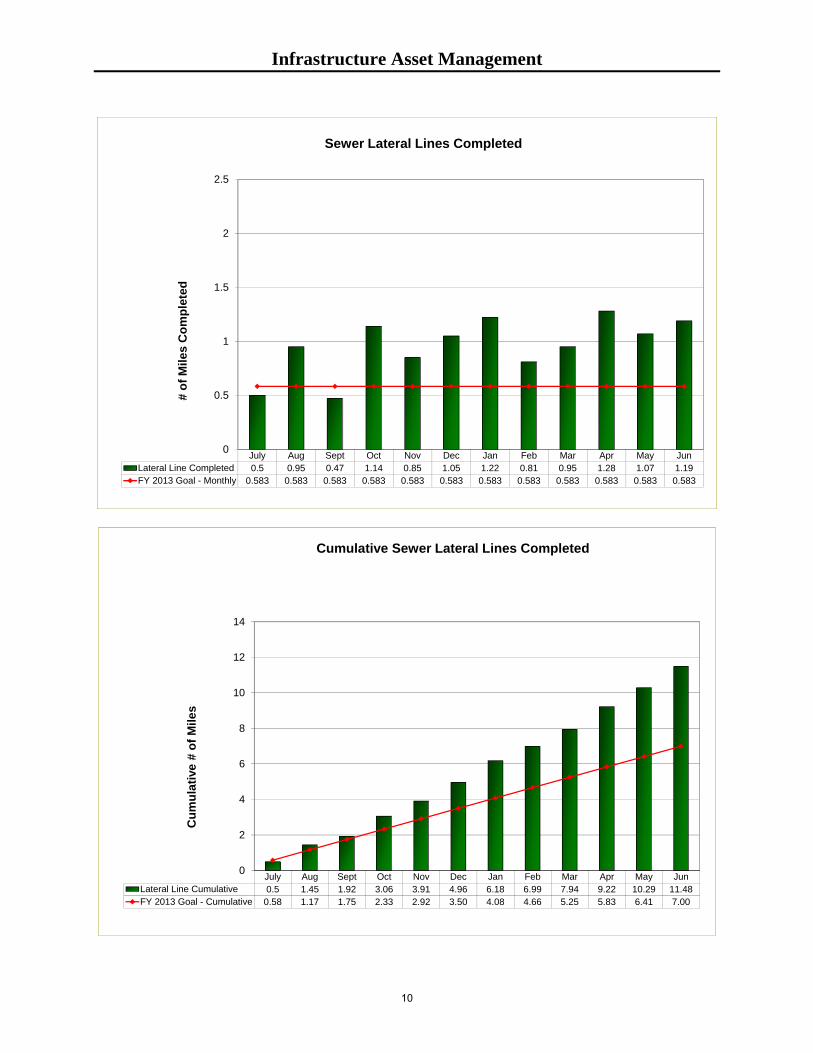
July Aug Sept Oct Nov Dec Jan Feb Mar Apr May JunLateral Line Completed 0.5 0.95 0.47 1.14 0.85 1.05 1.22 0.81 0.95 1.28 1.07 1.19FY 2013 Goal - Monthly 0.583 0.583 0.583 0.583 0.583 0.583 0.583 0.583 0.583 0.583 0.583 0.583
0
0.5
1
1.5
2
2.5#
of M
iles
Com
plet
ed
Sewer Lateral Lines Completed
July Aug Sept Oct Nov Dec Jan Feb Mar Apr May JunLateral Line Cumulative 0.5 1.45 1.92 3.06 3.91 4.96 6.18 6.99 7.94 9.22 10.29 11.48FY 2013 Goal - Cumulative 0.58 1.17 1.75 2.33 2.92 3.50 4.08 4.66 5.25 5.83 6.41 7.00
0
2
4
6
8
10
12
14
Cum
ulat
ive
# of
Mile
s
Cumulative Sewer Lateral Lines Completed
10

Workforce Management
Vacancies vs. Active Recruitments There were 147 total vacancies across the Commission at the end of May 2013. Seventy-seven percent (113) of these positions are being actively recruited.
62%
51%
49%
40%
46%
40%
25%
29%
36%
32%
23%
38%
49%
51%
60%
54%
60%
75%
71%
64%
68%
77%
0%10%20%
30%40%
50%60%
70%80%
90%100%
Jul Aug Sep Oct Nov Dec Jan Feb Mar Apr May Jun
Vacancies vs. Active Recruitments(FY 2013 Total WSSC Authorized Positions = 1693)
Vacancies Not Recruited Vacancies Recruited
Jul Aug Sep Oct Nov Dec Jan Feb Mar Apr May Jun
Total Vacancies 208 174 173 145 146 143 147 147 152 148 147# Vacancies Recruited 78 85 89 87 79 57 110 105 98 101 113# Vacancies Not Recruited 130 89 84 58 67 86 37 42 54 47 34% Vacancies Recruited 38% 49% 51% 60% 54% 40% 75% 71% 64% 68% 77%% Vacancies Not Recruited 63% 51% 49% 40% 46% 60% 25% 29% 36% 32% 23%FY 13 Authorized Positions 1693 1693 1693 1693 1693 1693 1693 1693 1693 1693 1693 1693
11

Workforce Management
Recruitment – Cumulative Average Year-to-Date Time to Fill Recruited Vacancies Our time-to-fill cycle begins three weeks (the minimum regular posting period) after the job is posted through the date the candidate accepts the offer. Our cumulative average time-to fill is 34% higher than last fiscal year. The FY 2013 year-to-date cumulative average time-to-fill was 76 days.
Recruitment – May 2013 Average Time to Fill Vacancies The average time-to-fill the eighteen positions below was 76 days, which includes an average of 42 days with hiring managers, an average of 23 days with HR, as well as the time it takes for an applicant to make a decision or to decline an offer.
436
61 92 100
71 71 65 10 7 12 12 11 46 40 51 31 27 300
50
100
150
200
250
300
350
400
450
500
1 2 3 4 5 6 7 8 9 10 11 12 13 14 15 16 17 18
Days to Fill
Position No.Days to Fill Average Target
Target (45 days)
May 2013 Time to Fill
Average (76 days)
12

Workforce Management
Voluntary and Involuntary Separations There were ten separations including five retirements, two voluntary and three involuntary separations in May 2013.
0
2
4
6
8
10
12
Jul Aug Sep Oct Nov Dec Jan Feb Mar Apr May Jun
Separations - FY 2013
Retirements Other Voluntary Separations Involuntary Separations
Eligible Retirements
122
126
130
137
132
135
145
130
176
152
136
651
654
654
650
652
645
647
644
599
635
635
0
100
200
300
400
500
600
700
July Aug Sep Oct Nov Dec Jan Feb Mar Apr May Jun
# El
igib
le
Eligible Retirements - FY 2013
Eligible - Full Eligible - Early
13

Workforce Management
Retirement Eligibility Projections As of May 2013, approximately 50% of WSSC employees are eligible to retire now, either with full or early retirement.
136 198322
461
635623
596532
0
200
400
600
800
1000
1200
Eligible Now Eligible Within 1 Year Eligible Within 3 Years Eligible Within 5 Years
Eligible Retirements - Current and Future
Full Retirement Early Retirement
Eligible NowEligible Within 1
YearEligible Within 3
YearsEligible Within 5
YearsFull Retirement 136 198 322 461Early Retirement 635 623 596 532Full Retirement % 8.7% 12.7% 20.6% 29.5%Early Retirement % 40.6% 39.9% 38.1% 34.0%Total WSSC Workforce 1563
14

Small, Local and Minority Business Enterprise Office
SLMBE Office Outreach Appendix A and Good Faith Efforts (GFE) Training On June 10, 2013, the SLMBE Office hosted its monthly workshop “Understanding the Appendix A for MBE/SLBE/SLMBE Participation and the Good Faith Efforts (GFE) Guide” to help vendors/suppliers understand the Appendix A section of solicitations as they prepare their response for participation goals/requirements. Approximately thirteen vendors attended the workshop and presented positive feedback. Special Outreach Event: Cyber Security Vulnerability Assessment, Solicitation No. IFB 1080On June 19, 2013, the SLMBE Office hosted a special outreach event for Cyber Security Vulnerability Assessment for Solicitation No. IFB1080. The event provided attendees with an opportunity to: learn about the responsibilities and requirements related to the Cyber Security Vulnerability Assessment solicitation; network among potential prime consultants and sub-consultants; and learn about the SLMBE Program. Approximately seventy-nine vendors attended the event. Web-Based Compliance System TrainingsOn June 17 and June 18, 2013, the SLMBE Office hosted its monthly classes to train prime and minority vendors, as well as internal stakeholders on the best way to utilize and operate WSSC’s web-based compliance system so that they can effectively monitor and track contract performance and payments. Approximately nine vendors attended. Hispanic Hero’s Gala On June 20, 2013, the SLMBE Office attended the 2013 U.S. Hispanic Youth Entrepreneur Education (USHYEE) 7th Annual Hispanic Hero Awards Gala. The event was held at the BWI Marriott in Baltimore, Maryland. This year the Hispanic Hero Gala presented five individuals with the Legend Award Distinction. Approximately 200 vendors attended the event. GWHCC’s 36th Annual Gala On June 21, 2013, the SLMBE Office attended the Greater Washington Hispanic Chamber of Commerce’s 36th Annual Gala. The Gala serves as an opportunity for the Chamber to highlight the importance and the influence of the Hispanic business community in the Washington, DC area, and to celebrate the Chamber’s accomplishments with its members, sponsors, partner organizations, corporations and the community at-large. Approximately 350 vendors attended the event. Women of Prince George’s County “End of Season” Event On June 21, 2013, the SLMBE Office attended the Women of Prince George’s event at the National Harbor in Oxon Hill, Maryland. Marissa Levin, author of “My Company ROCKS!” was the guest speaker. Approximately 25 vendors attended the event.
15

Small, Local and Minority Business Enterprise Office
2013 Minority Business Enterprise University Conference On June 27, 2013, the SLMBE Office exhibited and participated in the matchmaking and panel sessions with the Governor’s Office of Minority Affairs (GOMA), in collaboration with the Montgomery County Department of Economic Development MBE University Conference in Silver Spring, Maryland. The theme for the conference was Pathways to Procurement. Opening remarks were given by the special secretary of the Governor’s Office of Minority Affairs Zenita Wickham Hurley and Montgomery County Executive Isiah Leggett. The keynote speaker for the power lunch was the National Director of the Minority Business Development Agency. Approximately 150 vendors attended the event. Southern Maryland Black Chamber of Commerce Regional Business and Procurement Matchmaking event On June 27, 2013, the SLMBE Office participated in the matchmaking session at the Southern Maryland Black Chamber of Commerce Regional Business and Procurement Matchmaking event held at the College of Southern Maryland in LaPlata. This event offers government entities, educational institutions, private industry, other contracting bodies and financial institutions an opportunity to meet and dialogue with regional small, women, veteran, disabled and minority owned businesses regarding current and future contracting opportunities. Approximately125 vendors attended the event. Information Technology (IT) and Production Team “Vendor Days” On June 25 and June 26, 2013, the SLMBE Office hosted the Information Technology (IT) and Production Team “Vendor Days” and Matchmaking sessions. There were over 250 vendors that registered for these events. Opening remarks were given by the SLMBE Office, followed by presentations from both IT Division Managers and Production Group Leaders, detailing current and upcoming projects. After the presentations, matchmaking sessions were held in the Auditorium, where WSSC’s managers answered specific questions and discussed upcoming contracting opportunities. This allowed each participating vendor to meet with IT Division Managers and Production Group Leaders and address specific questions or concerns. Approximately 200 vendors attended the event.
16

Small, Local and Minority Business Enterprise Office
SLMBE Dashboard
This month’s SLMBE dashboard is unavailable due to a focused and concerted effort to complete and finalize the reconciliation of all twelve months of data for fiscal year-end close out in preparation for the FY 2013 Legislative Report.
17

Accomplishments and Community Outreach
64th Annual Short Courses for Water and Wastewater Operators Forty employees from the Production Team participated in the Annual Short Course training in Emmitsburg, MD in early June. The employees either attended as students, participated as instructors, or hosted the event as members of the Short Course staff. Go Green Campaign WSSC has completed a successful three-month campaign to promote Go Green, our paperless billing initiative. The campaign aired on four Washington-area radio stations, including a Spanish-speaking station as well as the Washington Post online. The Commission added 17,500 customers to Go Green in the past three months for an annual savings of $49,700 in printing and mailing costs. Since its inception in November 2012, a total of 43,000 customers have enrolled in Go Green which saves the Commission $213,000 and 258,000 pounds of paper. Employee Appreciation Day More than 1,000 employees and family members turned out for the annual Employee Appreciation Day held June 22, 2013 at the Bladensburg Waterfront Park. The change in venue was well-received by employees. In addition to a lot of good food, guests enjoyed the team competition, activities on the water, games for children, and bingo. Chair Gene Counihan was in attendance along with Commissioners Adrienne Mandel, Antonio Jones and Melanie Hartwig-Davis. Sewer Science Training Fourteen teachers received Sewer Science training from WSSC staff which will allow them to incorporate the course into their science curriculum during the 2013-2014 school year. On June 25, 2013, six Montgomery County teachers were trained at the Seneca Wastewater Treatment Plant and on June 26, 2013, eight Prince George’s County teachers received the training at the Parkway Wastewater Treatment Plant. Community Outreach Events June 8, 2013 Tree of Life’s Community Day Clinton, MD
Staff provided customers with information to help them conserve water and save on their WSSC bill.
June 12, 2013 Community Service at Langley Park Hyattsville, MD
As part of Prince George’s Transforming Neighborhoods Initiative, WSSC sponsored a community service opportunity for students in need of service learning hours. Working with a teacher at Langley Park-McCormick Elementary School, students learned about the importance of riparian buffers as they weeded the community garden. WSSC sponsored a second opportunity on June 19, 2013.
June 12, 2013 Early Life in Colonial U.S. Laurel, MD Erin Meyers from the Claude Moore Colonial Farm in McLean, Virginia shared information about the difficulties of working farmers during the colonial times at a lunch and learn session.
18

Accomplishments and Community Outreach
June 12, 2013 Gaithersburg Depot Helps the Environment Gaithersburg, MD In an effort to support environmental stewardship and help the Muddy Branch watershed, staff used their lunch break to clean up trash around the Gaithersburg Depot.
June 15, 2013 District IV Dance-Off Oxon Hill, MD Prince George’s County District IV Police Station held a dance-off for teens and residents from Oxon Hill, Glassmanor and Forest Heights. WSSC was there to promote the “Can the Grease” message.
June 22, 2013 Fairwood Community Day Bowie, MD WSSC provided information about our Go Green initiative and answered customer inquiries while staffing a booth at the event.
June 27, 2013 AWRA’s “Healthy Forests=Healthy Waters” Hartford, CT
Kimberley Knox, Community Outreach Manager, shared information on WSSC’s environmental stewardship program by presenting “Creating a Forest of Supporters” for the American Water Resources Association’s specialty conference, “Healthy Forests=Healthy Waters.”
19

Budget Report
Monthly Status Report – May 2013
See attached report.
20

Budget Report
Operating Revenues Chart
$0
$10,000
$20,000
$30,000
$40,000
$50,000
$60,000
Jul Aug Sep Oct Nov Dec Jan Feb Mar Apr May Jun
$ In
Thou
sand
s
Operating Revenues
FY 2013 Actual FY 2012 Actual FY 2011 Actual
Operating Expenses Chart
$0
$10,000
$20,000
$30,000
$40,000
$50,000
$60,000
$70,000
$80,000
Jul Aug Sep Oct Nov Dec Jan Feb Mar Apr May Jun
$ In
Thou
sand
s
Operating Expenses
FY 2013 Actual FY 2012 Actual FY 2011 Actual
21
Budget Report
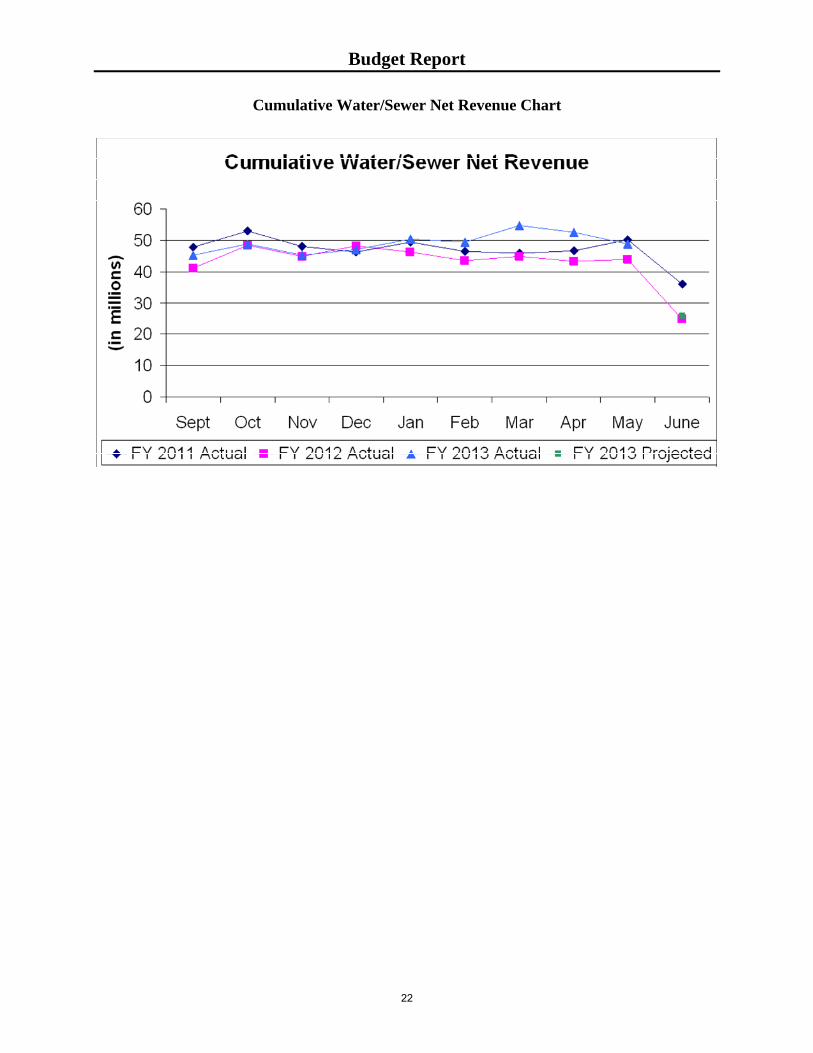
Cumulative Water/Sewer Net Revenue Chart
22


