Page 1
Acta Technica Napocensis: Civil Engineering & Architecture Vol. 56, No. 2 (2013) Journal homepage: http://constructii.utcluj.ro/ActaCivilEng
Special Issue: First International Conference for PhD Students in Civil Engineering, CE-PhD 2012.
Generalization of the Novel, Ayrton-Perry Formula Based Method for
Lateral-Torsional Buckling of Members
Bettina Badari*1
, Ferenc Papp2
1,2 Budapest University of Technology and Economics, Dept. of Structural Engineering, 3-5 Műegyetem rkp.,
1111, Budapest, Hungary
(Accepted 28 August 2013; Published online 30 September 2013)
Abstract
Many theses have been published on the now much-discussed phenomenon of lateral-torsional (LT)
buckling of beams with the aim of solving the problems of design formulae given by the EN 1993-1-
1. In this paper a novel Ayrton-Perry formula based method is introduced for the calculation of LT
buckling resistance of beams. According that, the finite element model is detailed which was used
for the numerical tests needed to produce the calibration database. For the proper modeling, the
consequence of different types of geometrical and material imperfection is examined. The
calibration method of the formula is described in this paper for the case of simple beams and a
novel method is proposed for the calculation of the LT buckling resistance. The generalization of
the novel method is examined for beams with prevented end-warp, loaded by constant moment
distribution and beams loaded by triangular moment distribution. Samples are presented for the
examined cases.
Keywords: LT buckling, Ayrton-Perry formula, calibration and generalization, imperfection,
prevented end-warp, triangular moment-distribution
1. Research work on the novel Ayrton-Perry formula
During the analysis of steel structures the determination of the stability resistance is one of the most
significant verification since usually the loss of stability is the governing problem. For these
complex mechanical behaviors the Eurocode standards endeavor to give simplified methods to
make the design process easier. One of the most important simplifications is the principle of
member isolation whose widespread application is the effective length method [3]. This method
specifies the boundary conditions of a single member through the definition of an effective length
which is used to evaluate simple stability equations on a virtual equivalent member. The drawback
of this method arises from that the number of possible structural configurations is unlimited,
however standard equations can be provided only for specific cases. Therefore, despite the
complexity of the interaction factors presented in Eurocode 3, the range of application is very
limited [4].
An appropriate solution for the above problem is the Global type Design Approach (GDA) which
uses one single model for both the mechanical analysis and for stability design. Through GDA the
* Corresponding author: Bettina Badari Tel./ Fax.: +36 30 5889565
E-mail address: [email protected]
Page 2
Bettina Badari, Ferenc Papp / Acta Technica Napocensis: Civil Engineering & Architecture Vol. 56 No 2 (2013) 27-42
28
same structural model is evaluated using a Global Model based Buckling Analysis (GMBA) instead
of doing calculations on a virtual equivalent member, which gives realistic results for the stability
problems of the structure. Therefore, the GDA reveals a deeper insight into the structural behavior
of the model. Unfortunately, design rules to support the results of the GMBA are not properly
developed yet, hence the advantages of the GDA cannot be utilized by the practising engineers.
Eurocode 3 allows applying the principles of GDA through the Overall Imperfection Method or the
General Stability Method, but the guidance is not comprehensive and includes several restrictions
making the application difficult.
Recognizing the demand for a complete, entirely derived and comprehensively verified design
method, a new research work started according to the GDA. The aim of the work is the
development of a novel stability design process based on the generalized Ayrton-Perry formula.
The derivation of the equations of the formula is introduced in [1] for the case of the LT buckling of
simple, prismatic beams with I-shaped sections, end-fork, free to warp boundary conditions,
subjected to pure bending (hereinafter basic model). As the first step of the research it was
examined that the formulae determined in [1] how can be calibrated and a beneficial, novel method
with the calibrated formulae can be proposed or not. For the results of an initial, representative test
program it was proved that the Ayrton-Perry formula is appropriate and has many advantages for
the case of simple beams [2]. In further work the calibration process of the formula was carried out
for an extended test program and a novel method was proposed for the stability design of the basic
model [5].
In this paper the novel, calibrated Ayrton-Perry formula based method for LT buckling of simple
beams is presented and the generalization is examined. The subjects of the examination are the
beams with boundary conditions different from the basic model (namely end-fork with prevented
end-warp) and the beams with triangular moment distribution. In the paper the proposed method is
detailed for the three examined cases through examples.
2. Finite element model for numerical tests
For the examinations and the calibration GMNI calculations of tested members were carried out to
determine the needed LT buckling resistances. The numerical simulations of beams with different
load distributions and boundary conditions were carried out by shell finite element models, in
ANSYS software. The steel members were modeled with simplified cross-sections shown in Fig. 1-
a, which were equivalent with the hot-rolled I-sections chosen for the tests. The geometry of the
cross-sections and the length of the members were given by input parameters for the model
creation. At the ends of the beams specific models of supports were defined, where every nodes of
each cross-sections were connected to a master node, see in Fig. 1-a. With this construction the
boundary conditions of warp and different types of supports could be specified on one node, and at
the same time the numerical errors arising from the concentrated conditions could be avoided. The
force and moment type loads of beams were defined in form of stress on the lines of end-sections.
Material and geometrical imperfections were modeled on members, which will be detailed later.
The models were constructed with 4-node, SHELL181 type finite strain shell elements, which can
model the nonlinear behavior. Examinations were performed to determine the effect of changing the
size of longitudinal and transverse finite element mesh on the result of numerical simulations.
Based on the findings of the tests, division into 100 parts was chosen along the members to get
properly accurate numerical simulations with optimal computational time. However these aspects
did not justify, the accurate modeling of residual stresses needed small size finite element mesh in
transverse direction. Therefore, along the half of flanges and also the web division into 6 parts was
chosen, shown in Fig. 1-a. The material behavior of the beams was modeled with linear elastic-
Page 3
Bettina Badari, Ferenc Papp / Acta Technica Napocensis: Civil Engineering & Architecture Vol. 56 No 2 (2013) 27-42
29
ideally plastic material model with E = 210GPa Young-modulus and yield criterion belonging to
the standard yield strength of the material grade.
Figure 1. a- FEM model of beams; b - M-v curves of HEB300 with different residual stress models
To model the residual stresses of the members, mainly two types of distribution can be found in use
at the international research works. These are the triangular distribution on the flanges and also the
web (e. g. in [7]) and the parabolic distribution (e. g. in [8]). Boissonnade et al. carried out
numerical simulations to examine the differences between the LT buckling resistances of beams
with different residual stress distributions for the case of end-fork boundary conditions [8].
Similarly to this research, we carried out numerical simulations on beams with prevented end-warp
conditions to prove the validity of previous findings in [8]. The Fig. 1-b shows examples for the test
results. On the diagram the bending moment is plotted over the lateral displacement of the midpoint
of upper flange, hereinafter the M-v curves of beams with HEB300 profile, 8500mm member
length and S355 material grade are shown. In Fig. 1-b the solid line belongs to the results of
member with triangular distribution, long-dashed line to the parabolic used in [8], and short-dashed
line to the parabolic determined in [6]. Based on the results it can be stated that the differences
between the behavior of beams with different residual stress distributions are negligible. The largest
difference between the ultimate bearing capacities of beams presented as examples in Fig. 1-b was
less than 2%. In further numerical tests the parabolic residual stress distribution determined in [6]
was used with amplitude depending on the geometry of the cross-section: if the height/width (h/b)
ratio of the profile is over 1,2 the maximum value of residual stress at the top of flanges is equal to
the 30% of the yield strength (0,3∙fy), otherwise (h/b ≤ 1,2) it is 0,5∙fy.
In the international publications many of different types of geometric imperfections can be found
for the modeling of the initial geometry of members. Based on the results of sensitivity analysis it
can be stated that one of the most important factors is the geometric imperfection in terms of LT
buckling resistance [9]. Therefore, it is an important question that the geometric imperfections with
different types and values how can change the carrying capacity of beams. Boissonnade et al.
examined this effect in [8], where the LT buckling resistances of beams with end-fork boundary
conditions were determined and compared belonging to different initial geometries. We performed
tests with similar aim for the case of beams with end-fork boundary conditions and with prevented
end-warp. In course of the examination the M-v curves of members given as results of numerical
simulations were compared belonging to different initial geometric imperfections, shown on the
diagrams in Fig. 2. In Fig. 2-a the M-v curves of the member with HEB300 profile, 8500mm length
and S355 material grade can be seen. On the diagram the lines belong to lateral bow imperfection,
initial geometry affine to the first eigenmode and two modified first eigenmode with the changing
of the ratio between the lateral displacement and rotation (hereinafter v0/φ0), as shown in Fig. 2-a.
In all of these cases the total initial lateral displacement of the midpoint of upper flange was
specified in value L/1000, where L is the length of the member. With the same test member we
Page 4
Bettina Badari, Ferenc Papp / Acta Technica Napocensis: Civil Engineering & Architecture Vol. 56 No 2 (2013) 27-42
30
carried out numerical simulations to examine the effect of changing the amplitude of the
imperfection on the LT buckling resistance, for the case of initial geometry affine to the first
eigenmode. The M-v curves belonging to this examination are shown in Fig. 2-b.
Figure 2. M-v curves of HEB300 with different a- types and b - amplitudes of imperfection
The results of the performed tests show that the LT buckling resistance of the beam with HEB300
(and with also examined IPE500) profile is more sensitive to the rotation type initial imperfection.
It can be seen that the decrease of the v0/φ0 ratio of initial geometry induces the decrease of load
carrying capacity of the member. Belonging to the different initial geometric imperfections the
difference between the maximum values of the bending moment carried by the members is
negligible, less than 2,5%. Based on our and international results of numerical tests it can be stated
that the type of the geometric imperfection, the initial geometry of the beams has not significant
effect on the LT buckling resistance. However, the increasing of the amplitude of imperfection from
the value L/2000 to L/200 causes substantial, approximately 13% decrease in the carrying capacity,
see in Fig. 2-b. In further numerical tests the initial geometry of the members was defined as affine
to the first eigenmode depending on the boundary conditions with the amplitude equal to L/1000, in
accordance with the international practice.
With the steel members chosen for the tests geometrical and material non-linear, imperfect (GMNI)
analysis were carried out. The behavior and accuracy of the model was verified by the published
results of numerical simulations of international research works in [4, 5, 8]. In these papers the
authors published LT buckling curves belonging to different profiles, which were compared to the
results of our finite element model. Our models of members used for the tests were constructed with
the same geometric, material imperfections and material models as these were defined in the
international publications. Own and published experimental results were in well approximation, the
differences were acceptable.
3. Novel method for the LT buckling of simple beams
3.1 Ayrton-Perry formula for the theoretical basis of the novel method
As it was mentioned, the Ayrton-Perry formula provides the basic of the novel method, which was
generalized for the case of simple beams. In [1] it was proved that most important stage of the
generalization is the properly chosen shape for the initial geometric imperfection. Accordingly, if
the first buckling mode is applied for the initial geometry, the generalization of the Ayrton-Perry
formula becomes possible - [1]. For the case of the basic model the first buckling mode can be
described by the following condition for the imperfection components:
Page 5
Bettina Badari, Ferenc Papp / Acta Technica Napocensis: Civil Engineering & Architecture Vol. 56 No 2 (2013) 27-42
31
cr
cr
N
Mv
0
0
(1)
where v0 and φ0 are the amplitudes of lateral and torsional imperfections with half-sine wave shape,
Mcr is the elastic critical bending moment of the member and Ncr is the elastic critical buckling load
about the minor axis.
After having the condition for the initial geometry the first yield criterion can be constructed in
terms of the second order internal forces at midspan. Introducing the standard notations for the
slenderness cryyLT MfW / and reduction factor for LT buckling )/( yyyLT fWM , the
standard quadratic form of the Ayrton-Perry formula can be obtained [1]:
0111
1222
2
LT
LT
LTLT
LTLT
(2)
where the generalized imperfection factor has the following form:
W
W
M
IG
W
W
W
Wv
y
cr
t
z
yy
LT
000 (3)
In the equations Wy , Wz and Wω are the elastic major axis, minor axis and warping sectional
modules of the cross-section respectively, fy is the yield strength, My is the uniform major axis
bending moment, G is the shear modulus of the material and It is the St. Venant torsional constant.
It is relevant to state that these derived, theoretical formulae are not appropriate for practical design
methods. The formulae define the load-carrying capacity equal to the first yield of the member and
do not take into account several effects, e.g. the plastic behavior of the member and the effect of
residual stresses. Therefore, a comprehensive work on deterministic and probabilistic calibration is
needed to propose an appropriate design method based on the generalized Ayrton-Perry formula.
3.2 Novel, Ayrton-Perry based method for the basic model
For the examination of the utility and efficiency of the generalized Ayrton-Perry formula, a
deterministic calibration process was executed for the basic model. The aim of that calibration was
to evaluate the applicability of the Ayrton-Perry based formulae. For this evaluation we developed a
novel method with calibration for the basic model, and then we examined the possibility of the
generalization of this novel method for other boundary condition and other load distribution cases.
To create the buckling database needed to the calibration, an extended numerical test program was
carried out, using the finite element model detailed in Section 2, in software ANSYS. For the
simulations 100 different members were chosen, which meant 20 different (IPE type, 200, 300, 500,
600 marked, and HEA, HEAA, HEB, HEM types with 300, 450, 600 and 900 mark) profiles and 5
different member lengths for each profiles. The length (L) of the beams were determined according
to specified, λz = 0,6; 0,9; 1,2; 1,5 and 2,0 values of slenderness belonging to the buckling about the
weak axis. The material grade of the members was S235, with yield strength 235 N/mm2. With the
model of the members geometrical and material nonlinear imperfect (GMNI) analysis was carried
out.
As the result of the numerical simulations the LT buckling resistance (Mb,Rd) of the beams was
determined which were used to produce the extended database for the members with end-fork
boundary conditions subjected to pure bending. From the determined resistances the values of the
reduction factor for LT buckling (χLT) were calculated by Eq. 4:
Rdc
Rdb
LTM
M
,
, (4)
Page 6
Bettina Badari, Ferenc Papp / Acta Technica Napocensis: Civil Engineering & Architecture Vol. 56 No 2 (2013) 27-42
32
where Mc,Rd is the bending resistance belonging to the cross-sectional carrying capacity. From the
χLT values using Eq. 5, the formulae of LT buckling curves determined in [1]:
22
1
LTLTLT
LT
where 215,0 LTLTLT (5)
the values of the generalized imperfection factor (ηLT) were calculated. Using the generalized form
of ηLT, see in Eq. 3 and the specification for the v0/φ0 ratio, see in Eq. 1, the values of the amplitude
of initial, sinusoidal imperfection components were determined. It is important to note, that through
the calculations the values of sectional modules of the cross-section were determined belonging to
the plastic behavior.
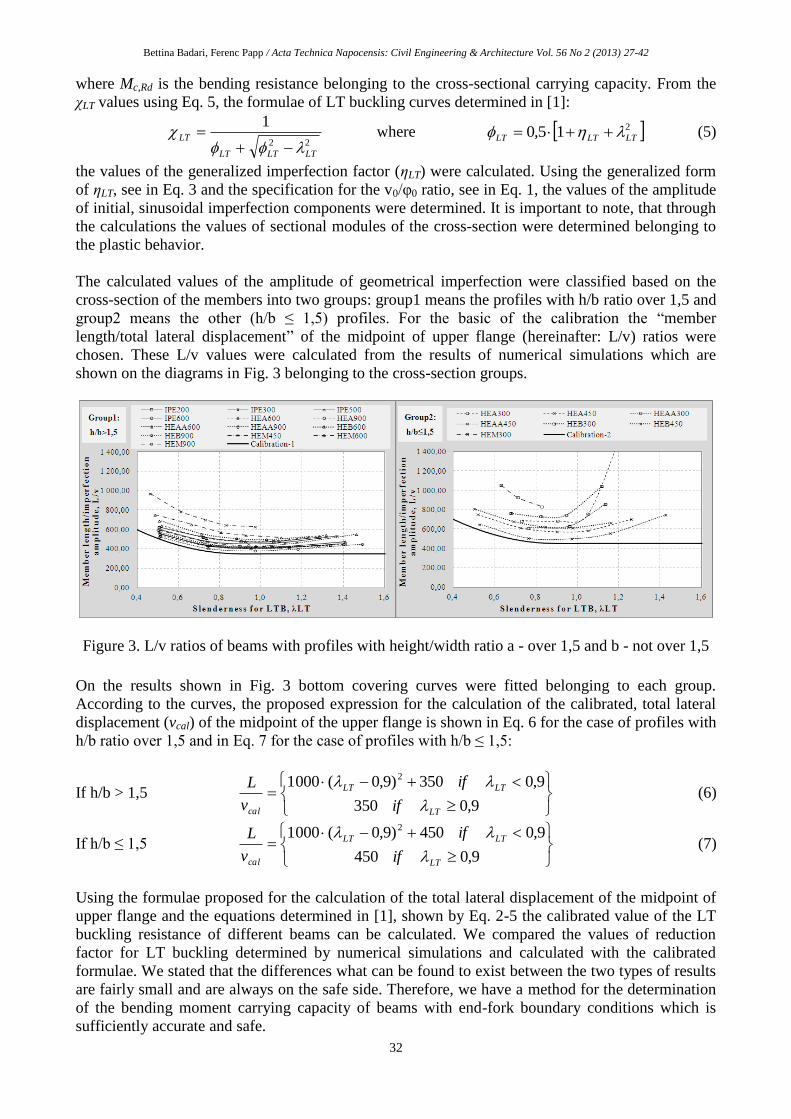
The calculated values of the amplitude of geometrical imperfection were classified based on the
cross-section of the members into two groups: group1 means the profiles with h/b ratio over 1,5 and
group2 means the other (h/b ≤ 1,5) profiles. For the basic of the calibration the “member
length/total lateral displacement” of the midpoint of upper flange (hereinafter: L/v) ratios were
chosen. These L/v values were calculated from the results of numerical simulations which are
shown on the diagrams in Fig. 3 belonging to the cross-section groups.
Figure 3. L/v ratios of beams with profiles with height/width ratio a - over 1,5 and b - not over 1,5
On the results shown in Fig. 3 bottom covering curves were fitted belonging to each group.
According to the curves, the proposed expression for the calculation of the calibrated, total lateral
displacement (vcal) of the midpoint of the upper flange is shown in Eq. 6 for the case of profiles with
h/b ratio over 1,5 and in Eq. 7 for the case of profiles with h/b ≤ 1,5:
If h/b > 1,5
9,0350
9,0350)9,0(0001 2
LT
LTLT
cal if
if
v
L
(6)
If h/b ≤ 1,5
9,0450
9,0450)9,0(0001 2
LT
LTLT
cal if
if
v
L
(7)
Using the formulae proposed for the calculation of the total lateral displacement of the midpoint of
upper flange and the equations determined in [1], shown by Eq. 2-5 the calibrated value of the LT
buckling resistance of different beams can be calculated. We compared the values of reduction
factor for LT buckling determined by numerical simulations and calculated with the calibrated
formulae. We stated that the differences what can be found to exist between the two types of results
are fairly small and are always on the safe side. Therefore, we have a method for the determination
of the bending moment carrying capacity of beams with end-fork boundary conditions which is
sufficiently accurate and safe.
Page 7
Bettina Badari, Ferenc Papp / Acta Technica Napocensis: Civil Engineering & Architecture Vol. 56 No 2 (2013) 27-42
33
3.3 Example: Ayrton-Perry based method for a member belonging to the basic model (bm)
The task is the determination of the LT buckling resistance of a sample member with end-fork
boundary conditions, loaded by uniform bending. The properties of the cross-section, the member
length and the material are given. The resistance has to be determined with numerical simulation,
the novel Ayrton-Perry based method and standard method given by the Eurocode, and then these
results have to be compared.
GIVEN PROFILE PROPERTIES CALCULATED PROFILE PROPERTIES MATERIAL PROPERTIES
Profile: IPE500 Material grade: S235
- height of the profile: h = 500mm A = 113,368cm2 i = 4,342cm λ1 = 93,9
- width of the profile: b = 200mm Iz = 2137,614cm4 Wpl,y = 2146,153cm3 - yield strength: fy = 235N/mm2
- thickness of the web: tw = 10,2mm Iω = 1251871,993cm6 Wpl,z = 332,589cm3 - Young modulus: E = 210000N/mm2
- thickness of the flange: tf = 16mm It = 71,734cm4 Wpl,ω = 8048,65cm4 - shear modulus: G = 80770N/mm2
MEMBER PROPERTIES
Slenderness: λz = 1,6 Member length: L = λz · λ1· i = 652,386cm
NUMERICAL SIMULATION IN ANSYS
For the numerical simulation the shell finite element model of the given member was defined, and
GMNI analysis was carried out. As the result of the test the bending resistance of the member was
determined. Load carrying capacity of the member: kNmM ANSYSRdb 157,255,,
THE AYRTON-PERRY FORMULA BASED METHOD
Using the Ayrton-Perry based formulae determined in [1] and the calibrated equations in Section
3.2, the LT buckling resistance of the member can be calculated. First step is the determination of
the slenderness for LT buckling:
Elastic critical normal force: kNL
IEN z
bmcr 97,10402
2
,
Elastic critical bending moment: kNmIE
IGL
I
I
L
IEM
z
t
z
zbmcr 816,351
2
2
2
2
,
Cross-sectional bending resistance: kNmfWM yyplRkc 346,504,,
Slenderness for LT buckling:
bmcr
Rkc
LTM
M
,
, 197,1LT
The h/b ratio of the IPE500 profile is 2,5 therefore, based on the appropriate calibrated equation
(Eq.6) the value of the total lateral displacement of the midpoint of upper flange can be calculated:
Calibrated equation:
9,0350
9,03509,010002
LT
LTLT
cal if
if
v
L
mm
Lvcal 64,18
350
From these values, using the condition for the initial shape (Eq.1), the amplitudes of the
imperfection components and also the generalized imperfection factor (Eq.3) can be determined:
Page 8
Bettina Badari, Ferenc Papp / Acta Technica Napocensis: Civil Engineering & Architecture Vol. 56 No 2 (2013) 27-42
34
displacement: mmth
M
N
vv
f
bmcr
bmcr
calcal 862,10
21
,
,,0
rotation: 032,0,
,
,0 bmcr
bmcr
calcalM
Nv
Generalized imperfection factor: 356,0,
,
,,0
,
,
,0,
,
,0,
pl
ypl
bmcr
tcal
zpl
ypl
calpl
ypl
calbmLTW
W
M
IG
W
W
W
Wv
Applying the formulae of the LT buckling curves determined in [1] (Eq.5) the reduction factor for
LT buckling and the LT buckling resistance of the member can be calculated:
395,115,0 2,, LTbmLTbmLT 474,0
1
22,,
,
LTbmLTbmLT
bmLT
LT buckling resistance: 1
,,,,M
y
yplbmLTAPRdb
fWM
kNmM APRdb 022,239,,
THE EUROCODE METHODS
The LT buckling resistance of the member according to the EN 1993-1-1, section 6.3.2.2. Lateral
torsional buckling curves - General case:
imperfection factor curve 'b': 34,0LT recommended value for curves: 2,00, LT
386,115,0 20, LTLTLTLTLT 48,0
1
22,,
,
LTbmLTbmLT
bmLT
LT buckling resistance: 1
,,,,M
y
yplbmLTECRdb
fWM
kNmM ECRdb 878,241,,
The LT buckling resistance of the member according to the EN 1993-1-1, section 6.3.2.3. Lateral
torsional buckling curves for rolled sections or equivalent welded sections:
imperfection factor curve 'c': 49,0LT recommended values for curves: 4,00, LT 75,0
233,115,0 20, LTLTLTLTLT 526,0
1
22,,
,
LTbmLTbmLT
bmLT
LT buckling resistance: 1
,,,,M
y
yplbmLTECRdb
fWM
kNmM ECRdb 286,265,,
COMPARISON OF THE RESULTS
For the evaluation of the novel method the LTB resistance of the tested member was determined by
the EN1993-1-1 methods too. The results of the Eurocode and the novel, Ayrton-Perry formula
based method are compared with the results of the numerical simulation. The results are
summarized in Table 1.
Table 1: Comparison of LTB resistances of the basic model sample
Determination method LTB resistance (kNm) Difference on safe
side (%)
ANSYS simulation 255,157 (basic)
APF based method 239,022 6,750
EC - 6.3.2.2 241,878 5,490
EC - 6.3.2.3 265,286 -3,818
Page 9
Bettina Badari, Ferenc Papp / Acta Technica Napocensis: Civil Engineering & Architecture Vol. 56 No 2 (2013) 27-42
35
4. Generalization of the novel method for beams with prevented end-warp
4.1 Generalization based on the theory of elastic extrapolation
In Section 3.3 it was demonstrated how the novel, Ayrton-Perry formula based method works for
the basic model. Hereinafter, it is examined how can be this novel method generalized for the case
of members with end-fork but end-warp preventing boundary conditions, loaded by uniform
bending. The basic idea of the generalization was the theory of elastic extrapolation. The theory
says that if the buckling behavior belonging to the ideal models of two steel members is similar, the
real carrying capacity of the two members is related. In terms of the method this means that first the
slenderness of the examined, end-warp prevented member has to be determined. Then, with this
slenderness an equivalent, basic model member has to be defined which the demonstrated method
has to be carried out with. According to the theory of the elastic extrapolation the LT buckling
resistance, calculated for this equivalent member has to be a good approximation for the originally
examined member with prevented end-warp.
4.2 Example: Ayrton-Perry based method for an end-warp prevented member
The task is the determination of the LT buckling resistance of a sample member with end-fork but
end-warp preventing boundary conditions, loaded by uniform bending. The properties of the cross-
section, the member length and the material are the same as given in Section 3.3. The resistance has
to be determined with numerical simulation, the novel Ayrton-Perry based method and standard
method given by the Eurocode, and then these results have to be compared.
NUMERICAL SIMULATION IN ANSYS
For the numerical simulation the shell finite element model of the given member was defined, and
GMNI analysis was carried out. As the result of the test the bending resistance of the member was
determined. Load carrying capacity of the member: kNmM ANSYSRdb 292,347,,
THE AYRTON-PERRY FORMULA BASED METHOD
Using the Ayrton-Perry based formulae determined in [1] and the calibrated equations in Section
3.2, the LT buckling resistance of the member can be calculated. First step is the determination of
the slenderness for LT buckling: Boundary conditions: - prevention for end rotation: 85,0k
- prevention for end-warping: 5,0wk
Elastic critical bending moment:
kNm
IE
IGLk
I
I
k
k
Lk
IEM
z
t
zw
zbmcr 409,659
2
22
2
2
,
Cross-sectional bending resistance: kNmfWM yyplRkc 346,504,,
Slenderness for LT buckling: bmcr
Rkc
LTM
M
,
, 875,0LT
According to the theory of elastic extrapolation the equivalent, basic model member has to be
defined. The member length of the equivalent beam:
Elastic critical bending moment for the basic model: kNmM
M
LT
Rdc
bmcr 409,6592
,
,
Page 10
Bettina Badari, Ferenc Papp / Acta Technica Napocensis: Civil Engineering & Architecture Vol. 56 No 2 (2013) 27-42
36
Equivalent member length: cmI
I
M
IG
M
IE
M
IGIEL
zbmcr
t
bmcr
z
bmcr
tzbm 329,44145,0
2,
22
2,
224
2,
2
Elastic critical normal force: kNL
IEN
bm
zbmcr 699,2274
2
2
,
The h/b ratio of the IPE500 profile is 2,5 therefore, based on the appropriate calibrated equation
(Eq.6) the value of the total lateral displacement of the midpoint of upper flange can be calculated:
Calibrated equation:
9,0350
9,03509,010002
LT
LTLT
cal if
if
v
L
Total lateral displacement of the upper flange:
mmL
v
LT
cal 586,123509,01000
2
From these values, using the condition for the initial shape (Eq.1), the amplitudes of the
imperfection components and also the generalized imperfection factor (Eq.3) can be determined:
displacement: mmth
M
N
vv
f
bmcr
bmcr
calcal 86,6
21
,
,,0
rotation: 024,0,
,
,0 bmcr
bmcr
calcalM
Nv
Generalized imperfection factor: 28,0,
,
,,0
,
,
,0,
,
,0,
pl
ypl
bmcr
tcal
zpl
ypl
calpl
ypl
calbmLTW
W
M
IG
W
W
W
Wv
Applying the formulae of the LT buckling curves determined in [1] (Eq.5) the reduction factor for
LT buckling and the LT buckling resistance of the member can be calculated:
023,115,0 2,, LTbmLTbmLT 644,0
1
22,,
,
LTbmLTbmLT
bmLT
LT buckling resistance: 1
,,,,M
y
yplbmLTAPRdb
fWM
kNmM APRdb 905,324,,
THE EUROCODE METHODS
The LT buckling resistance of the member according to the EN 1993-1-1, section 6.3.2.2. Lateral
torsional buckling curves - General case:
imperfection factor curve 'b': 34,0LT recommended value for curves: 2,00, LT
997,015,0 20, LTLTLTLTLT 678,0
1
22,,
,
LTbmLTbmLT
bmLT
LT buckling resistance: 1
,,,,M
y
yplbmLTECRdb
fWM
kNmM ECRdb 696,341,,
The LT buckling resistance of the member according to the EN 1993-1-1, section 6.3.2.3. Lateral
torsional buckling curves for rolled sections or equivalent welded sections:
imperfection factor curve 'c': 49,0LT recommended values for curves: 4,00, LT 75,0
903,015,0 20, LTLTLTLTLT 717,0
1
22,,
,
LTbmLTbmLT
bmLT
LT buckling resistance: 1
,,,,M
y
yplbmLTECRdb
fWM
kNmM ECRdb 616,361,,
Page 11
Bettina Badari, Ferenc Papp / Acta Technica Napocensis: Civil Engineering & Architecture Vol. 56 No 2 (2013) 27-42
37
COMPARISON OF THE RESULTS
For the evaluation of the novel method the LTB resistance of the tested member was determined by
the EN1993-1-1 methods too. The results of the Eurocode and the novel, APF based method are
compared with the results of the numerical simulation. The results are summarized in Table 2.
Table 2: Comparison of LTB resistances of the prevented end-warp sample
Determination method LTB resistance (kNm) Difference on safe
side (%)
ANSYS simulation 347,292 (basic)
APF based method 324,905 6,890
EC - 6.3.2.2 341,696 1,638
EC - 6.3.2.3 361,616 -3,961
5. Generalization of the novel method for simple beams loaded by triangular
moment distribution
5.1 Generalization based on the theory of elastic extrapolation
The generalization of the novel method for the case of members with end-fork boundary conditions
and loaded by triangular moment distribution was based on the theory of elastic extrapolation,
similar to the Section 4. However, in this case the methodology is more complicated. Due to the
triangular moment distribution the critical cross-section is not known, it shifts from the middle of
the beam towards the maximum value of the bending moment. Therefore, the member has to be
divided into segments by the appropriate number of sections and each chosen cross-section has to
be examined. For each cross-section the non dimensional slenderness can be determined by Eq.8:
cr
iult
i
, (8)
where λi is the slenderness of the i-th cross-section, αult,i is the minimum load amplifier of the cross-
sectional load to reach the characteristic resistance of the cross-section and αcr is the minimum
amplifier of the load of the beam to reach the elastic critical resistance of the member. Similar to the
Section 4, with the determined slenderness an equivalent, basic model member has to be defined for
each cross-section. Then, with these basic model members a generalized form of the novel method
has to be carried out.
The generalized form of the novel method means, that first a load value (MEd) is supposed on the
member. For this load value a load amplification factor (αb,Rd,i) has to be determined for each cross-
section. This amplification factor takes into account two effects: the load distribution and the first
buckling shape of the member. According to the methodology, the αb,Rd,i amplification factor for
each cross-section has to be determined as the multiplication of two factors: the αult,i load amplifier
and the χLT,i reduction factor for LT buckling. The χLT,i reduction factor has to be calculated for the
equivalent, basic model member which is defined belonging to the i-th cross-section. The
calculation method is similar to the method detailed in the example in Section 4.2. The only
difference is that the value of the generalized imperfection factor has to be weighted according to
the first buckling mode of the member. Multiplying the calculated values of αult,i load amplifier and
the χLT,i reduction factor the values of αb,Rd,i amplification factor can be determined for each cross-
section. The cross-section belonging to the minimum value of the amplification factors can be
Page 12
Bettina Badari, Ferenc Papp / Acta Technica Napocensis: Civil Engineering & Architecture Vol. 56 No 2 (2013) 27-42
38
defined as the critical. Multiplying the minimum value of the amplification factors (αb,Rd,min) with
the applied load value (MEd) the LT buckling resistance of the member can be calculated. An
example for this methodology is detailed in Section 5.2.
5.2 Example: Ayrton-Perry based method for triangular moment distribution
The task is the determination of the LT buckling resistance of a sample member with end-fork
boundary conditions, loaded by triangular moment distribution. The properties of the cross-section,
the member length and the material are the same as given in Section 3.3. The resistance has to be
determined with numerical simulation, the novel Ayrton-Perry based method and standard methods
given by the Eurocode, and then these results have to be compared.
NUMERICAL SIMULATION IN ANSYS
For the numerical simulation the shell finite element model of the given member was defined, and
GMNI analysis was carried out. As the results of the test the bending resistance and the first
buckling mode of the member were determined.
Load carrying capacity of the member: kNmM ANSYSRdb 275,423,,
THE AYRTON-PERRY FORMULA BASED METHOD
The value of the bending moment on one of the ends of the member is supposed to be 100 kNm.
The amplification factor belonging to the LT buckling resistance has to be determined. For the
examination the member is divided into 20 segments. The amplification factor has to be determined
for every cross-section, depending on the load distribution and the first buckling shape. The
minimum value of the factors will be used for the calculation of the LT buckling resistance.
The effect of the cross-sectional bending load is taken into account by the minimum load amplifier:
Bending moment on one of the ends of the beam: kNmM Ed 100
Cross-sectional bending resistance: kNmfWM yyplRkc 346,504,,
Load amplifier for the cross-sectional, characteristic resistance:
iEd
Rkc
iultM
M
,
,
,
The reduction factor for LT buckling is calculated for each cross-section. For the calculation, the
values of slenderness belonging to each cross-section are determined and the equivalent, basic
model members are defined.
Elastic critical bending moment: kNmIE
IGL
I
I
L
IEM
z
t
z
zcr 062,661879,1
2
2
2
2
Load amplifier for the elastic critical beam resistance: Ed
crcr
M
M 611,6cr
Slenderness for LT buckling: cr
iult
iLT
,
,
According to the theory of elastic extrapolation the equivalent, basic model member has to be
defined belonging to each cross-sections. The member length of the equivalent beams:
Elastic critical bending moment for the basic model: 2
,
,
,,
iLT
Rdc
ibmcr
MM
Page 13
Bettina Badari, Ferenc Papp / Acta Technica Napocensis: Civil Engineering & Architecture Vol. 56 No 2 (2013) 27-42
39
Equivalent member length:
zbmcr
t
bmcr
z
bmcr
tzibm
I
I
M
IG
M
IE
M
IGIEL
45,02
,
22
2,
224
2,
2
,
Elastic critical normal force: 2
,
2
,,
ibm
zibmcr
L
IEN
The h/b ratio of the IPE500 profile is 2,5 therefore, based on the appropriate calibrated equation
(Eq.6) the values of the total lateral displacement of the midpoint of upper flange can be calculated:
Calibrated equation:
9,0350
9,03509,010002
LT
LTLT
cal if
if
v
L
Total lateral displacement of the upper flange:
ical
ibm
ibm
ical
v
L
Lv
,
,
,
,
From these values, using the condition for the initial shape (Eq.1), the amplitudes of the
imperfection components and also the generalized imperfection factor (Eq.3) can be determined for
the virtual, equivalent, basic model members belonging to each cross-sections:
displacement:
21
,,
,,
,
,,0f
ibmcr
ibmcr
ical
ical th
M
N
vv
rotation: ibmcr
ibmcr
icalicalM
Nv
,,
,,
,,0,
Generalized imperfection factor:
,
,
,,,,0
,
,
,,0,
,
,,0,,pl
ypl
ibmcr
tical
zpl
ypl
icalpl
ypl
icalibmLTW
W
M
IG
W
W
W
Wv
The values of the generalized imperfection factor have to be weighted according to the first
buckling mode of the member:
lateral displacement of the cross-section: iv maximum displacement: maxv
The weighted values of the generalized imperfection factor: max
,,,v
viibmLTiLT
Applying the formulae of the LT buckling curves determined in [1] (Eq.5) the reduction factors for
LT buckling can be calculated:
2,, 15,0 LTiLTiLT
2,
2,,
,
1
iLTiLTiLT
iLT
After calculating the values of the minimum load amplifier and reduction factors, multiplying these
values the amplification factors can be determined for each cross-section:
iiultiRdb ,,,
Page 14
Bettina Badari, Ferenc Papp / Acta Technica Napocensis: Civil Engineering & Architecture Vol. 56 No 2 (2013) 27-42
40
Table 3: The results of the calculation
Choosing the minimum value of the amplification factor the LT buckling resistance of the member
can be calculated. In the sample:
The minimum value of the amplification factor: 17027,4min,, Rdb
LT buckling resistance: kNmMM EdRdbAPRdb 027,417min,,,,
THE EUROCODE METHODS
The LT buckling resistance of the according to the EN 1993-1-1, section 6.3.2.2. Lateral torsional
buckling curves - General case:
Slenderness for LT buckling: cr
Rkc
LTM
M , 873,0LT
imperfection factor curve 'b': 34,0LT recommended value for curves: 2,00, LT
996,015,0 20, LTLTLTLTLT 678,0
1
22,,
,
LTbmLTbmLT
bmLT
LT buckling resistance: 1
,,,M
y
yplLTECRdb
fWM
kNmM ECRdb 049,342,,
The LT buckling resistance of the member according to the EN 1993-1-1, section 6.3.4. General
method for lateral and lateral torsional buckling of structural components:
Load amplifiers: 043,5,
, Ed
Rkc
kultM
M 611,6,
Ed
cropcr
M
M
Global non dimensional slenderness: opcr
kult
op,
,
873,0op
Reduction factor according to 6.3.2.3:
Page 15
Bettina Badari, Ferenc Papp / Acta Technica Napocensis: Civil Engineering & Architecture Vol. 56 No 2 (2013) 27-42
41
imperfection factor curve 'c': 49,0LT recommended values for curves: 4,00, LT 75,0
902,015,0 20, LTLTLTLTLT 718,0
1
22,,
LTbmLTbmLT
LT
Correction factor depending on moment distribution: 752,033,1/1 ck
Modification factor: 877,08,02115,012 LTckf
Modified reduction factor: 818,0,
mod, f
bmLT
LT
LT buckling resistance: 1
,mod,,,M
y
yplLTECRdb
fWM
kNmM ECRdb 526,412,,
COMPARISON OF THE RESULTS
For the evaluation of the novel method the LTB resistance of the tested member was determined by
the Eurocode methods too. The results of the Eurocode and the novel, APF based method are
compared with the results of the numerical simulation. The results are summarized in Table 4.
Table 4: Comparison of LTB resistances of the triangular moment distribution sample
Determination method LTB resistance (kNm) Difference on safe
side (%)
ANSYS simulation 423,275 (basic)
APF based method 417,027 1,498
EC - 6.3.2.2 342,049 23,747
EC - 6.3.4 412,526 2,605
6. Conclusions
In this paper the finite element model of steel members used for the numerical tests is detailed. We
examined the effect of changing the types and amplitudes of material imperfections and geometrical
imperfections. It was stated that the distribution types of residual stresses and shapes of initial
geometry of the beams have not significant effect on the LT buckling resistance.
In the present paper we described an extended and improved calibration process for the Ayrton-
Perry formula derived for the basic model in [1]. We proposed equations for the calculation of the
total lateral displacement of the midpoint of upper flange. With the new proposals and the formulae
based on the Ayrton-Perry formula a sufficiently safe and accurate method is given for the
examination of the LT buckling resistance of bended beams with end-fork boundary conditions.
Based on the theory of elastic extrapolation the generalization of the novel method was introduced
for beams with prevented end-warp and also for beams with triangular moment distribution. The
application of the method was demonstrated through examples. Therefore, it is stated that the novel,
Ayrton-Perry formula based method and the LT buckling curves calibrated for the basic model are
also appropriate for the case of beams with prevented end-warp and triangular moment distribution
to calculate the bending moment carrying capacity. Naturally, more extensive numerical test
program and calibration is needed to examine the validity of the theory of elastic extrapolation for
the case of beams with other boundary conditions and load cases. Comparing the results of the
novel method with the results of numerical simulations and standard methods it can be seen that the
APF based resistances are properly accurate. Examined the existing methods it can be stated that
Page 16
Bettina Badari, Ferenc Papp / Acta Technica Napocensis: Civil Engineering & Architecture Vol. 56 No 2 (2013) 27-42
42
the novel, APF based method is appropriate for LTB type design problems and beneficial for
practical application.
7. References [1] Szalai J, Papp F. On the theoretical background of the generalization of Ayrton-Perry type resistance
formulas. Journal of Constructional Steel Research, 66:(5), pp. 670-679, 2010.
[2] Badari B, Papp F. Calibration of the Ayrton-Perry resistance formula - A new design formula for LTB of
simple beams. In: Dunai L, Iványi M, Jármai K, Kovács N, Vigh LG, editors. Proceedings of
EUROSTEEL 2011 - 6th European Conference on Steel and Composite Structures. Budapest; pp. 1797-
1802, 2011.
[3] Chen WF. Structural stability: from theory to practice. Engineering Structures, 22:116-122, 2000.
[4] Nethercot DA. Steel research after EC3 and EC4. In: Dunai L, Iványi M, Jármai K, Kovács N, Vigh LG,
editors. Proceedings of EUROSTEEL 2011 - 6th European Conference on Steel and Composite
Structures. Budapest; pp. 1797-1802, 2011.
[5] Badari B, Papp F. Calibration of the Ayrton-Perry resistance formula for lateral-torsional buckling of
beams with prevented end-warp. In: Cosmin G Chiorean, editor. Proceedings of the First international
conference for PhD students in Civil Engineering. Cluj-Napoca, Romania, pp. 103-110, 2012.
[6] Szalai J, Papp F. A new residual stress distribution for hot-rolled I-shaped sections. Journal of
Constructional Steel Research, 61, pp. 845-861, 2005.
[7] Rebelo C, Lopes N, Simões da Silva L, Nethercot D, Vila Real PMM. Statistical evaluation of the
lateral-torsional buckling resistance of steel I-beams, Part 1: Variability of the Eurocode 3 resistance
model. Journal of Constructional Steel Research, 65, pp. 818-831, 2009.
[8] Boissonnade N, Somja H. Influence of Imperfections in FEM Modeling of Lateral Torsional Buckling.
In: Structural Stability Research Council. Proceedings of the Annual Stability Conference. Texas; 2012.
[9] Kala Z, Kala J. Sensitivity Analysis of Stability Problems of Steel Structures using Shell Finite Elements
and Nonlinear Computation Methods. WSEAS Transactions on Applied and Theoretical Mechanics,
Vol. 4, pp. 105-114, 2009.