52
Generate and gather the data The balance between purity and practicality Glenn Guilfoyle
| Date post: | 26-Dec-2015 |
| Category: |
Documents |
| Upload: | osborn-murphy |
| View: | 216 times |
| Download: | 0 times |

Generate and gather the data
The balance between purity and practicality
Glenn Guilfoyle
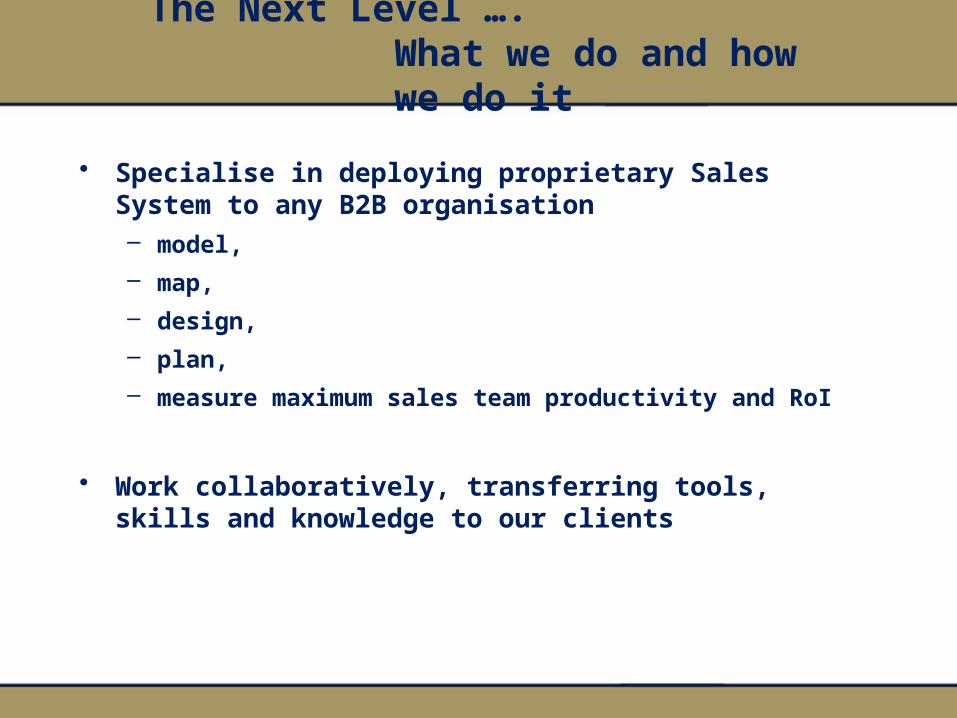
The Next Level …. What we do and how we do it
• Specialise in deploying proprietary Sales System to any B2B organisation– model, – map,– design, – plan,– measure maximum sales team productivity and RoI
• Work collaboratively, transferring tools, skills and knowledge to our clients

The Next Level Sales System
• Sales team optimisation and Sales exec effectiveness system – tailored for any business-to-business sales organisation
• End-to-end suite of modellers, designers, mappers– review, challenge, renew sales team utilisation, strategy,
benchmarks• optimise sales process, system, teams performance

What is Sales team optimisation?
• Analytics that align Sales team design and process to customer base and prospect pool to ensure ….– Maximum productivity and RoI from resource available
• Science of engineering a sales team to a tailored system …– Mobilises resource to best utilisation for maximum
realisation

40,000 B2B Sales organisations are sub-optimised
• At least “a handful of road warriors”
• Large, heterogeneous collection of customers and prospects
• Repeat visits to align with repeat order consumable products or services
• Customer has switchable supplier choice

What is Sales team optimisation?
• Right person
• Right time
• Right frequency
• Right reason
• Right value
• Right partnership framework

Generate and gather the data
generate & gather data
assess current prody& return
renew sales strategy
implement, measure, reward
upgrade selling systems
design salesteam structure
set productivity benchmarks
continuous improvement

Assess current productivity and return
generate & gather data
assess current prody& return
renew sales strategy
implement, measure, reward
upgrade selling systems
design salesteam structure
set productivity benchmarks
continuous improvement

Eight productivity “levers” to increase RoI
=
RESOURCE LEVEL VISIT CAPACITY CUSTOMER COVERAGE PROSPECT PENETRATIONX = +
*# heads in each role type x
*% dedication to front line sales
*ave days per week on territory (annualised)
x *ave visits per day whilst on-territory
X *# customers in each classx
*baseline min visit frequency (annualised)
*# targetable prospectsx
*ave visits to convert/recycle+

Current daily visit activity rate to low side of B2B cross industry norms
3.00
# O
rgan
isat
ions
Visits per Day
Visit capacity : visits per on-territory day
Mod
e=
4
Enter current average visits per on-territory day
per sales executive

Visit : drive time ratio ripe for improvement
80
60
# O
rgan
isat
ions
Visit: drive ratio
Visit : drive time ratio
Mod
e=
2.5:
1
Enter average visit duration (mins)
Enter average drive time between visits (mins)
1.33 27%
Ratio (visit/drive)
Improvementfactor
B2B cross-industry best practice range is
2:1 - 3:1

Current cost of visit higher than B2B cross industry norms
How does this translate to the cost of each visit?
Current Cost of Visit Target Cost of Visit Improvement factor
$354
# O
rganis
ations
Cost of visit ($)
Cost of Visit - current vs target
Mod
e=
$150
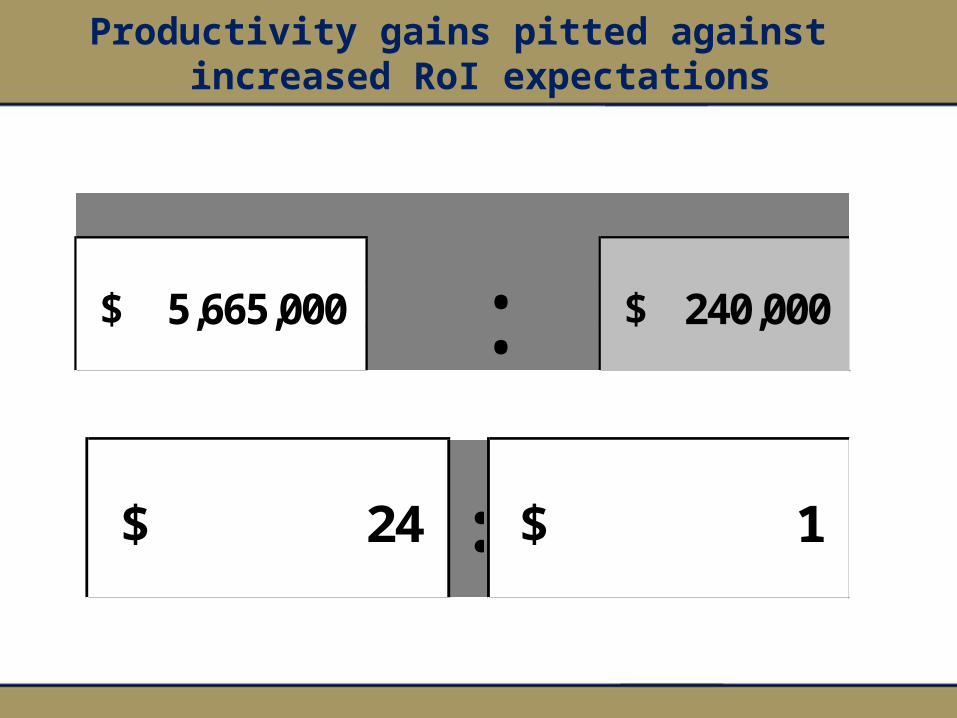
Productivity gains pitted against increased RoI expectations
5,665,000$ : 240,000$
24$ 1$ :

StO scenario priorities
Scenario 1
The Next Level's StO modelling will work according to the following guidelines:
SET resource level, OPTIMISE visit capacity, MAXIMISE customer coverage and N/A prospect penetration
SET OPTIMISE MAXIMISE N/A
The sales team "law of gravity" - click each component to view its benchmarks
=
RESOURCE LEVEL VISIT CAPACITY CUSTOMER COVERAGE PROSPECT PENETRATIONX = +
*# heads in each role type x
*% dedication to front line sales)
*ave days per week on territory (annualised)
x *ave visits per day whilst on-territory)
X *# customers in each classx
*baseline min visit frequency (annualised))
*# targetable prospectsx
*ave visits to convert/recycle+

Renew sales strategy
generate & gather data
assess current prody& return
renew sales strategy
implement, measure, reward
upgrade selling systems
design salesteam structure
set productivity benchmarks
continuous improvement

Value Chain structure model….. for each end user –
end product
Defined in terms of where “focus player’s”
product/service is consumed (in its visible form) or finally
changes ownership
Suppliers Makers
Wholesalers
Distributors
Value adders
Resellers/ brokers
B2B consumers
B2P consumers
Value adders
Installers
Specifiers
Retailers
Buyers Non-buyers End users

Chains and channels environment
End User
Segment player: Maker . Reseller/broker . Wholesaler . Reseller/broker . Reseller/broker . Specifier . Specifier . Specifier growers
. . . . . . . B2B(Bus-to-bus)
Company role: Us . . . . . . . applied & consumed
Buyer/Non-buyer: . Buyer . Buyer . Buyer . Buyer . Non-buyer . Non-buyer . Non-buyer Buyer
Customer?: . We trade with them . We trade with them . We trade with them . We trade with them . We don't trade . We don't trade . We don't trade We don't trade
Competitor? . Some compete . Some compete . Don’t compete . Some compete . Don’t compete . Don’t compete . Don’t compete Don’t compete
Descriptors: . H/O who act on behalf of branches. eg AIRR . grower groups;co-ops . Group branch places order; H/O invoiced … independents buy via wholesaler. independent FFS agronomists. KOLs . industry bodies; research bodies; supermarkets
Commissioning: . . . . . . .
No. of Customers.
No. of Customers.
No. of Customers.
No. of Customers.
No. of Customers.
No. of Customers.
No. of Customers.
No. of Customers No. of Customers
Populate number of customers (direct and indirect) for each segment
. Landmark, Elders, CRT, Aglink, NRI. AIRR; Landmark, CRT. c20 grower groups (1 major), c10 coops. 1,400 . 200 . c30 . c25 48,000
Extra detail . . . coops & major GG direct, rest via reseller. Direct & indirect CV captured. Direct most comon route excl WA. predom WA . . 4-5 K engaged with
Segment Player/s

Sales team alignment in the chains and channels environment
End User
Segment player: Maker . Reseller/broker . Wholesaler . Reseller/broker . Reseller/broker . Specifier . Specifier . Specifier growers
. . . . . . . B2B(Bus-to-bus)
Company role: Us . . . . . . . applied & consumed
Buyer/Non-buyer: . Buyer . Buyer . Buyer . Buyer . Non-buyer . Non-buyer . Non-buyer Buyer
Customer?: . We trade with them . We trade with them . We trade with them . We trade with them . We don't trade . We don't trade . We don't trade We don't trade
Competitor? . Some compete . Some compete . Don’t compete . Some compete . Don’t compete . Don’t compete . Don’t compete Don’t compete
Descriptors: . H/O who act on behalf of branches. eg AIRR . grower groups;co-ops . Group branch places order; H/O invoiced … independents buy via wholesaler. independent FFS agronomists. KOLs . industry bodies; research bodies; supermarkets
Commissioning: . . . . . . .
No. of Customers.
No. of Customers.
No. of Customers.
No. of Customers.
No. of Customers.
No. of Customers.
No. of Customers.
No. of Customers No. of Customers
Populate number of customers (direct and indirect) for each segment
. Landmark, Elders, CRT, Aglink, NRI. AIRR; Landmark, CRT. c20 grower groups (1 major), c10 coops. 1,400 . 200 . c30 . c25 48,000
Extra detail . . . coops & major GG direct, rest via reseller. Direct & indirect CV captured. Direct most comon route excl WA. predom WA . . 4-5 K engaged with
Total population of segment .
Total population of segment .
Total population of segment .
Total population of segment .
Total population of segment .
Total population of segment .
Total population of segment .
Total population of segment
Total population of segment
Input total population for each segment
. 5 . 2 . c30 . 1,400 . . .
Extra detail . . . . . . .
Indicate the sales team role type(s) and FTE of each type being aligned to each segment
. PC ; SAM . AIRR: CU Head, TSMLandmark: CU Head, SAM, TSM. TSMs . TSMs; specialist seeds team. TSM; solutions selling mgr. Corp Affairs; Crop Heads. Corp Affairs; Crop HeadsTSMs; solutions ; special seeds team
Segment Player/s

Generate and gather the data
generate & gather data
assess current prody& return
renew sales strategy
implement, measure, reward
upgrade selling systems
design salesteam structure
set productivity benchmarks
continuous improvement
Six tranches of data
• CV
• PV

• Value of all products/services purchased by each customer • direct• indirect
• Ideally calculated and expressed in terms of customer margin contribution
• Currency of CV needs to be determined in terms of finance system practicalities
Current Value

• Method and period of data collection
• Snapshot – does not attempt to account for growth/trend at point in time
• Data should be attained for every customer over defined period
• Analytics of listing ALL customers top to bottom provides useful insight to spread of business
Current Value

CV shape-of-curve

CV shape-of-curve
$0
$10,000
$20,000
$30,000
$40,000
$50,000
$60,0001 24
47
70
93
116
139
162
185
208
231
254
277
300
323
346
369
392
415
438
461
484
507
530
553
576
599
622
645
668
691
714
737
760
783
806
829
MA
RG
IN (
$)
# CUSTOMERS
Customer distribution
The top 72% of CV margin comes from 28% customers
The middle 13% of CV margin comes from 13% customers
The remaining 15% of CV margin comes from 59% customers

• If you trade directly
• If you trade indirectly
• If you trade conditionally
Current Value … the typical realities and pitfalls

• If you trade directly
• If you trade indirectly
• If you trade conditionally
• If you can access “line of sight” data
Current Value … the typical realities and pitfalls

• Value of all products/services in categories in which organisation competes– direct– indirect
• PV data is ideally calculated and expressed in same “currency” as CV data
• Method and period of data collection should then be set and implemented– PV collection on all customers– PV collection on all prospects
Potential Value

• Best selection of PV currency is nearly always a trade-off– Readily available vs needs to be generated– Sales team involvement vs industry data– Proxy vs “real” data
• Snapshot – does not attempt to account for growth/trend at point in time
• PV SoC
Potential Value

PV shape-of-curve

PV shape-of-curve
$0
$5,000
$10,000
$15,000
$20,000
$25,000
$30,000
$35,0001 25
49
73
97
121
145
169
193
217
241
265
289
313
337
361
385
409
433
457
481
505
529
553
577
601
625
649
673
697
721
745
769
793
817
MA
RG
IN (
$)
# CUSTOMERS
Customer distribution
The top 62% of PV margin comes from 38% customers
The middle 18% of PV margin comes from 18% customers
The remaining 20% of PV margin comes from 44% customers

• If you trade directly
• If you trade indirectly
• If you trade conditionally
Potential Value … typical realities and pitfalls will be just as relevant

• If you can access industry/channel data • At individual customer/prospect level
• “gold”
• If you have the customer base and prospect pool profiled• Design a “weight and rate” proxy model
• “silver”
• If you have market size data• Create assumed shape-of-curve and brief sales team on
“forced distribution”• “bronze”
Potential Value … the typical realities and
pitfalls

The roadmap
Interrogate Real data Data available Sales team involvement neededin sequence vs vs vsdesignated Proxy data Needs to be generated Independent of sales team
Industry/channeldata at single 1 2 N/A
customer level
Profiling dataat single 3 4 5
customer level
Overallmarket N/A 6 N/A
data

• If you can access industry/channel data • At individual customer/prospect level
• “gold”
• If you have the customer base and prospect pool profiled• Design a “weight and rate” proxy model
• “silver”
• If you have market size data• Create assumed shape-of-curve and brief sales team on
“forced distribution”• “bronze”
These principles apply to the CV problem when you don’t have line of sight

CV and/or PV challenged? … there is always a way …
Interrogate Real data Data available Sales team involvement neededin sequence vs vs vsdesignated Proxy data Needs to be generated Independent of sales team
Industry/channeldata at single 1 2 N/A
customer level
Profiling dataat single 3 4 5
customer level
Overallmarket N/A 6 N/A
data

there is always a way … it is never perfect … journey of continuous
improvement
Interrogate Real data Data available Sales team involvement neededin sequence vs vs vsdesignated Proxy data Needs to be generated Independent of sales team
Industry/channeldata at single 1 2 N/A
customer level
Profiling dataat single 3 4 5
customer level
Overallmarket N/A 6 N/A
data

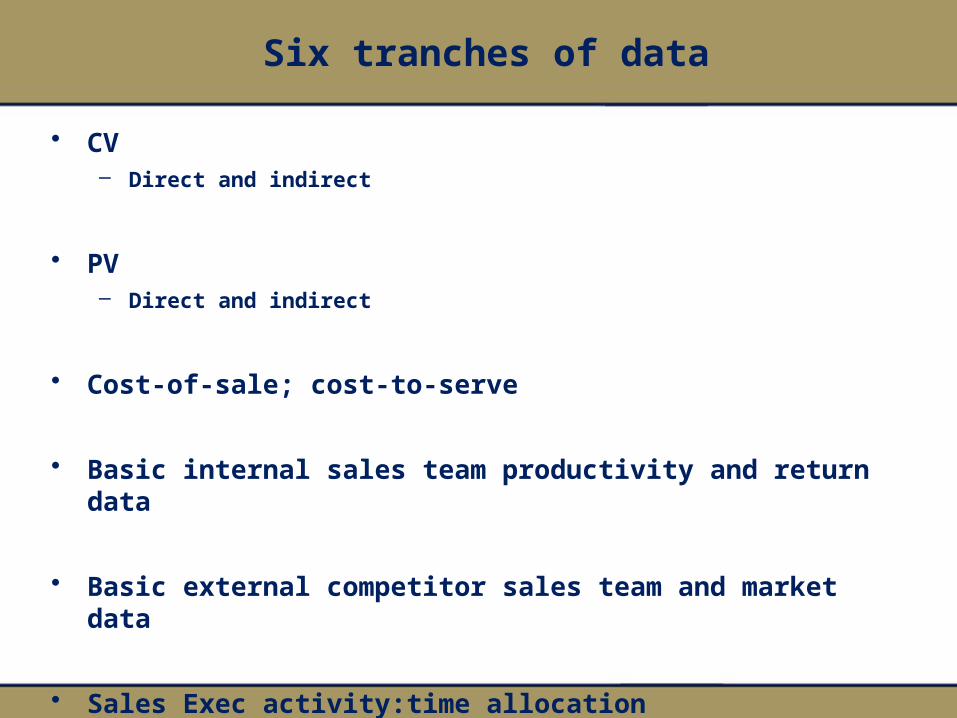
Six tranches of data
• CV– Direct and indirect
• PV– Direct and indirect
• Cost-of-sale; cost-to-serve
• Basic internal sales team productivity and return data
• Basic external competitor sales team and market data
• Sales Exec activity:time allocation

• Allocate all direct costs to support sales people managing customer base
• Sales support– Cost to company of sales person paid and fully equipped – Sales management– Internal sales/telesales
• Service support– Customer Service/Call centre– Quotation processing– Technical support– Any other functionary that directly serves same
customer base
Cost of sales and cost to serve

Cost of visit reality can be used to recalibrate
Current Cost of Visit Target Cost of Visit Improvement factor
$354 $316 11%
# O
rgan
isat
ions
Cost of visit ($)
Cost of Visit - current vs target
Mod
e=
$150

Internal sales team productivity & return data
chart min = 5, max = 100, mode = 20
chart axis titles: vert = # organisations, horiz = # sales execs
do not allow curve to touch horiztonal axis
# O
rgan
isat
ions
# sales execs
Organisation or Division Full time equivalent sales executives
Mod
e =2
0
# O
rgan
isat
ions
Days per week
Visit capacity: on-territory days per week
Mod
e=
4#
Org
anis
atio
ns
Visits per Day
Visit capacity: visits per on-territory day
Mod
e=
4

External market & competitor data
Name Market Size
% growth rate overpast year
% growth projected overcoming year Name
Market Share
Parents 3.486 m 1.7% (population growth) inline with population growth Name of identified market:
Staff/members 3. Enter your company and market share Spartan 41%
1 Harlequin 11%
2 Primary Schoolwear 9%
5. For each competitor, enter market share 3 Mount Castle 6%
4 Permapleat 5%
5 QLD Hosiery 1%
6 Red Robin 1%
* Others 25%
-
7. Estimate and enter the number of such "rats n mice" that compete in this market
6. Enter "others" , with the remaining market share for all the "rats n mice"
4. Enter the names of 1-6 main competitors for this product/service group in this market
Six tranches of data
• CV– Direct and indirect
• PV– Direct and indirect
• Cost-of-sale; cost-to-serve
• Basic internal sales team productivity and return data
• Basic external competitor sales team and market data
• Sales Exec activity:time allocation

Time : activity data
Total time = 164 hours per month

Office time higher than expected
24%
76%
Breakdown of total timeOffice time Territory time

F2F time less than expected … Solo office time more than
expected
24%
76%
Breakdown of total timeOffice time Territory time
15%
9%
Breakdown of office time (% of total)
Solo office time
Non-solo office time (egmeetings)
36%29%
11%
Breakdown of territory time (% of total)
F2F time
Drive time
Other territory time (egadmin, phone calls,emails)

Responsive and reactive visit time higher than expected
36%29%
11%
Breakdown of territory time (% of total)
F2F time
Drive time
Other territory time (egadmin, phone calls,emails)
58%27%
15%
Proactivity of F2F timeProactive Responsive Reactive
29%
71%
Productivity of Drive timeProductive Unproductive

Value neutral and value destroying office time higher than expected
15%
9%
Breakdown of office time (% of total)
Solo office time
Non-solo office time (egmeetings)
31%
59%
10%
Value of solo office timeValue adding Value neutral Value destroying
49%48%
3%
Value of other office timeValue adding Value neutral Value destroying

Visit : drive time ratio – opportunity for improvement
Sales representative visit:drive matrix
Participants State
Hours per week (assume
4 wpm)
Hours per day (assume
5 dpw)On territory
dpwOn territory
hpw
Visit: drive ratio
Drive time hpw (assume
4 wpm)Visit time
hpw
Ave visits pw (from STP&R)
Minutes per visit/drive
pairing
Visit time per visit
(min)
Drive time per visit
(min)Selling
minutesDriving
minutes2 NSW 38 7.5 4.1 31 1.4 13 18 27 68 40 28 35 253 Vic 45 8.9 3.6 32 1.1 15 17 27 71 38 33 32 281 WA 38 7.5
6Weighted Average 41 8 3.8 31 1.3 14 17 27 70 39 31 33 27
So each on-territory hour is composed of

Sales and Service cycles
Ensure needs received to customer satisfaction
Plan, execute
product – current service
order/delivery needs
Service Cycle Sales Cycle
Grow
Preserve
Relationship

Data sourcing
• CV
• PV
• CoS/CtS
• Internal StP & R
• External market data
• S/E time:allocation data
• Finance system -> channel partners -> proxy scores
• CRM -> Industry databases -> proxy scores
• Finance system
• S & M Management
• S & M Management
• Sales Execs 1 hr on-line survey

The CV, PV, SoW, CoV inputs create classification scatterplot

Upgrade selling systems
generate & gather data
assess current prody& return
renew sales strategy
implement, measure, reward
upgrade selling systems
design salesteam structure
set productivity benchmarks
continuous improvement


