International Journal of Bioassays ISSN: 2278-778X www.ijbio.com R Re es se ea ar rc ch h A Ar rt ti i c cl l e e *Corresponding Author: Dr. A Hasannattaj, Department of Civil Engineering, Faculty of Civil Engineering, Babol Noshirvani University of Technology, Babol, Iran 1260 GENERIC ADSORPTION COEFFICIENTS AND NATURAL REMOVAL OF HEAVY METALS IN MUDDY RIVER WATER Amini Rad H 1 , A Hasannattaj 1 *, M Scholz 2 , B Navayineya 1 and L Weekes 2 1 Department of Civil Engineering, Faculty of Civil Engineering, Babol Noshirvani University of Technology, Babol, Iran 2 Civil Engineering Research Centre, The University of Salford, Greater Manchester, United Kingdom Received for publication: May 28, 2013; Revised: June 09, 2013; Accepted: July 21, 2013 INTRODUCTION There are often close relationships between heavy metal ions and different types of sediments such as suspended particles, bed loads and bottom sediments. River sediments usually adsorb most of heavy metal ions. For example, the adsorption capacity of lead onto river sediment particles as a function of the chemical composition and particle size was studied previously [1]. Adsorption of the heavy metal ions copper, zinc and nickel onto sediments in the Jionshajing River was also studied [2]. Findings indicated that the pH of river water and its carbon content are important factors in determining the adsorption of heavy metals onto sediments. Furthermore, the adsorption properties of heavy metals onto clay in the Delaware River and Susquehanna River were studied. Results showed that adsorption decreases with an increase in the Langmuir isotherm. Additionally the effect of pH and total solids concentration of the river on the copper adsorption were significant [3]. Adsorption properties of heavy metals adsorbed onto sediment in the Hindon River were studied and their Findings showed that parameters influencing adsorption rate, include particle diameter, number of ions, and iron and manganese oxides. Heavy metal adsorption capacity of rivers is also dependent on the concentration of suspending solid and bottom sediment. Also findings indicated that suspended solids of river are an important factor as adsorbent of heavy metals which depends on the velocity of flow [14]. The results showed that at the 11000 mg/l absorbent concentration, heavy metals such as Pb, Cu, Zn, and Fe were 84.38, 85.36, 32.4, and 93.74% respectively removed [10]. Also the results of investigation showed that bed sediment and suspended solid in Chalus River are polluted to heavy metals and organic compound [15]. Case study problem: The main source of turbidity in the Chalus River (Iran) is mud during flood flows. Suspended mud particles have the potential to adsorb pollutants such as heavy metals. Due to the presence of the active Sorb Dona mine in the upper region of the Chalus River, heavy metals frequently pollute the river water. Chalus City is located downstream of the mine and water pollution is therefore a very serious concern for the health of the local population. During flooding, the concentration of sediment is usually more than 20 kg/m 3 , which is a relatively high value. Hence, it is important to study the adsorption capacity of heavy metal ions onto suspended particles and sediment to produce a water quality model to determine the heavy metal pollutant tolerance. Heavy metals may either lead to contaminated sediment and/or polluted river water. Annual result of observation monitoring station from 2003 to 2008 of Mazandaran regional water company in Chalus River is shows in the figures 1to5 [6,7,12]. In these figures left vertical axis is quantity of suspended solids concentration and right vertical axis is flow. Abstract: In this study a possible natural flocculating capacity of River ' s is experimentally investigated. For this purpose, Chalus River in northern part of IRAN due to its heavy metal pollution, high flows and high suspended and bed sediments fluctuation level is selected. In this investigation heavy metals content of water, suspended and bed sediments of the Chalus River, is experimentally evaluated. The samples were obtained during the wet season (mud flow) from three existing observing sampling station. In this experimental study the effect of suspended particle concentration, bed sediment and contact time on the removal capacity and determination of generic adsorption coefficient by WASP model is computed. The result of analysis showed that the adsorption capacity of the heavy metals is indirectly proportional with an increase in concentration of suspended particles. Also the behavior of adsorption in this investigation follows by Freundlich isotherm as a liner isotherm. From this analysis also can be said that the self-purification capacity of river is also greatly affected by this novelty of rivers. Keywords: River; Mining; Sediment; Suspended particles; heavy metals: Adsorption coefficient.
Department of Civil Engineering, Faculty of Civil Engineering, Babol Noshirvani University of Technology, Babol, Iran
1260
GENERIC ADSORPTION COEFFICIENTS AND NATURAL REMOVAL OF HEAVY METALS IN MUDDY RIVER
WATER Amini Rad H1, A Hasannattaj1*, M Scholz2, B Navayineya1 and L Weekes2
1Department of Civil Engineering, Faculty of Civil Engineering, Babol Noshirvani University of Technology, Babol, Iran 2Civil Engineering Research Centre, The University of Salford, Greater Manchester, United Kingdom Received for publication: May 28, 2013; Revised: June 09, 2013; Accepted: July 21, 2013
INTRODUCTION There are often close relationships between heavy
metal ions and different types of sediments such as suspended particles, bed loads and bottom sediments. River sediments usually adsorb most of heavy metal ions. For example, the adsorption capacity of lead onto river sediment particles as a function of the chemical composition and particle size was studied previously [1]. Adsorption of the heavy metal ions copper, zinc and nickel onto sediments in the Jionshajing River was also studied [2]. Findings indicated that the pH of river water and its carbon content are important factors in determining the adsorption of heavy metals onto sediments. Furthermore, the adsorption properties of heavy metals onto clay in the Delaware River and Susquehanna River were studied. Results showed that adsorption decreases with an increase in the Langmuir isotherm. Additionally the effect of pH and total solids concentration of the river on the copper adsorption were significant [3].
Adsorption properties of heavy metals adsorbed
onto sediment in the Hindon River were studied and their Findings showed that parameters influencing adsorption rate, include particle diameter, number of ions, and iron and manganese oxides. Heavy metal adsorption capacity of rivers is also dependent on the concentration of suspending solid and bottom sediment. Also findings indicated that suspended solids of river are an important factor as adsorbent of heavy metals which depends on the velocity of flow [14]. The results showed that at the 11000 mg/l
absorbent concentration, heavy metals such as Pb, Cu, Zn, and Fe were 84.38, 85.36, 32.4, and 93.74% respectively removed [10]. Also the results of investigation showed that bed sediment and suspended solid in Chalus River are polluted to heavy metals and organic compound [15].
Case study problem:
The main source of turbidity in the Chalus River (Iran) is mud during flood flows. Suspended mud particles have the potential to adsorb pollutants such as heavy metals. Due to the presence of the active Sorb Dona mine in the upper region of the Chalus River, heavy metals frequently pollute the river water. Chalus City is located downstream of the mine and water pollution is therefore a very serious concern for the health of the local population.
During flooding, the concentration of sediment is
usually more than 20 kg/m3, which is a relatively high value. Hence, it is important to study the adsorption capacity of heavy metal ions onto suspended particles and sediment to produce a water quality model to determine the heavy metal pollutant tolerance. Heavy metals may either lead to contaminated sediment and/or polluted river water. Annual result of observation monitoring station from 2003 to 2008 of Mazandaran regional water company in Chalus River is shows in the figures 1to5 [6,7,12]. In these figures left vertical axis is quantity of suspended solids concentration and right vertical axis is flow.
Abstract: In this study a possible natural flocculating capacity of River's is experimentally investigated. For this purpose, Chalus River in northern part of IRAN due to its heavy metal pollution, high flows and high suspended and bed sediments fluctuation level is selected. In this investigation heavy metals content of water, suspended and bed sediments of the Chalus River, is experimentally evaluated. The samples were obtained during the wet season (mud flow) from three existing observing sampling station. In this experimental study the effect of suspended particle concentration, bed sediment and contact time on the removal capacity and determination of generic adsorption coefficient by WASP model is computed. The result of analysis showed that the adsorption capacity of the heavy metals is indirectly proportional with an increase in concentration of suspended particles. Also the behavior of adsorption in this investigation follows by Freundlich isotherm as a liner isotherm. From this analysis also can be said that the self-purification capacity of river is also greatly affected by this novelty of rivers. Keywords: River; Mining; Sediment; Suspended particles; heavy metals: Adsorption coefficient.
Amini Rad et al.,: Int. J. Bioassays, 2013, 02 (09), 1260-1268
www.ijbio.com 1261
Fig. 1.The result of month analysis on the Chalus River
Fig. 2:The result of month analysis on the Chalus River
Fig. 3.The result of month analysis on the Chalus River
Fig. 4:The result of month analysis on the Chalus River
Fig. 5: The result of month analysis on the Chalus River also the heavy metal concentration measured by regional environment protection administration of Mazandaran in Chalus River observation sampling station from 2001 to 2002 is shown in the following figures [7,11].
Fig. 6: The result of analysis on the water River
Fig. 7: The result of analysis on the water River
Fig. 8: The result of analysis on the water River
Amini Rad et al.,: Int. J. Bioassays, 2013, 02 (09), 1260-1268
www.ijbio.com 1262
Fig. 9: The result of analysis on the water River
Fig. 10: The result of analysis on the water River
Fig. 11: The result of analysis on the water River
Fig. 12.The result of analysis on the water River
Fig. 13: The result of analysis on the water River
Fig. 14: The result of analysis on the water River
Fig. 15: The result of analysis on the water River
Fig. 16: The result of analysis on the water River
Amini Rad et al.,: Int. J. Bioassays, 2013, 02 (09), 1260-1268
www.ijbio.com 1263
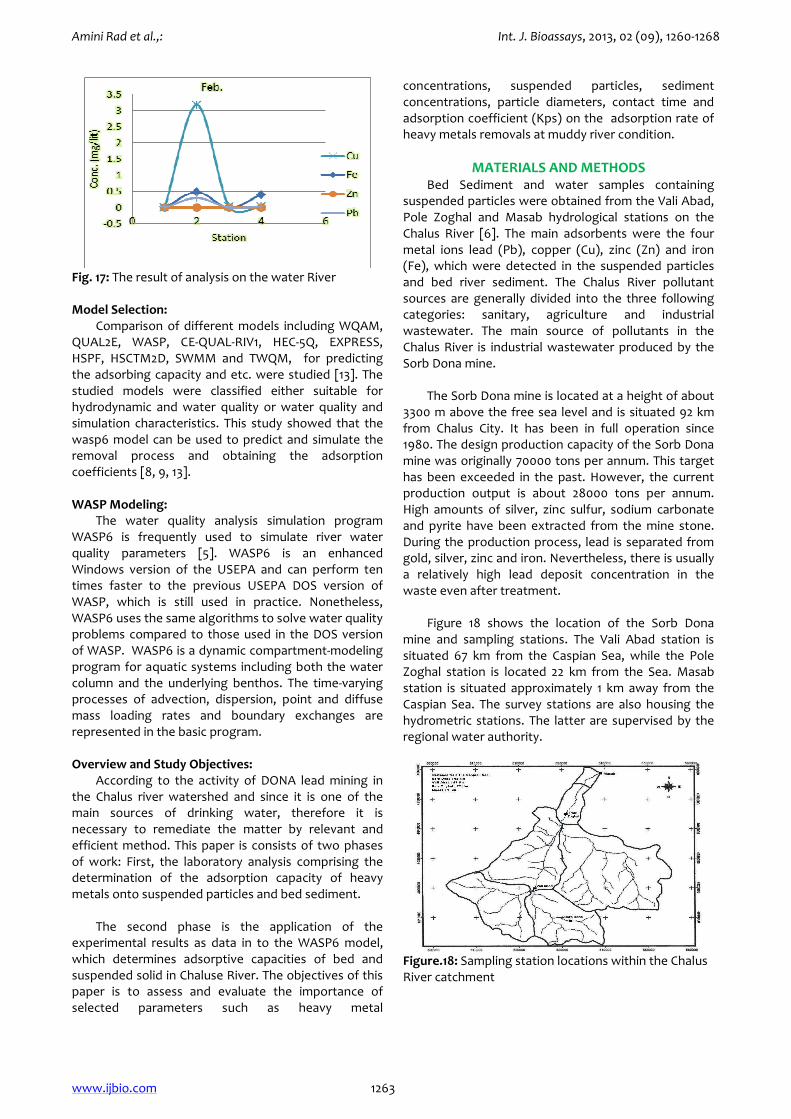
Fig. 17: The result of analysis on the water River
Model Selection:
Comparison of different models including WQAM, QUAL2E, WASP, CE-QUAL-RIV1, HEC-5Q, EXPRESS, HSPF, HSCTM2D, SWMM and TWQM, for predicting the adsorbing capacity and etc. were studied [13]. The studied models were classified either suitable for hydrodynamic and water quality or water quality and simulation characteristics. This study showed that the wasp6 model can be used to predict and simulate the removal process and obtaining the adsorption coefficients [8, 9, 13].
WASP Modeling:
The water quality analysis simulation program WASP6 is frequently used to simulate river water quality parameters [5]. WASP6 is an enhanced Windows version of the USEPA and can perform ten times faster to the previous USEPA DOS version of WASP, which is still used in practice. Nonetheless, WASP6 uses the same algorithms to solve water quality problems compared to those used in the DOS version of WASP. WASP6 is a dynamic compartment-modeling program for aquatic systems including both the water column and the underlying benthos. The time-varying processes of advection, dispersion, point and diffuse mass loading rates and boundary exchanges are represented in the basic program.
Overview and Study Objectives:
According to the activity of DONA lead mining in the Chalus river watershed and since it is one of the main sources of drinking water, therefore it is necessary to remediate the matter by relevant and efficient method. This paper is consists of two phases of work: First, the laboratory analysis comprising the determination of the adsorption capacity of heavy metals onto suspended particles and bed sediment.
The second phase is the application of the
experimental results as data in to the WASP6 model, which determines adsorptive capacities of bed and suspended solid in Chaluse River. The objectives of this paper is to assess and evaluate the importance of selected parameters such as heavy metal
concentrations, suspended particles, sediment concentrations, particle diameters, contact time and adsorption coefficient (Kps) on the adsorption rate of heavy metals removals at muddy river condition.
MATERIALS AND METHODS Bed Sediment and water samples containing
suspended particles were obtained from the Vali Abad, Pole Zoghal and Masab hydrological stations on the Chalus River [6]. The main adsorbents were the four metal ions lead (Pb), copper (Cu), zinc (Zn) and iron (Fe), which were detected in the suspended particles and bed river sediment. The Chalus River pollutant sources are generally divided into the three following categories: sanitary, agriculture and industrial wastewater. The main source of pollutants in the Chalus River is industrial wastewater produced by the Sorb Dona mine.
The Sorb Dona mine is located at a height of about
3300 m above the free sea level and is situated 92 km from Chalus City. It has been in full operation since 1980. The design production capacity of the Sorb Dona mine was originally 70000 tons per annum. This target has been exceeded in the past. However, the current production output is about 28000 tons per annum. High amounts of silver, zinc sulfur, sodium carbonate and pyrite have been extracted from the mine stone. During the production process, lead is separated from gold, silver, zinc and iron. Nevertheless, there is usually a relatively high lead deposit concentration in the waste even after treatment.
Figure 18 shows the location of the Sorb Dona mine and sampling stations. The Vali Abad station is situated 67 km from the Caspian Sea, while the Pole Zoghal station is located 22 km from the Sea. Masab station is situated approximately 1 km away from the Caspian Sea. The survey stations are also housing the hydrometric stations. The latter are supervised by the regional water authority.
Figure.18: Sampling station locations within the Chalus River catchment
Amini Rad et al.,: Int. J. Bioassays, 2013, 02 (09), 1260-1268
www.ijbio.com 1264
Bed Sediment and suspended particles samples were obtained from the Vali Abad, Pole Zoghal and Masab hydrological stations in the Chalus River. Adsorbents were the four metal ions lead (Pb), copper (Cu), zinc (Zn) and iron (Fe), which were detected in the suspended particles and bottom sediment.
Adsorption characteristics of the four metal ions
Pb, Cu, Zn and Fe associated with both bed sediment and suspended solids were studied. Heavy metal concentrations were found to be in the range between 4.79 and 14.11 mg/L. The samples were prepared by adding Sediment into the raw original river water, and blank water for each station. The experiment was carried out in a batch reactor with the initial Pb, Cu, Zn and Fe concentration of 13.12 and 14.11, 4.69 and 4.79 and 5 mg/L respectively. These data was recorded by environment protection agency of Mazandaran at Sorb Dona mine, during peak production times between 2005 and 2009 [11].
The test beakers were used in conjunction with the
mixer at constant temperatures condition. In this experiment the effect of two different contact times; i.e. 30 and 60 min on the rate of adsorption were studied.
The capacity of adsorbed metal onto the solid
particle was determined by Standard flame atomic absorption spectrometer (model GBC). Calculated by measuring the difference between initial and final concentration was used to analyze heavy metal ions concentrations.
The equilibrium sorption capacity solid is
determined from following equation:
m
CCVq e
e
)( 0 −= (1.1)
Where C0 is the initial concentration in mg/L, Ce is the concentration at equilibrium in mg/L, qe the mount of heavy metals adsorbed at equilibrium in mg/g, m the adsorbent mass in g and V is the solution volume in L.
In addition, the total organic carbon (TOC) content
was measured at each station. The TOC was determined using the standard combustion-infrared method according to AWWA (1990). Samples were homogenized and diluted to desired level and then a micro-portion of the prepared sample was injected into a heated reaction chamber packed with an oxidative catalyst such as cobalt oxide. The water was vaporized and the organic carbon was oxidized to carbon dioxide and water. The carbon dioxide from oxidation of organic and inorganic carbon was transported into the carrier-gas streams and was measured by a non-dispersive infrared analyzer. An evaluation of the capacity of adsorption, the experiments were carried
out with a range of concentrations between 1000 to 11000 mg/l (AWWA, 1990). This range was simulated from the hydrometric stations recording data findings from operated by the regional water company of Mazandaran between 1980 and 2009 [12].
The test beakers were used in conjunction with the
Jar Test apparatus at equal temperatures and velocities, and at two testing times; i.e. 30 and 60 min. The solid phase was separated by filtration through a 0.045 mm membrane filter.
The amount of adsorbed metal onto the solid
phase was calculated by examining the difference between the amount of metal added and the final metal concentration in the solution. The filtrates were analyzed for heavy metal ion concentrations using a standard flame atomic absorption spectrometer (model GBC).
In addition, the total organic carbon (TOC) content
was measured at each station. The TOC was determined using the standard combustion-infrared method [7]. Each sample was homogenized and diluted as necessary and a micro-portion was injected into a heated reaction chamber packed with an oxidative catalyst such as cobalt oxide. The water was vaporized and the organic carbon was oxidized to carbon dioxide and water. The carbon dioxide from oxidation of organic and inorganic carbon was transported into the carrier-gas streams and was measured by a non-dispersive infrared analyzer. For evaluation of the capacity of adsorption, the experiments were carried out with a range of concentrations between 1000 and 11000 mg/l suspended solids and sediment [7]. This range was selected based on findings from the hydrometric stations operated by the regional water company of Mazandaran between 1980 and 2009.
For simulating the river flow characteristics in laboratory, a batch reactor with mixer with variable speed (Jar test) was used. In this experiment two types of equations, such as velocity equation and isotherm equation were studied.
gD
uF r = (2.1)
V
pG
µ= (3.1)
2/1
3
)2
(µρν
V
ACG pPD= (4.1)
ωπν ×=rev
mDp
(5.1)
53DnkP ρ= (6.1)
where G is gradient of the velocity (S-1), CD is the coefficient of drag without dimension (1.8), Ap area of
paddles vane (m2), Pw is density of water (g/cm3), Vp is
Amini Rad et al.,: Int. J. Bioassays, 2013, 02 (09), 1260-1268
www.ijbio.com 1265
paddle turning velocity (m/s), V is mixed volume chamber (m3), P is input power for mixing (w), K is the constant (0.32), µ is the dynamic viscosity (N.s/m), D is diameter of propeller (m) and n is number of reveloution per second (rev/s), for the experiment is 300 rpm. The selected velocity of river water can be calculated by equation (5.1) this experimental study the actual recorded velocity by the Mazandaran. Regional Water Company was simulated. Freundlich isotherm can be computed from below equation:
nef CKmx /1/ = (7.1)
Where; x/m is amount of heavy metal ions adsorbed per unit mass of adsorbent in mg/g; Ce is equilibrium concentration of heavy metal ions in mg/l; Kf and n are Freundlich constants. These constants can be computed by plotting x/m against Ce, in which point of intercept with y axes and slope are representing kf
and n respectively. Langmuir isotherm can be computed from below equation:
msm ackax
m 111 +⋅= (8.1)
Where X is the concentration (mg/L) of adsorbate (metal) adsorbed at equilibrium; m is the concentration (g/L) of adsorbent; Cs is the concentrated (mg/L) of adsorbate (metal) at equilibrium; am is the amount (mg/g) adsorbate adsorbed to form a monolayer; and k is the Langmuir constant. A plot of m/x against 1/Cs gives a straight line from the interception and slop of curve am and k can be calculated. Here the unit of the ratio m/x is g/mg.
RESULTS AND DISCUSSION The sediment particle size is shown in table 1. The
mean total organic carbon concentrations for the stations Valibad, Polezoghal and Masab were 19.12, 13.94 and 23.00 mg/l, respectively. High carbon concentrations may indicate the presence of high numbers of particles and potentially also elevated heavy metal adsorption capacities. Table.1: Sediment and suspended particle size (percent %) by station
comparison to other environmental processes, and the presence of equilibrium can be assumed [5, 8].
Dissolved chemicals within the water column and
the benthic phase interact with sediment particles and
dissolved organic carbon (DOC) to form the following five phases: dissolved, DOC-adsorbed and sediment-adsorbed (three sediment types). The linear form of the Freundlich isotherm is applicable when sorption sites on sediment and DOC are plentiful.
Table 2 shows the data used for the WASP6 model
including TOC, adsorption, contact time, toxicants (i.e. key heavy metals combined) and the dose of sediment. The last column of table 2 also shows the adsorption coefficient Kps computed by theWASP6 model [9]. Figure 19 comprises a diagram of Kps versus the concentration of adsorbed material CS for different concentrations of solids (i.e. 1000, 3000, 7000 and 11000 mg/l). The coefficient of determination R2 was relatively high for concentrations of solids ≥3000 mg/l. However, R2 was relatively low indicating no relationship between Kps and CS regardless of the trend line that has been chosen. Table.2: Input data to the WASP model
Kps, Adsorption coefficient. Note that toxicants include predominantly lead, copper, zinc and iron.
Amini Rad et al.,: Int. J. Bioassays, 2013, 02 (09), 1260-1268
www.ijbio.com 1266
y1000 = 0.034e0.041x
R² = 0.03
y3000 = 0.032e0.060x
R² = 0.98
y7000 = 0.030e0.070x
R² = 0.98
y11000 = 0.011e0.130x
R² = 0.91
0.00
0.05
0.10
0.15
0.20
0.25
0.30
0.35
0.40
0 10 20 30
1000
3000
7000
11000
Expon. (1000)
Expon. (3000)
Expon. (7000)
Expon. (11000)
Cs × 10-2
(mg/l)
Kps ×
102 (-)
Figure.19: Relationships between the sorbed concentration CS and the adsorption coefficient Kps for different concentrations of suspended solids (mg/l)
The WASP model does not accept data separately as toxicant. Thus toxicant inserted to model the sum of heavy metal concentrations i.e. Pb, Zn, Cu and Fe. Tables 3 and 4 showed concentrations of heavy metal pervious and after analysis. Removal rate is determined from difference between initial and final soluble concentration. The following figures from 20 to 23 shows removal rate of heavy metals for between 1000 mg/lit to 11000 mg/lit concentration suspended solids and sediment.
Fig. 20: The removal rate of heavy metal in 1000 mg/lit suspended solids and sediment
Fig. 21: The removal rate of heavy metal in 3000 mg/lit suspended solids and sediment
Fig. 22: The removal rate of heavy metal in 7000 mg/lit suspended solids and sediment
Fig. 23: The removal rate of heavy metal in 11000 mg/lit suspended solids and sediment
Figure 24 showed the mean values for each time interval. It could be concluded that the adsorption varies linearly with the concentration of the suspended solids and the effect of contact time is insignificant. Therefore a linear isotherm can be used. Generally Freundlich isotherm as a liner isotherm use to simulate behavior adsorption in rivers.
Amini Rad et al.,: Int. J. Bioassays, 2013, 02 (09), 1260-1268
www.ijbio.com 1267
Figure.24: Adsorption isotherm versus mean values for each time interval
The adsorptive capacity of heavy metals onto the Chalus River bottom (bed) sediments and the suspended particles in the water column does not behave as expected for relatively low CS concentrations of 1000 mg/l but for higher concentrations. This might not be surprising since different metals, carbon contents and suspended soils are involved in the experiments. Affinities for the binding sites of the DOC and particles are specific for each metal and adsorbing material. Therefore, it is difficult to characterize all these processes with only one sum parameter (table 2). However, the advantage of this approach lies in its simplicity and good approximation for CS concentrations higher than 1000 mg/l.
CONCLUSION This paper highlights the natural adsorption
characteristics of total heavy metals onto the Chalus River bottom sediment and suspended particles. The advantage of assessing all metals combined lies in its simplicity and costs savings, which is particularly relevant for developing countries. However, the adsorptive capacity Kps does not behave as expected for relatively low CS concentrations of 1000 mg/l. Nevertheless, the range of Kps values was narrow. The corresponding trend line equation is not a typical adsorption equation. In fact, a solids concentration of 1000 mg/l is relatively rare concerning adsorption phenomena in the Chalus River. It follows that the absence of a statistical model for low solids concentrations has no practical relevance, and that the trend line equations obtained for higher solid concentrations are fit-for-purpose.
It was found that the adsorption ligament particles
or heavy metals onto suspended and bed sediment are
weeks. This can be due to the turbulent condition or particle surface electrical charges.
Comparison between blue and red curves in figure
3 shows that adsorption ligament particle or heavy metals are weeks. The reasons week ligament can be flow turbulent or electrical load surface of particles.
This research shows that natural condition of river
during wet period have adsorbing potential of heavy metal ions by suspended particle and bed sediment. Thus the removal of inorganic pollutants in rivers using mineral materials such as clay, bentonite, sand and charcoal is logical. These materials are natural and not having an environmental treat.
The heavy metals adsorption capacity of Chalus
River during the wet period is high, and this is due to high suspended solid and bed sediment.
REFERENCES 1. Salim, R., 1993, Adsorption of lead on the suspended particles of
river water. Water Research 17, 423–429.
2. Wang, X., 1983, Adsorption of heavy metals on Jinshajiang River sediment. Environmental Chemistry 2, (no page numbers).
3. Yuefeng, L.U. and Herbert, E.A., 2006, A Predictive model for copper partitioning to suspended particulate matter in river waters. Environmental Pollution 143, 60–72.
4. Jain, C.K., Singhal, D.C. and Sharma, M.K., 2003. Hydro-chemical Studies of the Hindon River, India: Seasonal Variations and Quality-Quantity Relationships. Journal of Environmental Hydrology 11, (no page numbers).
5. EPA, 2005, WASP6, A Hydrodynamic and Water Quality Model – Model Theory, User's Manual and Programmer's Guide (Athens, Georgia, USA: US Environmental Protection Agency (EPA)).
6. Kralic, M.A., 1999, Rapid procedure for environmental sampling and evaluation of polluted sediments. Applied Geochemistry 114, 807–816.
7. AWWA, 1990, Standard Methods for Examination of Water and Wastewater (Denver, Colorado, USA: American Water Works Association (AWWA) and American Public Health Organization).
8. Thomann, R.V. and Muller J., 1978, Principles of Surface Water Quality Modeling and Control (New York, USA: Happer and Row Publishers).
9. Chapra, C.S., 1997, Surface Water Quality Modeling (New York, USA: McGraw-Hill Company Inc.).
10. Hasannattaj Jelodar, A., Amini Rad, H., Navaiynia, B. and Zazouli, M.A., 2012, Heavy metal ions adsorption by suspended particle and sediment of the Chalus River, Iran. African Journal of Biotechnology 11 (3), pp. 628-634.
11. The environment protection administration of Mazandaran (2005-2009). The results unit of laboratory, Sari, Iran.
12. The regional water company of Mazandaran (1980-2009). The results unit of laboratory, Sari, Iran.
Amini Rad et al.,: Int. J. Bioassays, 2013, 02 (09), 1260-1268
www.ijbio.com 1268
13. Hasannattaj, A., Amini Rad, H., 2006, Introduction of surface water quality models, Iran. The first conference of environmental engineering,Tehran University, pp. 198-204.
14. Hasannattaj Jelodar, A., Amini Rad, H., Navaiynia, B. and Zazouli, M.A., 2012, Effective Suspended Particles and Sediment on
Water Flow Velocity. World Applied Sciences Journal 4 (2): 295-299, 2008
15. Varedi, E., 1998. Investigation and determination rate of heavy metal in Chalus River. The research fishes center of Mazandaran.
Source of support: Nil Conflict of interest: None Declared