56
Foundation Computing. Basic Schematic Diagrams 5957.docx Page 1 Generic Computing. Unit Standard 5957 Produce schematic diagrams using a computer application.
Foundation Computing
Basic Schematic Diagrams 5957docx Page 1
Generic Computing Unit Standard 5957
Produce schematic diagrams using a computer application
Foundation Computing
Basic Schematic Diagrams 5957docx Page 2
Contents Page PART 1 Plan schematic diagrams from a given brief Topic 1 Identifying the purpose and the target audience Topic 2 Identifying the computer application required Topic 3 Getting started with MS Paint Topic 4 Designing your diagram Self Test Self Test Answers
PART 2 Produce schematic diagrams from a given brief using a computer application Topic 1 Symbols used are consistent with diagram type and specifications Topic 2 Diagram is clear readable and consistent with specifications Self Test Self Test Answers
References
Foundation Computing
Basic Schematic Diagrams 5957docx Page 3
Produce schematic diagrams using a computer application
Unit Standard 5957 Version 6
Level 2 Credits 2
Purpose
People credited with this unit standard are able to plan and produce schematic diagrams using a computer application from a given brief
LEARNING GUIDE 5957
Copyright copy CTF Services Ltd (2005) All rights reserved No part of this material may be reproduced by any means
without permission in writing from the publisher
Foundation Computing
Basic Schematic Diagrams 5957docx Page 4
Elements and Performance Criteria
Element 1 Plan schematic diagrams from a given brief Performance criteria 11 The plan identifies the purpose and target audience for the schematic
diagram 12 The plan identifies the computer application required to produce the
schematic diagram
Element 2 Produce schematic diagrams from a given brief using a computer application Performance criteria 21 The symbols used in each diagram are consistent with the type of diagram
and the specifications of the brief 22 The final diagram is readable clearly illustrates the object being diagrammed
and is consistent with the specifications of the brief
Foundation Computing
Basic Schematic Diagrams 5957docx Page 5
Unit 5957 Produce schematic diagrams using a computer application
Module Objectives
When you have finished this workbook the practical exercises that are part of it and the assessment you will be credited with the NZQA unit 5957 You will be able to
Plan schematic diagrams from a given brief
Produce schematic diagrams from a given brief using a computer application Please follow this module guide and enjoy the material The unit is part of the qualifications framework so there are things you need to do to pass it They are listed on the previous few pages under ldquoElements and Performance Criteriardquo and you will be reminded of them here and there throughout this workbook
Assessment Self Tests for each section ndash these arenrsquot marked but they will be helpful to the students Assessment for this module ndash this will be marked and will count towards your final assessment
Resources Use the Learning Guide NZQA Unit Standard 5957 To demonstrate competency in this unit the person will require access to
Personal computers
Software applications such as MS Office
Operating system such as MS Windows XP Pro or higher
Peripheral devices such as printers mouse keyboard monitor other PCs and others
Prerequisites None
Foundation Computing
Basic Schematic Diagrams 5957docx Page 6
GLOSSARY OF TERMS Here is a short Glossary of Terms that is relevant to this Unit Standard We hope you will find it useful Sourced from httpwwwedisonohioedudtpdtpglosshtml alignment - the placement of type relative to margins left means lines share a left border but are uneven on the right side justified or fully justified means both left and right sides are aligned ascender - part of a lower case letter that rises above the x-height baseline - an imaginary line upon which rests the body of a line of type Descenders such as lower-case p or g drop below the baseline bold or boldface - an expression of weight also a style of type bullet - a type of character the most common being a large dot that is used to separate text or to begin paragaphs especially in lists Can be created on the Mac with the key combination Option-8 on the PC with Control-Shift-8 column - a vertical block of type or the space used to lay out type and graphics Pages may have as few as one column or many column guides - non-printing lines that define the left and right margins of columns on a page accessible through the Layout menu crop cropping - any technique that reduces the amount of a graphic that shows or prints In PageMaker the cropping tool can be used to crop horizontally or vertically crop marks - printed but non-reproducing marks that aid the printer in determining trim size descender - part of a lower case letter that drops below the baseline EPS - a file format that stands for Encapsulated PostScript used for high-resolution output and special effects fill - the property of an object that determines the appearance of the body of the object fill may be solid a tint or screen a pattern or none folio - printers term for page number font - often used interchangeably with face or type face is now actually the name of type such as Helvetica or Times Bold Traditionally a single size weight and style of type grid - non-printing guides including column guides and ruler guides that aid in structuring page layouts gutter - The space between pages in facing pages layouts halftone - in printing the technique of simulating shades of gray or color by varying the size of dots in a grid or the number of pixels in a given area
Foundation Computing
Basic Schematic Diagrams 5957docx Page 7
hanging indent - a paragraph format where the lines are indented a certain distance from the left margin but the first line is indented a negative amount so that the first line hangs over the rest of the left alignment horizontal - side to side left to right as in the sun sets below the horizon in-line graphic - a graphic element embedded in a paragraph as a text character It takes on alignment and other characteristics of the host paragraph indents - Additional space measured from the left and right of a text block or margin Indents can be Left in which all lines in the paragraph are the specified distance from the left margin Right in which all lines in the paragraph are the specified distance from the right margin and First in which the first line of the paragraph is an additional amount from the left margin Note that First can be a negative number up to the positive value of the left indent to form a hanging indent italic - general term used to describe slanted type although strictly italic letterforms vary from the non-italic original kerning - the adjustment of spacing between letter pairs leader - A character most commonly used with tabs to visually connect the text on either side of the tab most common character is the period followed by the underscore Do not confuse with leading leading - the distance from the baseline of one line of text to the baseline of the next usually measured in points line - the property of an object that determines the appearance of the perimeter of the object Lines may be solid a tint or screen patterns or none Line weight is measured in points line length - a function of the width of the text block minus any indents For body copy line length should be in picas 1 to 25 times the size of type in points margin - defined area surrounding a page that separates the trim from the live (printing) area mask - a technique for using the shape of one graphic object to crop or otherwise block out portions of another graphic object master page - a page identified by an L or R in the lower left corner of a document window on which you create elements that will appear consistently throughout the publication paragraph style - see Style sheet pica - a typographic measurement system consisting of 12 points there are 6 picas per inch points - the basic measure of type there are 72 points to the inch or 12 points to the pica point size - a measure of the size of type in points rule - printers term for a line ruler guide - a non-printing line that you drag from either the vertical or horizontal rulers to help you position elements on a page
Foundation Computing
Basic Schematic Diagrams 5957docx Page 8
running head - a line of text often containing the title that is consistent across most or all the pages in a publication running foot - a line of text often containing the folio that is consistent across most or all the pages in a publication sans serif - the class of type faces without serifs Helvetica is an example serif - a line or curved extension projecting from the end of a letter form can be used to distinguish a class of type faces such as Times from sans serif faces such as Helvetica set width - a typographic name for the horizontal scaling of type usually expressed as a percentage Squeeze or stretch might be other words for set width soft returns - in PageMaker holding the Shift key while pressing Return creates a soft return sometimes called a line break or new line but does not start a new paragraph Most often used in conjunction with bullet lists style - a variant of the basic type face such as Italic Bold Strikethrough or Outline Not to be confused with Style Sheets style sheet - essentially a script or shortcut for several text and paragraph formatting choices such as but not limited to indents rules typeface size and styles Style sheets apply to paragraphs at a time rather than individual words and are also sometimes called paragraph styles tab - a non-printing character that affects alignment of text that follows it may be left right center decimal See also leader text block - In PageMaker an object that contains text defined by handles at top bottom left and right Text blocks can be linked and a single story may have many text blocks To view a text block click on text with the Pointer Tool text wrap - the technique of flowing text around graphic elements In PageMaker the options are available under the Element menu tracking - preset letter spacing values trim size - size of the finished page after the excess has been cut away typeface or face - can refer to an entire related named family of type such as Helvetica or Times vertical - up and down top to bottom weight - term referring to the heaviness of a type faces stroke Terms often used are light medium book bold heavy ultra x-height - a value often expressed as a percentage that measures the height of the body of lowercase letters in a type face or in proportion to the upper case letters zero point - the point at which the on-screen vertical and horizontal rulers meet at 0 the position relative to the page is changeable by the user zoom - the act of enlarging or reducing the magnification on screen like moving closer or farther away refer to the View menu option
Foundation Computing
Basic Schematic Diagrams 5957docx Page 9
Part 1 Plan schematic diagrams
from a given brief OBJECTIVES
On successful completion of this section you will be able to Plan schematic diagrams from a given brief Performance criteria
11 The plan identifies the purpose and target audience for the schematic diagram
12 The plan identifies the computer application required to produce the
schematic diagram
TOPICS
Topic 1 Identifying the purpose and the target audience Topic 2 Identifying the computer application required Topic 3 Getting started with MS Paint Topic 4 Designing your diagram
Self Test
Self Test Answers
Foundation Computing
Basic Schematic Diagrams 5957docx Page 10
TOPIC 1 Identifying the purpose and the target audience
Letrsquos define a few terms (both definitions taken from NZQA Unit Standard 5957) A brief is defined as a clear description of both the desirable outcomes sought and the constraints to be met by the solution It contains requirements against which the success or otherwise of the desktop published document can be evaluated The brief can be supplied either as part of the candidatersquos employment (in the case of workplace assessment) or in response to a set task Text graphics and specified page layout will be provided for the task A plan outlines how the requirements of the brief will be realised For this unit standard the plan may be informal and it may be more appropriate to produce evidence of it during task completion rather than prior to starting the task or project Evidence of planning may be oral written andor graphic Accordingly we need to plan schematic diagrams from a given brief There are many ways to achieve our purpose However a) What are schematic diagrams b) What is the purpose for these schematic diagrams c) Who is our target audience
Schematic Diagrams Schematic diagrams are used to show the different parts or elements of a system or process and how they are connected and related to each other Examples of systems include
organisations like your school or
computer networks or
electrical circuits A mind map that you might use to plan an essay is a simple example of a schematic diagram In this case your essay is the system and the different elements are the different facts and ideas and headings that you need to include in your essay Processes can include
instructions for how to do something
software programming or
plans for an event such as a wedding
Foundation Computing
Basic Schematic Diagrams 5957docx Page 11
A schematic is a diagram that represents the elements of a system using abstract graphic symbols rather than realistic pictures A schematic usually omits all details that are not relevant to the information the schematic is intended to convey and may add unrealistic elements that aid comprehension For example
a subway map intended for riders may represent a subway station with a dot the dot doesnt resemble the actual station at all but gives the viewer information without unnecessary visual clutter
A schematic diagram of a chemical process uses symbols to represent the vessels piping valves pumps and other equipment of the system emphasizing their interconnection paths and suppressing physical details
In an electronic circuit diagram the layout of the symbols may not resemble the layout in the physical circuit In the schematic diagram the symbolic elements are arranged to be more easily interpreted by the viewer
A schematic of the Washington Metro The schematic is not drawn to scale distances
between stations are fixed and lines are drawn at 45 and 90-degree angles
Foundation Computing
Basic Schematic Diagrams 5957docx Page 12
In the electrical industry a schematic diagram is often used to describe the design of equipment Schematic diagrams are often used for the maintenance and repair of electronic and electromechanical systems Original schematics were done by hand using standardized templates or pre-printed adhesive symbols but today Electrical CAD software is often used Schematic diagrams are used extensively in repair manuals to help users understand the interconnections of parts and to provide graphical instruction to assist in taking apart and rebuilding mechanical assemblies Many automotive and motorcycle repair manuals devote a significant number of pages to schematic diagrams
Exercise 1 See if you can match each of the names in the box with one of the schematic diagrams below
Flow Chart
Organisation Chart
Electrical circuit
Mind map A)
Marketing Plan
Placement
ProductPromotion
Price
Competitive
weaknesses
Competitive
strengths
New features
Trade shows
Mailings
Advertising
B)
Jeremy Nash
CEO
Adam Jurgensen
Operations
Manager
Aneru Jacobs
Sales and
Marketing
Obed Tambo
District Coodinator
Manaia Pehi
Financial
Manager
Hashim Mohamed
Accountant
Janet Brookes
Personal Assistant
Steven Alleroo
IT Manager
Cindy Wahoo
Technician
Foundation Computing
Basic Schematic Diagrams 5957docx Page 13
C)
120V
480V
U
L
L
U
LOR
RESET
OL
TR2
TR3
VIB
VIB
WTR
MOTOR
BLOWER
PS
LOR
ON-OFF
SS
TR3
START
M
START
RUN
HAND
OFF
REMOTE
LOR
M
REMOTE
MODE
M
PS
TR1
TR2
S
To LOR COIL CIRCUIT
M
MSH
ON-OFF
R
W
TR1
X1
D
C
B
A
4 3 2 1
D
C
B
A
4 3 2 1
D)
Foundation Computing
Basic Schematic Diagrams 5957docx Page 14
Answers A = Mindmap B = Organisation chart C = Electrical circuit diagram D = Flow chart Schematic diagram production Before suitable computer applications were developed schematic diagrams were produced manually using tools such as typewriters stencils stickers or labels and drawing by hand Sometimes it can be quicker to produce simple schematic diagrams by hand or you may not have a computer available or the computer application available might be too complex or take so long to learn that it makes more sense to use manual methods Alternatively you may have a highly complex schematic diagram that is too big to print out on the computer printers available and would not make sense if spread over a number of pages
Exercise 2) In the space below or on a piece of paper describe some situations in which you would choose to use a computer application to produce your schematic diagram and explain why
Exercise 3) Now describe some situations in which you would choose NOT to produce your schematic diagram using a computer application and explain why not
Exercise 4) Working with a partner brainstorm the advantages and disadvantages of producing schematic diagrams with a computer application rather than by hand
Foundation Computing
Basic Schematic Diagrams 5957docx Page 15
Suggested answers to the exercises 2) In the space below describe some situations in which you would choose to use a computer application to produce your schematic diagram and explain why Situations could include (and there are many more)
Preparing a flow chart to send by email to all the members of a team ndash because doing it on computer would allow me to make multiple copies and email them easily
Producing a complex network diagram as part of a report to present ndash because it would look more professional and could be easily changed or updated
Preparing an organisation chart to include in a computerised slideshow - because it could easily be imported
3) Now describe some situations in which you would choose NOT to produce your schematic diagram using a computer application and explain why not
Situations could include
Presenting an organisation diagram or a flow chart to a community organisation as a one-off event if I did not have access to a large-scale printer or projector I would draw or paint the diagram by hand ndash because it would be the simplest way to make it large enough for everyone to see and I would be unlikely to need more copies
In an assessment situation drawing a mind map or brainstorming diagram to organise my ideas before writing an essay or report ndash because it would be quickest
Working with a team to sketch out a plan for a process because it would be quickest and wouldnrsquot rely on being close to a computer
Foundation Computing
Basic Schematic Diagrams 5957docx Page 16
4) Working with a partner brainstorm the advantages and disadvantages of producing schematic diagrams with a computer application rather than by hand
Your results of your brainstorm might look like this (diagram produced using MS Visio)
Using computers AdvantagesDisadvantages
need to learn
application
can take longer
sometimes difficult
to plan
limited options for
layout
frustrating
too many options
incompatible file
types
can store on
computer
can fit more smaller
text
easy to read
can email to people
use templates
easy to change or
update
Can be quick
easy to make
copies
professional looking
import into
computer
documents
Expensive
equipment needed
technical problems
Security
Foundation Computing
Basic Schematic Diagrams 5957docx Page 17
Process for producing schematic diagrams on computer There are many different computer applications that can be used to produce schematic diagrams Some applications like Microsoft Visio are specifically designed to help you create a wide range of complex schematic diagrams easily However almost any computer application that has a drawing tool can be used to produce a schematic diagram and the process will usually involve the following steps 1) Design the diagram
a Identify your target audience b Collect all the information you need c Arrange your information in a logical order d Test your diagram
2) Create the diagram in the computer application
a Open the drawing window b Draw the shapes you want c Arrange the shapes according to your design d Add connectors between each of the shapes e Add text where required
Designing effective diagrams The main purpose of a schematic diagram is to provide a clear and easy to understand visual overview of how the different parts of a system fit together Schematic diagrams that are well-designed
are as simple as possible
are easy for the target audience to understand
include all relevant elements or parts of the process
have clear and logical connections between elements
communicate an accurate picture of the system or process
Foundation Computing
Basic Schematic Diagrams 5957docx Page 18
Identifying the target audience The target audience is the group of people who will read your schematic diagram The main question you need to ask yourself is Who is my audience In order to identify the target audience for your schematic diagram think about the following
What sort of person will read your diagram Think about that personrsquos job age education language environment and other characteristics that could affect the sort of language and symbols they will understand and relate to
What information will that person look for Why are they reading your diagram What do they want or need to know What information is most important What information is not so important
How much time will that person have to look at your diagram Will they be in a hurry or will they have time to study all the details Does your diagram have to stand alone or will it have a lot of text next to it to explain it
What do you want your audience to learn or do as a result of reading your diagram
What does the diagram need to show What information do you have to include How should this information be arranged
Foundation Computing
Basic Schematic Diagrams 5957docx Page 19
Exercise Complete the table below with information about the target audience and purpose for each of the examples of schematic diagrams given Use the questions above to help you
Example diagram Target audience
You work as an electrician and Mr Jones has asked you to design an electrical wiring plan for the dream house he wants to build
You are a computer programmer and you are using a flowchart to plan a computer program that farmers can use to keep count of their sheep
You have to write an essay about your most embarrassing childhood experience and you create a mindmap to organise your ideas
You are researching your family history and have been asked to create a family tree diagram for a booklet that will be handed out at an upcoming family reunion
Foundation Computing
Basic Schematic Diagrams 5957docx Page 20
Suggested Answer Complete the table below with information about the target audience and purpose for each of the examples of schematic diagrams given Use the questions above to help you
Example diagram Target audience
You work as an electrician and Mr Jones has asked you to design an electrical wiring plan for the dream house he wants to build
Mr Jones his builder local council officials theyrsquoll need detailed information that will be studied in depth and referred to during the planning and building process
You are a computer programmer and you are using a flowchart to plan a computer program that farmers can use to keep count of their sheep
You and other computer programmers will use the flowchart to understand the process of the programme and to identify flaws in its logic
You have to write an essay about your most embarrassing childhood experience and you create a mindmap to organise your ideas
You are the only person who will use your mindmap and you will refer to it as you write your essay
You are researching your family history and have been asked to create a family tree diagram for a booklet that will be handed out at an upcoming family reunion
Members of your family will look for their names and those of relatives in order to see how people are related to each other
Foundation Computing
Basic Schematic Diagrams 5957docx Page 21
TOPIC 2 Identifying the computer application required There are many computer applications that can be used to create schematic diagrams Microsoft Visio is specifically designed for this purpose but any application with basic drawing tools such as those found in Microsoft Word can be used One of the simplest and most widely available computer drawing applications is Microsoft Paint We will use this application is used to demonstrate the tools However most of the tools and principles we will focus on in Microsoft Paint can be found in other drawing applications The following diagram shows the Microsoft Paint window
The tools are arranged to the left of the drawing area in the Tool bar An overview of how to use the tools you need to create a simple schematic diagram is provided below Underneath the Tool bar is the Options box When you click on a tool icon in the Tool bar the options available for that tool appear in the Options box To select an option click on the tool you want to use then click on the option and then click in the drawing area and drag the mouse pointer to draw The Colour palette is underneath the drawing area To use a colour click on the tool you want to use then click on the colour and then click in the drawing area ndash the shape line or text you create will appear in the colour you have selected
Foundation Computing
Basic Schematic Diagrams 5957docx Page 22
Tools Selection Tools Use the selection tools to select the parts of your schematic diagram that you want to work with or change in some way To use these tools click on the button of the tool you want and then click on your diagram and drag until the area you want to work with is selected The Freeform Select tool (on the left) is used to select an irregularly shaped area The Rectangle Select tool is used to select a rectangular area To copy a part of your diagram eg a shape line or text it must first be selected using a selection tool Select Copy from the Edit menu click where you want the copy to be positioned and select Paste from the Edit menu Shapes tools
The shapes tools which can be used to create symbols in schematic diagrams consist of the Rectangle tool for creating squares or rectangles the Polygon tool for creating multi-sided shapes the Rounded Rectangle tool for creating rounded rectangles and the Oval tool for creating circles or ovals These tools provide templates for creating frequently used symbols To use them simply click on the icon of the shape you want to use and drag it onto your diagram where you can resize it if necessary and add text or
Foundation Computing
Basic Schematic Diagrams 5957docx Page 23
effects For the Polygon tool click and drag to draw the first side and click each time you want to change direction Double-click when you have finished To create a perfect circle hold down the Shift key while you are dragging the mouse pointer
Line tools In schematic diagrams line tools can be used to draw connectors between symbols and to draw shapes or symbols
The Straight Line tool creates straight lines simply click on the Straight Line icon click in your picture where you want the line to start and drag to where you want the line to finish The Curve tool will create a curve with at least one and no more than two bends in it click on the Curve icon then click in your picture to draw a straight line and drag to where you want the first bend to be click again where you want the second curve to be and drag to shape the curve You can make more complex shapes by joining lines and curves together
The Pencil tool can be used to draw freeform shapes or lines with as many bends and curves as you want Click on the icon click in your diagram and ldquodrawrdquo with your mouse pointer To draw straight lines hold down the shift key as you are drawing with the mouse
Foundation Computing
Basic Schematic Diagrams 5957docx Page 24
The Paint Brush tool draws freeform lines in the same way as the Pencil tool but can be used to create lines of varying widths and styles To select a paintbrush style click on the Paint Brush icon and then click in the Options box on the style you want to use
The Airbrush tool creates lines with an airbrushed effect of clustered dots It can be used in the same way as the pencil tool to draw freeform shapes or symbols In the Options box you can choose the size of the area covered by the Airbrush tool
Text tool
Add text to your schematic diagram by clicking on the Text icon and clicking in your diagram where you want the text to appear As you drag a rectangle will be formed within which text can be typed The Fonts dialogue box will also open
Foundation Computing
Basic Schematic Diagrams 5957docx Page 25
Fill Tool
The Fill tool will add colour to a shape that you have drawn Click on the icon click on a colour from the colour palette and then click on the shape in the diagram that you want to fill with colour
Zoom tool
Use the Zoom tool to magnify a section of the diagram that you are working with Click on the magnifying glass icon select the size you want in the Options box and click on the part of the image you want to enlarge As the picture zooms in the cursor will change back to the tool you were using before
Adding colour
The Colour box to the left of the Colour palette shows the foreground and background colours you are using If you click on a tool and then drag while holding down the left mouse button the line or shape will be drawn using the foreground colour If you hold down the right mouse button the background colour will be used To use any other colour click on the tool you want to use click on an option (if using) then click on the colour you want from the colour palette As you draw the colour you have clicked on will be used
Foundation Computing
Basic Schematic Diagrams 5957docx Page 26
Additional resources For more detailed information about these tools refer to the Help menu in Microsoft Paint (httpwindowshelpmicrosoftcom )
The following online tutorials may also be useful
httplkwdplorgclassesMSPaintpainthtml
httpwwwlesleyedufacultyahuntMSPttutrhtm
Exercise The example below shows a simple organisation chart produced using Microsoft Paint In the space that follows identify which tools were used to create this schematic diagram and what each tool was used for
Rectangle tool used to create Manager symbol
Oval tool used to create Team Leader symbols
Rounded Rectangle tool used for Team member symbols
Straight line tool used to create connectors
Text tool used to add text to shapes
Rectangle Select tool used to select shapes to move into
position
Foundation Computing
Basic Schematic Diagrams 5957docx Page 27
Suggested Answer The example below shows a simple organisation chart produced using Microsoft Paint In the space that follows identify which tools were used to create this schematic diagram and what each tool was used for
Rectangle tool used to create Manager symbol
Oval tool used to create Team Leader symbols
Rounded Rectangle tool used for Team member symbols
Straight line tool used to create connectors
Text tool used to add text to shapes
Rectangle Select tool used to select shapes to move into position
Foundation Computing
Basic Schematic Diagrams 5957docx Page 28
Exercise Which tools would you use to produce the following symbols or diagrams and why
Symbol Tools and justification
Resistor (Electrical circuit diagram)
Speaker (Electrical circuit diagram)
AC
AC source (Electrical circuit diagram)
Start or end of process (Flowchart)
Decision (yes or no) (Flowchart)
Instructions or actions (Flowchart)
Foundation Computing
Basic Schematic Diagrams 5957docx Page 29
Symbol Tools and justification
Document produced (Flowchart)
Data entered or received (Flowchart)
Foundation Computing
Basic Schematic Diagrams 5957docx Page 30
Suggested Answers Which tools would you use to produce the following symbols or diagrams and why
Symbol Tools and justification
Resistor (Electrical circuit diagram)
Straight line tool (hold down shift key)It creates regular 45 degree angled lines that are perfectly straight
Speaker (Electrical circuit diagram)
Polygon tool (hold down shift key) Rectangle tool and Straight line tool These are used in order to create a symbol with uniform angles and straight edges
AC
AC source (Electrical circuit diagram)
Oval tool (hold down shift key) to draw circle Curve tool to draw wavy line Straight line tool and Text tool These tools produce cleaner shapes than drawing freeform
Start or end of process (Flowchart)
Rounded rectangle tool This provides a template for creating this symbol
Decision (yes or no) (Flowchart)
Polygon tool This creates more accurate joins between sides than the Straight line tool
Instructions or actions (Flowchart)
Rectangle tool It provides a template for drawing this shape
Foundation Computing
Basic Schematic Diagrams 5957docx Page 31
Symbol Tools and justification
Document produced (Flowchart)
Line tool and Curve tool ndash need two tools in MSPaint other applications may have a template for this shape
Data entered or received (Flowchart)
Polygon tool ndash better than Straight line tool because can produce more regular shape
Foundation Computing
Basic Schematic Diagrams 5957docx Page 32
TOPIC 3 Getting started with MS Paint Sourced from httpwindowsmicrosoftcomen-NZwindows7Getting-started-with-Paint MS Paint is a feature in Windows that you can use to draw colour and edit pictures You can use Paint like a digital sketchpad to make simple pictures creative projects or to add text and designs to other pictures such as those taken with your digital camera The parts of Paint Open Paint by clicking the Start button clicking All Programs clicking Accessories and then clicking Paint When you start Paint youll see an empty window drawing and painting tools are located in the ribbon at the top of the window The following illustration shows the different parts of the Paint window
The Paint window
Foundation Computing
Basic Schematic Diagrams 5957docx Page 33
Working with tools The ribbon in Paint includes a handy collection of drawing tools You can use these tools to create freehand drawings and add a variety of shapes to your pictures This section describes some common tasks For more detailed information on how to use the different tools in Paint see Using Paint Draw a line Some tools and shapes such as the Pencil Brush Line and Curve let you make a variety of straight curved and squiggly lines What you draw is determined by how you move the mouse as you draw You can use the Line to draw a straight line for example
1) On the Home tab in the Shapes group click the Line 2) In the Colors group click Color 1 and then click the color you want to use 3) To draw drag the pointer across the drawing area
Draw a squiggly line Your drawings dont have to be composed of only straight lines The Pencil and Brushes can be used to make completely random free-form shapes
1) On the Home tab in the Tools group click the Pencil tool 2) In the Colors group click Color 1 and then click the color you want to use 3) To draw drag the pointer across the drawing area and make a squiggly line
Note If you want to make a line that has a different appearance use one of the Brushes instead Draw a shape Paint lets you draw many different shapes For example you can draw ready-made defined shapes such as rectangles circles squares triangles and arrows (to name a
few) You can also make your own custom shape by using the Polygon shape to draw a polygon which is a shape that can have any number of sides
1) On the Home tab in the Shapes group click a ready-made shape such as the
Rectangle 2) To add a ready-made shape drag the pointer across the drawing area to make
the shape 3) To change the outline style in the Shapes group click Outline and then click an
outline style 4) If you dont want your shape to have an outline click No outline 5) In the Colors group click Color 1 and then click a color for the outline 6) In the Colors group click Color 2 and then click a color to use to fill the shape 7) To change the fill style in the Shapes group click Fill and then click a fill style 8) If you dont want your shape to be filled click No fill
Foundation Computing
Basic Schematic Diagrams 5957docx Page 34
Add text You can also add text to your picture The Text tool lets you add a simple message or title
1) On the Home tab in the Tools group click the Text tool 2) Drag the pointer in the drawing area where you want to add text 3) Under Text Tools on the Text tab click the font face size and style in the Font
group The Font group
4) In the Colors group click Color 1 and then click a color This is the text color 5) Type the text that you want to add
Erase part of your picture If you make a mistake or need to change part of a picture use the eraser By default the eraser changes any area you erase to white but you can change the eraser color For example if you set the background color to yellow anything you erase turns to yellow
1) On the Home tab in the Tools group click the Eraser tool 2) In the Colors group click Color 2 and then click the color that you want to erase
with If you want to erase with white you dont have to select a color 3) Drag the pointer over the area you want to erase
Saving a picture Save your picture frequently so you dont accidentally lose your work To save click the
Paint button and then click Save This saves all of the changes made to the picture since the last time you saved The very first time that you save a new picture you will need to give your picture a file name Follow these steps
1) Click the Paint button and then click Save 2) In the Save as type box select the file format you want 3) In the File name box type a name and then click Save
Foundation Computing
Basic Schematic Diagrams 5957docx Page 35
Topic 4 Designing your diagram Although there are many different types of schematic diagrams the basic process and principles involved in designing a clear and coherent diagram are similar The principles apply to designing an electrical circuit diagram an organisation chart a mind map a flow chart and many other diagrams Some of these principles are also worth applying to other disciplines such as designing a Web page Letrsquos work step-by-step through the process of creating a flow chart to help people make money selling things on an on-line auction site such as wwwtrademeconz or wwwebaycom
Step 1 Gather your information Start by brainstorming all the information you need to include in your diagram Write down everything you think might be important or should be included
trademe
choose things that
sell
good photograph
feedback
keep track
prompt answers
postage
auction length
similar listings
postal system
setting reserve
describing item
correct category
re-listing
fixed offers
Look at the information you have gathered and think about your target audience Highlight the information that is most important to your target audience Cross out any irrelevant information Put question marks next to information that you are unsure about or may be able to leave out
Foundation Computing
Basic Schematic Diagrams 5957docx Page 36
Step 2 Organise your information Take the information that you have left and sort through it How you organise your information will depend on the type of diagram you are designing For example an organisationrsquos chart usually has different levels and shows who its members report to so you might group people by department and by level A flow chart like the example wersquore creating usually shows a process Information is grouped in the order we would use it If any other steps or information occurs to you as you are organising your information add them in Herersquos an example of how the key steps involved in selling on trademe could be ordered
Choose items that sell
Look at similar listings
Decide on a reserve price
Take a clear photograph
Identify your target audience
Write a clear description
Upload your item
Choose the correct category
Monitor watchers bids and views
Lower your reserve
Fixed price offers
Relist
Step 3 Make connections Once the elements are grouped or arranged in a logical order a clearer picture of the process or system you are representing in your diagram should start to emerge However unlike a list which usually reads from top to bottom only a diagram can show connections in many different directions and working out the links between elements is an essential part of designing a coherent diagram At this stage of the design process it is helpful to sketch out a basic plan of the elements you want to include and the flow-lines or connections between them In order to work out the connections between the elements ask questions such as What happens ifhellip What do I do beforeafter this What decisions need to be made now What actions need to be taken Use arrows to show connections between elements group elements that are part of the same stage or level of the process next to or near to each other and use shapes to show which elements are similar to each other eg diamonds for decisions rectangles for instructions or actions Make up your own meanings for shapes if necessary but be sure to use them consistently
Foundation Computing
Basic Schematic Diagrams 5957docx Page 37
The flow chart below shows how our list of elements above changes and gets re-ordered as we ask these questions and organise the information into a logical and coherent diagram
Decide on your
reserve price
START
Relist
Take a photo that is
clear and item looks
good
Decide on your
ideal buyer
Write a description
of your item
highlighting its
benefits for your
buyer
Upload your item in
a category your
buyer is likely to be
looking in
Monitor how many
views watchers and
bids your item gets
Lower your reserve
Item meets reserve
and sellsItem doesnrsquot sell
Offer to watchers for
your reserve
Decide what you
want to sell
Check what similar
items are currently
selling for
Lots of views but
no watchers
No interestFINISH
Foundation Computing
Basic Schematic Diagrams 5957docx Page 38
Step 4 Test your diagram The final step in designing your diagram is checking that it is as effective as possible To do this you should work through each stage step by step challenging it as you go Picture the process in your mind as you follow the links checking that you have included all the actions and decisions required that they are in the correct order and that no steps are duplicated Once yoursquore confident that the diagram is correct look at it again critically to see if you can improve it or clarify it Is there anywhere you can simplify it by removing unnecessary steps Is there anywhere that seems vague and would be easier to understand if you added a step or a connector Now imagine that you are a member of your target audience For a moment try to forget everything you know about the system or process you have designed a diagram for except for what your target audience knows Look at the diagram with fresh eyes does it make sense to you now Does anything seem odd confusing or out of place Finally look at the layout of your diagram Is it easy to read and follow Have you used shapes texts and arrows consistently Are your shapes and texts uniform and lined up properly Are your connectors clearly defined or are they criss-crossing all over each other Check the spelling of labels carefully ndash go through letter by letter to make sure all names and technical or unfamiliar terms are correct
Discussion With a partner look critically at our example diagram above Discuss any parts of it that you think could be better and any changes you would make to improve the readability of the flow chart Make note on the flow chart above of any areas that you think could be improved Share your answers with the rest of the class
Foundation Computing
Basic Schematic Diagrams 5957docx Page 39
Self Test 1) Mr Biggles owns Biggles Air Supplies a company that makes aircraft supplies He asks you to create an organisation chart for his company He gives you the following list of all his employees and who they report to
Mr James Biggles Chief Executive Officer
Jane Doep Personal Assistant to CEO
Mrs Monica Stepworth Financial Manager (reports to CEO)
Judith Zantes Accountant (reports to Financial Manager)
Mary Smallville Accountant (reports to Financial Manager)
Janey Poretuna Admin Assistant (reports to Judith Zantes)
Mickey Laluevu IT technician (reports to Financial Manager)
Mr Hank Johnson Operations Manager (reports to CEO)
Frank Hapil Engineering Manager (reports to Operations Manager)
Joe Smither Engineering Supervisor (reports to Engineering Manager)
Howie Fartherton Engineering Technician (reports to Engineering Supervisor)
Ernie Jusef Engineering Technician (reports to Engineering Supervisor)
Rob Luxemburg Apprentice Technician (reports to Ernie Jusef)
Harry Monahan Interiors Manager (reports to Operations Manager)
Barney Jokka Interiors Technician (reports to Interiors Supervisor) Design an organisation chart for Biggles Air Supplies and draw it in the space below
2) Think of a simple process that has at least five steps and involves some form of feedback or choice For example operating a vending machine topping up your mobile phone using EFTPOS checking messages on an answering machine
Design a flow chart to represent your process
Foundation Computing
Basic Schematic Diagrams 5957docx Page 40
Self Test Answers
1) Mr Biggles owns Biggles Air Supplies a company that makes aircraft supplies He asks you to create an organisation chart for his company He gives you the following list of all his employees and who they report to
Mr James Biggles Chief Executive Officer
Jane Doep Personal Assistant to CEO
Mrs Monica Stepworth Financial Manager (reports to CEO)
Judith Zantes Accountant (reports to Financial Manager)
Mary Smallville Accountant (reports to Financial Manager)
Janey Poretuna Admin Assistant (reports to Judith Zantes)
Mickey Laluevu IT technician (reports to Financial Manager)
Mr Hank Johnson Operations Manager (reports to CEO)
Frank Hapil Engineering Manager (reports to Operations Manager)
Joe Smither Engineering Supervisor (reports to Engineering Manager)
Howie Fartherton Engineering Technician (reports to Engineering Supervisor)
Ernie Jusef Engineering Technician (reports to Engineering Supervisor)
Rob Luxemburg Apprentice Technician (reports to Ernie Jusef)
Harry Monahan Interiors Manager (reports to Operations Manager)
Barney Jokka Interiors Technician (reports to Interiors Supervisor) Design an organisation chart for Biggles Air Supplies and draw it in the space below
Mr James Biggles
CEO
Jane Doep
Personal
Assistant
Mrs Monica Stepworth
Financial Manager
Judith Zantes
Accountant
Janey Poretuna
Admin Assistant
Mary Smallville
Accountant
Mickey Laluevu
IT technician
Mr Hank Johnson
Operations Manager
Frank Hapil
Engineering
Manager
Harry Monahan
Interiors Manager
Joe Smither
Engineering
Supervisor
Howie Fartherton
Engineering
Technician
Ernie Jusef
Engineering
Technician
Rob Luxemburg
Apprentice
Technician
Barney Jokka
Interiors
Technician
Foundation Computing
Basic Schematic Diagrams 5957docx Page 41
2) Think of a simple process that has at least five steps and involves some form of feedback or choice For example operating a vending machine topping up your mobile phone using EFTPOS checking messages on an answering machine
Design a flow chart to represent your process
Dial 06345
Enter your dialing code and
phone number followed by
the key
Dial number for
service you require
Listen to saved messagesListen to new messages
Dial number for
service you require
Save message Delete message
START
FINISH
Dial 2
Dial 1
Dial 1
Dial 2
Dial 1
Dial 2
Foundation Computing
Basic Schematic Diagrams 5957docx Page 42
Foundation Computing
Basic Schematic Diagrams 5957docx Page 43
Part 2
Produce schematic diagrams from a given brief using a computer application
OBJECTIVES
On successful completion of this section you will be able to Produce schematic diagrams from a given brief using a computer application
Performance criteria
21 The symbols used in each diagram are consistent with the type of diagram and the specifications of the brief
22 The final diagram is readable clearly illustrates the object being diagrammed
and is consistent with the specifications of the brief
TOPICS
Topic 1 Symbols used are consistent with diagram type and specifications Topic 2 Diagram is clear readable and consistent with specifications
Self Test
Self Test Answers
Foundation Computing
Basic Schematic Diagrams 5957docx Page 44
TOPIC 1 Symbols used are consistent with diagram type and specifications A symbol is something such as an object picture written word sound or particular mark that represents something else by association resemblance or convention For example a red octagon may be a symbol for STOP On maps crossed sabres may indicate a battlefield Numerals are symbols for numbers All language consists of symbols The word cat is not a cat but is an arbitrary symbol representing the idea of a cat There are many symbols for many things Examples range from Peace Pipe Red Cross to Electrical symbols It is good when doing schematic drawings to use symbols that are clearly recognised and interpreted Symbols that have been internationally standardised are the best Circuit diagram symbols have differed from country to country and have changed over time They are now to a large extent internationally standardized Simple components often had symbols intended to represent some feature of the physical construction of the device There are several national and international standards for graphical symbols in circuit diagrams in particular
IEC 60617 (also known as British Standard BS 3939)
ANSI standard Y32 (also known as IEEE Std 315) IEC 60617 originally consisted of 13 parts from resistors and capacitors to logic symbols and even a generalised drawing standard of connections and bus line widths It is now published as a subscription online database IEC 60617-DB Different symbols may be used depending on the discipline using the drawing for example lighting and power symbols used as part of architectural drawings may be different from symbols for devices used in electronics Different electronic components have different characteristics it is necessary to distinguish between them in any circuit diagram Of course we could use the block diagram approach and just identify each component with words Unfortunately this takes up a lot of space and makes the overall diagram harder to recognize or understand quickly We need a way to understand electrical diagrams far more quickly and easily
Foundation Computing
Basic Schematic Diagrams 5957docx Page 45
The answer is to use schematic symbols to represent electronic components as shown in the diagram below In this diagram we show the schematic symbol of a battery as the electrical source and the symbol of a resistor as the load Even without the words and arrows the symbols define exactly what this circuit is and how it behaves
Some good procedures to follow with symbols include
Using templates for frequently used symbols
Use symbols consistently
Use a library of symbols such as from IEC 60617-DB
Foundation Computing
Basic Schematic Diagrams 5957docx Page 46
TOPIC 2 Diagram is clear readable and consistent with specifications Creating a simple diagram using MSPaint To start with letrsquos create a simple flow chart representing the stages in designing a schematic diagram There are four stages in this process
1) Gather your information 2) Organise your information 3) Make connections 4) Test your diagram
Our flow chart will consist of four rectangles arranged vertically with downward pointing arrows as connectors A rounded rectangle at the top and at the bottom of the flowchart will indicate START and FINISH respectively Step by step
Open Microsoft Paint
Click on the Rectangle tool then click and drag in the drawing area to draw a rectangle
Repeat this step to draw four boxes in the drawing area OR click on the Select tool and click and drag to select the first rectangle then right-click to copy and paste three more rectangles the same size in the drawing area
Foundation Computing
Basic Schematic Diagrams 5957docx Page 47
Using the Rounded Rectangle tool draw a rounded rectangle at the top and bottom of your flow chart
Foundation Computing
Basic Schematic Diagrams 5957docx Page 48
Use the Line tool to draw arrows between each box In the Options area under the Tool bar you can choose the thickness of line that you want to use Remember too that if you hold down the Shift key on the keyboard while you are drawing a line you can create a 45 degree angle
Use the Text tool to add text to the shapes by clicking on the Text tool clicking and dragging to create a textbox inside your shape then typing your text Check your spelling carefully letter by letter as you go
Foundation Computing
Basic Schematic Diagrams 5957docx Page 49
The basic flowchart created in Microsoft Paint could look something like this
Foundation Computing
Basic Schematic Diagrams 5957docx Page 50
Common problems with diagrams Even well-designed schematic diagrams will be difficult for the target audience to read and understand if symbols are used inconsistently or the layout of the diagram is unfamiliar For example if a flowchart has different shapes used for each element and different types of arrows used randomly it will be more difficult for readers to see the overall direction and meaning of the diagram If the shapes on an organisation chart are different sizes and randomly positioned with no clear levels or hierarchy the diagram will not provide a clear overview of the organisationrsquos structure If an electrical circuit diagram has unfamiliar symbols used for elements such as switches resistors and batteries then it will not make sense to its intended audience
Tips for improving the readability of your schematic diagrams
Use symbols and shapes consistently ie elements that are similar should have the same symbol or shape
Avoid having connectors crossing over each other
Avoid having symbols or shapes overlapping
Use arrows on connectors or flow lines to indicate direction
Use colours text size and font consistently
Diagrams that can be read top-to-bottom and left-to-right are easier to read
In a process diagram have only one connector leading into a symbol but have more coming out where necessary to indicate different directions or decisions
Diagrams for a technical audience such as electrical or computer programming schematics should follow accepted conventions for symbols and layout
Diagrams indicating a hierarchy of positions ideas or stages are clearer if elements belonging to the same level are a similar shape size and position on the page
Keep labels as clear and as brief as possible Carefully check the spelling of all names and labels letter by letter ndash errors in the spelling of names or scientific and technical terms look unprofessional and can be confusing for readers
Foundation Computing
Basic Schematic Diagrams 5957docx Page 51
Self Test Look at the schematic diagrams that follow Make notes under each example of what is wrong with the diagram what is right about the diagram and what could be changed to make it clear and meaningful to its intended audience 1) This flow chart is supposed to show police officers how to get a suspect to confess to a crime
START
Confidently accuse
suspect of crime
Describe a
scenario that
enables suspect
to admit guiltAllow suspect to
voice objections
Invade suspectrsquos
personal space
Suspect becomes
uncomfortable
Suspect
doesnrsquot
deny guilt
Suspect
denies guilt
No reaction
Elicit confession
Rephrase objections as
confessions
FINISH
Foundation Computing
Basic Schematic Diagrams 5957docx Page 52
2) The following diagram is an organisation chart for Widget Enterprises
John Smith
MANAGER
Seth Drew
IT MANAGER
May Furur
SECRETARY
Judith Holland
CUSTOMER SERVICES manager
Jad Ling
HELPDESK
Harry Petal
FINANCIAL MANAGER
Wanda Springer
MARKETING
MANAGER
Bob Smithells
CLEANER
Kelly Inlerl
MARKETING ASSISTANT
Beryl Thin
CUSTOMER SERVICES ASSISTANTValda Rigley
CUSTOMER
SERVICES
ASSISTANT
Levi Quayle
COMPUTER
TECHNICIAN
3) Which of the following computer applications can be used to create schematic diagrams
a) Microsoft Visio
b) Microsoft Paint
c) Microsoft Word
d) All of the above
4) Which frequently used shapes does the Microsoft Paint Tool bar contain templates for
5) Where in the Microsoft Paint window would you be able to select the thickness of line that you wanted for a brushstroke 6) Identify the purpose and intended audience for a diagram showing a businessrsquos marketing plan 7) Name two characteristics of well-designed schematic diagrams 8) Identify four steps involved in designing schematic diagrams 9) Why is it important to use conventionally accepted and familiar shapes and symbols in your schematic diagrams
Foundation Computing
Basic Schematic Diagrams 5957docx Page 53
Self Test Answers 1) This flow chart is supposed to show police officers how to get a suspect to confess to a crime
START
Confidently accuse
suspect of crime
Describe a
scenario that
enables suspect
to admit guiltAllow suspect to
voice objections
Invade suspectrsquos
personal space
Suspect becomes
uncomfortable
Suspect
doesnrsquot
deny guilt
Suspect
denies guilt
No reaction
Elicit confession
Rephrase objections as
confessions
FINISH
Random shapes are meaningless and confusing ndash use conventional flow chart symbols
Stages of process are not clear ndash arrange shapes top to bottom with options at each stage branching off to side at same level
Connectors that are either straight or curved would be more consistent
Labels are clear
Text uses consistent font and size
Foundation Computing
Basic Schematic Diagrams 5957docx Page 54
2) The following diagram is an organisation chart for Widget Enterprises
John Smith
MANAGER
Seth Drew
IT MANAGER
May Furur
SECRETARY
Judith Holland
CUSTOMER SERVICES manager
Jad Ling
HELPDESK
Harry Petal
FINANCIAL MANAGER
Wanda Springer
MARKETING
MANAGER
Bob Smithells
CLEANER
Kelly Inlerl
MARKETING ASSISTANT
Beryl Thin
CUSTOMER SERVICES ASSISTANTValda Rigley
CUSTOMER
SERVICES
ASSISTANT
Levi Quayle
COMPUTER
TECHNICIAN
No clear levels to hierarchy ndash organise so that diagram reads top to bottom and positions at similar level are in same horizontal space
Different sized boxes and borders on some boxes are meaningless ndash need consistent style for similar elements
Connectors cross over each other and boxes overlap ndash arrange space to avoid this
Text size and font is mostly consistent but one typo needs correcting
3) Which of the following computer applications can be used to create schematic diagrams
a) Microsoft Visio
b) Microsoft Paint
c) Microsoft Word
d) All of the above correct
4) Which frequently used shapes does the Microsoft Paint Tool bar contain templates for
Polygon rectangle ovalellipse
Foundation Computing
Basic Schematic Diagrams 5957docx Page 55
5) Where in the Microsoft Paint window would you be able to select the thickness of line that you wanted for a brushstroke
Options area below the Toolbar
6) Identify the purpose and intended audience for a diagram showing a businessrsquos marketing plan
The purpose would be to provide an overview of the businessrsquos marketing strategy Audience could include management and employees of the business especially the Marketing department potential investors shareholders and directors of the business
7) Name two characteristics of well-designed schematic diagrams Any of simple easy for the target audience to understand include all relevant elements or parts of the process clear and logical connections between elements accurate 8) Identify four steps involved in designing schematic diagrams Gather information organise information make connections between elements test your diagram 9) Why is it important to use conventionally accepted and familiar shapes and
symbols in your schematic diagrams So that the diagram will be easily understood by the target audience
Foundation Computing
Basic Schematic Diagrams 5957docx Page 56
References httpwindowsmicrosoftcomen-NZwindows7Getting-started-with-Paint accessed Sat 5th December in Timaru New Zealand httpenwikipediaorgwikiSchematic_diagrams accessed Sat 5th December in Timaru New Zealand httpenwikipediaorgwikiSymbol accessed Sat 5th December in Timaru New Zealand

Foundation Computing
Basic Schematic Diagrams 5957docx Page 2
Contents Page PART 1 Plan schematic diagrams from a given brief Topic 1 Identifying the purpose and the target audience Topic 2 Identifying the computer application required Topic 3 Getting started with MS Paint Topic 4 Designing your diagram Self Test Self Test Answers
PART 2 Produce schematic diagrams from a given brief using a computer application Topic 1 Symbols used are consistent with diagram type and specifications Topic 2 Diagram is clear readable and consistent with specifications Self Test Self Test Answers
References
Foundation Computing
Basic Schematic Diagrams 5957docx Page 3
Produce schematic diagrams using a computer application
Unit Standard 5957 Version 6
Level 2 Credits 2
Purpose
People credited with this unit standard are able to plan and produce schematic diagrams using a computer application from a given brief
LEARNING GUIDE 5957
Copyright copy CTF Services Ltd (2005) All rights reserved No part of this material may be reproduced by any means
without permission in writing from the publisher
Foundation Computing
Basic Schematic Diagrams 5957docx Page 4
Elements and Performance Criteria
Element 1 Plan schematic diagrams from a given brief Performance criteria 11 The plan identifies the purpose and target audience for the schematic
diagram 12 The plan identifies the computer application required to produce the
schematic diagram
Element 2 Produce schematic diagrams from a given brief using a computer application Performance criteria 21 The symbols used in each diagram are consistent with the type of diagram
and the specifications of the brief 22 The final diagram is readable clearly illustrates the object being diagrammed
and is consistent with the specifications of the brief
Foundation Computing
Basic Schematic Diagrams 5957docx Page 5
Unit 5957 Produce schematic diagrams using a computer application
Module Objectives
When you have finished this workbook the practical exercises that are part of it and the assessment you will be credited with the NZQA unit 5957 You will be able to
Plan schematic diagrams from a given brief
Produce schematic diagrams from a given brief using a computer application Please follow this module guide and enjoy the material The unit is part of the qualifications framework so there are things you need to do to pass it They are listed on the previous few pages under ldquoElements and Performance Criteriardquo and you will be reminded of them here and there throughout this workbook
Assessment Self Tests for each section ndash these arenrsquot marked but they will be helpful to the students Assessment for this module ndash this will be marked and will count towards your final assessment
Resources Use the Learning Guide NZQA Unit Standard 5957 To demonstrate competency in this unit the person will require access to
Personal computers
Software applications such as MS Office
Operating system such as MS Windows XP Pro or higher
Peripheral devices such as printers mouse keyboard monitor other PCs and others
Prerequisites None
Foundation Computing
Basic Schematic Diagrams 5957docx Page 6
GLOSSARY OF TERMS Here is a short Glossary of Terms that is relevant to this Unit Standard We hope you will find it useful Sourced from httpwwwedisonohioedudtpdtpglosshtml alignment - the placement of type relative to margins left means lines share a left border but are uneven on the right side justified or fully justified means both left and right sides are aligned ascender - part of a lower case letter that rises above the x-height baseline - an imaginary line upon which rests the body of a line of type Descenders such as lower-case p or g drop below the baseline bold or boldface - an expression of weight also a style of type bullet - a type of character the most common being a large dot that is used to separate text or to begin paragaphs especially in lists Can be created on the Mac with the key combination Option-8 on the PC with Control-Shift-8 column - a vertical block of type or the space used to lay out type and graphics Pages may have as few as one column or many column guides - non-printing lines that define the left and right margins of columns on a page accessible through the Layout menu crop cropping - any technique that reduces the amount of a graphic that shows or prints In PageMaker the cropping tool can be used to crop horizontally or vertically crop marks - printed but non-reproducing marks that aid the printer in determining trim size descender - part of a lower case letter that drops below the baseline EPS - a file format that stands for Encapsulated PostScript used for high-resolution output and special effects fill - the property of an object that determines the appearance of the body of the object fill may be solid a tint or screen a pattern or none folio - printers term for page number font - often used interchangeably with face or type face is now actually the name of type such as Helvetica or Times Bold Traditionally a single size weight and style of type grid - non-printing guides including column guides and ruler guides that aid in structuring page layouts gutter - The space between pages in facing pages layouts halftone - in printing the technique of simulating shades of gray or color by varying the size of dots in a grid or the number of pixels in a given area
Foundation Computing
Basic Schematic Diagrams 5957docx Page 7
hanging indent - a paragraph format where the lines are indented a certain distance from the left margin but the first line is indented a negative amount so that the first line hangs over the rest of the left alignment horizontal - side to side left to right as in the sun sets below the horizon in-line graphic - a graphic element embedded in a paragraph as a text character It takes on alignment and other characteristics of the host paragraph indents - Additional space measured from the left and right of a text block or margin Indents can be Left in which all lines in the paragraph are the specified distance from the left margin Right in which all lines in the paragraph are the specified distance from the right margin and First in which the first line of the paragraph is an additional amount from the left margin Note that First can be a negative number up to the positive value of the left indent to form a hanging indent italic - general term used to describe slanted type although strictly italic letterforms vary from the non-italic original kerning - the adjustment of spacing between letter pairs leader - A character most commonly used with tabs to visually connect the text on either side of the tab most common character is the period followed by the underscore Do not confuse with leading leading - the distance from the baseline of one line of text to the baseline of the next usually measured in points line - the property of an object that determines the appearance of the perimeter of the object Lines may be solid a tint or screen patterns or none Line weight is measured in points line length - a function of the width of the text block minus any indents For body copy line length should be in picas 1 to 25 times the size of type in points margin - defined area surrounding a page that separates the trim from the live (printing) area mask - a technique for using the shape of one graphic object to crop or otherwise block out portions of another graphic object master page - a page identified by an L or R in the lower left corner of a document window on which you create elements that will appear consistently throughout the publication paragraph style - see Style sheet pica - a typographic measurement system consisting of 12 points there are 6 picas per inch points - the basic measure of type there are 72 points to the inch or 12 points to the pica point size - a measure of the size of type in points rule - printers term for a line ruler guide - a non-printing line that you drag from either the vertical or horizontal rulers to help you position elements on a page
Foundation Computing
Basic Schematic Diagrams 5957docx Page 8
running head - a line of text often containing the title that is consistent across most or all the pages in a publication running foot - a line of text often containing the folio that is consistent across most or all the pages in a publication sans serif - the class of type faces without serifs Helvetica is an example serif - a line or curved extension projecting from the end of a letter form can be used to distinguish a class of type faces such as Times from sans serif faces such as Helvetica set width - a typographic name for the horizontal scaling of type usually expressed as a percentage Squeeze or stretch might be other words for set width soft returns - in PageMaker holding the Shift key while pressing Return creates a soft return sometimes called a line break or new line but does not start a new paragraph Most often used in conjunction with bullet lists style - a variant of the basic type face such as Italic Bold Strikethrough or Outline Not to be confused with Style Sheets style sheet - essentially a script or shortcut for several text and paragraph formatting choices such as but not limited to indents rules typeface size and styles Style sheets apply to paragraphs at a time rather than individual words and are also sometimes called paragraph styles tab - a non-printing character that affects alignment of text that follows it may be left right center decimal See also leader text block - In PageMaker an object that contains text defined by handles at top bottom left and right Text blocks can be linked and a single story may have many text blocks To view a text block click on text with the Pointer Tool text wrap - the technique of flowing text around graphic elements In PageMaker the options are available under the Element menu tracking - preset letter spacing values trim size - size of the finished page after the excess has been cut away typeface or face - can refer to an entire related named family of type such as Helvetica or Times vertical - up and down top to bottom weight - term referring to the heaviness of a type faces stroke Terms often used are light medium book bold heavy ultra x-height - a value often expressed as a percentage that measures the height of the body of lowercase letters in a type face or in proportion to the upper case letters zero point - the point at which the on-screen vertical and horizontal rulers meet at 0 the position relative to the page is changeable by the user zoom - the act of enlarging or reducing the magnification on screen like moving closer or farther away refer to the View menu option
Foundation Computing
Basic Schematic Diagrams 5957docx Page 9
Part 1 Plan schematic diagrams
from a given brief OBJECTIVES
On successful completion of this section you will be able to Plan schematic diagrams from a given brief Performance criteria
11 The plan identifies the purpose and target audience for the schematic diagram
12 The plan identifies the computer application required to produce the
schematic diagram
TOPICS
Topic 1 Identifying the purpose and the target audience Topic 2 Identifying the computer application required Topic 3 Getting started with MS Paint Topic 4 Designing your diagram
Self Test
Self Test Answers
Foundation Computing
Basic Schematic Diagrams 5957docx Page 10
TOPIC 1 Identifying the purpose and the target audience
Letrsquos define a few terms (both definitions taken from NZQA Unit Standard 5957) A brief is defined as a clear description of both the desirable outcomes sought and the constraints to be met by the solution It contains requirements against which the success or otherwise of the desktop published document can be evaluated The brief can be supplied either as part of the candidatersquos employment (in the case of workplace assessment) or in response to a set task Text graphics and specified page layout will be provided for the task A plan outlines how the requirements of the brief will be realised For this unit standard the plan may be informal and it may be more appropriate to produce evidence of it during task completion rather than prior to starting the task or project Evidence of planning may be oral written andor graphic Accordingly we need to plan schematic diagrams from a given brief There are many ways to achieve our purpose However a) What are schematic diagrams b) What is the purpose for these schematic diagrams c) Who is our target audience
Schematic Diagrams Schematic diagrams are used to show the different parts or elements of a system or process and how they are connected and related to each other Examples of systems include
organisations like your school or
computer networks or
electrical circuits A mind map that you might use to plan an essay is a simple example of a schematic diagram In this case your essay is the system and the different elements are the different facts and ideas and headings that you need to include in your essay Processes can include
instructions for how to do something
software programming or
plans for an event such as a wedding
Foundation Computing
Basic Schematic Diagrams 5957docx Page 11
A schematic is a diagram that represents the elements of a system using abstract graphic symbols rather than realistic pictures A schematic usually omits all details that are not relevant to the information the schematic is intended to convey and may add unrealistic elements that aid comprehension For example
a subway map intended for riders may represent a subway station with a dot the dot doesnt resemble the actual station at all but gives the viewer information without unnecessary visual clutter
A schematic diagram of a chemical process uses symbols to represent the vessels piping valves pumps and other equipment of the system emphasizing their interconnection paths and suppressing physical details
In an electronic circuit diagram the layout of the symbols may not resemble the layout in the physical circuit In the schematic diagram the symbolic elements are arranged to be more easily interpreted by the viewer
A schematic of the Washington Metro The schematic is not drawn to scale distances
between stations are fixed and lines are drawn at 45 and 90-degree angles
Foundation Computing
Basic Schematic Diagrams 5957docx Page 12
In the electrical industry a schematic diagram is often used to describe the design of equipment Schematic diagrams are often used for the maintenance and repair of electronic and electromechanical systems Original schematics were done by hand using standardized templates or pre-printed adhesive symbols but today Electrical CAD software is often used Schematic diagrams are used extensively in repair manuals to help users understand the interconnections of parts and to provide graphical instruction to assist in taking apart and rebuilding mechanical assemblies Many automotive and motorcycle repair manuals devote a significant number of pages to schematic diagrams
Exercise 1 See if you can match each of the names in the box with one of the schematic diagrams below
Flow Chart
Organisation Chart
Electrical circuit
Mind map A)
Marketing Plan
Placement
ProductPromotion
Price
Competitive
weaknesses
Competitive
strengths
New features
Trade shows
Mailings
Advertising
B)
Jeremy Nash
CEO
Adam Jurgensen
Operations
Manager
Aneru Jacobs
Sales and
Marketing
Obed Tambo
District Coodinator
Manaia Pehi
Financial
Manager
Hashim Mohamed
Accountant
Janet Brookes
Personal Assistant
Steven Alleroo
IT Manager
Cindy Wahoo
Technician
Foundation Computing
Basic Schematic Diagrams 5957docx Page 13
C)
120V
480V
U
L
L
U
LOR
RESET
OL
TR2
TR3
VIB
VIB
WTR
MOTOR
BLOWER
PS
LOR
ON-OFF
SS
TR3
START
M
START
RUN
HAND
OFF
REMOTE
LOR
M
REMOTE
MODE
M
PS
TR1
TR2
S
To LOR COIL CIRCUIT
M
MSH
ON-OFF
R
W
TR1
X1
D
C
B
A
4 3 2 1
D
C
B
A
4 3 2 1
D)
Foundation Computing
Basic Schematic Diagrams 5957docx Page 14
Answers A = Mindmap B = Organisation chart C = Electrical circuit diagram D = Flow chart Schematic diagram production Before suitable computer applications were developed schematic diagrams were produced manually using tools such as typewriters stencils stickers or labels and drawing by hand Sometimes it can be quicker to produce simple schematic diagrams by hand or you may not have a computer available or the computer application available might be too complex or take so long to learn that it makes more sense to use manual methods Alternatively you may have a highly complex schematic diagram that is too big to print out on the computer printers available and would not make sense if spread over a number of pages
Exercise 2) In the space below or on a piece of paper describe some situations in which you would choose to use a computer application to produce your schematic diagram and explain why
Exercise 3) Now describe some situations in which you would choose NOT to produce your schematic diagram using a computer application and explain why not
Exercise 4) Working with a partner brainstorm the advantages and disadvantages of producing schematic diagrams with a computer application rather than by hand
Foundation Computing
Basic Schematic Diagrams 5957docx Page 15
Suggested answers to the exercises 2) In the space below describe some situations in which you would choose to use a computer application to produce your schematic diagram and explain why Situations could include (and there are many more)
Preparing a flow chart to send by email to all the members of a team ndash because doing it on computer would allow me to make multiple copies and email them easily
Producing a complex network diagram as part of a report to present ndash because it would look more professional and could be easily changed or updated
Preparing an organisation chart to include in a computerised slideshow - because it could easily be imported
3) Now describe some situations in which you would choose NOT to produce your schematic diagram using a computer application and explain why not
Situations could include
Presenting an organisation diagram or a flow chart to a community organisation as a one-off event if I did not have access to a large-scale printer or projector I would draw or paint the diagram by hand ndash because it would be the simplest way to make it large enough for everyone to see and I would be unlikely to need more copies
In an assessment situation drawing a mind map or brainstorming diagram to organise my ideas before writing an essay or report ndash because it would be quickest
Working with a team to sketch out a plan for a process because it would be quickest and wouldnrsquot rely on being close to a computer
Foundation Computing
Basic Schematic Diagrams 5957docx Page 16
4) Working with a partner brainstorm the advantages and disadvantages of producing schematic diagrams with a computer application rather than by hand
Your results of your brainstorm might look like this (diagram produced using MS Visio)
Using computers AdvantagesDisadvantages
need to learn
application
can take longer
sometimes difficult
to plan
limited options for
layout
frustrating
too many options
incompatible file
types
can store on
computer
can fit more smaller
text
easy to read
can email to people
use templates
easy to change or
update
Can be quick
easy to make
copies
professional looking
import into
computer
documents
Expensive
equipment needed
technical problems
Security
Foundation Computing
Basic Schematic Diagrams 5957docx Page 17
Process for producing schematic diagrams on computer There are many different computer applications that can be used to produce schematic diagrams Some applications like Microsoft Visio are specifically designed to help you create a wide range of complex schematic diagrams easily However almost any computer application that has a drawing tool can be used to produce a schematic diagram and the process will usually involve the following steps 1) Design the diagram
a Identify your target audience b Collect all the information you need c Arrange your information in a logical order d Test your diagram
2) Create the diagram in the computer application
a Open the drawing window b Draw the shapes you want c Arrange the shapes according to your design d Add connectors between each of the shapes e Add text where required
Designing effective diagrams The main purpose of a schematic diagram is to provide a clear and easy to understand visual overview of how the different parts of a system fit together Schematic diagrams that are well-designed
are as simple as possible
are easy for the target audience to understand
include all relevant elements or parts of the process
have clear and logical connections between elements
communicate an accurate picture of the system or process
Foundation Computing
Basic Schematic Diagrams 5957docx Page 18
Identifying the target audience The target audience is the group of people who will read your schematic diagram The main question you need to ask yourself is Who is my audience In order to identify the target audience for your schematic diagram think about the following
What sort of person will read your diagram Think about that personrsquos job age education language environment and other characteristics that could affect the sort of language and symbols they will understand and relate to
What information will that person look for Why are they reading your diagram What do they want or need to know What information is most important What information is not so important
How much time will that person have to look at your diagram Will they be in a hurry or will they have time to study all the details Does your diagram have to stand alone or will it have a lot of text next to it to explain it
What do you want your audience to learn or do as a result of reading your diagram
What does the diagram need to show What information do you have to include How should this information be arranged
Foundation Computing
Basic Schematic Diagrams 5957docx Page 19
Exercise Complete the table below with information about the target audience and purpose for each of the examples of schematic diagrams given Use the questions above to help you
Example diagram Target audience
You work as an electrician and Mr Jones has asked you to design an electrical wiring plan for the dream house he wants to build
You are a computer programmer and you are using a flowchart to plan a computer program that farmers can use to keep count of their sheep
You have to write an essay about your most embarrassing childhood experience and you create a mindmap to organise your ideas
You are researching your family history and have been asked to create a family tree diagram for a booklet that will be handed out at an upcoming family reunion
Foundation Computing
Basic Schematic Diagrams 5957docx Page 20
Suggested Answer Complete the table below with information about the target audience and purpose for each of the examples of schematic diagrams given Use the questions above to help you
Example diagram Target audience
You work as an electrician and Mr Jones has asked you to design an electrical wiring plan for the dream house he wants to build
Mr Jones his builder local council officials theyrsquoll need detailed information that will be studied in depth and referred to during the planning and building process
You are a computer programmer and you are using a flowchart to plan a computer program that farmers can use to keep count of their sheep
You and other computer programmers will use the flowchart to understand the process of the programme and to identify flaws in its logic
You have to write an essay about your most embarrassing childhood experience and you create a mindmap to organise your ideas
You are the only person who will use your mindmap and you will refer to it as you write your essay
You are researching your family history and have been asked to create a family tree diagram for a booklet that will be handed out at an upcoming family reunion
Members of your family will look for their names and those of relatives in order to see how people are related to each other
Foundation Computing
Basic Schematic Diagrams 5957docx Page 21
TOPIC 2 Identifying the computer application required There are many computer applications that can be used to create schematic diagrams Microsoft Visio is specifically designed for this purpose but any application with basic drawing tools such as those found in Microsoft Word can be used One of the simplest and most widely available computer drawing applications is Microsoft Paint We will use this application is used to demonstrate the tools However most of the tools and principles we will focus on in Microsoft Paint can be found in other drawing applications The following diagram shows the Microsoft Paint window
The tools are arranged to the left of the drawing area in the Tool bar An overview of how to use the tools you need to create a simple schematic diagram is provided below Underneath the Tool bar is the Options box When you click on a tool icon in the Tool bar the options available for that tool appear in the Options box To select an option click on the tool you want to use then click on the option and then click in the drawing area and drag the mouse pointer to draw The Colour palette is underneath the drawing area To use a colour click on the tool you want to use then click on the colour and then click in the drawing area ndash the shape line or text you create will appear in the colour you have selected
Foundation Computing
Basic Schematic Diagrams 5957docx Page 22
Tools Selection Tools Use the selection tools to select the parts of your schematic diagram that you want to work with or change in some way To use these tools click on the button of the tool you want and then click on your diagram and drag until the area you want to work with is selected The Freeform Select tool (on the left) is used to select an irregularly shaped area The Rectangle Select tool is used to select a rectangular area To copy a part of your diagram eg a shape line or text it must first be selected using a selection tool Select Copy from the Edit menu click where you want the copy to be positioned and select Paste from the Edit menu Shapes tools
The shapes tools which can be used to create symbols in schematic diagrams consist of the Rectangle tool for creating squares or rectangles the Polygon tool for creating multi-sided shapes the Rounded Rectangle tool for creating rounded rectangles and the Oval tool for creating circles or ovals These tools provide templates for creating frequently used symbols To use them simply click on the icon of the shape you want to use and drag it onto your diagram where you can resize it if necessary and add text or
Foundation Computing
Basic Schematic Diagrams 5957docx Page 23
effects For the Polygon tool click and drag to draw the first side and click each time you want to change direction Double-click when you have finished To create a perfect circle hold down the Shift key while you are dragging the mouse pointer
Line tools In schematic diagrams line tools can be used to draw connectors between symbols and to draw shapes or symbols
The Straight Line tool creates straight lines simply click on the Straight Line icon click in your picture where you want the line to start and drag to where you want the line to finish The Curve tool will create a curve with at least one and no more than two bends in it click on the Curve icon then click in your picture to draw a straight line and drag to where you want the first bend to be click again where you want the second curve to be and drag to shape the curve You can make more complex shapes by joining lines and curves together
The Pencil tool can be used to draw freeform shapes or lines with as many bends and curves as you want Click on the icon click in your diagram and ldquodrawrdquo with your mouse pointer To draw straight lines hold down the shift key as you are drawing with the mouse
Foundation Computing
Basic Schematic Diagrams 5957docx Page 24
The Paint Brush tool draws freeform lines in the same way as the Pencil tool but can be used to create lines of varying widths and styles To select a paintbrush style click on the Paint Brush icon and then click in the Options box on the style you want to use
The Airbrush tool creates lines with an airbrushed effect of clustered dots It can be used in the same way as the pencil tool to draw freeform shapes or symbols In the Options box you can choose the size of the area covered by the Airbrush tool
Text tool
Add text to your schematic diagram by clicking on the Text icon and clicking in your diagram where you want the text to appear As you drag a rectangle will be formed within which text can be typed The Fonts dialogue box will also open
Foundation Computing
Basic Schematic Diagrams 5957docx Page 25
Fill Tool
The Fill tool will add colour to a shape that you have drawn Click on the icon click on a colour from the colour palette and then click on the shape in the diagram that you want to fill with colour
Zoom tool
Use the Zoom tool to magnify a section of the diagram that you are working with Click on the magnifying glass icon select the size you want in the Options box and click on the part of the image you want to enlarge As the picture zooms in the cursor will change back to the tool you were using before
Adding colour
The Colour box to the left of the Colour palette shows the foreground and background colours you are using If you click on a tool and then drag while holding down the left mouse button the line or shape will be drawn using the foreground colour If you hold down the right mouse button the background colour will be used To use any other colour click on the tool you want to use click on an option (if using) then click on the colour you want from the colour palette As you draw the colour you have clicked on will be used
Foundation Computing
Basic Schematic Diagrams 5957docx Page 26
Additional resources For more detailed information about these tools refer to the Help menu in Microsoft Paint (httpwindowshelpmicrosoftcom )
The following online tutorials may also be useful
httplkwdplorgclassesMSPaintpainthtml
httpwwwlesleyedufacultyahuntMSPttutrhtm
Exercise The example below shows a simple organisation chart produced using Microsoft Paint In the space that follows identify which tools were used to create this schematic diagram and what each tool was used for
Rectangle tool used to create Manager symbol
Oval tool used to create Team Leader symbols
Rounded Rectangle tool used for Team member symbols
Straight line tool used to create connectors
Text tool used to add text to shapes
Rectangle Select tool used to select shapes to move into
position
Foundation Computing
Basic Schematic Diagrams 5957docx Page 27
Suggested Answer The example below shows a simple organisation chart produced using Microsoft Paint In the space that follows identify which tools were used to create this schematic diagram and what each tool was used for
Rectangle tool used to create Manager symbol
Oval tool used to create Team Leader symbols
Rounded Rectangle tool used for Team member symbols
Straight line tool used to create connectors
Text tool used to add text to shapes
Rectangle Select tool used to select shapes to move into position
Foundation Computing
Basic Schematic Diagrams 5957docx Page 28
Exercise Which tools would you use to produce the following symbols or diagrams and why
Symbol Tools and justification
Resistor (Electrical circuit diagram)
Speaker (Electrical circuit diagram)
AC
AC source (Electrical circuit diagram)
Start or end of process (Flowchart)
Decision (yes or no) (Flowchart)
Instructions or actions (Flowchart)
Foundation Computing
Basic Schematic Diagrams 5957docx Page 29
Symbol Tools and justification
Document produced (Flowchart)
Data entered or received (Flowchart)
Foundation Computing
Basic Schematic Diagrams 5957docx Page 30
Suggested Answers Which tools would you use to produce the following symbols or diagrams and why
Symbol Tools and justification
Resistor (Electrical circuit diagram)
Straight line tool (hold down shift key)It creates regular 45 degree angled lines that are perfectly straight
Speaker (Electrical circuit diagram)
Polygon tool (hold down shift key) Rectangle tool and Straight line tool These are used in order to create a symbol with uniform angles and straight edges
AC
AC source (Electrical circuit diagram)
Oval tool (hold down shift key) to draw circle Curve tool to draw wavy line Straight line tool and Text tool These tools produce cleaner shapes than drawing freeform
Start or end of process (Flowchart)
Rounded rectangle tool This provides a template for creating this symbol
Decision (yes or no) (Flowchart)
Polygon tool This creates more accurate joins between sides than the Straight line tool
Instructions or actions (Flowchart)
Rectangle tool It provides a template for drawing this shape
Foundation Computing
Basic Schematic Diagrams 5957docx Page 31
Symbol Tools and justification
Document produced (Flowchart)
Line tool and Curve tool ndash need two tools in MSPaint other applications may have a template for this shape
Data entered or received (Flowchart)
Polygon tool ndash better than Straight line tool because can produce more regular shape
Foundation Computing
Basic Schematic Diagrams 5957docx Page 32
TOPIC 3 Getting started with MS Paint Sourced from httpwindowsmicrosoftcomen-NZwindows7Getting-started-with-Paint MS Paint is a feature in Windows that you can use to draw colour and edit pictures You can use Paint like a digital sketchpad to make simple pictures creative projects or to add text and designs to other pictures such as those taken with your digital camera The parts of Paint Open Paint by clicking the Start button clicking All Programs clicking Accessories and then clicking Paint When you start Paint youll see an empty window drawing and painting tools are located in the ribbon at the top of the window The following illustration shows the different parts of the Paint window
The Paint window
Foundation Computing
Basic Schematic Diagrams 5957docx Page 33
Working with tools The ribbon in Paint includes a handy collection of drawing tools You can use these tools to create freehand drawings and add a variety of shapes to your pictures This section describes some common tasks For more detailed information on how to use the different tools in Paint see Using Paint Draw a line Some tools and shapes such as the Pencil Brush Line and Curve let you make a variety of straight curved and squiggly lines What you draw is determined by how you move the mouse as you draw You can use the Line to draw a straight line for example
1) On the Home tab in the Shapes group click the Line 2) In the Colors group click Color 1 and then click the color you want to use 3) To draw drag the pointer across the drawing area
Draw a squiggly line Your drawings dont have to be composed of only straight lines The Pencil and Brushes can be used to make completely random free-form shapes
1) On the Home tab in the Tools group click the Pencil tool 2) In the Colors group click Color 1 and then click the color you want to use 3) To draw drag the pointer across the drawing area and make a squiggly line
Note If you want to make a line that has a different appearance use one of the Brushes instead Draw a shape Paint lets you draw many different shapes For example you can draw ready-made defined shapes such as rectangles circles squares triangles and arrows (to name a
few) You can also make your own custom shape by using the Polygon shape to draw a polygon which is a shape that can have any number of sides
1) On the Home tab in the Shapes group click a ready-made shape such as the
Rectangle 2) To add a ready-made shape drag the pointer across the drawing area to make
the shape 3) To change the outline style in the Shapes group click Outline and then click an
outline style 4) If you dont want your shape to have an outline click No outline 5) In the Colors group click Color 1 and then click a color for the outline 6) In the Colors group click Color 2 and then click a color to use to fill the shape 7) To change the fill style in the Shapes group click Fill and then click a fill style 8) If you dont want your shape to be filled click No fill
Foundation Computing
Basic Schematic Diagrams 5957docx Page 34
Add text You can also add text to your picture The Text tool lets you add a simple message or title
1) On the Home tab in the Tools group click the Text tool 2) Drag the pointer in the drawing area where you want to add text 3) Under Text Tools on the Text tab click the font face size and style in the Font
group The Font group
4) In the Colors group click Color 1 and then click a color This is the text color 5) Type the text that you want to add
Erase part of your picture If you make a mistake or need to change part of a picture use the eraser By default the eraser changes any area you erase to white but you can change the eraser color For example if you set the background color to yellow anything you erase turns to yellow
1) On the Home tab in the Tools group click the Eraser tool 2) In the Colors group click Color 2 and then click the color that you want to erase
with If you want to erase with white you dont have to select a color 3) Drag the pointer over the area you want to erase
Saving a picture Save your picture frequently so you dont accidentally lose your work To save click the
Paint button and then click Save This saves all of the changes made to the picture since the last time you saved The very first time that you save a new picture you will need to give your picture a file name Follow these steps
1) Click the Paint button and then click Save 2) In the Save as type box select the file format you want 3) In the File name box type a name and then click Save
Foundation Computing
Basic Schematic Diagrams 5957docx Page 35
Topic 4 Designing your diagram Although there are many different types of schematic diagrams the basic process and principles involved in designing a clear and coherent diagram are similar The principles apply to designing an electrical circuit diagram an organisation chart a mind map a flow chart and many other diagrams Some of these principles are also worth applying to other disciplines such as designing a Web page Letrsquos work step-by-step through the process of creating a flow chart to help people make money selling things on an on-line auction site such as wwwtrademeconz or wwwebaycom
Step 1 Gather your information Start by brainstorming all the information you need to include in your diagram Write down everything you think might be important or should be included
trademe
choose things that
sell
good photograph
feedback
keep track
prompt answers
postage
auction length
similar listings
postal system
setting reserve
describing item
correct category
re-listing
fixed offers
Look at the information you have gathered and think about your target audience Highlight the information that is most important to your target audience Cross out any irrelevant information Put question marks next to information that you are unsure about or may be able to leave out
Foundation Computing
Basic Schematic Diagrams 5957docx Page 36
Step 2 Organise your information Take the information that you have left and sort through it How you organise your information will depend on the type of diagram you are designing For example an organisationrsquos chart usually has different levels and shows who its members report to so you might group people by department and by level A flow chart like the example wersquore creating usually shows a process Information is grouped in the order we would use it If any other steps or information occurs to you as you are organising your information add them in Herersquos an example of how the key steps involved in selling on trademe could be ordered
Choose items that sell
Look at similar listings
Decide on a reserve price
Take a clear photograph
Identify your target audience
Write a clear description
Upload your item
Choose the correct category
Monitor watchers bids and views
Lower your reserve
Fixed price offers
Relist
Step 3 Make connections Once the elements are grouped or arranged in a logical order a clearer picture of the process or system you are representing in your diagram should start to emerge However unlike a list which usually reads from top to bottom only a diagram can show connections in many different directions and working out the links between elements is an essential part of designing a coherent diagram At this stage of the design process it is helpful to sketch out a basic plan of the elements you want to include and the flow-lines or connections between them In order to work out the connections between the elements ask questions such as What happens ifhellip What do I do beforeafter this What decisions need to be made now What actions need to be taken Use arrows to show connections between elements group elements that are part of the same stage or level of the process next to or near to each other and use shapes to show which elements are similar to each other eg diamonds for decisions rectangles for instructions or actions Make up your own meanings for shapes if necessary but be sure to use them consistently
Foundation Computing
Basic Schematic Diagrams 5957docx Page 37
The flow chart below shows how our list of elements above changes and gets re-ordered as we ask these questions and organise the information into a logical and coherent diagram
Decide on your
reserve price
START
Relist
Take a photo that is
clear and item looks
good
Decide on your
ideal buyer
Write a description
of your item
highlighting its
benefits for your
buyer
Upload your item in
a category your
buyer is likely to be
looking in
Monitor how many
views watchers and
bids your item gets
Lower your reserve
Item meets reserve
and sellsItem doesnrsquot sell
Offer to watchers for
your reserve
Decide what you
want to sell
Check what similar
items are currently
selling for
Lots of views but
no watchers
No interestFINISH
Foundation Computing
Basic Schematic Diagrams 5957docx Page 38
Step 4 Test your diagram The final step in designing your diagram is checking that it is as effective as possible To do this you should work through each stage step by step challenging it as you go Picture the process in your mind as you follow the links checking that you have included all the actions and decisions required that they are in the correct order and that no steps are duplicated Once yoursquore confident that the diagram is correct look at it again critically to see if you can improve it or clarify it Is there anywhere you can simplify it by removing unnecessary steps Is there anywhere that seems vague and would be easier to understand if you added a step or a connector Now imagine that you are a member of your target audience For a moment try to forget everything you know about the system or process you have designed a diagram for except for what your target audience knows Look at the diagram with fresh eyes does it make sense to you now Does anything seem odd confusing or out of place Finally look at the layout of your diagram Is it easy to read and follow Have you used shapes texts and arrows consistently Are your shapes and texts uniform and lined up properly Are your connectors clearly defined or are they criss-crossing all over each other Check the spelling of labels carefully ndash go through letter by letter to make sure all names and technical or unfamiliar terms are correct
Discussion With a partner look critically at our example diagram above Discuss any parts of it that you think could be better and any changes you would make to improve the readability of the flow chart Make note on the flow chart above of any areas that you think could be improved Share your answers with the rest of the class
Foundation Computing
Basic Schematic Diagrams 5957docx Page 39
Self Test 1) Mr Biggles owns Biggles Air Supplies a company that makes aircraft supplies He asks you to create an organisation chart for his company He gives you the following list of all his employees and who they report to
Mr James Biggles Chief Executive Officer
Jane Doep Personal Assistant to CEO
Mrs Monica Stepworth Financial Manager (reports to CEO)
Judith Zantes Accountant (reports to Financial Manager)
Mary Smallville Accountant (reports to Financial Manager)
Janey Poretuna Admin Assistant (reports to Judith Zantes)
Mickey Laluevu IT technician (reports to Financial Manager)
Mr Hank Johnson Operations Manager (reports to CEO)
Frank Hapil Engineering Manager (reports to Operations Manager)
Joe Smither Engineering Supervisor (reports to Engineering Manager)
Howie Fartherton Engineering Technician (reports to Engineering Supervisor)
Ernie Jusef Engineering Technician (reports to Engineering Supervisor)
Rob Luxemburg Apprentice Technician (reports to Ernie Jusef)
Harry Monahan Interiors Manager (reports to Operations Manager)
Barney Jokka Interiors Technician (reports to Interiors Supervisor) Design an organisation chart for Biggles Air Supplies and draw it in the space below
2) Think of a simple process that has at least five steps and involves some form of feedback or choice For example operating a vending machine topping up your mobile phone using EFTPOS checking messages on an answering machine
Design a flow chart to represent your process
Foundation Computing
Basic Schematic Diagrams 5957docx Page 40
Self Test Answers
1) Mr Biggles owns Biggles Air Supplies a company that makes aircraft supplies He asks you to create an organisation chart for his company He gives you the following list of all his employees and who they report to
Mr James Biggles Chief Executive Officer
Jane Doep Personal Assistant to CEO
Mrs Monica Stepworth Financial Manager (reports to CEO)
Judith Zantes Accountant (reports to Financial Manager)
Mary Smallville Accountant (reports to Financial Manager)
Janey Poretuna Admin Assistant (reports to Judith Zantes)
Mickey Laluevu IT technician (reports to Financial Manager)
Mr Hank Johnson Operations Manager (reports to CEO)
Frank Hapil Engineering Manager (reports to Operations Manager)
Joe Smither Engineering Supervisor (reports to Engineering Manager)
Howie Fartherton Engineering Technician (reports to Engineering Supervisor)
Ernie Jusef Engineering Technician (reports to Engineering Supervisor)
Rob Luxemburg Apprentice Technician (reports to Ernie Jusef)
Harry Monahan Interiors Manager (reports to Operations Manager)
Barney Jokka Interiors Technician (reports to Interiors Supervisor) Design an organisation chart for Biggles Air Supplies and draw it in the space below
Mr James Biggles
CEO
Jane Doep
Personal
Assistant
Mrs Monica Stepworth
Financial Manager
Judith Zantes
Accountant
Janey Poretuna
Admin Assistant
Mary Smallville
Accountant
Mickey Laluevu
IT technician
Mr Hank Johnson
Operations Manager
Frank Hapil
Engineering
Manager
Harry Monahan
Interiors Manager
Joe Smither
Engineering
Supervisor
Howie Fartherton
Engineering
Technician
Ernie Jusef
Engineering
Technician
Rob Luxemburg
Apprentice
Technician
Barney Jokka
Interiors
Technician
Foundation Computing
Basic Schematic Diagrams 5957docx Page 41
2) Think of a simple process that has at least five steps and involves some form of feedback or choice For example operating a vending machine topping up your mobile phone using EFTPOS checking messages on an answering machine
Design a flow chart to represent your process
Dial 06345
Enter your dialing code and
phone number followed by
the key
Dial number for
service you require
Listen to saved messagesListen to new messages
Dial number for
service you require
Save message Delete message
START
FINISH
Dial 2
Dial 1
Dial 1
Dial 2
Dial 1
Dial 2
Foundation Computing
Basic Schematic Diagrams 5957docx Page 42
Foundation Computing
Basic Schematic Diagrams 5957docx Page 43
Part 2
Produce schematic diagrams from a given brief using a computer application
OBJECTIVES
On successful completion of this section you will be able to Produce schematic diagrams from a given brief using a computer application
Performance criteria
21 The symbols used in each diagram are consistent with the type of diagram and the specifications of the brief
22 The final diagram is readable clearly illustrates the object being diagrammed
and is consistent with the specifications of the brief
TOPICS
Topic 1 Symbols used are consistent with diagram type and specifications Topic 2 Diagram is clear readable and consistent with specifications
Self Test
Self Test Answers
Foundation Computing
Basic Schematic Diagrams 5957docx Page 44
TOPIC 1 Symbols used are consistent with diagram type and specifications A symbol is something such as an object picture written word sound or particular mark that represents something else by association resemblance or convention For example a red octagon may be a symbol for STOP On maps crossed sabres may indicate a battlefield Numerals are symbols for numbers All language consists of symbols The word cat is not a cat but is an arbitrary symbol representing the idea of a cat There are many symbols for many things Examples range from Peace Pipe Red Cross to Electrical symbols It is good when doing schematic drawings to use symbols that are clearly recognised and interpreted Symbols that have been internationally standardised are the best Circuit diagram symbols have differed from country to country and have changed over time They are now to a large extent internationally standardized Simple components often had symbols intended to represent some feature of the physical construction of the device There are several national and international standards for graphical symbols in circuit diagrams in particular
IEC 60617 (also known as British Standard BS 3939)
ANSI standard Y32 (also known as IEEE Std 315) IEC 60617 originally consisted of 13 parts from resistors and capacitors to logic symbols and even a generalised drawing standard of connections and bus line widths It is now published as a subscription online database IEC 60617-DB Different symbols may be used depending on the discipline using the drawing for example lighting and power symbols used as part of architectural drawings may be different from symbols for devices used in electronics Different electronic components have different characteristics it is necessary to distinguish between them in any circuit diagram Of course we could use the block diagram approach and just identify each component with words Unfortunately this takes up a lot of space and makes the overall diagram harder to recognize or understand quickly We need a way to understand electrical diagrams far more quickly and easily
Foundation Computing
Basic Schematic Diagrams 5957docx Page 45
The answer is to use schematic symbols to represent electronic components as shown in the diagram below In this diagram we show the schematic symbol of a battery as the electrical source and the symbol of a resistor as the load Even without the words and arrows the symbols define exactly what this circuit is and how it behaves
Some good procedures to follow with symbols include
Using templates for frequently used symbols
Use symbols consistently
Use a library of symbols such as from IEC 60617-DB
Foundation Computing
Basic Schematic Diagrams 5957docx Page 46
TOPIC 2 Diagram is clear readable and consistent with specifications Creating a simple diagram using MSPaint To start with letrsquos create a simple flow chart representing the stages in designing a schematic diagram There are four stages in this process
1) Gather your information 2) Organise your information 3) Make connections 4) Test your diagram
Our flow chart will consist of four rectangles arranged vertically with downward pointing arrows as connectors A rounded rectangle at the top and at the bottom of the flowchart will indicate START and FINISH respectively Step by step
Open Microsoft Paint
Click on the Rectangle tool then click and drag in the drawing area to draw a rectangle
Repeat this step to draw four boxes in the drawing area OR click on the Select tool and click and drag to select the first rectangle then right-click to copy and paste three more rectangles the same size in the drawing area
Foundation Computing
Basic Schematic Diagrams 5957docx Page 47
Using the Rounded Rectangle tool draw a rounded rectangle at the top and bottom of your flow chart
Foundation Computing
Basic Schematic Diagrams 5957docx Page 48
Use the Line tool to draw arrows between each box In the Options area under the Tool bar you can choose the thickness of line that you want to use Remember too that if you hold down the Shift key on the keyboard while you are drawing a line you can create a 45 degree angle
Use the Text tool to add text to the shapes by clicking on the Text tool clicking and dragging to create a textbox inside your shape then typing your text Check your spelling carefully letter by letter as you go
Foundation Computing
Basic Schematic Diagrams 5957docx Page 49
The basic flowchart created in Microsoft Paint could look something like this
Foundation Computing
Basic Schematic Diagrams 5957docx Page 50
Common problems with diagrams Even well-designed schematic diagrams will be difficult for the target audience to read and understand if symbols are used inconsistently or the layout of the diagram is unfamiliar For example if a flowchart has different shapes used for each element and different types of arrows used randomly it will be more difficult for readers to see the overall direction and meaning of the diagram If the shapes on an organisation chart are different sizes and randomly positioned with no clear levels or hierarchy the diagram will not provide a clear overview of the organisationrsquos structure If an electrical circuit diagram has unfamiliar symbols used for elements such as switches resistors and batteries then it will not make sense to its intended audience
Tips for improving the readability of your schematic diagrams
Use symbols and shapes consistently ie elements that are similar should have the same symbol or shape
Avoid having connectors crossing over each other
Avoid having symbols or shapes overlapping
Use arrows on connectors or flow lines to indicate direction
Use colours text size and font consistently
Diagrams that can be read top-to-bottom and left-to-right are easier to read
In a process diagram have only one connector leading into a symbol but have more coming out where necessary to indicate different directions or decisions
Diagrams for a technical audience such as electrical or computer programming schematics should follow accepted conventions for symbols and layout
Diagrams indicating a hierarchy of positions ideas or stages are clearer if elements belonging to the same level are a similar shape size and position on the page
Keep labels as clear and as brief as possible Carefully check the spelling of all names and labels letter by letter ndash errors in the spelling of names or scientific and technical terms look unprofessional and can be confusing for readers
Foundation Computing
Basic Schematic Diagrams 5957docx Page 51
Self Test Look at the schematic diagrams that follow Make notes under each example of what is wrong with the diagram what is right about the diagram and what could be changed to make it clear and meaningful to its intended audience 1) This flow chart is supposed to show police officers how to get a suspect to confess to a crime
START
Confidently accuse
suspect of crime
Describe a
scenario that
enables suspect
to admit guiltAllow suspect to
voice objections
Invade suspectrsquos
personal space
Suspect becomes
uncomfortable
Suspect
doesnrsquot
deny guilt
Suspect
denies guilt
No reaction
Elicit confession
Rephrase objections as
confessions
FINISH
Foundation Computing
Basic Schematic Diagrams 5957docx Page 52
2) The following diagram is an organisation chart for Widget Enterprises
John Smith
MANAGER
Seth Drew
IT MANAGER
May Furur
SECRETARY
Judith Holland
CUSTOMER SERVICES manager
Jad Ling
HELPDESK
Harry Petal
FINANCIAL MANAGER
Wanda Springer
MARKETING
MANAGER
Bob Smithells
CLEANER
Kelly Inlerl
MARKETING ASSISTANT
Beryl Thin
CUSTOMER SERVICES ASSISTANTValda Rigley
CUSTOMER
SERVICES
ASSISTANT
Levi Quayle
COMPUTER
TECHNICIAN
3) Which of the following computer applications can be used to create schematic diagrams
a) Microsoft Visio
b) Microsoft Paint
c) Microsoft Word
d) All of the above
4) Which frequently used shapes does the Microsoft Paint Tool bar contain templates for
5) Where in the Microsoft Paint window would you be able to select the thickness of line that you wanted for a brushstroke 6) Identify the purpose and intended audience for a diagram showing a businessrsquos marketing plan 7) Name two characteristics of well-designed schematic diagrams 8) Identify four steps involved in designing schematic diagrams 9) Why is it important to use conventionally accepted and familiar shapes and symbols in your schematic diagrams
Foundation Computing
Basic Schematic Diagrams 5957docx Page 53
Self Test Answers 1) This flow chart is supposed to show police officers how to get a suspect to confess to a crime
START
Confidently accuse
suspect of crime
Describe a
scenario that
enables suspect
to admit guiltAllow suspect to
voice objections
Invade suspectrsquos
personal space
Suspect becomes
uncomfortable
Suspect
doesnrsquot
deny guilt
Suspect
denies guilt
No reaction
Elicit confession
Rephrase objections as
confessions
FINISH
Random shapes are meaningless and confusing ndash use conventional flow chart symbols
Stages of process are not clear ndash arrange shapes top to bottom with options at each stage branching off to side at same level
Connectors that are either straight or curved would be more consistent
Labels are clear
Text uses consistent font and size
Foundation Computing
Basic Schematic Diagrams 5957docx Page 54
2) The following diagram is an organisation chart for Widget Enterprises
John Smith
MANAGER
Seth Drew
IT MANAGER
May Furur
SECRETARY
Judith Holland
CUSTOMER SERVICES manager
Jad Ling
HELPDESK
Harry Petal
FINANCIAL MANAGER
Wanda Springer
MARKETING
MANAGER
Bob Smithells
CLEANER
Kelly Inlerl
MARKETING ASSISTANT
Beryl Thin
CUSTOMER SERVICES ASSISTANTValda Rigley
CUSTOMER
SERVICES
ASSISTANT
Levi Quayle
COMPUTER
TECHNICIAN
No clear levels to hierarchy ndash organise so that diagram reads top to bottom and positions at similar level are in same horizontal space
Different sized boxes and borders on some boxes are meaningless ndash need consistent style for similar elements
Connectors cross over each other and boxes overlap ndash arrange space to avoid this
Text size and font is mostly consistent but one typo needs correcting
3) Which of the following computer applications can be used to create schematic diagrams
a) Microsoft Visio
b) Microsoft Paint
c) Microsoft Word
d) All of the above correct
4) Which frequently used shapes does the Microsoft Paint Tool bar contain templates for
Polygon rectangle ovalellipse
Foundation Computing
Basic Schematic Diagrams 5957docx Page 55
5) Where in the Microsoft Paint window would you be able to select the thickness of line that you wanted for a brushstroke
Options area below the Toolbar
6) Identify the purpose and intended audience for a diagram showing a businessrsquos marketing plan
The purpose would be to provide an overview of the businessrsquos marketing strategy Audience could include management and employees of the business especially the Marketing department potential investors shareholders and directors of the business
7) Name two characteristics of well-designed schematic diagrams Any of simple easy for the target audience to understand include all relevant elements or parts of the process clear and logical connections between elements accurate 8) Identify four steps involved in designing schematic diagrams Gather information organise information make connections between elements test your diagram 9) Why is it important to use conventionally accepted and familiar shapes and
symbols in your schematic diagrams So that the diagram will be easily understood by the target audience
Foundation Computing
Basic Schematic Diagrams 5957docx Page 56
References httpwindowsmicrosoftcomen-NZwindows7Getting-started-with-Paint accessed Sat 5th December in Timaru New Zealand httpenwikipediaorgwikiSchematic_diagrams accessed Sat 5th December in Timaru New Zealand httpenwikipediaorgwikiSymbol accessed Sat 5th December in Timaru New Zealand
Foundation Computing
Basic Schematic Diagrams 5957docx Page 3
Produce schematic diagrams using a computer application
Unit Standard 5957 Version 6
Level 2 Credits 2
Purpose
People credited with this unit standard are able to plan and produce schematic diagrams using a computer application from a given brief
LEARNING GUIDE 5957
Copyright copy CTF Services Ltd (2005) All rights reserved No part of this material may be reproduced by any means
without permission in writing from the publisher
Foundation Computing
Basic Schematic Diagrams 5957docx Page 4
Elements and Performance Criteria
Element 1 Plan schematic diagrams from a given brief Performance criteria 11 The plan identifies the purpose and target audience for the schematic
diagram 12 The plan identifies the computer application required to produce the
schematic diagram
Element 2 Produce schematic diagrams from a given brief using a computer application Performance criteria 21 The symbols used in each diagram are consistent with the type of diagram
and the specifications of the brief 22 The final diagram is readable clearly illustrates the object being diagrammed
and is consistent with the specifications of the brief
Foundation Computing
Basic Schematic Diagrams 5957docx Page 5
Unit 5957 Produce schematic diagrams using a computer application
Module Objectives
When you have finished this workbook the practical exercises that are part of it and the assessment you will be credited with the NZQA unit 5957 You will be able to
Plan schematic diagrams from a given brief
Produce schematic diagrams from a given brief using a computer application Please follow this module guide and enjoy the material The unit is part of the qualifications framework so there are things you need to do to pass it They are listed on the previous few pages under ldquoElements and Performance Criteriardquo and you will be reminded of them here and there throughout this workbook
Assessment Self Tests for each section ndash these arenrsquot marked but they will be helpful to the students Assessment for this module ndash this will be marked and will count towards your final assessment
Resources Use the Learning Guide NZQA Unit Standard 5957 To demonstrate competency in this unit the person will require access to
Personal computers
Software applications such as MS Office
Operating system such as MS Windows XP Pro or higher
Peripheral devices such as printers mouse keyboard monitor other PCs and others
Prerequisites None
Foundation Computing
Basic Schematic Diagrams 5957docx Page 6
GLOSSARY OF TERMS Here is a short Glossary of Terms that is relevant to this Unit Standard We hope you will find it useful Sourced from httpwwwedisonohioedudtpdtpglosshtml alignment - the placement of type relative to margins left means lines share a left border but are uneven on the right side justified or fully justified means both left and right sides are aligned ascender - part of a lower case letter that rises above the x-height baseline - an imaginary line upon which rests the body of a line of type Descenders such as lower-case p or g drop below the baseline bold or boldface - an expression of weight also a style of type bullet - a type of character the most common being a large dot that is used to separate text or to begin paragaphs especially in lists Can be created on the Mac with the key combination Option-8 on the PC with Control-Shift-8 column - a vertical block of type or the space used to lay out type and graphics Pages may have as few as one column or many column guides - non-printing lines that define the left and right margins of columns on a page accessible through the Layout menu crop cropping - any technique that reduces the amount of a graphic that shows or prints In PageMaker the cropping tool can be used to crop horizontally or vertically crop marks - printed but non-reproducing marks that aid the printer in determining trim size descender - part of a lower case letter that drops below the baseline EPS - a file format that stands for Encapsulated PostScript used for high-resolution output and special effects fill - the property of an object that determines the appearance of the body of the object fill may be solid a tint or screen a pattern or none folio - printers term for page number font - often used interchangeably with face or type face is now actually the name of type such as Helvetica or Times Bold Traditionally a single size weight and style of type grid - non-printing guides including column guides and ruler guides that aid in structuring page layouts gutter - The space between pages in facing pages layouts halftone - in printing the technique of simulating shades of gray or color by varying the size of dots in a grid or the number of pixels in a given area
Foundation Computing
Basic Schematic Diagrams 5957docx Page 7
hanging indent - a paragraph format where the lines are indented a certain distance from the left margin but the first line is indented a negative amount so that the first line hangs over the rest of the left alignment horizontal - side to side left to right as in the sun sets below the horizon in-line graphic - a graphic element embedded in a paragraph as a text character It takes on alignment and other characteristics of the host paragraph indents - Additional space measured from the left and right of a text block or margin Indents can be Left in which all lines in the paragraph are the specified distance from the left margin Right in which all lines in the paragraph are the specified distance from the right margin and First in which the first line of the paragraph is an additional amount from the left margin Note that First can be a negative number up to the positive value of the left indent to form a hanging indent italic - general term used to describe slanted type although strictly italic letterforms vary from the non-italic original kerning - the adjustment of spacing between letter pairs leader - A character most commonly used with tabs to visually connect the text on either side of the tab most common character is the period followed by the underscore Do not confuse with leading leading - the distance from the baseline of one line of text to the baseline of the next usually measured in points line - the property of an object that determines the appearance of the perimeter of the object Lines may be solid a tint or screen patterns or none Line weight is measured in points line length - a function of the width of the text block minus any indents For body copy line length should be in picas 1 to 25 times the size of type in points margin - defined area surrounding a page that separates the trim from the live (printing) area mask - a technique for using the shape of one graphic object to crop or otherwise block out portions of another graphic object master page - a page identified by an L or R in the lower left corner of a document window on which you create elements that will appear consistently throughout the publication paragraph style - see Style sheet pica - a typographic measurement system consisting of 12 points there are 6 picas per inch points - the basic measure of type there are 72 points to the inch or 12 points to the pica point size - a measure of the size of type in points rule - printers term for a line ruler guide - a non-printing line that you drag from either the vertical or horizontal rulers to help you position elements on a page
Foundation Computing
Basic Schematic Diagrams 5957docx Page 8
running head - a line of text often containing the title that is consistent across most or all the pages in a publication running foot - a line of text often containing the folio that is consistent across most or all the pages in a publication sans serif - the class of type faces without serifs Helvetica is an example serif - a line or curved extension projecting from the end of a letter form can be used to distinguish a class of type faces such as Times from sans serif faces such as Helvetica set width - a typographic name for the horizontal scaling of type usually expressed as a percentage Squeeze or stretch might be other words for set width soft returns - in PageMaker holding the Shift key while pressing Return creates a soft return sometimes called a line break or new line but does not start a new paragraph Most often used in conjunction with bullet lists style - a variant of the basic type face such as Italic Bold Strikethrough or Outline Not to be confused with Style Sheets style sheet - essentially a script or shortcut for several text and paragraph formatting choices such as but not limited to indents rules typeface size and styles Style sheets apply to paragraphs at a time rather than individual words and are also sometimes called paragraph styles tab - a non-printing character that affects alignment of text that follows it may be left right center decimal See also leader text block - In PageMaker an object that contains text defined by handles at top bottom left and right Text blocks can be linked and a single story may have many text blocks To view a text block click on text with the Pointer Tool text wrap - the technique of flowing text around graphic elements In PageMaker the options are available under the Element menu tracking - preset letter spacing values trim size - size of the finished page after the excess has been cut away typeface or face - can refer to an entire related named family of type such as Helvetica or Times vertical - up and down top to bottom weight - term referring to the heaviness of a type faces stroke Terms often used are light medium book bold heavy ultra x-height - a value often expressed as a percentage that measures the height of the body of lowercase letters in a type face or in proportion to the upper case letters zero point - the point at which the on-screen vertical and horizontal rulers meet at 0 the position relative to the page is changeable by the user zoom - the act of enlarging or reducing the magnification on screen like moving closer or farther away refer to the View menu option
Foundation Computing
Basic Schematic Diagrams 5957docx Page 9
Part 1 Plan schematic diagrams
from a given brief OBJECTIVES
On successful completion of this section you will be able to Plan schematic diagrams from a given brief Performance criteria
11 The plan identifies the purpose and target audience for the schematic diagram
12 The plan identifies the computer application required to produce the
schematic diagram
TOPICS
Topic 1 Identifying the purpose and the target audience Topic 2 Identifying the computer application required Topic 3 Getting started with MS Paint Topic 4 Designing your diagram
Self Test
Self Test Answers
Foundation Computing
Basic Schematic Diagrams 5957docx Page 10
TOPIC 1 Identifying the purpose and the target audience
Letrsquos define a few terms (both definitions taken from NZQA Unit Standard 5957) A brief is defined as a clear description of both the desirable outcomes sought and the constraints to be met by the solution It contains requirements against which the success or otherwise of the desktop published document can be evaluated The brief can be supplied either as part of the candidatersquos employment (in the case of workplace assessment) or in response to a set task Text graphics and specified page layout will be provided for the task A plan outlines how the requirements of the brief will be realised For this unit standard the plan may be informal and it may be more appropriate to produce evidence of it during task completion rather than prior to starting the task or project Evidence of planning may be oral written andor graphic Accordingly we need to plan schematic diagrams from a given brief There are many ways to achieve our purpose However a) What are schematic diagrams b) What is the purpose for these schematic diagrams c) Who is our target audience
Schematic Diagrams Schematic diagrams are used to show the different parts or elements of a system or process and how they are connected and related to each other Examples of systems include
organisations like your school or
computer networks or
electrical circuits A mind map that you might use to plan an essay is a simple example of a schematic diagram In this case your essay is the system and the different elements are the different facts and ideas and headings that you need to include in your essay Processes can include
instructions for how to do something
software programming or
plans for an event such as a wedding
Foundation Computing
Basic Schematic Diagrams 5957docx Page 11
A schematic is a diagram that represents the elements of a system using abstract graphic symbols rather than realistic pictures A schematic usually omits all details that are not relevant to the information the schematic is intended to convey and may add unrealistic elements that aid comprehension For example
a subway map intended for riders may represent a subway station with a dot the dot doesnt resemble the actual station at all but gives the viewer information without unnecessary visual clutter
A schematic diagram of a chemical process uses symbols to represent the vessels piping valves pumps and other equipment of the system emphasizing their interconnection paths and suppressing physical details
In an electronic circuit diagram the layout of the symbols may not resemble the layout in the physical circuit In the schematic diagram the symbolic elements are arranged to be more easily interpreted by the viewer
A schematic of the Washington Metro The schematic is not drawn to scale distances
between stations are fixed and lines are drawn at 45 and 90-degree angles
Foundation Computing
Basic Schematic Diagrams 5957docx Page 12
In the electrical industry a schematic diagram is often used to describe the design of equipment Schematic diagrams are often used for the maintenance and repair of electronic and electromechanical systems Original schematics were done by hand using standardized templates or pre-printed adhesive symbols but today Electrical CAD software is often used Schematic diagrams are used extensively in repair manuals to help users understand the interconnections of parts and to provide graphical instruction to assist in taking apart and rebuilding mechanical assemblies Many automotive and motorcycle repair manuals devote a significant number of pages to schematic diagrams
Exercise 1 See if you can match each of the names in the box with one of the schematic diagrams below
Flow Chart
Organisation Chart
Electrical circuit
Mind map A)
Marketing Plan
Placement
ProductPromotion
Price
Competitive
weaknesses
Competitive
strengths
New features
Trade shows
Mailings
Advertising
B)
Jeremy Nash
CEO
Adam Jurgensen
Operations
Manager
Aneru Jacobs
Sales and
Marketing
Obed Tambo
District Coodinator
Manaia Pehi
Financial
Manager
Hashim Mohamed
Accountant
Janet Brookes
Personal Assistant
Steven Alleroo
IT Manager
Cindy Wahoo
Technician
Foundation Computing
Basic Schematic Diagrams 5957docx Page 13
C)
120V
480V
U
L
L
U
LOR
RESET
OL
TR2
TR3
VIB
VIB
WTR
MOTOR
BLOWER
PS
LOR
ON-OFF
SS
TR3
START
M
START
RUN
HAND
OFF
REMOTE
LOR
M
REMOTE
MODE
M
PS
TR1
TR2
S
To LOR COIL CIRCUIT
M
MSH
ON-OFF
R
W
TR1
X1
D
C
B
A
4 3 2 1
D
C
B
A
4 3 2 1
D)
Foundation Computing
Basic Schematic Diagrams 5957docx Page 14
Answers A = Mindmap B = Organisation chart C = Electrical circuit diagram D = Flow chart Schematic diagram production Before suitable computer applications were developed schematic diagrams were produced manually using tools such as typewriters stencils stickers or labels and drawing by hand Sometimes it can be quicker to produce simple schematic diagrams by hand or you may not have a computer available or the computer application available might be too complex or take so long to learn that it makes more sense to use manual methods Alternatively you may have a highly complex schematic diagram that is too big to print out on the computer printers available and would not make sense if spread over a number of pages
Exercise 2) In the space below or on a piece of paper describe some situations in which you would choose to use a computer application to produce your schematic diagram and explain why
Exercise 3) Now describe some situations in which you would choose NOT to produce your schematic diagram using a computer application and explain why not
Exercise 4) Working with a partner brainstorm the advantages and disadvantages of producing schematic diagrams with a computer application rather than by hand
Foundation Computing
Basic Schematic Diagrams 5957docx Page 15
Suggested answers to the exercises 2) In the space below describe some situations in which you would choose to use a computer application to produce your schematic diagram and explain why Situations could include (and there are many more)
Preparing a flow chart to send by email to all the members of a team ndash because doing it on computer would allow me to make multiple copies and email them easily
Producing a complex network diagram as part of a report to present ndash because it would look more professional and could be easily changed or updated
Preparing an organisation chart to include in a computerised slideshow - because it could easily be imported
3) Now describe some situations in which you would choose NOT to produce your schematic diagram using a computer application and explain why not
Situations could include
Presenting an organisation diagram or a flow chart to a community organisation as a one-off event if I did not have access to a large-scale printer or projector I would draw or paint the diagram by hand ndash because it would be the simplest way to make it large enough for everyone to see and I would be unlikely to need more copies
In an assessment situation drawing a mind map or brainstorming diagram to organise my ideas before writing an essay or report ndash because it would be quickest
Working with a team to sketch out a plan for a process because it would be quickest and wouldnrsquot rely on being close to a computer
Foundation Computing
Basic Schematic Diagrams 5957docx Page 16
4) Working with a partner brainstorm the advantages and disadvantages of producing schematic diagrams with a computer application rather than by hand
Your results of your brainstorm might look like this (diagram produced using MS Visio)
Using computers AdvantagesDisadvantages
need to learn
application
can take longer
sometimes difficult
to plan
limited options for
layout
frustrating
too many options
incompatible file
types
can store on
computer
can fit more smaller
text
easy to read
can email to people
use templates
easy to change or
update
Can be quick
easy to make
copies
professional looking
import into
computer
documents
Expensive
equipment needed
technical problems
Security
Foundation Computing
Basic Schematic Diagrams 5957docx Page 17
Process for producing schematic diagrams on computer There are many different computer applications that can be used to produce schematic diagrams Some applications like Microsoft Visio are specifically designed to help you create a wide range of complex schematic diagrams easily However almost any computer application that has a drawing tool can be used to produce a schematic diagram and the process will usually involve the following steps 1) Design the diagram
a Identify your target audience b Collect all the information you need c Arrange your information in a logical order d Test your diagram
2) Create the diagram in the computer application
a Open the drawing window b Draw the shapes you want c Arrange the shapes according to your design d Add connectors between each of the shapes e Add text where required
Designing effective diagrams The main purpose of a schematic diagram is to provide a clear and easy to understand visual overview of how the different parts of a system fit together Schematic diagrams that are well-designed
are as simple as possible
are easy for the target audience to understand
include all relevant elements or parts of the process
have clear and logical connections between elements
communicate an accurate picture of the system or process
Foundation Computing
Basic Schematic Diagrams 5957docx Page 18
Identifying the target audience The target audience is the group of people who will read your schematic diagram The main question you need to ask yourself is Who is my audience In order to identify the target audience for your schematic diagram think about the following
What sort of person will read your diagram Think about that personrsquos job age education language environment and other characteristics that could affect the sort of language and symbols they will understand and relate to
What information will that person look for Why are they reading your diagram What do they want or need to know What information is most important What information is not so important
How much time will that person have to look at your diagram Will they be in a hurry or will they have time to study all the details Does your diagram have to stand alone or will it have a lot of text next to it to explain it
What do you want your audience to learn or do as a result of reading your diagram
What does the diagram need to show What information do you have to include How should this information be arranged
Foundation Computing
Basic Schematic Diagrams 5957docx Page 19
Exercise Complete the table below with information about the target audience and purpose for each of the examples of schematic diagrams given Use the questions above to help you
Example diagram Target audience
You work as an electrician and Mr Jones has asked you to design an electrical wiring plan for the dream house he wants to build
You are a computer programmer and you are using a flowchart to plan a computer program that farmers can use to keep count of their sheep
You have to write an essay about your most embarrassing childhood experience and you create a mindmap to organise your ideas
You are researching your family history and have been asked to create a family tree diagram for a booklet that will be handed out at an upcoming family reunion
Foundation Computing
Basic Schematic Diagrams 5957docx Page 20
Suggested Answer Complete the table below with information about the target audience and purpose for each of the examples of schematic diagrams given Use the questions above to help you
Example diagram Target audience
You work as an electrician and Mr Jones has asked you to design an electrical wiring plan for the dream house he wants to build
Mr Jones his builder local council officials theyrsquoll need detailed information that will be studied in depth and referred to during the planning and building process
You are a computer programmer and you are using a flowchart to plan a computer program that farmers can use to keep count of their sheep
You and other computer programmers will use the flowchart to understand the process of the programme and to identify flaws in its logic
You have to write an essay about your most embarrassing childhood experience and you create a mindmap to organise your ideas
You are the only person who will use your mindmap and you will refer to it as you write your essay
You are researching your family history and have been asked to create a family tree diagram for a booklet that will be handed out at an upcoming family reunion
Members of your family will look for their names and those of relatives in order to see how people are related to each other
Foundation Computing
Basic Schematic Diagrams 5957docx Page 21
TOPIC 2 Identifying the computer application required There are many computer applications that can be used to create schematic diagrams Microsoft Visio is specifically designed for this purpose but any application with basic drawing tools such as those found in Microsoft Word can be used One of the simplest and most widely available computer drawing applications is Microsoft Paint We will use this application is used to demonstrate the tools However most of the tools and principles we will focus on in Microsoft Paint can be found in other drawing applications The following diagram shows the Microsoft Paint window
The tools are arranged to the left of the drawing area in the Tool bar An overview of how to use the tools you need to create a simple schematic diagram is provided below Underneath the Tool bar is the Options box When you click on a tool icon in the Tool bar the options available for that tool appear in the Options box To select an option click on the tool you want to use then click on the option and then click in the drawing area and drag the mouse pointer to draw The Colour palette is underneath the drawing area To use a colour click on the tool you want to use then click on the colour and then click in the drawing area ndash the shape line or text you create will appear in the colour you have selected
Foundation Computing
Basic Schematic Diagrams 5957docx Page 22
Tools Selection Tools Use the selection tools to select the parts of your schematic diagram that you want to work with or change in some way To use these tools click on the button of the tool you want and then click on your diagram and drag until the area you want to work with is selected The Freeform Select tool (on the left) is used to select an irregularly shaped area The Rectangle Select tool is used to select a rectangular area To copy a part of your diagram eg a shape line or text it must first be selected using a selection tool Select Copy from the Edit menu click where you want the copy to be positioned and select Paste from the Edit menu Shapes tools
The shapes tools which can be used to create symbols in schematic diagrams consist of the Rectangle tool for creating squares or rectangles the Polygon tool for creating multi-sided shapes the Rounded Rectangle tool for creating rounded rectangles and the Oval tool for creating circles or ovals These tools provide templates for creating frequently used symbols To use them simply click on the icon of the shape you want to use and drag it onto your diagram where you can resize it if necessary and add text or
Foundation Computing
Basic Schematic Diagrams 5957docx Page 23
effects For the Polygon tool click and drag to draw the first side and click each time you want to change direction Double-click when you have finished To create a perfect circle hold down the Shift key while you are dragging the mouse pointer
Line tools In schematic diagrams line tools can be used to draw connectors between symbols and to draw shapes or symbols
The Straight Line tool creates straight lines simply click on the Straight Line icon click in your picture where you want the line to start and drag to where you want the line to finish The Curve tool will create a curve with at least one and no more than two bends in it click on the Curve icon then click in your picture to draw a straight line and drag to where you want the first bend to be click again where you want the second curve to be and drag to shape the curve You can make more complex shapes by joining lines and curves together
The Pencil tool can be used to draw freeform shapes or lines with as many bends and curves as you want Click on the icon click in your diagram and ldquodrawrdquo with your mouse pointer To draw straight lines hold down the shift key as you are drawing with the mouse
Foundation Computing
Basic Schematic Diagrams 5957docx Page 24
The Paint Brush tool draws freeform lines in the same way as the Pencil tool but can be used to create lines of varying widths and styles To select a paintbrush style click on the Paint Brush icon and then click in the Options box on the style you want to use
The Airbrush tool creates lines with an airbrushed effect of clustered dots It can be used in the same way as the pencil tool to draw freeform shapes or symbols In the Options box you can choose the size of the area covered by the Airbrush tool
Text tool
Add text to your schematic diagram by clicking on the Text icon and clicking in your diagram where you want the text to appear As you drag a rectangle will be formed within which text can be typed The Fonts dialogue box will also open
Foundation Computing
Basic Schematic Diagrams 5957docx Page 25
Fill Tool
The Fill tool will add colour to a shape that you have drawn Click on the icon click on a colour from the colour palette and then click on the shape in the diagram that you want to fill with colour
Zoom tool
Use the Zoom tool to magnify a section of the diagram that you are working with Click on the magnifying glass icon select the size you want in the Options box and click on the part of the image you want to enlarge As the picture zooms in the cursor will change back to the tool you were using before
Adding colour
The Colour box to the left of the Colour palette shows the foreground and background colours you are using If you click on a tool and then drag while holding down the left mouse button the line or shape will be drawn using the foreground colour If you hold down the right mouse button the background colour will be used To use any other colour click on the tool you want to use click on an option (if using) then click on the colour you want from the colour palette As you draw the colour you have clicked on will be used
Foundation Computing
Basic Schematic Diagrams 5957docx Page 26
Additional resources For more detailed information about these tools refer to the Help menu in Microsoft Paint (httpwindowshelpmicrosoftcom )
The following online tutorials may also be useful
httplkwdplorgclassesMSPaintpainthtml
httpwwwlesleyedufacultyahuntMSPttutrhtm
Exercise The example below shows a simple organisation chart produced using Microsoft Paint In the space that follows identify which tools were used to create this schematic diagram and what each tool was used for
Rectangle tool used to create Manager symbol
Oval tool used to create Team Leader symbols
Rounded Rectangle tool used for Team member symbols
Straight line tool used to create connectors
Text tool used to add text to shapes
Rectangle Select tool used to select shapes to move into
position
Foundation Computing
Basic Schematic Diagrams 5957docx Page 27
Suggested Answer The example below shows a simple organisation chart produced using Microsoft Paint In the space that follows identify which tools were used to create this schematic diagram and what each tool was used for
Rectangle tool used to create Manager symbol
Oval tool used to create Team Leader symbols
Rounded Rectangle tool used for Team member symbols
Straight line tool used to create connectors
Text tool used to add text to shapes
Rectangle Select tool used to select shapes to move into position
Foundation Computing
Basic Schematic Diagrams 5957docx Page 28
Exercise Which tools would you use to produce the following symbols or diagrams and why
Symbol Tools and justification
Resistor (Electrical circuit diagram)
Speaker (Electrical circuit diagram)
AC
AC source (Electrical circuit diagram)
Start or end of process (Flowchart)
Decision (yes or no) (Flowchart)
Instructions or actions (Flowchart)
Foundation Computing
Basic Schematic Diagrams 5957docx Page 29
Symbol Tools and justification
Document produced (Flowchart)
Data entered or received (Flowchart)
Foundation Computing
Basic Schematic Diagrams 5957docx Page 30
Suggested Answers Which tools would you use to produce the following symbols or diagrams and why
Symbol Tools and justification
Resistor (Electrical circuit diagram)
Straight line tool (hold down shift key)It creates regular 45 degree angled lines that are perfectly straight
Speaker (Electrical circuit diagram)
Polygon tool (hold down shift key) Rectangle tool and Straight line tool These are used in order to create a symbol with uniform angles and straight edges
AC
AC source (Electrical circuit diagram)
Oval tool (hold down shift key) to draw circle Curve tool to draw wavy line Straight line tool and Text tool These tools produce cleaner shapes than drawing freeform
Start or end of process (Flowchart)
Rounded rectangle tool This provides a template for creating this symbol
Decision (yes or no) (Flowchart)
Polygon tool This creates more accurate joins between sides than the Straight line tool
Instructions or actions (Flowchart)
Rectangle tool It provides a template for drawing this shape
Foundation Computing
Basic Schematic Diagrams 5957docx Page 31
Symbol Tools and justification
Document produced (Flowchart)
Line tool and Curve tool ndash need two tools in MSPaint other applications may have a template for this shape
Data entered or received (Flowchart)
Polygon tool ndash better than Straight line tool because can produce more regular shape
Foundation Computing
Basic Schematic Diagrams 5957docx Page 32
TOPIC 3 Getting started with MS Paint Sourced from httpwindowsmicrosoftcomen-NZwindows7Getting-started-with-Paint MS Paint is a feature in Windows that you can use to draw colour and edit pictures You can use Paint like a digital sketchpad to make simple pictures creative projects or to add text and designs to other pictures such as those taken with your digital camera The parts of Paint Open Paint by clicking the Start button clicking All Programs clicking Accessories and then clicking Paint When you start Paint youll see an empty window drawing and painting tools are located in the ribbon at the top of the window The following illustration shows the different parts of the Paint window
The Paint window
Foundation Computing
Basic Schematic Diagrams 5957docx Page 33
Working with tools The ribbon in Paint includes a handy collection of drawing tools You can use these tools to create freehand drawings and add a variety of shapes to your pictures This section describes some common tasks For more detailed information on how to use the different tools in Paint see Using Paint Draw a line Some tools and shapes such as the Pencil Brush Line and Curve let you make a variety of straight curved and squiggly lines What you draw is determined by how you move the mouse as you draw You can use the Line to draw a straight line for example
1) On the Home tab in the Shapes group click the Line 2) In the Colors group click Color 1 and then click the color you want to use 3) To draw drag the pointer across the drawing area
Draw a squiggly line Your drawings dont have to be composed of only straight lines The Pencil and Brushes can be used to make completely random free-form shapes
1) On the Home tab in the Tools group click the Pencil tool 2) In the Colors group click Color 1 and then click the color you want to use 3) To draw drag the pointer across the drawing area and make a squiggly line
Note If you want to make a line that has a different appearance use one of the Brushes instead Draw a shape Paint lets you draw many different shapes For example you can draw ready-made defined shapes such as rectangles circles squares triangles and arrows (to name a
few) You can also make your own custom shape by using the Polygon shape to draw a polygon which is a shape that can have any number of sides
1) On the Home tab in the Shapes group click a ready-made shape such as the
Rectangle 2) To add a ready-made shape drag the pointer across the drawing area to make
the shape 3) To change the outline style in the Shapes group click Outline and then click an
outline style 4) If you dont want your shape to have an outline click No outline 5) In the Colors group click Color 1 and then click a color for the outline 6) In the Colors group click Color 2 and then click a color to use to fill the shape 7) To change the fill style in the Shapes group click Fill and then click a fill style 8) If you dont want your shape to be filled click No fill
Foundation Computing
Basic Schematic Diagrams 5957docx Page 34
Add text You can also add text to your picture The Text tool lets you add a simple message or title
1) On the Home tab in the Tools group click the Text tool 2) Drag the pointer in the drawing area where you want to add text 3) Under Text Tools on the Text tab click the font face size and style in the Font
group The Font group
4) In the Colors group click Color 1 and then click a color This is the text color 5) Type the text that you want to add
Erase part of your picture If you make a mistake or need to change part of a picture use the eraser By default the eraser changes any area you erase to white but you can change the eraser color For example if you set the background color to yellow anything you erase turns to yellow
1) On the Home tab in the Tools group click the Eraser tool 2) In the Colors group click Color 2 and then click the color that you want to erase
with If you want to erase with white you dont have to select a color 3) Drag the pointer over the area you want to erase
Saving a picture Save your picture frequently so you dont accidentally lose your work To save click the
Paint button and then click Save This saves all of the changes made to the picture since the last time you saved The very first time that you save a new picture you will need to give your picture a file name Follow these steps
1) Click the Paint button and then click Save 2) In the Save as type box select the file format you want 3) In the File name box type a name and then click Save
Foundation Computing
Basic Schematic Diagrams 5957docx Page 35
Topic 4 Designing your diagram Although there are many different types of schematic diagrams the basic process and principles involved in designing a clear and coherent diagram are similar The principles apply to designing an electrical circuit diagram an organisation chart a mind map a flow chart and many other diagrams Some of these principles are also worth applying to other disciplines such as designing a Web page Letrsquos work step-by-step through the process of creating a flow chart to help people make money selling things on an on-line auction site such as wwwtrademeconz or wwwebaycom
Step 1 Gather your information Start by brainstorming all the information you need to include in your diagram Write down everything you think might be important or should be included
trademe
choose things that
sell
good photograph
feedback
keep track
prompt answers
postage
auction length
similar listings
postal system
setting reserve
describing item
correct category
re-listing
fixed offers
Look at the information you have gathered and think about your target audience Highlight the information that is most important to your target audience Cross out any irrelevant information Put question marks next to information that you are unsure about or may be able to leave out
Foundation Computing
Basic Schematic Diagrams 5957docx Page 36
Step 2 Organise your information Take the information that you have left and sort through it How you organise your information will depend on the type of diagram you are designing For example an organisationrsquos chart usually has different levels and shows who its members report to so you might group people by department and by level A flow chart like the example wersquore creating usually shows a process Information is grouped in the order we would use it If any other steps or information occurs to you as you are organising your information add them in Herersquos an example of how the key steps involved in selling on trademe could be ordered
Choose items that sell
Look at similar listings
Decide on a reserve price
Take a clear photograph
Identify your target audience
Write a clear description
Upload your item
Choose the correct category
Monitor watchers bids and views
Lower your reserve
Fixed price offers
Relist
Step 3 Make connections Once the elements are grouped or arranged in a logical order a clearer picture of the process or system you are representing in your diagram should start to emerge However unlike a list which usually reads from top to bottom only a diagram can show connections in many different directions and working out the links between elements is an essential part of designing a coherent diagram At this stage of the design process it is helpful to sketch out a basic plan of the elements you want to include and the flow-lines or connections between them In order to work out the connections between the elements ask questions such as What happens ifhellip What do I do beforeafter this What decisions need to be made now What actions need to be taken Use arrows to show connections between elements group elements that are part of the same stage or level of the process next to or near to each other and use shapes to show which elements are similar to each other eg diamonds for decisions rectangles for instructions or actions Make up your own meanings for shapes if necessary but be sure to use them consistently
Foundation Computing
Basic Schematic Diagrams 5957docx Page 37
The flow chart below shows how our list of elements above changes and gets re-ordered as we ask these questions and organise the information into a logical and coherent diagram
Decide on your
reserve price
START
Relist
Take a photo that is
clear and item looks
good
Decide on your
ideal buyer
Write a description
of your item
highlighting its
benefits for your
buyer
Upload your item in
a category your
buyer is likely to be
looking in
Monitor how many
views watchers and
bids your item gets
Lower your reserve
Item meets reserve
and sellsItem doesnrsquot sell
Offer to watchers for
your reserve
Decide what you
want to sell
Check what similar
items are currently
selling for
Lots of views but
no watchers
No interestFINISH
Foundation Computing
Basic Schematic Diagrams 5957docx Page 38
Step 4 Test your diagram The final step in designing your diagram is checking that it is as effective as possible To do this you should work through each stage step by step challenging it as you go Picture the process in your mind as you follow the links checking that you have included all the actions and decisions required that they are in the correct order and that no steps are duplicated Once yoursquore confident that the diagram is correct look at it again critically to see if you can improve it or clarify it Is there anywhere you can simplify it by removing unnecessary steps Is there anywhere that seems vague and would be easier to understand if you added a step or a connector Now imagine that you are a member of your target audience For a moment try to forget everything you know about the system or process you have designed a diagram for except for what your target audience knows Look at the diagram with fresh eyes does it make sense to you now Does anything seem odd confusing or out of place Finally look at the layout of your diagram Is it easy to read and follow Have you used shapes texts and arrows consistently Are your shapes and texts uniform and lined up properly Are your connectors clearly defined or are they criss-crossing all over each other Check the spelling of labels carefully ndash go through letter by letter to make sure all names and technical or unfamiliar terms are correct
Discussion With a partner look critically at our example diagram above Discuss any parts of it that you think could be better and any changes you would make to improve the readability of the flow chart Make note on the flow chart above of any areas that you think could be improved Share your answers with the rest of the class
Foundation Computing
Basic Schematic Diagrams 5957docx Page 39
Self Test 1) Mr Biggles owns Biggles Air Supplies a company that makes aircraft supplies He asks you to create an organisation chart for his company He gives you the following list of all his employees and who they report to
Mr James Biggles Chief Executive Officer
Jane Doep Personal Assistant to CEO
Mrs Monica Stepworth Financial Manager (reports to CEO)
Judith Zantes Accountant (reports to Financial Manager)
Mary Smallville Accountant (reports to Financial Manager)
Janey Poretuna Admin Assistant (reports to Judith Zantes)
Mickey Laluevu IT technician (reports to Financial Manager)
Mr Hank Johnson Operations Manager (reports to CEO)
Frank Hapil Engineering Manager (reports to Operations Manager)
Joe Smither Engineering Supervisor (reports to Engineering Manager)
Howie Fartherton Engineering Technician (reports to Engineering Supervisor)
Ernie Jusef Engineering Technician (reports to Engineering Supervisor)
Rob Luxemburg Apprentice Technician (reports to Ernie Jusef)
Harry Monahan Interiors Manager (reports to Operations Manager)
Barney Jokka Interiors Technician (reports to Interiors Supervisor) Design an organisation chart for Biggles Air Supplies and draw it in the space below
2) Think of a simple process that has at least five steps and involves some form of feedback or choice For example operating a vending machine topping up your mobile phone using EFTPOS checking messages on an answering machine
Design a flow chart to represent your process
Foundation Computing
Basic Schematic Diagrams 5957docx Page 40
Self Test Answers
1) Mr Biggles owns Biggles Air Supplies a company that makes aircraft supplies He asks you to create an organisation chart for his company He gives you the following list of all his employees and who they report to
Mr James Biggles Chief Executive Officer
Jane Doep Personal Assistant to CEO
Mrs Monica Stepworth Financial Manager (reports to CEO)
Judith Zantes Accountant (reports to Financial Manager)
Mary Smallville Accountant (reports to Financial Manager)
Janey Poretuna Admin Assistant (reports to Judith Zantes)
Mickey Laluevu IT technician (reports to Financial Manager)
Mr Hank Johnson Operations Manager (reports to CEO)
Frank Hapil Engineering Manager (reports to Operations Manager)
Joe Smither Engineering Supervisor (reports to Engineering Manager)
Howie Fartherton Engineering Technician (reports to Engineering Supervisor)
Ernie Jusef Engineering Technician (reports to Engineering Supervisor)
Rob Luxemburg Apprentice Technician (reports to Ernie Jusef)
Harry Monahan Interiors Manager (reports to Operations Manager)
Barney Jokka Interiors Technician (reports to Interiors Supervisor) Design an organisation chart for Biggles Air Supplies and draw it in the space below
Mr James Biggles
CEO
Jane Doep
Personal
Assistant
Mrs Monica Stepworth
Financial Manager
Judith Zantes
Accountant
Janey Poretuna
Admin Assistant
Mary Smallville
Accountant
Mickey Laluevu
IT technician
Mr Hank Johnson
Operations Manager
Frank Hapil
Engineering
Manager
Harry Monahan
Interiors Manager
Joe Smither
Engineering
Supervisor
Howie Fartherton
Engineering
Technician
Ernie Jusef
Engineering
Technician
Rob Luxemburg
Apprentice
Technician
Barney Jokka
Interiors
Technician
Foundation Computing
Basic Schematic Diagrams 5957docx Page 41
2) Think of a simple process that has at least five steps and involves some form of feedback or choice For example operating a vending machine topping up your mobile phone using EFTPOS checking messages on an answering machine
Design a flow chart to represent your process
Dial 06345
Enter your dialing code and
phone number followed by
the key
Dial number for
service you require
Listen to saved messagesListen to new messages
Dial number for
service you require
Save message Delete message
START
FINISH
Dial 2
Dial 1
Dial 1
Dial 2
Dial 1
Dial 2
Foundation Computing
Basic Schematic Diagrams 5957docx Page 42
Foundation Computing
Basic Schematic Diagrams 5957docx Page 43
Part 2
Produce schematic diagrams from a given brief using a computer application
OBJECTIVES
On successful completion of this section you will be able to Produce schematic diagrams from a given brief using a computer application
Performance criteria
21 The symbols used in each diagram are consistent with the type of diagram and the specifications of the brief
22 The final diagram is readable clearly illustrates the object being diagrammed
and is consistent with the specifications of the brief
TOPICS
Topic 1 Symbols used are consistent with diagram type and specifications Topic 2 Diagram is clear readable and consistent with specifications
Self Test
Self Test Answers
Foundation Computing
Basic Schematic Diagrams 5957docx Page 44
TOPIC 1 Symbols used are consistent with diagram type and specifications A symbol is something such as an object picture written word sound or particular mark that represents something else by association resemblance or convention For example a red octagon may be a symbol for STOP On maps crossed sabres may indicate a battlefield Numerals are symbols for numbers All language consists of symbols The word cat is not a cat but is an arbitrary symbol representing the idea of a cat There are many symbols for many things Examples range from Peace Pipe Red Cross to Electrical symbols It is good when doing schematic drawings to use symbols that are clearly recognised and interpreted Symbols that have been internationally standardised are the best Circuit diagram symbols have differed from country to country and have changed over time They are now to a large extent internationally standardized Simple components often had symbols intended to represent some feature of the physical construction of the device There are several national and international standards for graphical symbols in circuit diagrams in particular
IEC 60617 (also known as British Standard BS 3939)
ANSI standard Y32 (also known as IEEE Std 315) IEC 60617 originally consisted of 13 parts from resistors and capacitors to logic symbols and even a generalised drawing standard of connections and bus line widths It is now published as a subscription online database IEC 60617-DB Different symbols may be used depending on the discipline using the drawing for example lighting and power symbols used as part of architectural drawings may be different from symbols for devices used in electronics Different electronic components have different characteristics it is necessary to distinguish between them in any circuit diagram Of course we could use the block diagram approach and just identify each component with words Unfortunately this takes up a lot of space and makes the overall diagram harder to recognize or understand quickly We need a way to understand electrical diagrams far more quickly and easily
Foundation Computing
Basic Schematic Diagrams 5957docx Page 45
The answer is to use schematic symbols to represent electronic components as shown in the diagram below In this diagram we show the schematic symbol of a battery as the electrical source and the symbol of a resistor as the load Even without the words and arrows the symbols define exactly what this circuit is and how it behaves
Some good procedures to follow with symbols include
Using templates for frequently used symbols
Use symbols consistently
Use a library of symbols such as from IEC 60617-DB
Foundation Computing
Basic Schematic Diagrams 5957docx Page 46
TOPIC 2 Diagram is clear readable and consistent with specifications Creating a simple diagram using MSPaint To start with letrsquos create a simple flow chart representing the stages in designing a schematic diagram There are four stages in this process
1) Gather your information 2) Organise your information 3) Make connections 4) Test your diagram
Our flow chart will consist of four rectangles arranged vertically with downward pointing arrows as connectors A rounded rectangle at the top and at the bottom of the flowchart will indicate START and FINISH respectively Step by step
Open Microsoft Paint
Click on the Rectangle tool then click and drag in the drawing area to draw a rectangle
Repeat this step to draw four boxes in the drawing area OR click on the Select tool and click and drag to select the first rectangle then right-click to copy and paste three more rectangles the same size in the drawing area
Foundation Computing
Basic Schematic Diagrams 5957docx Page 47
Using the Rounded Rectangle tool draw a rounded rectangle at the top and bottom of your flow chart
Foundation Computing
Basic Schematic Diagrams 5957docx Page 48
Use the Line tool to draw arrows between each box In the Options area under the Tool bar you can choose the thickness of line that you want to use Remember too that if you hold down the Shift key on the keyboard while you are drawing a line you can create a 45 degree angle
Use the Text tool to add text to the shapes by clicking on the Text tool clicking and dragging to create a textbox inside your shape then typing your text Check your spelling carefully letter by letter as you go
Foundation Computing
Basic Schematic Diagrams 5957docx Page 49
The basic flowchart created in Microsoft Paint could look something like this
Foundation Computing
Basic Schematic Diagrams 5957docx Page 50
Common problems with diagrams Even well-designed schematic diagrams will be difficult for the target audience to read and understand if symbols are used inconsistently or the layout of the diagram is unfamiliar For example if a flowchart has different shapes used for each element and different types of arrows used randomly it will be more difficult for readers to see the overall direction and meaning of the diagram If the shapes on an organisation chart are different sizes and randomly positioned with no clear levels or hierarchy the diagram will not provide a clear overview of the organisationrsquos structure If an electrical circuit diagram has unfamiliar symbols used for elements such as switches resistors and batteries then it will not make sense to its intended audience
Tips for improving the readability of your schematic diagrams
Use symbols and shapes consistently ie elements that are similar should have the same symbol or shape
Avoid having connectors crossing over each other
Avoid having symbols or shapes overlapping
Use arrows on connectors or flow lines to indicate direction
Use colours text size and font consistently
Diagrams that can be read top-to-bottom and left-to-right are easier to read
In a process diagram have only one connector leading into a symbol but have more coming out where necessary to indicate different directions or decisions
Diagrams for a technical audience such as electrical or computer programming schematics should follow accepted conventions for symbols and layout
Diagrams indicating a hierarchy of positions ideas or stages are clearer if elements belonging to the same level are a similar shape size and position on the page
Keep labels as clear and as brief as possible Carefully check the spelling of all names and labels letter by letter ndash errors in the spelling of names or scientific and technical terms look unprofessional and can be confusing for readers
Foundation Computing
Basic Schematic Diagrams 5957docx Page 51
Self Test Look at the schematic diagrams that follow Make notes under each example of what is wrong with the diagram what is right about the diagram and what could be changed to make it clear and meaningful to its intended audience 1) This flow chart is supposed to show police officers how to get a suspect to confess to a crime
START
Confidently accuse
suspect of crime
Describe a
scenario that
enables suspect
to admit guiltAllow suspect to
voice objections
Invade suspectrsquos
personal space
Suspect becomes
uncomfortable
Suspect
doesnrsquot
deny guilt
Suspect
denies guilt
No reaction
Elicit confession
Rephrase objections as
confessions
FINISH
Foundation Computing
Basic Schematic Diagrams 5957docx Page 52
2) The following diagram is an organisation chart for Widget Enterprises
John Smith
MANAGER
Seth Drew
IT MANAGER
May Furur
SECRETARY
Judith Holland
CUSTOMER SERVICES manager
Jad Ling
HELPDESK
Harry Petal
FINANCIAL MANAGER
Wanda Springer
MARKETING
MANAGER
Bob Smithells
CLEANER
Kelly Inlerl
MARKETING ASSISTANT
Beryl Thin
CUSTOMER SERVICES ASSISTANTValda Rigley
CUSTOMER
SERVICES
ASSISTANT
Levi Quayle
COMPUTER
TECHNICIAN
3) Which of the following computer applications can be used to create schematic diagrams
a) Microsoft Visio
b) Microsoft Paint
c) Microsoft Word
d) All of the above
4) Which frequently used shapes does the Microsoft Paint Tool bar contain templates for
5) Where in the Microsoft Paint window would you be able to select the thickness of line that you wanted for a brushstroke 6) Identify the purpose and intended audience for a diagram showing a businessrsquos marketing plan 7) Name two characteristics of well-designed schematic diagrams 8) Identify four steps involved in designing schematic diagrams 9) Why is it important to use conventionally accepted and familiar shapes and symbols in your schematic diagrams
Foundation Computing
Basic Schematic Diagrams 5957docx Page 53
Self Test Answers 1) This flow chart is supposed to show police officers how to get a suspect to confess to a crime
START
Confidently accuse
suspect of crime
Describe a
scenario that
enables suspect
to admit guiltAllow suspect to
voice objections
Invade suspectrsquos
personal space
Suspect becomes
uncomfortable
Suspect
doesnrsquot
deny guilt
Suspect
denies guilt
No reaction
Elicit confession
Rephrase objections as
confessions
FINISH
Random shapes are meaningless and confusing ndash use conventional flow chart symbols
Stages of process are not clear ndash arrange shapes top to bottom with options at each stage branching off to side at same level
Connectors that are either straight or curved would be more consistent
Labels are clear
Text uses consistent font and size
Foundation Computing
Basic Schematic Diagrams 5957docx Page 54
2) The following diagram is an organisation chart for Widget Enterprises
John Smith
MANAGER
Seth Drew
IT MANAGER
May Furur
SECRETARY
Judith Holland
CUSTOMER SERVICES manager
Jad Ling
HELPDESK
Harry Petal
FINANCIAL MANAGER
Wanda Springer
MARKETING
MANAGER
Bob Smithells
CLEANER
Kelly Inlerl
MARKETING ASSISTANT
Beryl Thin
CUSTOMER SERVICES ASSISTANTValda Rigley
CUSTOMER
SERVICES
ASSISTANT
Levi Quayle
COMPUTER
TECHNICIAN
No clear levels to hierarchy ndash organise so that diagram reads top to bottom and positions at similar level are in same horizontal space
Different sized boxes and borders on some boxes are meaningless ndash need consistent style for similar elements
Connectors cross over each other and boxes overlap ndash arrange space to avoid this
Text size and font is mostly consistent but one typo needs correcting
3) Which of the following computer applications can be used to create schematic diagrams
a) Microsoft Visio
b) Microsoft Paint
c) Microsoft Word
d) All of the above correct
4) Which frequently used shapes does the Microsoft Paint Tool bar contain templates for
Polygon rectangle ovalellipse
Foundation Computing
Basic Schematic Diagrams 5957docx Page 55
5) Where in the Microsoft Paint window would you be able to select the thickness of line that you wanted for a brushstroke
Options area below the Toolbar
6) Identify the purpose and intended audience for a diagram showing a businessrsquos marketing plan
The purpose would be to provide an overview of the businessrsquos marketing strategy Audience could include management and employees of the business especially the Marketing department potential investors shareholders and directors of the business
7) Name two characteristics of well-designed schematic diagrams Any of simple easy for the target audience to understand include all relevant elements or parts of the process clear and logical connections between elements accurate 8) Identify four steps involved in designing schematic diagrams Gather information organise information make connections between elements test your diagram 9) Why is it important to use conventionally accepted and familiar shapes and
symbols in your schematic diagrams So that the diagram will be easily understood by the target audience
Foundation Computing
Basic Schematic Diagrams 5957docx Page 56
References httpwindowsmicrosoftcomen-NZwindows7Getting-started-with-Paint accessed Sat 5th December in Timaru New Zealand httpenwikipediaorgwikiSchematic_diagrams accessed Sat 5th December in Timaru New Zealand httpenwikipediaorgwikiSymbol accessed Sat 5th December in Timaru New Zealand

Foundation Computing
Basic Schematic Diagrams 5957docx Page 5
Unit 5957 Produce schematic diagrams using a computer application
Module Objectives
When you have finished this workbook the practical exercises that are part of it and the assessment you will be credited with the NZQA unit 5957 You will be able to
Plan schematic diagrams from a given brief
Produce schematic diagrams from a given brief using a computer application Please follow this module guide and enjoy the material The unit is part of the qualifications framework so there are things you need to do to pass it They are listed on the previous few pages under ldquoElements and Performance Criteriardquo and you will be reminded of them here and there throughout this workbook
Assessment Self Tests for each section ndash these arenrsquot marked but they will be helpful to the students Assessment for this module ndash this will be marked and will count towards your final assessment
Resources Use the Learning Guide NZQA Unit Standard 5957 To demonstrate competency in this unit the person will require access to
Personal computers
Software applications such as MS Office
Operating system such as MS Windows XP Pro or higher
Peripheral devices such as printers mouse keyboard monitor other PCs and others
Prerequisites None
Foundation Computing
Basic Schematic Diagrams 5957docx Page 6
GLOSSARY OF TERMS Here is a short Glossary of Terms that is relevant to this Unit Standard We hope you will find it useful Sourced from httpwwwedisonohioedudtpdtpglosshtml alignment - the placement of type relative to margins left means lines share a left border but are uneven on the right side justified or fully justified means both left and right sides are aligned ascender - part of a lower case letter that rises above the x-height baseline - an imaginary line upon which rests the body of a line of type Descenders such as lower-case p or g drop below the baseline bold or boldface - an expression of weight also a style of type bullet - a type of character the most common being a large dot that is used to separate text or to begin paragaphs especially in lists Can be created on the Mac with the key combination Option-8 on the PC with Control-Shift-8 column - a vertical block of type or the space used to lay out type and graphics Pages may have as few as one column or many column guides - non-printing lines that define the left and right margins of columns on a page accessible through the Layout menu crop cropping - any technique that reduces the amount of a graphic that shows or prints In PageMaker the cropping tool can be used to crop horizontally or vertically crop marks - printed but non-reproducing marks that aid the printer in determining trim size descender - part of a lower case letter that drops below the baseline EPS - a file format that stands for Encapsulated PostScript used for high-resolution output and special effects fill - the property of an object that determines the appearance of the body of the object fill may be solid a tint or screen a pattern or none folio - printers term for page number font - often used interchangeably with face or type face is now actually the name of type such as Helvetica or Times Bold Traditionally a single size weight and style of type grid - non-printing guides including column guides and ruler guides that aid in structuring page layouts gutter - The space between pages in facing pages layouts halftone - in printing the technique of simulating shades of gray or color by varying the size of dots in a grid or the number of pixels in a given area
Foundation Computing
Basic Schematic Diagrams 5957docx Page 7
hanging indent - a paragraph format where the lines are indented a certain distance from the left margin but the first line is indented a negative amount so that the first line hangs over the rest of the left alignment horizontal - side to side left to right as in the sun sets below the horizon in-line graphic - a graphic element embedded in a paragraph as a text character It takes on alignment and other characteristics of the host paragraph indents - Additional space measured from the left and right of a text block or margin Indents can be Left in which all lines in the paragraph are the specified distance from the left margin Right in which all lines in the paragraph are the specified distance from the right margin and First in which the first line of the paragraph is an additional amount from the left margin Note that First can be a negative number up to the positive value of the left indent to form a hanging indent italic - general term used to describe slanted type although strictly italic letterforms vary from the non-italic original kerning - the adjustment of spacing between letter pairs leader - A character most commonly used with tabs to visually connect the text on either side of the tab most common character is the period followed by the underscore Do not confuse with leading leading - the distance from the baseline of one line of text to the baseline of the next usually measured in points line - the property of an object that determines the appearance of the perimeter of the object Lines may be solid a tint or screen patterns or none Line weight is measured in points line length - a function of the width of the text block minus any indents For body copy line length should be in picas 1 to 25 times the size of type in points margin - defined area surrounding a page that separates the trim from the live (printing) area mask - a technique for using the shape of one graphic object to crop or otherwise block out portions of another graphic object master page - a page identified by an L or R in the lower left corner of a document window on which you create elements that will appear consistently throughout the publication paragraph style - see Style sheet pica - a typographic measurement system consisting of 12 points there are 6 picas per inch points - the basic measure of type there are 72 points to the inch or 12 points to the pica point size - a measure of the size of type in points rule - printers term for a line ruler guide - a non-printing line that you drag from either the vertical or horizontal rulers to help you position elements on a page
Foundation Computing
Basic Schematic Diagrams 5957docx Page 8
running head - a line of text often containing the title that is consistent across most or all the pages in a publication running foot - a line of text often containing the folio that is consistent across most or all the pages in a publication sans serif - the class of type faces without serifs Helvetica is an example serif - a line or curved extension projecting from the end of a letter form can be used to distinguish a class of type faces such as Times from sans serif faces such as Helvetica set width - a typographic name for the horizontal scaling of type usually expressed as a percentage Squeeze or stretch might be other words for set width soft returns - in PageMaker holding the Shift key while pressing Return creates a soft return sometimes called a line break or new line but does not start a new paragraph Most often used in conjunction with bullet lists style - a variant of the basic type face such as Italic Bold Strikethrough or Outline Not to be confused with Style Sheets style sheet - essentially a script or shortcut for several text and paragraph formatting choices such as but not limited to indents rules typeface size and styles Style sheets apply to paragraphs at a time rather than individual words and are also sometimes called paragraph styles tab - a non-printing character that affects alignment of text that follows it may be left right center decimal See also leader text block - In PageMaker an object that contains text defined by handles at top bottom left and right Text blocks can be linked and a single story may have many text blocks To view a text block click on text with the Pointer Tool text wrap - the technique of flowing text around graphic elements In PageMaker the options are available under the Element menu tracking - preset letter spacing values trim size - size of the finished page after the excess has been cut away typeface or face - can refer to an entire related named family of type such as Helvetica or Times vertical - up and down top to bottom weight - term referring to the heaviness of a type faces stroke Terms often used are light medium book bold heavy ultra x-height - a value often expressed as a percentage that measures the height of the body of lowercase letters in a type face or in proportion to the upper case letters zero point - the point at which the on-screen vertical and horizontal rulers meet at 0 the position relative to the page is changeable by the user zoom - the act of enlarging or reducing the magnification on screen like moving closer or farther away refer to the View menu option
Foundation Computing
Basic Schematic Diagrams 5957docx Page 9
Part 1 Plan schematic diagrams
from a given brief OBJECTIVES
On successful completion of this section you will be able to Plan schematic diagrams from a given brief Performance criteria
11 The plan identifies the purpose and target audience for the schematic diagram
12 The plan identifies the computer application required to produce the
schematic diagram
TOPICS
Topic 1 Identifying the purpose and the target audience Topic 2 Identifying the computer application required Topic 3 Getting started with MS Paint Topic 4 Designing your diagram
Self Test
Self Test Answers
Foundation Computing
Basic Schematic Diagrams 5957docx Page 10
TOPIC 1 Identifying the purpose and the target audience
Letrsquos define a few terms (both definitions taken from NZQA Unit Standard 5957) A brief is defined as a clear description of both the desirable outcomes sought and the constraints to be met by the solution It contains requirements against which the success or otherwise of the desktop published document can be evaluated The brief can be supplied either as part of the candidatersquos employment (in the case of workplace assessment) or in response to a set task Text graphics and specified page layout will be provided for the task A plan outlines how the requirements of the brief will be realised For this unit standard the plan may be informal and it may be more appropriate to produce evidence of it during task completion rather than prior to starting the task or project Evidence of planning may be oral written andor graphic Accordingly we need to plan schematic diagrams from a given brief There are many ways to achieve our purpose However a) What are schematic diagrams b) What is the purpose for these schematic diagrams c) Who is our target audience
Schematic Diagrams Schematic diagrams are used to show the different parts or elements of a system or process and how they are connected and related to each other Examples of systems include
organisations like your school or
computer networks or
electrical circuits A mind map that you might use to plan an essay is a simple example of a schematic diagram In this case your essay is the system and the different elements are the different facts and ideas and headings that you need to include in your essay Processes can include
instructions for how to do something
software programming or
plans for an event such as a wedding
Foundation Computing
Basic Schematic Diagrams 5957docx Page 11
A schematic is a diagram that represents the elements of a system using abstract graphic symbols rather than realistic pictures A schematic usually omits all details that are not relevant to the information the schematic is intended to convey and may add unrealistic elements that aid comprehension For example
a subway map intended for riders may represent a subway station with a dot the dot doesnt resemble the actual station at all but gives the viewer information without unnecessary visual clutter
A schematic diagram of a chemical process uses symbols to represent the vessels piping valves pumps and other equipment of the system emphasizing their interconnection paths and suppressing physical details
In an electronic circuit diagram the layout of the symbols may not resemble the layout in the physical circuit In the schematic diagram the symbolic elements are arranged to be more easily interpreted by the viewer
A schematic of the Washington Metro The schematic is not drawn to scale distances
between stations are fixed and lines are drawn at 45 and 90-degree angles
Foundation Computing
Basic Schematic Diagrams 5957docx Page 12
In the electrical industry a schematic diagram is often used to describe the design of equipment Schematic diagrams are often used for the maintenance and repair of electronic and electromechanical systems Original schematics were done by hand using standardized templates or pre-printed adhesive symbols but today Electrical CAD software is often used Schematic diagrams are used extensively in repair manuals to help users understand the interconnections of parts and to provide graphical instruction to assist in taking apart and rebuilding mechanical assemblies Many automotive and motorcycle repair manuals devote a significant number of pages to schematic diagrams
Exercise 1 See if you can match each of the names in the box with one of the schematic diagrams below
Flow Chart
Organisation Chart
Electrical circuit
Mind map A)
Marketing Plan
Placement
ProductPromotion
Price
Competitive
weaknesses
Competitive
strengths
New features
Trade shows
Mailings
Advertising
B)
Jeremy Nash
CEO
Adam Jurgensen
Operations
Manager
Aneru Jacobs
Sales and
Marketing
Obed Tambo
District Coodinator
Manaia Pehi
Financial
Manager
Hashim Mohamed
Accountant
Janet Brookes
Personal Assistant
Steven Alleroo
IT Manager
Cindy Wahoo
Technician
Foundation Computing
Basic Schematic Diagrams 5957docx Page 13
C)
120V
480V
U
L
L
U
LOR
RESET
OL
TR2
TR3
VIB
VIB
WTR
MOTOR
BLOWER
PS
LOR
ON-OFF
SS
TR3
START
M
START
RUN
HAND
OFF
REMOTE
LOR
M
REMOTE
MODE
M
PS
TR1
TR2
S
To LOR COIL CIRCUIT
M
MSH
ON-OFF
R
W
TR1
X1
D
C
B
A
4 3 2 1
D
C
B
A
4 3 2 1
D)
Foundation Computing
Basic Schematic Diagrams 5957docx Page 14
Answers A = Mindmap B = Organisation chart C = Electrical circuit diagram D = Flow chart Schematic diagram production Before suitable computer applications were developed schematic diagrams were produced manually using tools such as typewriters stencils stickers or labels and drawing by hand Sometimes it can be quicker to produce simple schematic diagrams by hand or you may not have a computer available or the computer application available might be too complex or take so long to learn that it makes more sense to use manual methods Alternatively you may have a highly complex schematic diagram that is too big to print out on the computer printers available and would not make sense if spread over a number of pages
Exercise 2) In the space below or on a piece of paper describe some situations in which you would choose to use a computer application to produce your schematic diagram and explain why
Exercise 3) Now describe some situations in which you would choose NOT to produce your schematic diagram using a computer application and explain why not
Exercise 4) Working with a partner brainstorm the advantages and disadvantages of producing schematic diagrams with a computer application rather than by hand
Foundation Computing
Basic Schematic Diagrams 5957docx Page 15
Suggested answers to the exercises 2) In the space below describe some situations in which you would choose to use a computer application to produce your schematic diagram and explain why Situations could include (and there are many more)
Preparing a flow chart to send by email to all the members of a team ndash because doing it on computer would allow me to make multiple copies and email them easily
Producing a complex network diagram as part of a report to present ndash because it would look more professional and could be easily changed or updated
Preparing an organisation chart to include in a computerised slideshow - because it could easily be imported
3) Now describe some situations in which you would choose NOT to produce your schematic diagram using a computer application and explain why not
Situations could include
Presenting an organisation diagram or a flow chart to a community organisation as a one-off event if I did not have access to a large-scale printer or projector I would draw or paint the diagram by hand ndash because it would be the simplest way to make it large enough for everyone to see and I would be unlikely to need more copies
In an assessment situation drawing a mind map or brainstorming diagram to organise my ideas before writing an essay or report ndash because it would be quickest
Working with a team to sketch out a plan for a process because it would be quickest and wouldnrsquot rely on being close to a computer
Foundation Computing
Basic Schematic Diagrams 5957docx Page 16
4) Working with a partner brainstorm the advantages and disadvantages of producing schematic diagrams with a computer application rather than by hand
Your results of your brainstorm might look like this (diagram produced using MS Visio)
Using computers AdvantagesDisadvantages
need to learn
application
can take longer
sometimes difficult
to plan
limited options for
layout
frustrating
too many options
incompatible file
types
can store on
computer
can fit more smaller
text
easy to read
can email to people
use templates
easy to change or
update
Can be quick
easy to make
copies
professional looking
import into
computer
documents
Expensive
equipment needed
technical problems
Security
Foundation Computing
Basic Schematic Diagrams 5957docx Page 17
Process for producing schematic diagrams on computer There are many different computer applications that can be used to produce schematic diagrams Some applications like Microsoft Visio are specifically designed to help you create a wide range of complex schematic diagrams easily However almost any computer application that has a drawing tool can be used to produce a schematic diagram and the process will usually involve the following steps 1) Design the diagram
a Identify your target audience b Collect all the information you need c Arrange your information in a logical order d Test your diagram
2) Create the diagram in the computer application
a Open the drawing window b Draw the shapes you want c Arrange the shapes according to your design d Add connectors between each of the shapes e Add text where required
Designing effective diagrams The main purpose of a schematic diagram is to provide a clear and easy to understand visual overview of how the different parts of a system fit together Schematic diagrams that are well-designed
are as simple as possible
are easy for the target audience to understand
include all relevant elements or parts of the process
have clear and logical connections between elements
communicate an accurate picture of the system or process
Foundation Computing
Basic Schematic Diagrams 5957docx Page 18
Identifying the target audience The target audience is the group of people who will read your schematic diagram The main question you need to ask yourself is Who is my audience In order to identify the target audience for your schematic diagram think about the following
What sort of person will read your diagram Think about that personrsquos job age education language environment and other characteristics that could affect the sort of language and symbols they will understand and relate to
What information will that person look for Why are they reading your diagram What do they want or need to know What information is most important What information is not so important
How much time will that person have to look at your diagram Will they be in a hurry or will they have time to study all the details Does your diagram have to stand alone or will it have a lot of text next to it to explain it
What do you want your audience to learn or do as a result of reading your diagram
What does the diagram need to show What information do you have to include How should this information be arranged
Foundation Computing
Basic Schematic Diagrams 5957docx Page 19
Exercise Complete the table below with information about the target audience and purpose for each of the examples of schematic diagrams given Use the questions above to help you
Example diagram Target audience
You work as an electrician and Mr Jones has asked you to design an electrical wiring plan for the dream house he wants to build
You are a computer programmer and you are using a flowchart to plan a computer program that farmers can use to keep count of their sheep
You have to write an essay about your most embarrassing childhood experience and you create a mindmap to organise your ideas
You are researching your family history and have been asked to create a family tree diagram for a booklet that will be handed out at an upcoming family reunion
Foundation Computing
Basic Schematic Diagrams 5957docx Page 20
Suggested Answer Complete the table below with information about the target audience and purpose for each of the examples of schematic diagrams given Use the questions above to help you
Example diagram Target audience
You work as an electrician and Mr Jones has asked you to design an electrical wiring plan for the dream house he wants to build
Mr Jones his builder local council officials theyrsquoll need detailed information that will be studied in depth and referred to during the planning and building process
You are a computer programmer and you are using a flowchart to plan a computer program that farmers can use to keep count of their sheep
You and other computer programmers will use the flowchart to understand the process of the programme and to identify flaws in its logic
You have to write an essay about your most embarrassing childhood experience and you create a mindmap to organise your ideas
You are the only person who will use your mindmap and you will refer to it as you write your essay
You are researching your family history and have been asked to create a family tree diagram for a booklet that will be handed out at an upcoming family reunion
Members of your family will look for their names and those of relatives in order to see how people are related to each other
Foundation Computing
Basic Schematic Diagrams 5957docx Page 21
TOPIC 2 Identifying the computer application required There are many computer applications that can be used to create schematic diagrams Microsoft Visio is specifically designed for this purpose but any application with basic drawing tools such as those found in Microsoft Word can be used One of the simplest and most widely available computer drawing applications is Microsoft Paint We will use this application is used to demonstrate the tools However most of the tools and principles we will focus on in Microsoft Paint can be found in other drawing applications The following diagram shows the Microsoft Paint window
The tools are arranged to the left of the drawing area in the Tool bar An overview of how to use the tools you need to create a simple schematic diagram is provided below Underneath the Tool bar is the Options box When you click on a tool icon in the Tool bar the options available for that tool appear in the Options box To select an option click on the tool you want to use then click on the option and then click in the drawing area and drag the mouse pointer to draw The Colour palette is underneath the drawing area To use a colour click on the tool you want to use then click on the colour and then click in the drawing area ndash the shape line or text you create will appear in the colour you have selected
Foundation Computing
Basic Schematic Diagrams 5957docx Page 22
Tools Selection Tools Use the selection tools to select the parts of your schematic diagram that you want to work with or change in some way To use these tools click on the button of the tool you want and then click on your diagram and drag until the area you want to work with is selected The Freeform Select tool (on the left) is used to select an irregularly shaped area The Rectangle Select tool is used to select a rectangular area To copy a part of your diagram eg a shape line or text it must first be selected using a selection tool Select Copy from the Edit menu click where you want the copy to be positioned and select Paste from the Edit menu Shapes tools
The shapes tools which can be used to create symbols in schematic diagrams consist of the Rectangle tool for creating squares or rectangles the Polygon tool for creating multi-sided shapes the Rounded Rectangle tool for creating rounded rectangles and the Oval tool for creating circles or ovals These tools provide templates for creating frequently used symbols To use them simply click on the icon of the shape you want to use and drag it onto your diagram where you can resize it if necessary and add text or
Foundation Computing
Basic Schematic Diagrams 5957docx Page 23
effects For the Polygon tool click and drag to draw the first side and click each time you want to change direction Double-click when you have finished To create a perfect circle hold down the Shift key while you are dragging the mouse pointer
Line tools In schematic diagrams line tools can be used to draw connectors between symbols and to draw shapes or symbols
The Straight Line tool creates straight lines simply click on the Straight Line icon click in your picture where you want the line to start and drag to where you want the line to finish The Curve tool will create a curve with at least one and no more than two bends in it click on the Curve icon then click in your picture to draw a straight line and drag to where you want the first bend to be click again where you want the second curve to be and drag to shape the curve You can make more complex shapes by joining lines and curves together
The Pencil tool can be used to draw freeform shapes or lines with as many bends and curves as you want Click on the icon click in your diagram and ldquodrawrdquo with your mouse pointer To draw straight lines hold down the shift key as you are drawing with the mouse
Foundation Computing
Basic Schematic Diagrams 5957docx Page 24
The Paint Brush tool draws freeform lines in the same way as the Pencil tool but can be used to create lines of varying widths and styles To select a paintbrush style click on the Paint Brush icon and then click in the Options box on the style you want to use
The Airbrush tool creates lines with an airbrushed effect of clustered dots It can be used in the same way as the pencil tool to draw freeform shapes or symbols In the Options box you can choose the size of the area covered by the Airbrush tool
Text tool
Add text to your schematic diagram by clicking on the Text icon and clicking in your diagram where you want the text to appear As you drag a rectangle will be formed within which text can be typed The Fonts dialogue box will also open
Foundation Computing
Basic Schematic Diagrams 5957docx Page 25
Fill Tool
The Fill tool will add colour to a shape that you have drawn Click on the icon click on a colour from the colour palette and then click on the shape in the diagram that you want to fill with colour
Zoom tool
Use the Zoom tool to magnify a section of the diagram that you are working with Click on the magnifying glass icon select the size you want in the Options box and click on the part of the image you want to enlarge As the picture zooms in the cursor will change back to the tool you were using before
Adding colour
The Colour box to the left of the Colour palette shows the foreground and background colours you are using If you click on a tool and then drag while holding down the left mouse button the line or shape will be drawn using the foreground colour If you hold down the right mouse button the background colour will be used To use any other colour click on the tool you want to use click on an option (if using) then click on the colour you want from the colour palette As you draw the colour you have clicked on will be used
Foundation Computing
Basic Schematic Diagrams 5957docx Page 26
Additional resources For more detailed information about these tools refer to the Help menu in Microsoft Paint (httpwindowshelpmicrosoftcom )
The following online tutorials may also be useful
httplkwdplorgclassesMSPaintpainthtml
httpwwwlesleyedufacultyahuntMSPttutrhtm
Exercise The example below shows a simple organisation chart produced using Microsoft Paint In the space that follows identify which tools were used to create this schematic diagram and what each tool was used for
Rectangle tool used to create Manager symbol
Oval tool used to create Team Leader symbols
Rounded Rectangle tool used for Team member symbols
Straight line tool used to create connectors
Text tool used to add text to shapes
Rectangle Select tool used to select shapes to move into
position
Foundation Computing
Basic Schematic Diagrams 5957docx Page 27
Suggested Answer The example below shows a simple organisation chart produced using Microsoft Paint In the space that follows identify which tools were used to create this schematic diagram and what each tool was used for
Rectangle tool used to create Manager symbol
Oval tool used to create Team Leader symbols
Rounded Rectangle tool used for Team member symbols
Straight line tool used to create connectors
Text tool used to add text to shapes
Rectangle Select tool used to select shapes to move into position
Foundation Computing
Basic Schematic Diagrams 5957docx Page 28
Exercise Which tools would you use to produce the following symbols or diagrams and why
Symbol Tools and justification
Resistor (Electrical circuit diagram)
Speaker (Electrical circuit diagram)
AC
AC source (Electrical circuit diagram)
Start or end of process (Flowchart)
Decision (yes or no) (Flowchart)
Instructions or actions (Flowchart)
Foundation Computing
Basic Schematic Diagrams 5957docx Page 29
Symbol Tools and justification
Document produced (Flowchart)
Data entered or received (Flowchart)
Foundation Computing
Basic Schematic Diagrams 5957docx Page 30
Suggested Answers Which tools would you use to produce the following symbols or diagrams and why
Symbol Tools and justification
Resistor (Electrical circuit diagram)
Straight line tool (hold down shift key)It creates regular 45 degree angled lines that are perfectly straight
Speaker (Electrical circuit diagram)
Polygon tool (hold down shift key) Rectangle tool and Straight line tool These are used in order to create a symbol with uniform angles and straight edges
AC
AC source (Electrical circuit diagram)
Oval tool (hold down shift key) to draw circle Curve tool to draw wavy line Straight line tool and Text tool These tools produce cleaner shapes than drawing freeform
Start or end of process (Flowchart)
Rounded rectangle tool This provides a template for creating this symbol
Decision (yes or no) (Flowchart)
Polygon tool This creates more accurate joins between sides than the Straight line tool
Instructions or actions (Flowchart)
Rectangle tool It provides a template for drawing this shape
Foundation Computing
Basic Schematic Diagrams 5957docx Page 31
Symbol Tools and justification
Document produced (Flowchart)
Line tool and Curve tool ndash need two tools in MSPaint other applications may have a template for this shape
Data entered or received (Flowchart)
Polygon tool ndash better than Straight line tool because can produce more regular shape
Foundation Computing
Basic Schematic Diagrams 5957docx Page 32
TOPIC 3 Getting started with MS Paint Sourced from httpwindowsmicrosoftcomen-NZwindows7Getting-started-with-Paint MS Paint is a feature in Windows that you can use to draw colour and edit pictures You can use Paint like a digital sketchpad to make simple pictures creative projects or to add text and designs to other pictures such as those taken with your digital camera The parts of Paint Open Paint by clicking the Start button clicking All Programs clicking Accessories and then clicking Paint When you start Paint youll see an empty window drawing and painting tools are located in the ribbon at the top of the window The following illustration shows the different parts of the Paint window
The Paint window
Foundation Computing
Basic Schematic Diagrams 5957docx Page 33
Working with tools The ribbon in Paint includes a handy collection of drawing tools You can use these tools to create freehand drawings and add a variety of shapes to your pictures This section describes some common tasks For more detailed information on how to use the different tools in Paint see Using Paint Draw a line Some tools and shapes such as the Pencil Brush Line and Curve let you make a variety of straight curved and squiggly lines What you draw is determined by how you move the mouse as you draw You can use the Line to draw a straight line for example
1) On the Home tab in the Shapes group click the Line 2) In the Colors group click Color 1 and then click the color you want to use 3) To draw drag the pointer across the drawing area
Draw a squiggly line Your drawings dont have to be composed of only straight lines The Pencil and Brushes can be used to make completely random free-form shapes
1) On the Home tab in the Tools group click the Pencil tool 2) In the Colors group click Color 1 and then click the color you want to use 3) To draw drag the pointer across the drawing area and make a squiggly line
Note If you want to make a line that has a different appearance use one of the Brushes instead Draw a shape Paint lets you draw many different shapes For example you can draw ready-made defined shapes such as rectangles circles squares triangles and arrows (to name a
few) You can also make your own custom shape by using the Polygon shape to draw a polygon which is a shape that can have any number of sides
1) On the Home tab in the Shapes group click a ready-made shape such as the
Rectangle 2) To add a ready-made shape drag the pointer across the drawing area to make
the shape 3) To change the outline style in the Shapes group click Outline and then click an
outline style 4) If you dont want your shape to have an outline click No outline 5) In the Colors group click Color 1 and then click a color for the outline 6) In the Colors group click Color 2 and then click a color to use to fill the shape 7) To change the fill style in the Shapes group click Fill and then click a fill style 8) If you dont want your shape to be filled click No fill
Foundation Computing
Basic Schematic Diagrams 5957docx Page 34
Add text You can also add text to your picture The Text tool lets you add a simple message or title
1) On the Home tab in the Tools group click the Text tool 2) Drag the pointer in the drawing area where you want to add text 3) Under Text Tools on the Text tab click the font face size and style in the Font
group The Font group
4) In the Colors group click Color 1 and then click a color This is the text color 5) Type the text that you want to add
Erase part of your picture If you make a mistake or need to change part of a picture use the eraser By default the eraser changes any area you erase to white but you can change the eraser color For example if you set the background color to yellow anything you erase turns to yellow
1) On the Home tab in the Tools group click the Eraser tool 2) In the Colors group click Color 2 and then click the color that you want to erase
with If you want to erase with white you dont have to select a color 3) Drag the pointer over the area you want to erase
Saving a picture Save your picture frequently so you dont accidentally lose your work To save click the
Paint button and then click Save This saves all of the changes made to the picture since the last time you saved The very first time that you save a new picture you will need to give your picture a file name Follow these steps
1) Click the Paint button and then click Save 2) In the Save as type box select the file format you want 3) In the File name box type a name and then click Save
Foundation Computing
Basic Schematic Diagrams 5957docx Page 35
Topic 4 Designing your diagram Although there are many different types of schematic diagrams the basic process and principles involved in designing a clear and coherent diagram are similar The principles apply to designing an electrical circuit diagram an organisation chart a mind map a flow chart and many other diagrams Some of these principles are also worth applying to other disciplines such as designing a Web page Letrsquos work step-by-step through the process of creating a flow chart to help people make money selling things on an on-line auction site such as wwwtrademeconz or wwwebaycom
Step 1 Gather your information Start by brainstorming all the information you need to include in your diagram Write down everything you think might be important or should be included
trademe
choose things that
sell
good photograph
feedback
keep track
prompt answers
postage
auction length
similar listings
postal system
setting reserve
describing item
correct category
re-listing
fixed offers
Look at the information you have gathered and think about your target audience Highlight the information that is most important to your target audience Cross out any irrelevant information Put question marks next to information that you are unsure about or may be able to leave out
Foundation Computing
Basic Schematic Diagrams 5957docx Page 36
Step 2 Organise your information Take the information that you have left and sort through it How you organise your information will depend on the type of diagram you are designing For example an organisationrsquos chart usually has different levels and shows who its members report to so you might group people by department and by level A flow chart like the example wersquore creating usually shows a process Information is grouped in the order we would use it If any other steps or information occurs to you as you are organising your information add them in Herersquos an example of how the key steps involved in selling on trademe could be ordered
Choose items that sell
Look at similar listings
Decide on a reserve price
Take a clear photograph
Identify your target audience
Write a clear description
Upload your item
Choose the correct category
Monitor watchers bids and views
Lower your reserve
Fixed price offers
Relist
Step 3 Make connections Once the elements are grouped or arranged in a logical order a clearer picture of the process or system you are representing in your diagram should start to emerge However unlike a list which usually reads from top to bottom only a diagram can show connections in many different directions and working out the links between elements is an essential part of designing a coherent diagram At this stage of the design process it is helpful to sketch out a basic plan of the elements you want to include and the flow-lines or connections between them In order to work out the connections between the elements ask questions such as What happens ifhellip What do I do beforeafter this What decisions need to be made now What actions need to be taken Use arrows to show connections between elements group elements that are part of the same stage or level of the process next to or near to each other and use shapes to show which elements are similar to each other eg diamonds for decisions rectangles for instructions or actions Make up your own meanings for shapes if necessary but be sure to use them consistently
Foundation Computing
Basic Schematic Diagrams 5957docx Page 37
The flow chart below shows how our list of elements above changes and gets re-ordered as we ask these questions and organise the information into a logical and coherent diagram
Decide on your
reserve price
START
Relist
Take a photo that is
clear and item looks
good
Decide on your
ideal buyer
Write a description
of your item
highlighting its
benefits for your
buyer
Upload your item in
a category your
buyer is likely to be
looking in
Monitor how many
views watchers and
bids your item gets
Lower your reserve
Item meets reserve
and sellsItem doesnrsquot sell
Offer to watchers for
your reserve
Decide what you
want to sell
Check what similar
items are currently
selling for
Lots of views but
no watchers
No interestFINISH
Foundation Computing
Basic Schematic Diagrams 5957docx Page 38
Step 4 Test your diagram The final step in designing your diagram is checking that it is as effective as possible To do this you should work through each stage step by step challenging it as you go Picture the process in your mind as you follow the links checking that you have included all the actions and decisions required that they are in the correct order and that no steps are duplicated Once yoursquore confident that the diagram is correct look at it again critically to see if you can improve it or clarify it Is there anywhere you can simplify it by removing unnecessary steps Is there anywhere that seems vague and would be easier to understand if you added a step or a connector Now imagine that you are a member of your target audience For a moment try to forget everything you know about the system or process you have designed a diagram for except for what your target audience knows Look at the diagram with fresh eyes does it make sense to you now Does anything seem odd confusing or out of place Finally look at the layout of your diagram Is it easy to read and follow Have you used shapes texts and arrows consistently Are your shapes and texts uniform and lined up properly Are your connectors clearly defined or are they criss-crossing all over each other Check the spelling of labels carefully ndash go through letter by letter to make sure all names and technical or unfamiliar terms are correct
Discussion With a partner look critically at our example diagram above Discuss any parts of it that you think could be better and any changes you would make to improve the readability of the flow chart Make note on the flow chart above of any areas that you think could be improved Share your answers with the rest of the class
Foundation Computing
Basic Schematic Diagrams 5957docx Page 39
Self Test 1) Mr Biggles owns Biggles Air Supplies a company that makes aircraft supplies He asks you to create an organisation chart for his company He gives you the following list of all his employees and who they report to
Mr James Biggles Chief Executive Officer
Jane Doep Personal Assistant to CEO
Mrs Monica Stepworth Financial Manager (reports to CEO)
Judith Zantes Accountant (reports to Financial Manager)
Mary Smallville Accountant (reports to Financial Manager)
Janey Poretuna Admin Assistant (reports to Judith Zantes)
Mickey Laluevu IT technician (reports to Financial Manager)
Mr Hank Johnson Operations Manager (reports to CEO)
Frank Hapil Engineering Manager (reports to Operations Manager)
Joe Smither Engineering Supervisor (reports to Engineering Manager)
Howie Fartherton Engineering Technician (reports to Engineering Supervisor)
Ernie Jusef Engineering Technician (reports to Engineering Supervisor)
Rob Luxemburg Apprentice Technician (reports to Ernie Jusef)
Harry Monahan Interiors Manager (reports to Operations Manager)
Barney Jokka Interiors Technician (reports to Interiors Supervisor) Design an organisation chart for Biggles Air Supplies and draw it in the space below
2) Think of a simple process that has at least five steps and involves some form of feedback or choice For example operating a vending machine topping up your mobile phone using EFTPOS checking messages on an answering machine
Design a flow chart to represent your process
Foundation Computing
Basic Schematic Diagrams 5957docx Page 40
Self Test Answers
1) Mr Biggles owns Biggles Air Supplies a company that makes aircraft supplies He asks you to create an organisation chart for his company He gives you the following list of all his employees and who they report to
Mr James Biggles Chief Executive Officer
Jane Doep Personal Assistant to CEO
Mrs Monica Stepworth Financial Manager (reports to CEO)
Judith Zantes Accountant (reports to Financial Manager)
Mary Smallville Accountant (reports to Financial Manager)
Janey Poretuna Admin Assistant (reports to Judith Zantes)
Mickey Laluevu IT technician (reports to Financial Manager)
Mr Hank Johnson Operations Manager (reports to CEO)
Frank Hapil Engineering Manager (reports to Operations Manager)
Joe Smither Engineering Supervisor (reports to Engineering Manager)
Howie Fartherton Engineering Technician (reports to Engineering Supervisor)
Ernie Jusef Engineering Technician (reports to Engineering Supervisor)
Rob Luxemburg Apprentice Technician (reports to Ernie Jusef)
Harry Monahan Interiors Manager (reports to Operations Manager)
Barney Jokka Interiors Technician (reports to Interiors Supervisor) Design an organisation chart for Biggles Air Supplies and draw it in the space below
Mr James Biggles
CEO
Jane Doep
Personal
Assistant
Mrs Monica Stepworth
Financial Manager
Judith Zantes
Accountant
Janey Poretuna
Admin Assistant
Mary Smallville
Accountant
Mickey Laluevu
IT technician
Mr Hank Johnson
Operations Manager
Frank Hapil
Engineering
Manager
Harry Monahan
Interiors Manager
Joe Smither
Engineering
Supervisor
Howie Fartherton
Engineering
Technician
Ernie Jusef
Engineering
Technician
Rob Luxemburg
Apprentice
Technician
Barney Jokka
Interiors
Technician
Foundation Computing
Basic Schematic Diagrams 5957docx Page 41
2) Think of a simple process that has at least five steps and involves some form of feedback or choice For example operating a vending machine topping up your mobile phone using EFTPOS checking messages on an answering machine
Design a flow chart to represent your process
Dial 06345
Enter your dialing code and
phone number followed by
the key
Dial number for
service you require
Listen to saved messagesListen to new messages
Dial number for
service you require
Save message Delete message
START
FINISH
Dial 2
Dial 1
Dial 1
Dial 2
Dial 1
Dial 2
Foundation Computing
Basic Schematic Diagrams 5957docx Page 42
Foundation Computing
Basic Schematic Diagrams 5957docx Page 43
Part 2
Produce schematic diagrams from a given brief using a computer application
OBJECTIVES
On successful completion of this section you will be able to Produce schematic diagrams from a given brief using a computer application
Performance criteria
21 The symbols used in each diagram are consistent with the type of diagram and the specifications of the brief
22 The final diagram is readable clearly illustrates the object being diagrammed
and is consistent with the specifications of the brief
TOPICS
Topic 1 Symbols used are consistent with diagram type and specifications Topic 2 Diagram is clear readable and consistent with specifications
Self Test
Self Test Answers
Foundation Computing
Basic Schematic Diagrams 5957docx Page 44
TOPIC 1 Symbols used are consistent with diagram type and specifications A symbol is something such as an object picture written word sound or particular mark that represents something else by association resemblance or convention For example a red octagon may be a symbol for STOP On maps crossed sabres may indicate a battlefield Numerals are symbols for numbers All language consists of symbols The word cat is not a cat but is an arbitrary symbol representing the idea of a cat There are many symbols for many things Examples range from Peace Pipe Red Cross to Electrical symbols It is good when doing schematic drawings to use symbols that are clearly recognised and interpreted Symbols that have been internationally standardised are the best Circuit diagram symbols have differed from country to country and have changed over time They are now to a large extent internationally standardized Simple components often had symbols intended to represent some feature of the physical construction of the device There are several national and international standards for graphical symbols in circuit diagrams in particular
IEC 60617 (also known as British Standard BS 3939)
ANSI standard Y32 (also known as IEEE Std 315) IEC 60617 originally consisted of 13 parts from resistors and capacitors to logic symbols and even a generalised drawing standard of connections and bus line widths It is now published as a subscription online database IEC 60617-DB Different symbols may be used depending on the discipline using the drawing for example lighting and power symbols used as part of architectural drawings may be different from symbols for devices used in electronics Different electronic components have different characteristics it is necessary to distinguish between them in any circuit diagram Of course we could use the block diagram approach and just identify each component with words Unfortunately this takes up a lot of space and makes the overall diagram harder to recognize or understand quickly We need a way to understand electrical diagrams far more quickly and easily
Foundation Computing
Basic Schematic Diagrams 5957docx Page 45
The answer is to use schematic symbols to represent electronic components as shown in the diagram below In this diagram we show the schematic symbol of a battery as the electrical source and the symbol of a resistor as the load Even without the words and arrows the symbols define exactly what this circuit is and how it behaves
Some good procedures to follow with symbols include
Using templates for frequently used symbols
Use symbols consistently
Use a library of symbols such as from IEC 60617-DB
Foundation Computing
Basic Schematic Diagrams 5957docx Page 46
TOPIC 2 Diagram is clear readable and consistent with specifications Creating a simple diagram using MSPaint To start with letrsquos create a simple flow chart representing the stages in designing a schematic diagram There are four stages in this process
1) Gather your information 2) Organise your information 3) Make connections 4) Test your diagram
Our flow chart will consist of four rectangles arranged vertically with downward pointing arrows as connectors A rounded rectangle at the top and at the bottom of the flowchart will indicate START and FINISH respectively Step by step
Open Microsoft Paint
Click on the Rectangle tool then click and drag in the drawing area to draw a rectangle
Repeat this step to draw four boxes in the drawing area OR click on the Select tool and click and drag to select the first rectangle then right-click to copy and paste three more rectangles the same size in the drawing area
Foundation Computing
Basic Schematic Diagrams 5957docx Page 47
Using the Rounded Rectangle tool draw a rounded rectangle at the top and bottom of your flow chart
Foundation Computing
Basic Schematic Diagrams 5957docx Page 48
Use the Line tool to draw arrows between each box In the Options area under the Tool bar you can choose the thickness of line that you want to use Remember too that if you hold down the Shift key on the keyboard while you are drawing a line you can create a 45 degree angle
Use the Text tool to add text to the shapes by clicking on the Text tool clicking and dragging to create a textbox inside your shape then typing your text Check your spelling carefully letter by letter as you go
Foundation Computing
Basic Schematic Diagrams 5957docx Page 49
The basic flowchart created in Microsoft Paint could look something like this
Foundation Computing
Basic Schematic Diagrams 5957docx Page 50
Common problems with diagrams Even well-designed schematic diagrams will be difficult for the target audience to read and understand if symbols are used inconsistently or the layout of the diagram is unfamiliar For example if a flowchart has different shapes used for each element and different types of arrows used randomly it will be more difficult for readers to see the overall direction and meaning of the diagram If the shapes on an organisation chart are different sizes and randomly positioned with no clear levels or hierarchy the diagram will not provide a clear overview of the organisationrsquos structure If an electrical circuit diagram has unfamiliar symbols used for elements such as switches resistors and batteries then it will not make sense to its intended audience
Tips for improving the readability of your schematic diagrams
Use symbols and shapes consistently ie elements that are similar should have the same symbol or shape
Avoid having connectors crossing over each other
Avoid having symbols or shapes overlapping
Use arrows on connectors or flow lines to indicate direction
Use colours text size and font consistently
Diagrams that can be read top-to-bottom and left-to-right are easier to read
In a process diagram have only one connector leading into a symbol but have more coming out where necessary to indicate different directions or decisions
Diagrams for a technical audience such as electrical or computer programming schematics should follow accepted conventions for symbols and layout
Diagrams indicating a hierarchy of positions ideas or stages are clearer if elements belonging to the same level are a similar shape size and position on the page
Keep labels as clear and as brief as possible Carefully check the spelling of all names and labels letter by letter ndash errors in the spelling of names or scientific and technical terms look unprofessional and can be confusing for readers
Foundation Computing
Basic Schematic Diagrams 5957docx Page 51
Self Test Look at the schematic diagrams that follow Make notes under each example of what is wrong with the diagram what is right about the diagram and what could be changed to make it clear and meaningful to its intended audience 1) This flow chart is supposed to show police officers how to get a suspect to confess to a crime
START
Confidently accuse
suspect of crime
Describe a
scenario that
enables suspect
to admit guiltAllow suspect to
voice objections
Invade suspectrsquos
personal space
Suspect becomes
uncomfortable
Suspect
doesnrsquot
deny guilt
Suspect
denies guilt
No reaction
Elicit confession
Rephrase objections as
confessions
FINISH
Foundation Computing
Basic Schematic Diagrams 5957docx Page 52
2) The following diagram is an organisation chart for Widget Enterprises
John Smith
MANAGER
Seth Drew
IT MANAGER
May Furur
SECRETARY
Judith Holland
CUSTOMER SERVICES manager
Jad Ling
HELPDESK
Harry Petal
FINANCIAL MANAGER
Wanda Springer
MARKETING
MANAGER
Bob Smithells
CLEANER
Kelly Inlerl
MARKETING ASSISTANT
Beryl Thin
CUSTOMER SERVICES ASSISTANTValda Rigley
CUSTOMER
SERVICES
ASSISTANT
Levi Quayle
COMPUTER
TECHNICIAN
3) Which of the following computer applications can be used to create schematic diagrams
a) Microsoft Visio
b) Microsoft Paint
c) Microsoft Word
d) All of the above
4) Which frequently used shapes does the Microsoft Paint Tool bar contain templates for
5) Where in the Microsoft Paint window would you be able to select the thickness of line that you wanted for a brushstroke 6) Identify the purpose and intended audience for a diagram showing a businessrsquos marketing plan 7) Name two characteristics of well-designed schematic diagrams 8) Identify four steps involved in designing schematic diagrams 9) Why is it important to use conventionally accepted and familiar shapes and symbols in your schematic diagrams
Foundation Computing
Basic Schematic Diagrams 5957docx Page 53
Self Test Answers 1) This flow chart is supposed to show police officers how to get a suspect to confess to a crime
START
Confidently accuse
suspect of crime
Describe a
scenario that
enables suspect
to admit guiltAllow suspect to
voice objections
Invade suspectrsquos
personal space
Suspect becomes
uncomfortable
Suspect
doesnrsquot
deny guilt
Suspect
denies guilt
No reaction
Elicit confession
Rephrase objections as
confessions
FINISH
Random shapes are meaningless and confusing ndash use conventional flow chart symbols
Stages of process are not clear ndash arrange shapes top to bottom with options at each stage branching off to side at same level
Connectors that are either straight or curved would be more consistent
Labels are clear
Text uses consistent font and size
Foundation Computing
Basic Schematic Diagrams 5957docx Page 54
2) The following diagram is an organisation chart for Widget Enterprises
John Smith
MANAGER
Seth Drew
IT MANAGER
May Furur
SECRETARY
Judith Holland
CUSTOMER SERVICES manager
Jad Ling
HELPDESK
Harry Petal
FINANCIAL MANAGER
Wanda Springer
MARKETING
MANAGER
Bob Smithells
CLEANER
Kelly Inlerl
MARKETING ASSISTANT
Beryl Thin
CUSTOMER SERVICES ASSISTANTValda Rigley
CUSTOMER
SERVICES
ASSISTANT
Levi Quayle
COMPUTER
TECHNICIAN
No clear levels to hierarchy ndash organise so that diagram reads top to bottom and positions at similar level are in same horizontal space
Different sized boxes and borders on some boxes are meaningless ndash need consistent style for similar elements
Connectors cross over each other and boxes overlap ndash arrange space to avoid this
Text size and font is mostly consistent but one typo needs correcting
3) Which of the following computer applications can be used to create schematic diagrams
a) Microsoft Visio
b) Microsoft Paint
c) Microsoft Word
d) All of the above correct
4) Which frequently used shapes does the Microsoft Paint Tool bar contain templates for
Polygon rectangle ovalellipse
Foundation Computing
Basic Schematic Diagrams 5957docx Page 55
5) Where in the Microsoft Paint window would you be able to select the thickness of line that you wanted for a brushstroke
Options area below the Toolbar
6) Identify the purpose and intended audience for a diagram showing a businessrsquos marketing plan
The purpose would be to provide an overview of the businessrsquos marketing strategy Audience could include management and employees of the business especially the Marketing department potential investors shareholders and directors of the business
7) Name two characteristics of well-designed schematic diagrams Any of simple easy for the target audience to understand include all relevant elements or parts of the process clear and logical connections between elements accurate 8) Identify four steps involved in designing schematic diagrams Gather information organise information make connections between elements test your diagram 9) Why is it important to use conventionally accepted and familiar shapes and
symbols in your schematic diagrams So that the diagram will be easily understood by the target audience
Foundation Computing
Basic Schematic Diagrams 5957docx Page 56
References httpwindowsmicrosoftcomen-NZwindows7Getting-started-with-Paint accessed Sat 5th December in Timaru New Zealand httpenwikipediaorgwikiSchematic_diagrams accessed Sat 5th December in Timaru New Zealand httpenwikipediaorgwikiSymbol accessed Sat 5th December in Timaru New Zealand
Foundation Computing
Basic Schematic Diagrams 5957docx Page 7
hanging indent - a paragraph format where the lines are indented a certain distance from the left margin but the first line is indented a negative amount so that the first line hangs over the rest of the left alignment horizontal - side to side left to right as in the sun sets below the horizon in-line graphic - a graphic element embedded in a paragraph as a text character It takes on alignment and other characteristics of the host paragraph indents - Additional space measured from the left and right of a text block or margin Indents can be Left in which all lines in the paragraph are the specified distance from the left margin Right in which all lines in the paragraph are the specified distance from the right margin and First in which the first line of the paragraph is an additional amount from the left margin Note that First can be a negative number up to the positive value of the left indent to form a hanging indent italic - general term used to describe slanted type although strictly italic letterforms vary from the non-italic original kerning - the adjustment of spacing between letter pairs leader - A character most commonly used with tabs to visually connect the text on either side of the tab most common character is the period followed by the underscore Do not confuse with leading leading - the distance from the baseline of one line of text to the baseline of the next usually measured in points line - the property of an object that determines the appearance of the perimeter of the object Lines may be solid a tint or screen patterns or none Line weight is measured in points line length - a function of the width of the text block minus any indents For body copy line length should be in picas 1 to 25 times the size of type in points margin - defined area surrounding a page that separates the trim from the live (printing) area mask - a technique for using the shape of one graphic object to crop or otherwise block out portions of another graphic object master page - a page identified by an L or R in the lower left corner of a document window on which you create elements that will appear consistently throughout the publication paragraph style - see Style sheet pica - a typographic measurement system consisting of 12 points there are 6 picas per inch points - the basic measure of type there are 72 points to the inch or 12 points to the pica point size - a measure of the size of type in points rule - printers term for a line ruler guide - a non-printing line that you drag from either the vertical or horizontal rulers to help you position elements on a page
Foundation Computing
Basic Schematic Diagrams 5957docx Page 8
running head - a line of text often containing the title that is consistent across most or all the pages in a publication running foot - a line of text often containing the folio that is consistent across most or all the pages in a publication sans serif - the class of type faces without serifs Helvetica is an example serif - a line or curved extension projecting from the end of a letter form can be used to distinguish a class of type faces such as Times from sans serif faces such as Helvetica set width - a typographic name for the horizontal scaling of type usually expressed as a percentage Squeeze or stretch might be other words for set width soft returns - in PageMaker holding the Shift key while pressing Return creates a soft return sometimes called a line break or new line but does not start a new paragraph Most often used in conjunction with bullet lists style - a variant of the basic type face such as Italic Bold Strikethrough or Outline Not to be confused with Style Sheets style sheet - essentially a script or shortcut for several text and paragraph formatting choices such as but not limited to indents rules typeface size and styles Style sheets apply to paragraphs at a time rather than individual words and are also sometimes called paragraph styles tab - a non-printing character that affects alignment of text that follows it may be left right center decimal See also leader text block - In PageMaker an object that contains text defined by handles at top bottom left and right Text blocks can be linked and a single story may have many text blocks To view a text block click on text with the Pointer Tool text wrap - the technique of flowing text around graphic elements In PageMaker the options are available under the Element menu tracking - preset letter spacing values trim size - size of the finished page after the excess has been cut away typeface or face - can refer to an entire related named family of type such as Helvetica or Times vertical - up and down top to bottom weight - term referring to the heaviness of a type faces stroke Terms often used are light medium book bold heavy ultra x-height - a value often expressed as a percentage that measures the height of the body of lowercase letters in a type face or in proportion to the upper case letters zero point - the point at which the on-screen vertical and horizontal rulers meet at 0 the position relative to the page is changeable by the user zoom - the act of enlarging or reducing the magnification on screen like moving closer or farther away refer to the View menu option
Foundation Computing
Basic Schematic Diagrams 5957docx Page 9
Part 1 Plan schematic diagrams
from a given brief OBJECTIVES
On successful completion of this section you will be able to Plan schematic diagrams from a given brief Performance criteria
11 The plan identifies the purpose and target audience for the schematic diagram
12 The plan identifies the computer application required to produce the
schematic diagram
TOPICS
Topic 1 Identifying the purpose and the target audience Topic 2 Identifying the computer application required Topic 3 Getting started with MS Paint Topic 4 Designing your diagram
Self Test
Self Test Answers
Foundation Computing
Basic Schematic Diagrams 5957docx Page 10
TOPIC 1 Identifying the purpose and the target audience
Letrsquos define a few terms (both definitions taken from NZQA Unit Standard 5957) A brief is defined as a clear description of both the desirable outcomes sought and the constraints to be met by the solution It contains requirements against which the success or otherwise of the desktop published document can be evaluated The brief can be supplied either as part of the candidatersquos employment (in the case of workplace assessment) or in response to a set task Text graphics and specified page layout will be provided for the task A plan outlines how the requirements of the brief will be realised For this unit standard the plan may be informal and it may be more appropriate to produce evidence of it during task completion rather than prior to starting the task or project Evidence of planning may be oral written andor graphic Accordingly we need to plan schematic diagrams from a given brief There are many ways to achieve our purpose However a) What are schematic diagrams b) What is the purpose for these schematic diagrams c) Who is our target audience
Schematic Diagrams Schematic diagrams are used to show the different parts or elements of a system or process and how they are connected and related to each other Examples of systems include
organisations like your school or
computer networks or
electrical circuits A mind map that you might use to plan an essay is a simple example of a schematic diagram In this case your essay is the system and the different elements are the different facts and ideas and headings that you need to include in your essay Processes can include
instructions for how to do something
software programming or
plans for an event such as a wedding
Foundation Computing
Basic Schematic Diagrams 5957docx Page 11
A schematic is a diagram that represents the elements of a system using abstract graphic symbols rather than realistic pictures A schematic usually omits all details that are not relevant to the information the schematic is intended to convey and may add unrealistic elements that aid comprehension For example
a subway map intended for riders may represent a subway station with a dot the dot doesnt resemble the actual station at all but gives the viewer information without unnecessary visual clutter
A schematic diagram of a chemical process uses symbols to represent the vessels piping valves pumps and other equipment of the system emphasizing their interconnection paths and suppressing physical details
In an electronic circuit diagram the layout of the symbols may not resemble the layout in the physical circuit In the schematic diagram the symbolic elements are arranged to be more easily interpreted by the viewer
A schematic of the Washington Metro The schematic is not drawn to scale distances
between stations are fixed and lines are drawn at 45 and 90-degree angles
Foundation Computing
Basic Schematic Diagrams 5957docx Page 12
In the electrical industry a schematic diagram is often used to describe the design of equipment Schematic diagrams are often used for the maintenance and repair of electronic and electromechanical systems Original schematics were done by hand using standardized templates or pre-printed adhesive symbols but today Electrical CAD software is often used Schematic diagrams are used extensively in repair manuals to help users understand the interconnections of parts and to provide graphical instruction to assist in taking apart and rebuilding mechanical assemblies Many automotive and motorcycle repair manuals devote a significant number of pages to schematic diagrams
Exercise 1 See if you can match each of the names in the box with one of the schematic diagrams below
Flow Chart
Organisation Chart
Electrical circuit
Mind map A)
Marketing Plan
Placement
ProductPromotion
Price
Competitive
weaknesses
Competitive
strengths
New features
Trade shows
Mailings
Advertising
B)
Jeremy Nash
CEO
Adam Jurgensen
Operations
Manager
Aneru Jacobs
Sales and
Marketing
Obed Tambo
District Coodinator
Manaia Pehi
Financial
Manager
Hashim Mohamed
Accountant
Janet Brookes
Personal Assistant
Steven Alleroo
IT Manager
Cindy Wahoo
Technician
Foundation Computing
Basic Schematic Diagrams 5957docx Page 13
C)
120V
480V
U
L
L
U
LOR
RESET
OL
TR2
TR3
VIB
VIB
WTR
MOTOR
BLOWER
PS
LOR
ON-OFF
SS
TR3
START
M
START
RUN
HAND
OFF
REMOTE
LOR
M
REMOTE
MODE
M
PS
TR1
TR2
S
To LOR COIL CIRCUIT
M
MSH
ON-OFF
R
W
TR1
X1
D
C
B
A
4 3 2 1
D
C
B
A
4 3 2 1
D)
Foundation Computing
Basic Schematic Diagrams 5957docx Page 14
Answers A = Mindmap B = Organisation chart C = Electrical circuit diagram D = Flow chart Schematic diagram production Before suitable computer applications were developed schematic diagrams were produced manually using tools such as typewriters stencils stickers or labels and drawing by hand Sometimes it can be quicker to produce simple schematic diagrams by hand or you may not have a computer available or the computer application available might be too complex or take so long to learn that it makes more sense to use manual methods Alternatively you may have a highly complex schematic diagram that is too big to print out on the computer printers available and would not make sense if spread over a number of pages
Exercise 2) In the space below or on a piece of paper describe some situations in which you would choose to use a computer application to produce your schematic diagram and explain why
Exercise 3) Now describe some situations in which you would choose NOT to produce your schematic diagram using a computer application and explain why not
Exercise 4) Working with a partner brainstorm the advantages and disadvantages of producing schematic diagrams with a computer application rather than by hand
Foundation Computing
Basic Schematic Diagrams 5957docx Page 15
Suggested answers to the exercises 2) In the space below describe some situations in which you would choose to use a computer application to produce your schematic diagram and explain why Situations could include (and there are many more)
Preparing a flow chart to send by email to all the members of a team ndash because doing it on computer would allow me to make multiple copies and email them easily
Producing a complex network diagram as part of a report to present ndash because it would look more professional and could be easily changed or updated
Preparing an organisation chart to include in a computerised slideshow - because it could easily be imported
3) Now describe some situations in which you would choose NOT to produce your schematic diagram using a computer application and explain why not
Situations could include
Presenting an organisation diagram or a flow chart to a community organisation as a one-off event if I did not have access to a large-scale printer or projector I would draw or paint the diagram by hand ndash because it would be the simplest way to make it large enough for everyone to see and I would be unlikely to need more copies
In an assessment situation drawing a mind map or brainstorming diagram to organise my ideas before writing an essay or report ndash because it would be quickest
Working with a team to sketch out a plan for a process because it would be quickest and wouldnrsquot rely on being close to a computer
Foundation Computing
Basic Schematic Diagrams 5957docx Page 16
4) Working with a partner brainstorm the advantages and disadvantages of producing schematic diagrams with a computer application rather than by hand
Your results of your brainstorm might look like this (diagram produced using MS Visio)
Using computers AdvantagesDisadvantages
need to learn
application
can take longer
sometimes difficult
to plan
limited options for
layout
frustrating
too many options
incompatible file
types
can store on
computer
can fit more smaller
text
easy to read
can email to people
use templates
easy to change or
update
Can be quick
easy to make
copies
professional looking
import into
computer
documents
Expensive
equipment needed
technical problems
Security
Foundation Computing
Basic Schematic Diagrams 5957docx Page 17
Process for producing schematic diagrams on computer There are many different computer applications that can be used to produce schematic diagrams Some applications like Microsoft Visio are specifically designed to help you create a wide range of complex schematic diagrams easily However almost any computer application that has a drawing tool can be used to produce a schematic diagram and the process will usually involve the following steps 1) Design the diagram
a Identify your target audience b Collect all the information you need c Arrange your information in a logical order d Test your diagram
2) Create the diagram in the computer application
a Open the drawing window b Draw the shapes you want c Arrange the shapes according to your design d Add connectors between each of the shapes e Add text where required
Designing effective diagrams The main purpose of a schematic diagram is to provide a clear and easy to understand visual overview of how the different parts of a system fit together Schematic diagrams that are well-designed
are as simple as possible
are easy for the target audience to understand
include all relevant elements or parts of the process
have clear and logical connections between elements
communicate an accurate picture of the system or process
Foundation Computing
Basic Schematic Diagrams 5957docx Page 18
Identifying the target audience The target audience is the group of people who will read your schematic diagram The main question you need to ask yourself is Who is my audience In order to identify the target audience for your schematic diagram think about the following
What sort of person will read your diagram Think about that personrsquos job age education language environment and other characteristics that could affect the sort of language and symbols they will understand and relate to
What information will that person look for Why are they reading your diagram What do they want or need to know What information is most important What information is not so important
How much time will that person have to look at your diagram Will they be in a hurry or will they have time to study all the details Does your diagram have to stand alone or will it have a lot of text next to it to explain it
What do you want your audience to learn or do as a result of reading your diagram
What does the diagram need to show What information do you have to include How should this information be arranged
Foundation Computing
Basic Schematic Diagrams 5957docx Page 19
Exercise Complete the table below with information about the target audience and purpose for each of the examples of schematic diagrams given Use the questions above to help you
Example diagram Target audience
You work as an electrician and Mr Jones has asked you to design an electrical wiring plan for the dream house he wants to build
You are a computer programmer and you are using a flowchart to plan a computer program that farmers can use to keep count of their sheep
You have to write an essay about your most embarrassing childhood experience and you create a mindmap to organise your ideas
You are researching your family history and have been asked to create a family tree diagram for a booklet that will be handed out at an upcoming family reunion
Foundation Computing
Basic Schematic Diagrams 5957docx Page 20
Suggested Answer Complete the table below with information about the target audience and purpose for each of the examples of schematic diagrams given Use the questions above to help you
Example diagram Target audience
You work as an electrician and Mr Jones has asked you to design an electrical wiring plan for the dream house he wants to build
Mr Jones his builder local council officials theyrsquoll need detailed information that will be studied in depth and referred to during the planning and building process
You are a computer programmer and you are using a flowchart to plan a computer program that farmers can use to keep count of their sheep
You and other computer programmers will use the flowchart to understand the process of the programme and to identify flaws in its logic
You have to write an essay about your most embarrassing childhood experience and you create a mindmap to organise your ideas
You are the only person who will use your mindmap and you will refer to it as you write your essay
You are researching your family history and have been asked to create a family tree diagram for a booklet that will be handed out at an upcoming family reunion
Members of your family will look for their names and those of relatives in order to see how people are related to each other
Foundation Computing
Basic Schematic Diagrams 5957docx Page 21
TOPIC 2 Identifying the computer application required There are many computer applications that can be used to create schematic diagrams Microsoft Visio is specifically designed for this purpose but any application with basic drawing tools such as those found in Microsoft Word can be used One of the simplest and most widely available computer drawing applications is Microsoft Paint We will use this application is used to demonstrate the tools However most of the tools and principles we will focus on in Microsoft Paint can be found in other drawing applications The following diagram shows the Microsoft Paint window
The tools are arranged to the left of the drawing area in the Tool bar An overview of how to use the tools you need to create a simple schematic diagram is provided below Underneath the Tool bar is the Options box When you click on a tool icon in the Tool bar the options available for that tool appear in the Options box To select an option click on the tool you want to use then click on the option and then click in the drawing area and drag the mouse pointer to draw The Colour palette is underneath the drawing area To use a colour click on the tool you want to use then click on the colour and then click in the drawing area ndash the shape line or text you create will appear in the colour you have selected
Foundation Computing
Basic Schematic Diagrams 5957docx Page 22
Tools Selection Tools Use the selection tools to select the parts of your schematic diagram that you want to work with or change in some way To use these tools click on the button of the tool you want and then click on your diagram and drag until the area you want to work with is selected The Freeform Select tool (on the left) is used to select an irregularly shaped area The Rectangle Select tool is used to select a rectangular area To copy a part of your diagram eg a shape line or text it must first be selected using a selection tool Select Copy from the Edit menu click where you want the copy to be positioned and select Paste from the Edit menu Shapes tools
The shapes tools which can be used to create symbols in schematic diagrams consist of the Rectangle tool for creating squares or rectangles the Polygon tool for creating multi-sided shapes the Rounded Rectangle tool for creating rounded rectangles and the Oval tool for creating circles or ovals These tools provide templates for creating frequently used symbols To use them simply click on the icon of the shape you want to use and drag it onto your diagram where you can resize it if necessary and add text or
Foundation Computing
Basic Schematic Diagrams 5957docx Page 23
effects For the Polygon tool click and drag to draw the first side and click each time you want to change direction Double-click when you have finished To create a perfect circle hold down the Shift key while you are dragging the mouse pointer
Line tools In schematic diagrams line tools can be used to draw connectors between symbols and to draw shapes or symbols
The Straight Line tool creates straight lines simply click on the Straight Line icon click in your picture where you want the line to start and drag to where you want the line to finish The Curve tool will create a curve with at least one and no more than two bends in it click on the Curve icon then click in your picture to draw a straight line and drag to where you want the first bend to be click again where you want the second curve to be and drag to shape the curve You can make more complex shapes by joining lines and curves together
The Pencil tool can be used to draw freeform shapes or lines with as many bends and curves as you want Click on the icon click in your diagram and ldquodrawrdquo with your mouse pointer To draw straight lines hold down the shift key as you are drawing with the mouse
Foundation Computing
Basic Schematic Diagrams 5957docx Page 24
The Paint Brush tool draws freeform lines in the same way as the Pencil tool but can be used to create lines of varying widths and styles To select a paintbrush style click on the Paint Brush icon and then click in the Options box on the style you want to use
The Airbrush tool creates lines with an airbrushed effect of clustered dots It can be used in the same way as the pencil tool to draw freeform shapes or symbols In the Options box you can choose the size of the area covered by the Airbrush tool
Text tool
Add text to your schematic diagram by clicking on the Text icon and clicking in your diagram where you want the text to appear As you drag a rectangle will be formed within which text can be typed The Fonts dialogue box will also open
Foundation Computing
Basic Schematic Diagrams 5957docx Page 25
Fill Tool
The Fill tool will add colour to a shape that you have drawn Click on the icon click on a colour from the colour palette and then click on the shape in the diagram that you want to fill with colour
Zoom tool
Use the Zoom tool to magnify a section of the diagram that you are working with Click on the magnifying glass icon select the size you want in the Options box and click on the part of the image you want to enlarge As the picture zooms in the cursor will change back to the tool you were using before
Adding colour
The Colour box to the left of the Colour palette shows the foreground and background colours you are using If you click on a tool and then drag while holding down the left mouse button the line or shape will be drawn using the foreground colour If you hold down the right mouse button the background colour will be used To use any other colour click on the tool you want to use click on an option (if using) then click on the colour you want from the colour palette As you draw the colour you have clicked on will be used
Foundation Computing
Basic Schematic Diagrams 5957docx Page 26
Additional resources For more detailed information about these tools refer to the Help menu in Microsoft Paint (httpwindowshelpmicrosoftcom )
The following online tutorials may also be useful
httplkwdplorgclassesMSPaintpainthtml
httpwwwlesleyedufacultyahuntMSPttutrhtm
Exercise The example below shows a simple organisation chart produced using Microsoft Paint In the space that follows identify which tools were used to create this schematic diagram and what each tool was used for
Rectangle tool used to create Manager symbol
Oval tool used to create Team Leader symbols
Rounded Rectangle tool used for Team member symbols
Straight line tool used to create connectors
Text tool used to add text to shapes
Rectangle Select tool used to select shapes to move into
position
Foundation Computing
Basic Schematic Diagrams 5957docx Page 27
Suggested Answer The example below shows a simple organisation chart produced using Microsoft Paint In the space that follows identify which tools were used to create this schematic diagram and what each tool was used for
Rectangle tool used to create Manager symbol
Oval tool used to create Team Leader symbols
Rounded Rectangle tool used for Team member symbols
Straight line tool used to create connectors
Text tool used to add text to shapes
Rectangle Select tool used to select shapes to move into position
Foundation Computing
Basic Schematic Diagrams 5957docx Page 28
Exercise Which tools would you use to produce the following symbols or diagrams and why
Symbol Tools and justification
Resistor (Electrical circuit diagram)
Speaker (Electrical circuit diagram)
AC
AC source (Electrical circuit diagram)
Start or end of process (Flowchart)
Decision (yes or no) (Flowchart)
Instructions or actions (Flowchart)
Foundation Computing
Basic Schematic Diagrams 5957docx Page 29
Symbol Tools and justification
Document produced (Flowchart)
Data entered or received (Flowchart)
Foundation Computing
Basic Schematic Diagrams 5957docx Page 30
Suggested Answers Which tools would you use to produce the following symbols or diagrams and why
Symbol Tools and justification
Resistor (Electrical circuit diagram)
Straight line tool (hold down shift key)It creates regular 45 degree angled lines that are perfectly straight
Speaker (Electrical circuit diagram)
Polygon tool (hold down shift key) Rectangle tool and Straight line tool These are used in order to create a symbol with uniform angles and straight edges
AC
AC source (Electrical circuit diagram)
Oval tool (hold down shift key) to draw circle Curve tool to draw wavy line Straight line tool and Text tool These tools produce cleaner shapes than drawing freeform
Start or end of process (Flowchart)
Rounded rectangle tool This provides a template for creating this symbol
Decision (yes or no) (Flowchart)
Polygon tool This creates more accurate joins between sides than the Straight line tool
Instructions or actions (Flowchart)
Rectangle tool It provides a template for drawing this shape
Foundation Computing
Basic Schematic Diagrams 5957docx Page 31
Symbol Tools and justification
Document produced (Flowchart)
Line tool and Curve tool ndash need two tools in MSPaint other applications may have a template for this shape
Data entered or received (Flowchart)
Polygon tool ndash better than Straight line tool because can produce more regular shape
Foundation Computing
Basic Schematic Diagrams 5957docx Page 32
TOPIC 3 Getting started with MS Paint Sourced from httpwindowsmicrosoftcomen-NZwindows7Getting-started-with-Paint MS Paint is a feature in Windows that you can use to draw colour and edit pictures You can use Paint like a digital sketchpad to make simple pictures creative projects or to add text and designs to other pictures such as those taken with your digital camera The parts of Paint Open Paint by clicking the Start button clicking All Programs clicking Accessories and then clicking Paint When you start Paint youll see an empty window drawing and painting tools are located in the ribbon at the top of the window The following illustration shows the different parts of the Paint window
The Paint window
Foundation Computing
Basic Schematic Diagrams 5957docx Page 33
Working with tools The ribbon in Paint includes a handy collection of drawing tools You can use these tools to create freehand drawings and add a variety of shapes to your pictures This section describes some common tasks For more detailed information on how to use the different tools in Paint see Using Paint Draw a line Some tools and shapes such as the Pencil Brush Line and Curve let you make a variety of straight curved and squiggly lines What you draw is determined by how you move the mouse as you draw You can use the Line to draw a straight line for example
1) On the Home tab in the Shapes group click the Line 2) In the Colors group click Color 1 and then click the color you want to use 3) To draw drag the pointer across the drawing area
Draw a squiggly line Your drawings dont have to be composed of only straight lines The Pencil and Brushes can be used to make completely random free-form shapes
1) On the Home tab in the Tools group click the Pencil tool 2) In the Colors group click Color 1 and then click the color you want to use 3) To draw drag the pointer across the drawing area and make a squiggly line
Note If you want to make a line that has a different appearance use one of the Brushes instead Draw a shape Paint lets you draw many different shapes For example you can draw ready-made defined shapes such as rectangles circles squares triangles and arrows (to name a
few) You can also make your own custom shape by using the Polygon shape to draw a polygon which is a shape that can have any number of sides
1) On the Home tab in the Shapes group click a ready-made shape such as the
Rectangle 2) To add a ready-made shape drag the pointer across the drawing area to make
the shape 3) To change the outline style in the Shapes group click Outline and then click an
outline style 4) If you dont want your shape to have an outline click No outline 5) In the Colors group click Color 1 and then click a color for the outline 6) In the Colors group click Color 2 and then click a color to use to fill the shape 7) To change the fill style in the Shapes group click Fill and then click a fill style 8) If you dont want your shape to be filled click No fill
Foundation Computing
Basic Schematic Diagrams 5957docx Page 34
Add text You can also add text to your picture The Text tool lets you add a simple message or title
1) On the Home tab in the Tools group click the Text tool 2) Drag the pointer in the drawing area where you want to add text 3) Under Text Tools on the Text tab click the font face size and style in the Font
group The Font group
4) In the Colors group click Color 1 and then click a color This is the text color 5) Type the text that you want to add
Erase part of your picture If you make a mistake or need to change part of a picture use the eraser By default the eraser changes any area you erase to white but you can change the eraser color For example if you set the background color to yellow anything you erase turns to yellow
1) On the Home tab in the Tools group click the Eraser tool 2) In the Colors group click Color 2 and then click the color that you want to erase
with If you want to erase with white you dont have to select a color 3) Drag the pointer over the area you want to erase
Saving a picture Save your picture frequently so you dont accidentally lose your work To save click the
Paint button and then click Save This saves all of the changes made to the picture since the last time you saved The very first time that you save a new picture you will need to give your picture a file name Follow these steps
1) Click the Paint button and then click Save 2) In the Save as type box select the file format you want 3) In the File name box type a name and then click Save
Foundation Computing
Basic Schematic Diagrams 5957docx Page 35
Topic 4 Designing your diagram Although there are many different types of schematic diagrams the basic process and principles involved in designing a clear and coherent diagram are similar The principles apply to designing an electrical circuit diagram an organisation chart a mind map a flow chart and many other diagrams Some of these principles are also worth applying to other disciplines such as designing a Web page Letrsquos work step-by-step through the process of creating a flow chart to help people make money selling things on an on-line auction site such as wwwtrademeconz or wwwebaycom
Step 1 Gather your information Start by brainstorming all the information you need to include in your diagram Write down everything you think might be important or should be included
trademe
choose things that
sell
good photograph
feedback
keep track
prompt answers
postage
auction length
similar listings
postal system
setting reserve
describing item
correct category
re-listing
fixed offers
Look at the information you have gathered and think about your target audience Highlight the information that is most important to your target audience Cross out any irrelevant information Put question marks next to information that you are unsure about or may be able to leave out
Foundation Computing
Basic Schematic Diagrams 5957docx Page 36
Step 2 Organise your information Take the information that you have left and sort through it How you organise your information will depend on the type of diagram you are designing For example an organisationrsquos chart usually has different levels and shows who its members report to so you might group people by department and by level A flow chart like the example wersquore creating usually shows a process Information is grouped in the order we would use it If any other steps or information occurs to you as you are organising your information add them in Herersquos an example of how the key steps involved in selling on trademe could be ordered
Choose items that sell
Look at similar listings
Decide on a reserve price
Take a clear photograph
Identify your target audience
Write a clear description
Upload your item
Choose the correct category
Monitor watchers bids and views
Lower your reserve
Fixed price offers
Relist
Step 3 Make connections Once the elements are grouped or arranged in a logical order a clearer picture of the process or system you are representing in your diagram should start to emerge However unlike a list which usually reads from top to bottom only a diagram can show connections in many different directions and working out the links between elements is an essential part of designing a coherent diagram At this stage of the design process it is helpful to sketch out a basic plan of the elements you want to include and the flow-lines or connections between them In order to work out the connections between the elements ask questions such as What happens ifhellip What do I do beforeafter this What decisions need to be made now What actions need to be taken Use arrows to show connections between elements group elements that are part of the same stage or level of the process next to or near to each other and use shapes to show which elements are similar to each other eg diamonds for decisions rectangles for instructions or actions Make up your own meanings for shapes if necessary but be sure to use them consistently
Foundation Computing
Basic Schematic Diagrams 5957docx Page 37
The flow chart below shows how our list of elements above changes and gets re-ordered as we ask these questions and organise the information into a logical and coherent diagram
Decide on your
reserve price
START
Relist
Take a photo that is
clear and item looks
good
Decide on your
ideal buyer
Write a description
of your item
highlighting its
benefits for your
buyer
Upload your item in
a category your
buyer is likely to be
looking in
Monitor how many
views watchers and
bids your item gets
Lower your reserve
Item meets reserve
and sellsItem doesnrsquot sell
Offer to watchers for
your reserve
Decide what you
want to sell
Check what similar
items are currently
selling for
Lots of views but
no watchers
No interestFINISH
Foundation Computing
Basic Schematic Diagrams 5957docx Page 38
Step 4 Test your diagram The final step in designing your diagram is checking that it is as effective as possible To do this you should work through each stage step by step challenging it as you go Picture the process in your mind as you follow the links checking that you have included all the actions and decisions required that they are in the correct order and that no steps are duplicated Once yoursquore confident that the diagram is correct look at it again critically to see if you can improve it or clarify it Is there anywhere you can simplify it by removing unnecessary steps Is there anywhere that seems vague and would be easier to understand if you added a step or a connector Now imagine that you are a member of your target audience For a moment try to forget everything you know about the system or process you have designed a diagram for except for what your target audience knows Look at the diagram with fresh eyes does it make sense to you now Does anything seem odd confusing or out of place Finally look at the layout of your diagram Is it easy to read and follow Have you used shapes texts and arrows consistently Are your shapes and texts uniform and lined up properly Are your connectors clearly defined or are they criss-crossing all over each other Check the spelling of labels carefully ndash go through letter by letter to make sure all names and technical or unfamiliar terms are correct
Discussion With a partner look critically at our example diagram above Discuss any parts of it that you think could be better and any changes you would make to improve the readability of the flow chart Make note on the flow chart above of any areas that you think could be improved Share your answers with the rest of the class
Foundation Computing
Basic Schematic Diagrams 5957docx Page 39
Self Test 1) Mr Biggles owns Biggles Air Supplies a company that makes aircraft supplies He asks you to create an organisation chart for his company He gives you the following list of all his employees and who they report to
Mr James Biggles Chief Executive Officer
Jane Doep Personal Assistant to CEO
Mrs Monica Stepworth Financial Manager (reports to CEO)
Judith Zantes Accountant (reports to Financial Manager)
Mary Smallville Accountant (reports to Financial Manager)
Janey Poretuna Admin Assistant (reports to Judith Zantes)
Mickey Laluevu IT technician (reports to Financial Manager)
Mr Hank Johnson Operations Manager (reports to CEO)
Frank Hapil Engineering Manager (reports to Operations Manager)
Joe Smither Engineering Supervisor (reports to Engineering Manager)
Howie Fartherton Engineering Technician (reports to Engineering Supervisor)
Ernie Jusef Engineering Technician (reports to Engineering Supervisor)
Rob Luxemburg Apprentice Technician (reports to Ernie Jusef)
Harry Monahan Interiors Manager (reports to Operations Manager)
Barney Jokka Interiors Technician (reports to Interiors Supervisor) Design an organisation chart for Biggles Air Supplies and draw it in the space below
2) Think of a simple process that has at least five steps and involves some form of feedback or choice For example operating a vending machine topping up your mobile phone using EFTPOS checking messages on an answering machine
Design a flow chart to represent your process
Foundation Computing
Basic Schematic Diagrams 5957docx Page 40
Self Test Answers
1) Mr Biggles owns Biggles Air Supplies a company that makes aircraft supplies He asks you to create an organisation chart for his company He gives you the following list of all his employees and who they report to
Mr James Biggles Chief Executive Officer
Jane Doep Personal Assistant to CEO
Mrs Monica Stepworth Financial Manager (reports to CEO)
Judith Zantes Accountant (reports to Financial Manager)
Mary Smallville Accountant (reports to Financial Manager)
Janey Poretuna Admin Assistant (reports to Judith Zantes)
Mickey Laluevu IT technician (reports to Financial Manager)
Mr Hank Johnson Operations Manager (reports to CEO)
Frank Hapil Engineering Manager (reports to Operations Manager)
Joe Smither Engineering Supervisor (reports to Engineering Manager)
Howie Fartherton Engineering Technician (reports to Engineering Supervisor)
Ernie Jusef Engineering Technician (reports to Engineering Supervisor)
Rob Luxemburg Apprentice Technician (reports to Ernie Jusef)
Harry Monahan Interiors Manager (reports to Operations Manager)
Barney Jokka Interiors Technician (reports to Interiors Supervisor) Design an organisation chart for Biggles Air Supplies and draw it in the space below
Mr James Biggles
CEO
Jane Doep
Personal
Assistant
Mrs Monica Stepworth
Financial Manager
Judith Zantes
Accountant
Janey Poretuna
Admin Assistant
Mary Smallville
Accountant
Mickey Laluevu
IT technician
Mr Hank Johnson
Operations Manager
Frank Hapil
Engineering
Manager
Harry Monahan
Interiors Manager
Joe Smither
Engineering
Supervisor
Howie Fartherton
Engineering
Technician
Ernie Jusef
Engineering
Technician
Rob Luxemburg
Apprentice
Technician
Barney Jokka
Interiors
Technician
Foundation Computing
Basic Schematic Diagrams 5957docx Page 41
2) Think of a simple process that has at least five steps and involves some form of feedback or choice For example operating a vending machine topping up your mobile phone using EFTPOS checking messages on an answering machine
Design a flow chart to represent your process
Dial 06345
Enter your dialing code and
phone number followed by
the key
Dial number for
service you require
Listen to saved messagesListen to new messages
Dial number for
service you require
Save message Delete message
START
FINISH
Dial 2
Dial 1
Dial 1
Dial 2
Dial 1
Dial 2
Foundation Computing
Basic Schematic Diagrams 5957docx Page 42
Foundation Computing
Basic Schematic Diagrams 5957docx Page 43
Part 2
Produce schematic diagrams from a given brief using a computer application
OBJECTIVES
On successful completion of this section you will be able to Produce schematic diagrams from a given brief using a computer application
Performance criteria
21 The symbols used in each diagram are consistent with the type of diagram and the specifications of the brief
22 The final diagram is readable clearly illustrates the object being diagrammed
and is consistent with the specifications of the brief
TOPICS
Topic 1 Symbols used are consistent with diagram type and specifications Topic 2 Diagram is clear readable and consistent with specifications
Self Test
Self Test Answers
Foundation Computing
Basic Schematic Diagrams 5957docx Page 44
TOPIC 1 Symbols used are consistent with diagram type and specifications A symbol is something such as an object picture written word sound or particular mark that represents something else by association resemblance or convention For example a red octagon may be a symbol for STOP On maps crossed sabres may indicate a battlefield Numerals are symbols for numbers All language consists of symbols The word cat is not a cat but is an arbitrary symbol representing the idea of a cat There are many symbols for many things Examples range from Peace Pipe Red Cross to Electrical symbols It is good when doing schematic drawings to use symbols that are clearly recognised and interpreted Symbols that have been internationally standardised are the best Circuit diagram symbols have differed from country to country and have changed over time They are now to a large extent internationally standardized Simple components often had symbols intended to represent some feature of the physical construction of the device There are several national and international standards for graphical symbols in circuit diagrams in particular
IEC 60617 (also known as British Standard BS 3939)
ANSI standard Y32 (also known as IEEE Std 315) IEC 60617 originally consisted of 13 parts from resistors and capacitors to logic symbols and even a generalised drawing standard of connections and bus line widths It is now published as a subscription online database IEC 60617-DB Different symbols may be used depending on the discipline using the drawing for example lighting and power symbols used as part of architectural drawings may be different from symbols for devices used in electronics Different electronic components have different characteristics it is necessary to distinguish between them in any circuit diagram Of course we could use the block diagram approach and just identify each component with words Unfortunately this takes up a lot of space and makes the overall diagram harder to recognize or understand quickly We need a way to understand electrical diagrams far more quickly and easily
Foundation Computing
Basic Schematic Diagrams 5957docx Page 45
The answer is to use schematic symbols to represent electronic components as shown in the diagram below In this diagram we show the schematic symbol of a battery as the electrical source and the symbol of a resistor as the load Even without the words and arrows the symbols define exactly what this circuit is and how it behaves
Some good procedures to follow with symbols include
Using templates for frequently used symbols
Use symbols consistently
Use a library of symbols such as from IEC 60617-DB
Foundation Computing
Basic Schematic Diagrams 5957docx Page 46
TOPIC 2 Diagram is clear readable and consistent with specifications Creating a simple diagram using MSPaint To start with letrsquos create a simple flow chart representing the stages in designing a schematic diagram There are four stages in this process
1) Gather your information 2) Organise your information 3) Make connections 4) Test your diagram
Our flow chart will consist of four rectangles arranged vertically with downward pointing arrows as connectors A rounded rectangle at the top and at the bottom of the flowchart will indicate START and FINISH respectively Step by step
Open Microsoft Paint
Click on the Rectangle tool then click and drag in the drawing area to draw a rectangle
Repeat this step to draw four boxes in the drawing area OR click on the Select tool and click and drag to select the first rectangle then right-click to copy and paste three more rectangles the same size in the drawing area
Foundation Computing
Basic Schematic Diagrams 5957docx Page 47
Using the Rounded Rectangle tool draw a rounded rectangle at the top and bottom of your flow chart
Foundation Computing
Basic Schematic Diagrams 5957docx Page 48
Use the Line tool to draw arrows between each box In the Options area under the Tool bar you can choose the thickness of line that you want to use Remember too that if you hold down the Shift key on the keyboard while you are drawing a line you can create a 45 degree angle
Use the Text tool to add text to the shapes by clicking on the Text tool clicking and dragging to create a textbox inside your shape then typing your text Check your spelling carefully letter by letter as you go
Foundation Computing
Basic Schematic Diagrams 5957docx Page 49
The basic flowchart created in Microsoft Paint could look something like this
Foundation Computing
Basic Schematic Diagrams 5957docx Page 50
Common problems with diagrams Even well-designed schematic diagrams will be difficult for the target audience to read and understand if symbols are used inconsistently or the layout of the diagram is unfamiliar For example if a flowchart has different shapes used for each element and different types of arrows used randomly it will be more difficult for readers to see the overall direction and meaning of the diagram If the shapes on an organisation chart are different sizes and randomly positioned with no clear levels or hierarchy the diagram will not provide a clear overview of the organisationrsquos structure If an electrical circuit diagram has unfamiliar symbols used for elements such as switches resistors and batteries then it will not make sense to its intended audience
Tips for improving the readability of your schematic diagrams
Use symbols and shapes consistently ie elements that are similar should have the same symbol or shape
Avoid having connectors crossing over each other
Avoid having symbols or shapes overlapping
Use arrows on connectors or flow lines to indicate direction
Use colours text size and font consistently
Diagrams that can be read top-to-bottom and left-to-right are easier to read
In a process diagram have only one connector leading into a symbol but have more coming out where necessary to indicate different directions or decisions
Diagrams for a technical audience such as electrical or computer programming schematics should follow accepted conventions for symbols and layout
Diagrams indicating a hierarchy of positions ideas or stages are clearer if elements belonging to the same level are a similar shape size and position on the page
Keep labels as clear and as brief as possible Carefully check the spelling of all names and labels letter by letter ndash errors in the spelling of names or scientific and technical terms look unprofessional and can be confusing for readers
Foundation Computing
Basic Schematic Diagrams 5957docx Page 51
Self Test Look at the schematic diagrams that follow Make notes under each example of what is wrong with the diagram what is right about the diagram and what could be changed to make it clear and meaningful to its intended audience 1) This flow chart is supposed to show police officers how to get a suspect to confess to a crime
START
Confidently accuse
suspect of crime
Describe a
scenario that
enables suspect
to admit guiltAllow suspect to
voice objections
Invade suspectrsquos
personal space
Suspect becomes
uncomfortable
Suspect
doesnrsquot
deny guilt
Suspect
denies guilt
No reaction
Elicit confession
Rephrase objections as
confessions
FINISH
Foundation Computing
Basic Schematic Diagrams 5957docx Page 52
2) The following diagram is an organisation chart for Widget Enterprises
John Smith
MANAGER
Seth Drew
IT MANAGER
May Furur
SECRETARY
Judith Holland
CUSTOMER SERVICES manager
Jad Ling
HELPDESK
Harry Petal
FINANCIAL MANAGER
Wanda Springer
MARKETING
MANAGER
Bob Smithells
CLEANER
Kelly Inlerl
MARKETING ASSISTANT
Beryl Thin
CUSTOMER SERVICES ASSISTANTValda Rigley
CUSTOMER
SERVICES
ASSISTANT
Levi Quayle
COMPUTER
TECHNICIAN
3) Which of the following computer applications can be used to create schematic diagrams
a) Microsoft Visio
b) Microsoft Paint
c) Microsoft Word
d) All of the above
4) Which frequently used shapes does the Microsoft Paint Tool bar contain templates for
5) Where in the Microsoft Paint window would you be able to select the thickness of line that you wanted for a brushstroke 6) Identify the purpose and intended audience for a diagram showing a businessrsquos marketing plan 7) Name two characteristics of well-designed schematic diagrams 8) Identify four steps involved in designing schematic diagrams 9) Why is it important to use conventionally accepted and familiar shapes and symbols in your schematic diagrams
Foundation Computing
Basic Schematic Diagrams 5957docx Page 53
Self Test Answers 1) This flow chart is supposed to show police officers how to get a suspect to confess to a crime
START
Confidently accuse
suspect of crime
Describe a
scenario that
enables suspect
to admit guiltAllow suspect to
voice objections
Invade suspectrsquos
personal space
Suspect becomes
uncomfortable
Suspect
doesnrsquot
deny guilt
Suspect
denies guilt
No reaction
Elicit confession
Rephrase objections as
confessions
FINISH
Random shapes are meaningless and confusing ndash use conventional flow chart symbols
Stages of process are not clear ndash arrange shapes top to bottom with options at each stage branching off to side at same level
Connectors that are either straight or curved would be more consistent
Labels are clear
Text uses consistent font and size
Foundation Computing
Basic Schematic Diagrams 5957docx Page 54
2) The following diagram is an organisation chart for Widget Enterprises
John Smith
MANAGER
Seth Drew
IT MANAGER
May Furur
SECRETARY
Judith Holland
CUSTOMER SERVICES manager
Jad Ling
HELPDESK
Harry Petal
FINANCIAL MANAGER
Wanda Springer
MARKETING
MANAGER
Bob Smithells
CLEANER
Kelly Inlerl
MARKETING ASSISTANT
Beryl Thin
CUSTOMER SERVICES ASSISTANTValda Rigley
CUSTOMER
SERVICES
ASSISTANT
Levi Quayle
COMPUTER
TECHNICIAN
No clear levels to hierarchy ndash organise so that diagram reads top to bottom and positions at similar level are in same horizontal space
Different sized boxes and borders on some boxes are meaningless ndash need consistent style for similar elements
Connectors cross over each other and boxes overlap ndash arrange space to avoid this
Text size and font is mostly consistent but one typo needs correcting
3) Which of the following computer applications can be used to create schematic diagrams
a) Microsoft Visio
b) Microsoft Paint
c) Microsoft Word
d) All of the above correct
4) Which frequently used shapes does the Microsoft Paint Tool bar contain templates for
Polygon rectangle ovalellipse
Foundation Computing
Basic Schematic Diagrams 5957docx Page 55
5) Where in the Microsoft Paint window would you be able to select the thickness of line that you wanted for a brushstroke
Options area below the Toolbar
6) Identify the purpose and intended audience for a diagram showing a businessrsquos marketing plan
The purpose would be to provide an overview of the businessrsquos marketing strategy Audience could include management and employees of the business especially the Marketing department potential investors shareholders and directors of the business
7) Name two characteristics of well-designed schematic diagrams Any of simple easy for the target audience to understand include all relevant elements or parts of the process clear and logical connections between elements accurate 8) Identify four steps involved in designing schematic diagrams Gather information organise information make connections between elements test your diagram 9) Why is it important to use conventionally accepted and familiar shapes and
symbols in your schematic diagrams So that the diagram will be easily understood by the target audience
Foundation Computing
Basic Schematic Diagrams 5957docx Page 56
References httpwindowsmicrosoftcomen-NZwindows7Getting-started-with-Paint accessed Sat 5th December in Timaru New Zealand httpenwikipediaorgwikiSchematic_diagrams accessed Sat 5th December in Timaru New Zealand httpenwikipediaorgwikiSymbol accessed Sat 5th December in Timaru New Zealand

Foundation Computing
Basic Schematic Diagrams 5957docx Page 9
Part 1 Plan schematic diagrams
from a given brief OBJECTIVES
On successful completion of this section you will be able to Plan schematic diagrams from a given brief Performance criteria
11 The plan identifies the purpose and target audience for the schematic diagram
12 The plan identifies the computer application required to produce the
schematic diagram
TOPICS
Topic 1 Identifying the purpose and the target audience Topic 2 Identifying the computer application required Topic 3 Getting started with MS Paint Topic 4 Designing your diagram
Self Test
Self Test Answers
Foundation Computing
Basic Schematic Diagrams 5957docx Page 10
TOPIC 1 Identifying the purpose and the target audience
Letrsquos define a few terms (both definitions taken from NZQA Unit Standard 5957) A brief is defined as a clear description of both the desirable outcomes sought and the constraints to be met by the solution It contains requirements against which the success or otherwise of the desktop published document can be evaluated The brief can be supplied either as part of the candidatersquos employment (in the case of workplace assessment) or in response to a set task Text graphics and specified page layout will be provided for the task A plan outlines how the requirements of the brief will be realised For this unit standard the plan may be informal and it may be more appropriate to produce evidence of it during task completion rather than prior to starting the task or project Evidence of planning may be oral written andor graphic Accordingly we need to plan schematic diagrams from a given brief There are many ways to achieve our purpose However a) What are schematic diagrams b) What is the purpose for these schematic diagrams c) Who is our target audience
Schematic Diagrams Schematic diagrams are used to show the different parts or elements of a system or process and how they are connected and related to each other Examples of systems include
organisations like your school or
computer networks or
electrical circuits A mind map that you might use to plan an essay is a simple example of a schematic diagram In this case your essay is the system and the different elements are the different facts and ideas and headings that you need to include in your essay Processes can include
instructions for how to do something
software programming or
plans for an event such as a wedding
Foundation Computing
Basic Schematic Diagrams 5957docx Page 11
A schematic is a diagram that represents the elements of a system using abstract graphic symbols rather than realistic pictures A schematic usually omits all details that are not relevant to the information the schematic is intended to convey and may add unrealistic elements that aid comprehension For example
a subway map intended for riders may represent a subway station with a dot the dot doesnt resemble the actual station at all but gives the viewer information without unnecessary visual clutter
A schematic diagram of a chemical process uses symbols to represent the vessels piping valves pumps and other equipment of the system emphasizing their interconnection paths and suppressing physical details
In an electronic circuit diagram the layout of the symbols may not resemble the layout in the physical circuit In the schematic diagram the symbolic elements are arranged to be more easily interpreted by the viewer
A schematic of the Washington Metro The schematic is not drawn to scale distances
between stations are fixed and lines are drawn at 45 and 90-degree angles
Foundation Computing
Basic Schematic Diagrams 5957docx Page 12
In the electrical industry a schematic diagram is often used to describe the design of equipment Schematic diagrams are often used for the maintenance and repair of electronic and electromechanical systems Original schematics were done by hand using standardized templates or pre-printed adhesive symbols but today Electrical CAD software is often used Schematic diagrams are used extensively in repair manuals to help users understand the interconnections of parts and to provide graphical instruction to assist in taking apart and rebuilding mechanical assemblies Many automotive and motorcycle repair manuals devote a significant number of pages to schematic diagrams
Exercise 1 See if you can match each of the names in the box with one of the schematic diagrams below
Flow Chart
Organisation Chart
Electrical circuit
Mind map A)
Marketing Plan
Placement
ProductPromotion
Price
Competitive
weaknesses
Competitive
strengths
New features
Trade shows
Mailings
Advertising
B)
Jeremy Nash
CEO
Adam Jurgensen
Operations
Manager
Aneru Jacobs
Sales and
Marketing
Obed Tambo
District Coodinator
Manaia Pehi
Financial
Manager
Hashim Mohamed
Accountant
Janet Brookes
Personal Assistant
Steven Alleroo
IT Manager
Cindy Wahoo
Technician
Foundation Computing
Basic Schematic Diagrams 5957docx Page 13
C)
120V
480V
U
L
L
U
LOR
RESET
OL
TR2
TR3
VIB
VIB
WTR
MOTOR
BLOWER
PS
LOR
ON-OFF
SS
TR3
START
M
START
RUN
HAND
OFF
REMOTE
LOR
M
REMOTE
MODE
M
PS
TR1
TR2
S
To LOR COIL CIRCUIT
M
MSH
ON-OFF
R
W
TR1
X1
D
C
B
A
4 3 2 1
D
C
B
A
4 3 2 1
D)
Foundation Computing
Basic Schematic Diagrams 5957docx Page 14
Answers A = Mindmap B = Organisation chart C = Electrical circuit diagram D = Flow chart Schematic diagram production Before suitable computer applications were developed schematic diagrams were produced manually using tools such as typewriters stencils stickers or labels and drawing by hand Sometimes it can be quicker to produce simple schematic diagrams by hand or you may not have a computer available or the computer application available might be too complex or take so long to learn that it makes more sense to use manual methods Alternatively you may have a highly complex schematic diagram that is too big to print out on the computer printers available and would not make sense if spread over a number of pages
Exercise 2) In the space below or on a piece of paper describe some situations in which you would choose to use a computer application to produce your schematic diagram and explain why
Exercise 3) Now describe some situations in which you would choose NOT to produce your schematic diagram using a computer application and explain why not
Exercise 4) Working with a partner brainstorm the advantages and disadvantages of producing schematic diagrams with a computer application rather than by hand
Foundation Computing
Basic Schematic Diagrams 5957docx Page 15
Suggested answers to the exercises 2) In the space below describe some situations in which you would choose to use a computer application to produce your schematic diagram and explain why Situations could include (and there are many more)
Preparing a flow chart to send by email to all the members of a team ndash because doing it on computer would allow me to make multiple copies and email them easily
Producing a complex network diagram as part of a report to present ndash because it would look more professional and could be easily changed or updated
Preparing an organisation chart to include in a computerised slideshow - because it could easily be imported
3) Now describe some situations in which you would choose NOT to produce your schematic diagram using a computer application and explain why not
Situations could include
Presenting an organisation diagram or a flow chart to a community organisation as a one-off event if I did not have access to a large-scale printer or projector I would draw or paint the diagram by hand ndash because it would be the simplest way to make it large enough for everyone to see and I would be unlikely to need more copies
In an assessment situation drawing a mind map or brainstorming diagram to organise my ideas before writing an essay or report ndash because it would be quickest
Working with a team to sketch out a plan for a process because it would be quickest and wouldnrsquot rely on being close to a computer
Foundation Computing
Basic Schematic Diagrams 5957docx Page 16
4) Working with a partner brainstorm the advantages and disadvantages of producing schematic diagrams with a computer application rather than by hand
Your results of your brainstorm might look like this (diagram produced using MS Visio)
Using computers AdvantagesDisadvantages
need to learn
application
can take longer
sometimes difficult
to plan
limited options for
layout
frustrating
too many options
incompatible file
types
can store on
computer
can fit more smaller
text
easy to read
can email to people
use templates
easy to change or
update
Can be quick
easy to make
copies
professional looking
import into
computer
documents
Expensive
equipment needed
technical problems
Security
Foundation Computing
Basic Schematic Diagrams 5957docx Page 17
Process for producing schematic diagrams on computer There are many different computer applications that can be used to produce schematic diagrams Some applications like Microsoft Visio are specifically designed to help you create a wide range of complex schematic diagrams easily However almost any computer application that has a drawing tool can be used to produce a schematic diagram and the process will usually involve the following steps 1) Design the diagram
a Identify your target audience b Collect all the information you need c Arrange your information in a logical order d Test your diagram
2) Create the diagram in the computer application
a Open the drawing window b Draw the shapes you want c Arrange the shapes according to your design d Add connectors between each of the shapes e Add text where required
Designing effective diagrams The main purpose of a schematic diagram is to provide a clear and easy to understand visual overview of how the different parts of a system fit together Schematic diagrams that are well-designed
are as simple as possible
are easy for the target audience to understand
include all relevant elements or parts of the process
have clear and logical connections between elements
communicate an accurate picture of the system or process
Foundation Computing
Basic Schematic Diagrams 5957docx Page 18
Identifying the target audience The target audience is the group of people who will read your schematic diagram The main question you need to ask yourself is Who is my audience In order to identify the target audience for your schematic diagram think about the following
What sort of person will read your diagram Think about that personrsquos job age education language environment and other characteristics that could affect the sort of language and symbols they will understand and relate to
What information will that person look for Why are they reading your diagram What do they want or need to know What information is most important What information is not so important
How much time will that person have to look at your diagram Will they be in a hurry or will they have time to study all the details Does your diagram have to stand alone or will it have a lot of text next to it to explain it
What do you want your audience to learn or do as a result of reading your diagram
What does the diagram need to show What information do you have to include How should this information be arranged
Foundation Computing
Basic Schematic Diagrams 5957docx Page 19
Exercise Complete the table below with information about the target audience and purpose for each of the examples of schematic diagrams given Use the questions above to help you
Example diagram Target audience
You work as an electrician and Mr Jones has asked you to design an electrical wiring plan for the dream house he wants to build
You are a computer programmer and you are using a flowchart to plan a computer program that farmers can use to keep count of their sheep
You have to write an essay about your most embarrassing childhood experience and you create a mindmap to organise your ideas
You are researching your family history and have been asked to create a family tree diagram for a booklet that will be handed out at an upcoming family reunion
Foundation Computing
Basic Schematic Diagrams 5957docx Page 20
Suggested Answer Complete the table below with information about the target audience and purpose for each of the examples of schematic diagrams given Use the questions above to help you
Example diagram Target audience
You work as an electrician and Mr Jones has asked you to design an electrical wiring plan for the dream house he wants to build
Mr Jones his builder local council officials theyrsquoll need detailed information that will be studied in depth and referred to during the planning and building process
You are a computer programmer and you are using a flowchart to plan a computer program that farmers can use to keep count of their sheep
You and other computer programmers will use the flowchart to understand the process of the programme and to identify flaws in its logic
You have to write an essay about your most embarrassing childhood experience and you create a mindmap to organise your ideas
You are the only person who will use your mindmap and you will refer to it as you write your essay
You are researching your family history and have been asked to create a family tree diagram for a booklet that will be handed out at an upcoming family reunion
Members of your family will look for their names and those of relatives in order to see how people are related to each other
Foundation Computing
Basic Schematic Diagrams 5957docx Page 21
TOPIC 2 Identifying the computer application required There are many computer applications that can be used to create schematic diagrams Microsoft Visio is specifically designed for this purpose but any application with basic drawing tools such as those found in Microsoft Word can be used One of the simplest and most widely available computer drawing applications is Microsoft Paint We will use this application is used to demonstrate the tools However most of the tools and principles we will focus on in Microsoft Paint can be found in other drawing applications The following diagram shows the Microsoft Paint window
The tools are arranged to the left of the drawing area in the Tool bar An overview of how to use the tools you need to create a simple schematic diagram is provided below Underneath the Tool bar is the Options box When you click on a tool icon in the Tool bar the options available for that tool appear in the Options box To select an option click on the tool you want to use then click on the option and then click in the drawing area and drag the mouse pointer to draw The Colour palette is underneath the drawing area To use a colour click on the tool you want to use then click on the colour and then click in the drawing area ndash the shape line or text you create will appear in the colour you have selected
Foundation Computing
Basic Schematic Diagrams 5957docx Page 22
Tools Selection Tools Use the selection tools to select the parts of your schematic diagram that you want to work with or change in some way To use these tools click on the button of the tool you want and then click on your diagram and drag until the area you want to work with is selected The Freeform Select tool (on the left) is used to select an irregularly shaped area The Rectangle Select tool is used to select a rectangular area To copy a part of your diagram eg a shape line or text it must first be selected using a selection tool Select Copy from the Edit menu click where you want the copy to be positioned and select Paste from the Edit menu Shapes tools
The shapes tools which can be used to create symbols in schematic diagrams consist of the Rectangle tool for creating squares or rectangles the Polygon tool for creating multi-sided shapes the Rounded Rectangle tool for creating rounded rectangles and the Oval tool for creating circles or ovals These tools provide templates for creating frequently used symbols To use them simply click on the icon of the shape you want to use and drag it onto your diagram where you can resize it if necessary and add text or
Foundation Computing
Basic Schematic Diagrams 5957docx Page 23
effects For the Polygon tool click and drag to draw the first side and click each time you want to change direction Double-click when you have finished To create a perfect circle hold down the Shift key while you are dragging the mouse pointer
Line tools In schematic diagrams line tools can be used to draw connectors between symbols and to draw shapes or symbols
The Straight Line tool creates straight lines simply click on the Straight Line icon click in your picture where you want the line to start and drag to where you want the line to finish The Curve tool will create a curve with at least one and no more than two bends in it click on the Curve icon then click in your picture to draw a straight line and drag to where you want the first bend to be click again where you want the second curve to be and drag to shape the curve You can make more complex shapes by joining lines and curves together
The Pencil tool can be used to draw freeform shapes or lines with as many bends and curves as you want Click on the icon click in your diagram and ldquodrawrdquo with your mouse pointer To draw straight lines hold down the shift key as you are drawing with the mouse
Foundation Computing
Basic Schematic Diagrams 5957docx Page 24
The Paint Brush tool draws freeform lines in the same way as the Pencil tool but can be used to create lines of varying widths and styles To select a paintbrush style click on the Paint Brush icon and then click in the Options box on the style you want to use
The Airbrush tool creates lines with an airbrushed effect of clustered dots It can be used in the same way as the pencil tool to draw freeform shapes or symbols In the Options box you can choose the size of the area covered by the Airbrush tool
Text tool
Add text to your schematic diagram by clicking on the Text icon and clicking in your diagram where you want the text to appear As you drag a rectangle will be formed within which text can be typed The Fonts dialogue box will also open
Foundation Computing
Basic Schematic Diagrams 5957docx Page 25
Fill Tool
The Fill tool will add colour to a shape that you have drawn Click on the icon click on a colour from the colour palette and then click on the shape in the diagram that you want to fill with colour
Zoom tool
Use the Zoom tool to magnify a section of the diagram that you are working with Click on the magnifying glass icon select the size you want in the Options box and click on the part of the image you want to enlarge As the picture zooms in the cursor will change back to the tool you were using before
Adding colour
The Colour box to the left of the Colour palette shows the foreground and background colours you are using If you click on a tool and then drag while holding down the left mouse button the line or shape will be drawn using the foreground colour If you hold down the right mouse button the background colour will be used To use any other colour click on the tool you want to use click on an option (if using) then click on the colour you want from the colour palette As you draw the colour you have clicked on will be used
Foundation Computing
Basic Schematic Diagrams 5957docx Page 26
Additional resources For more detailed information about these tools refer to the Help menu in Microsoft Paint (httpwindowshelpmicrosoftcom )
The following online tutorials may also be useful
httplkwdplorgclassesMSPaintpainthtml
httpwwwlesleyedufacultyahuntMSPttutrhtm
Exercise The example below shows a simple organisation chart produced using Microsoft Paint In the space that follows identify which tools were used to create this schematic diagram and what each tool was used for
Rectangle tool used to create Manager symbol
Oval tool used to create Team Leader symbols
Rounded Rectangle tool used for Team member symbols
Straight line tool used to create connectors
Text tool used to add text to shapes
Rectangle Select tool used to select shapes to move into
position
Foundation Computing
Basic Schematic Diagrams 5957docx Page 27
Suggested Answer The example below shows a simple organisation chart produced using Microsoft Paint In the space that follows identify which tools were used to create this schematic diagram and what each tool was used for
Rectangle tool used to create Manager symbol
Oval tool used to create Team Leader symbols
Rounded Rectangle tool used for Team member symbols
Straight line tool used to create connectors
Text tool used to add text to shapes
Rectangle Select tool used to select shapes to move into position
Foundation Computing
Basic Schematic Diagrams 5957docx Page 28
Exercise Which tools would you use to produce the following symbols or diagrams and why
Symbol Tools and justification
Resistor (Electrical circuit diagram)
Speaker (Electrical circuit diagram)
AC
AC source (Electrical circuit diagram)
Start or end of process (Flowchart)
Decision (yes or no) (Flowchart)
Instructions or actions (Flowchart)
Foundation Computing
Basic Schematic Diagrams 5957docx Page 29
Symbol Tools and justification
Document produced (Flowchart)
Data entered or received (Flowchart)
Foundation Computing
Basic Schematic Diagrams 5957docx Page 30
Suggested Answers Which tools would you use to produce the following symbols or diagrams and why
Symbol Tools and justification
Resistor (Electrical circuit diagram)
Straight line tool (hold down shift key)It creates regular 45 degree angled lines that are perfectly straight
Speaker (Electrical circuit diagram)
Polygon tool (hold down shift key) Rectangle tool and Straight line tool These are used in order to create a symbol with uniform angles and straight edges
AC
AC source (Electrical circuit diagram)
Oval tool (hold down shift key) to draw circle Curve tool to draw wavy line Straight line tool and Text tool These tools produce cleaner shapes than drawing freeform
Start or end of process (Flowchart)
Rounded rectangle tool This provides a template for creating this symbol
Decision (yes or no) (Flowchart)
Polygon tool This creates more accurate joins between sides than the Straight line tool
Instructions or actions (Flowchart)
Rectangle tool It provides a template for drawing this shape
Foundation Computing
Basic Schematic Diagrams 5957docx Page 31
Symbol Tools and justification
Document produced (Flowchart)
Line tool and Curve tool ndash need two tools in MSPaint other applications may have a template for this shape
Data entered or received (Flowchart)
Polygon tool ndash better than Straight line tool because can produce more regular shape
Foundation Computing
Basic Schematic Diagrams 5957docx Page 32
TOPIC 3 Getting started with MS Paint Sourced from httpwindowsmicrosoftcomen-NZwindows7Getting-started-with-Paint MS Paint is a feature in Windows that you can use to draw colour and edit pictures You can use Paint like a digital sketchpad to make simple pictures creative projects or to add text and designs to other pictures such as those taken with your digital camera The parts of Paint Open Paint by clicking the Start button clicking All Programs clicking Accessories and then clicking Paint When you start Paint youll see an empty window drawing and painting tools are located in the ribbon at the top of the window The following illustration shows the different parts of the Paint window
The Paint window
Foundation Computing
Basic Schematic Diagrams 5957docx Page 33
Working with tools The ribbon in Paint includes a handy collection of drawing tools You can use these tools to create freehand drawings and add a variety of shapes to your pictures This section describes some common tasks For more detailed information on how to use the different tools in Paint see Using Paint Draw a line Some tools and shapes such as the Pencil Brush Line and Curve let you make a variety of straight curved and squiggly lines What you draw is determined by how you move the mouse as you draw You can use the Line to draw a straight line for example
1) On the Home tab in the Shapes group click the Line 2) In the Colors group click Color 1 and then click the color you want to use 3) To draw drag the pointer across the drawing area
Draw a squiggly line Your drawings dont have to be composed of only straight lines The Pencil and Brushes can be used to make completely random free-form shapes
1) On the Home tab in the Tools group click the Pencil tool 2) In the Colors group click Color 1 and then click the color you want to use 3) To draw drag the pointer across the drawing area and make a squiggly line
Note If you want to make a line that has a different appearance use one of the Brushes instead Draw a shape Paint lets you draw many different shapes For example you can draw ready-made defined shapes such as rectangles circles squares triangles and arrows (to name a
few) You can also make your own custom shape by using the Polygon shape to draw a polygon which is a shape that can have any number of sides
1) On the Home tab in the Shapes group click a ready-made shape such as the
Rectangle 2) To add a ready-made shape drag the pointer across the drawing area to make
the shape 3) To change the outline style in the Shapes group click Outline and then click an
outline style 4) If you dont want your shape to have an outline click No outline 5) In the Colors group click Color 1 and then click a color for the outline 6) In the Colors group click Color 2 and then click a color to use to fill the shape 7) To change the fill style in the Shapes group click Fill and then click a fill style 8) If you dont want your shape to be filled click No fill
Foundation Computing
Basic Schematic Diagrams 5957docx Page 34
Add text You can also add text to your picture The Text tool lets you add a simple message or title
1) On the Home tab in the Tools group click the Text tool 2) Drag the pointer in the drawing area where you want to add text 3) Under Text Tools on the Text tab click the font face size and style in the Font
group The Font group
4) In the Colors group click Color 1 and then click a color This is the text color 5) Type the text that you want to add
Erase part of your picture If you make a mistake or need to change part of a picture use the eraser By default the eraser changes any area you erase to white but you can change the eraser color For example if you set the background color to yellow anything you erase turns to yellow
1) On the Home tab in the Tools group click the Eraser tool 2) In the Colors group click Color 2 and then click the color that you want to erase
with If you want to erase with white you dont have to select a color 3) Drag the pointer over the area you want to erase
Saving a picture Save your picture frequently so you dont accidentally lose your work To save click the
Paint button and then click Save This saves all of the changes made to the picture since the last time you saved The very first time that you save a new picture you will need to give your picture a file name Follow these steps
1) Click the Paint button and then click Save 2) In the Save as type box select the file format you want 3) In the File name box type a name and then click Save
Foundation Computing
Basic Schematic Diagrams 5957docx Page 35
Topic 4 Designing your diagram Although there are many different types of schematic diagrams the basic process and principles involved in designing a clear and coherent diagram are similar The principles apply to designing an electrical circuit diagram an organisation chart a mind map a flow chart and many other diagrams Some of these principles are also worth applying to other disciplines such as designing a Web page Letrsquos work step-by-step through the process of creating a flow chart to help people make money selling things on an on-line auction site such as wwwtrademeconz or wwwebaycom
Step 1 Gather your information Start by brainstorming all the information you need to include in your diagram Write down everything you think might be important or should be included
trademe
choose things that
sell
good photograph
feedback
keep track
prompt answers
postage
auction length
similar listings
postal system
setting reserve
describing item
correct category
re-listing
fixed offers
Look at the information you have gathered and think about your target audience Highlight the information that is most important to your target audience Cross out any irrelevant information Put question marks next to information that you are unsure about or may be able to leave out
Foundation Computing
Basic Schematic Diagrams 5957docx Page 36
Step 2 Organise your information Take the information that you have left and sort through it How you organise your information will depend on the type of diagram you are designing For example an organisationrsquos chart usually has different levels and shows who its members report to so you might group people by department and by level A flow chart like the example wersquore creating usually shows a process Information is grouped in the order we would use it If any other steps or information occurs to you as you are organising your information add them in Herersquos an example of how the key steps involved in selling on trademe could be ordered
Choose items that sell
Look at similar listings
Decide on a reserve price
Take a clear photograph
Identify your target audience
Write a clear description
Upload your item
Choose the correct category
Monitor watchers bids and views
Lower your reserve
Fixed price offers
Relist
Step 3 Make connections Once the elements are grouped or arranged in a logical order a clearer picture of the process or system you are representing in your diagram should start to emerge However unlike a list which usually reads from top to bottom only a diagram can show connections in many different directions and working out the links between elements is an essential part of designing a coherent diagram At this stage of the design process it is helpful to sketch out a basic plan of the elements you want to include and the flow-lines or connections between them In order to work out the connections between the elements ask questions such as What happens ifhellip What do I do beforeafter this What decisions need to be made now What actions need to be taken Use arrows to show connections between elements group elements that are part of the same stage or level of the process next to or near to each other and use shapes to show which elements are similar to each other eg diamonds for decisions rectangles for instructions or actions Make up your own meanings for shapes if necessary but be sure to use them consistently
Foundation Computing
Basic Schematic Diagrams 5957docx Page 37
The flow chart below shows how our list of elements above changes and gets re-ordered as we ask these questions and organise the information into a logical and coherent diagram
Decide on your
reserve price
START
Relist
Take a photo that is
clear and item looks
good
Decide on your
ideal buyer
Write a description
of your item
highlighting its
benefits for your
buyer
Upload your item in
a category your
buyer is likely to be
looking in
Monitor how many
views watchers and
bids your item gets
Lower your reserve
Item meets reserve
and sellsItem doesnrsquot sell
Offer to watchers for
your reserve
Decide what you
want to sell
Check what similar
items are currently
selling for
Lots of views but
no watchers
No interestFINISH
Foundation Computing
Basic Schematic Diagrams 5957docx Page 38
Step 4 Test your diagram The final step in designing your diagram is checking that it is as effective as possible To do this you should work through each stage step by step challenging it as you go Picture the process in your mind as you follow the links checking that you have included all the actions and decisions required that they are in the correct order and that no steps are duplicated Once yoursquore confident that the diagram is correct look at it again critically to see if you can improve it or clarify it Is there anywhere you can simplify it by removing unnecessary steps Is there anywhere that seems vague and would be easier to understand if you added a step or a connector Now imagine that you are a member of your target audience For a moment try to forget everything you know about the system or process you have designed a diagram for except for what your target audience knows Look at the diagram with fresh eyes does it make sense to you now Does anything seem odd confusing or out of place Finally look at the layout of your diagram Is it easy to read and follow Have you used shapes texts and arrows consistently Are your shapes and texts uniform and lined up properly Are your connectors clearly defined or are they criss-crossing all over each other Check the spelling of labels carefully ndash go through letter by letter to make sure all names and technical or unfamiliar terms are correct
Discussion With a partner look critically at our example diagram above Discuss any parts of it that you think could be better and any changes you would make to improve the readability of the flow chart Make note on the flow chart above of any areas that you think could be improved Share your answers with the rest of the class
Foundation Computing
Basic Schematic Diagrams 5957docx Page 39
Self Test 1) Mr Biggles owns Biggles Air Supplies a company that makes aircraft supplies He asks you to create an organisation chart for his company He gives you the following list of all his employees and who they report to
Mr James Biggles Chief Executive Officer
Jane Doep Personal Assistant to CEO
Mrs Monica Stepworth Financial Manager (reports to CEO)
Judith Zantes Accountant (reports to Financial Manager)
Mary Smallville Accountant (reports to Financial Manager)
Janey Poretuna Admin Assistant (reports to Judith Zantes)
Mickey Laluevu IT technician (reports to Financial Manager)
Mr Hank Johnson Operations Manager (reports to CEO)
Frank Hapil Engineering Manager (reports to Operations Manager)
Joe Smither Engineering Supervisor (reports to Engineering Manager)
Howie Fartherton Engineering Technician (reports to Engineering Supervisor)
Ernie Jusef Engineering Technician (reports to Engineering Supervisor)
Rob Luxemburg Apprentice Technician (reports to Ernie Jusef)
Harry Monahan Interiors Manager (reports to Operations Manager)
Barney Jokka Interiors Technician (reports to Interiors Supervisor) Design an organisation chart for Biggles Air Supplies and draw it in the space below
2) Think of a simple process that has at least five steps and involves some form of feedback or choice For example operating a vending machine topping up your mobile phone using EFTPOS checking messages on an answering machine
Design a flow chart to represent your process
Foundation Computing
Basic Schematic Diagrams 5957docx Page 40
Self Test Answers
1) Mr Biggles owns Biggles Air Supplies a company that makes aircraft supplies He asks you to create an organisation chart for his company He gives you the following list of all his employees and who they report to
Mr James Biggles Chief Executive Officer
Jane Doep Personal Assistant to CEO
Mrs Monica Stepworth Financial Manager (reports to CEO)
Judith Zantes Accountant (reports to Financial Manager)
Mary Smallville Accountant (reports to Financial Manager)
Janey Poretuna Admin Assistant (reports to Judith Zantes)
Mickey Laluevu IT technician (reports to Financial Manager)
Mr Hank Johnson Operations Manager (reports to CEO)
Frank Hapil Engineering Manager (reports to Operations Manager)
Joe Smither Engineering Supervisor (reports to Engineering Manager)
Howie Fartherton Engineering Technician (reports to Engineering Supervisor)
Ernie Jusef Engineering Technician (reports to Engineering Supervisor)
Rob Luxemburg Apprentice Technician (reports to Ernie Jusef)
Harry Monahan Interiors Manager (reports to Operations Manager)
Barney Jokka Interiors Technician (reports to Interiors Supervisor) Design an organisation chart for Biggles Air Supplies and draw it in the space below
Mr James Biggles
CEO
Jane Doep
Personal
Assistant
Mrs Monica Stepworth
Financial Manager
Judith Zantes
Accountant
Janey Poretuna
Admin Assistant
Mary Smallville
Accountant
Mickey Laluevu
IT technician
Mr Hank Johnson
Operations Manager
Frank Hapil
Engineering
Manager
Harry Monahan
Interiors Manager
Joe Smither
Engineering
Supervisor
Howie Fartherton
Engineering
Technician
Ernie Jusef
Engineering
Technician
Rob Luxemburg
Apprentice
Technician
Barney Jokka
Interiors
Technician
Foundation Computing
Basic Schematic Diagrams 5957docx Page 41
2) Think of a simple process that has at least five steps and involves some form of feedback or choice For example operating a vending machine topping up your mobile phone using EFTPOS checking messages on an answering machine
Design a flow chart to represent your process
Dial 06345
Enter your dialing code and
phone number followed by
the key
Dial number for
service you require
Listen to saved messagesListen to new messages
Dial number for
service you require
Save message Delete message
START
FINISH
Dial 2
Dial 1
Dial 1
Dial 2
Dial 1
Dial 2
Foundation Computing
Basic Schematic Diagrams 5957docx Page 42
Foundation Computing
Basic Schematic Diagrams 5957docx Page 43
Part 2
Produce schematic diagrams from a given brief using a computer application
OBJECTIVES
On successful completion of this section you will be able to Produce schematic diagrams from a given brief using a computer application
Performance criteria
21 The symbols used in each diagram are consistent with the type of diagram and the specifications of the brief
22 The final diagram is readable clearly illustrates the object being diagrammed
and is consistent with the specifications of the brief
TOPICS
Topic 1 Symbols used are consistent with diagram type and specifications Topic 2 Diagram is clear readable and consistent with specifications
Self Test
Self Test Answers
Foundation Computing
Basic Schematic Diagrams 5957docx Page 44
TOPIC 1 Symbols used are consistent with diagram type and specifications A symbol is something such as an object picture written word sound or particular mark that represents something else by association resemblance or convention For example a red octagon may be a symbol for STOP On maps crossed sabres may indicate a battlefield Numerals are symbols for numbers All language consists of symbols The word cat is not a cat but is an arbitrary symbol representing the idea of a cat There are many symbols for many things Examples range from Peace Pipe Red Cross to Electrical symbols It is good when doing schematic drawings to use symbols that are clearly recognised and interpreted Symbols that have been internationally standardised are the best Circuit diagram symbols have differed from country to country and have changed over time They are now to a large extent internationally standardized Simple components often had symbols intended to represent some feature of the physical construction of the device There are several national and international standards for graphical symbols in circuit diagrams in particular
IEC 60617 (also known as British Standard BS 3939)
ANSI standard Y32 (also known as IEEE Std 315) IEC 60617 originally consisted of 13 parts from resistors and capacitors to logic symbols and even a generalised drawing standard of connections and bus line widths It is now published as a subscription online database IEC 60617-DB Different symbols may be used depending on the discipline using the drawing for example lighting and power symbols used as part of architectural drawings may be different from symbols for devices used in electronics Different electronic components have different characteristics it is necessary to distinguish between them in any circuit diagram Of course we could use the block diagram approach and just identify each component with words Unfortunately this takes up a lot of space and makes the overall diagram harder to recognize or understand quickly We need a way to understand electrical diagrams far more quickly and easily
Foundation Computing
Basic Schematic Diagrams 5957docx Page 45
The answer is to use schematic symbols to represent electronic components as shown in the diagram below In this diagram we show the schematic symbol of a battery as the electrical source and the symbol of a resistor as the load Even without the words and arrows the symbols define exactly what this circuit is and how it behaves
Some good procedures to follow with symbols include
Using templates for frequently used symbols
Use symbols consistently
Use a library of symbols such as from IEC 60617-DB
Foundation Computing
Basic Schematic Diagrams 5957docx Page 46
TOPIC 2 Diagram is clear readable and consistent with specifications Creating a simple diagram using MSPaint To start with letrsquos create a simple flow chart representing the stages in designing a schematic diagram There are four stages in this process
1) Gather your information 2) Organise your information 3) Make connections 4) Test your diagram
Our flow chart will consist of four rectangles arranged vertically with downward pointing arrows as connectors A rounded rectangle at the top and at the bottom of the flowchart will indicate START and FINISH respectively Step by step
Open Microsoft Paint
Click on the Rectangle tool then click and drag in the drawing area to draw a rectangle
Repeat this step to draw four boxes in the drawing area OR click on the Select tool and click and drag to select the first rectangle then right-click to copy and paste three more rectangles the same size in the drawing area
Foundation Computing
Basic Schematic Diagrams 5957docx Page 47
Using the Rounded Rectangle tool draw a rounded rectangle at the top and bottom of your flow chart
Foundation Computing
Basic Schematic Diagrams 5957docx Page 48
Use the Line tool to draw arrows between each box In the Options area under the Tool bar you can choose the thickness of line that you want to use Remember too that if you hold down the Shift key on the keyboard while you are drawing a line you can create a 45 degree angle
Use the Text tool to add text to the shapes by clicking on the Text tool clicking and dragging to create a textbox inside your shape then typing your text Check your spelling carefully letter by letter as you go
Foundation Computing
Basic Schematic Diagrams 5957docx Page 49
The basic flowchart created in Microsoft Paint could look something like this
Foundation Computing
Basic Schematic Diagrams 5957docx Page 50
Common problems with diagrams Even well-designed schematic diagrams will be difficult for the target audience to read and understand if symbols are used inconsistently or the layout of the diagram is unfamiliar For example if a flowchart has different shapes used for each element and different types of arrows used randomly it will be more difficult for readers to see the overall direction and meaning of the diagram If the shapes on an organisation chart are different sizes and randomly positioned with no clear levels or hierarchy the diagram will not provide a clear overview of the organisationrsquos structure If an electrical circuit diagram has unfamiliar symbols used for elements such as switches resistors and batteries then it will not make sense to its intended audience
Tips for improving the readability of your schematic diagrams
Use symbols and shapes consistently ie elements that are similar should have the same symbol or shape
Avoid having connectors crossing over each other
Avoid having symbols or shapes overlapping
Use arrows on connectors or flow lines to indicate direction
Use colours text size and font consistently
Diagrams that can be read top-to-bottom and left-to-right are easier to read
In a process diagram have only one connector leading into a symbol but have more coming out where necessary to indicate different directions or decisions
Diagrams for a technical audience such as electrical or computer programming schematics should follow accepted conventions for symbols and layout
Diagrams indicating a hierarchy of positions ideas or stages are clearer if elements belonging to the same level are a similar shape size and position on the page
Keep labels as clear and as brief as possible Carefully check the spelling of all names and labels letter by letter ndash errors in the spelling of names or scientific and technical terms look unprofessional and can be confusing for readers
Foundation Computing
Basic Schematic Diagrams 5957docx Page 51
Self Test Look at the schematic diagrams that follow Make notes under each example of what is wrong with the diagram what is right about the diagram and what could be changed to make it clear and meaningful to its intended audience 1) This flow chart is supposed to show police officers how to get a suspect to confess to a crime
START
Confidently accuse
suspect of crime
Describe a
scenario that
enables suspect
to admit guiltAllow suspect to
voice objections
Invade suspectrsquos
personal space
Suspect becomes
uncomfortable
Suspect
doesnrsquot
deny guilt
Suspect
denies guilt
No reaction
Elicit confession
Rephrase objections as
confessions
FINISH
Foundation Computing
Basic Schematic Diagrams 5957docx Page 52
2) The following diagram is an organisation chart for Widget Enterprises
John Smith
MANAGER
Seth Drew
IT MANAGER
May Furur
SECRETARY
Judith Holland
CUSTOMER SERVICES manager
Jad Ling
HELPDESK
Harry Petal
FINANCIAL MANAGER
Wanda Springer
MARKETING
MANAGER
Bob Smithells
CLEANER
Kelly Inlerl
MARKETING ASSISTANT
Beryl Thin
CUSTOMER SERVICES ASSISTANTValda Rigley
CUSTOMER
SERVICES
ASSISTANT
Levi Quayle
COMPUTER
TECHNICIAN
3) Which of the following computer applications can be used to create schematic diagrams
a) Microsoft Visio
b) Microsoft Paint
c) Microsoft Word
d) All of the above
4) Which frequently used shapes does the Microsoft Paint Tool bar contain templates for
5) Where in the Microsoft Paint window would you be able to select the thickness of line that you wanted for a brushstroke 6) Identify the purpose and intended audience for a diagram showing a businessrsquos marketing plan 7) Name two characteristics of well-designed schematic diagrams 8) Identify four steps involved in designing schematic diagrams 9) Why is it important to use conventionally accepted and familiar shapes and symbols in your schematic diagrams
Foundation Computing
Basic Schematic Diagrams 5957docx Page 53
Self Test Answers 1) This flow chart is supposed to show police officers how to get a suspect to confess to a crime
START
Confidently accuse
suspect of crime
Describe a
scenario that
enables suspect
to admit guiltAllow suspect to
voice objections
Invade suspectrsquos
personal space
Suspect becomes
uncomfortable
Suspect
doesnrsquot
deny guilt
Suspect
denies guilt
No reaction
Elicit confession
Rephrase objections as
confessions
FINISH
Random shapes are meaningless and confusing ndash use conventional flow chart symbols
Stages of process are not clear ndash arrange shapes top to bottom with options at each stage branching off to side at same level
Connectors that are either straight or curved would be more consistent
Labels are clear
Text uses consistent font and size
Foundation Computing
Basic Schematic Diagrams 5957docx Page 54
2) The following diagram is an organisation chart for Widget Enterprises
John Smith
MANAGER
Seth Drew
IT MANAGER
May Furur
SECRETARY
Judith Holland
CUSTOMER SERVICES manager
Jad Ling
HELPDESK
Harry Petal
FINANCIAL MANAGER
Wanda Springer
MARKETING
MANAGER
Bob Smithells
CLEANER
Kelly Inlerl
MARKETING ASSISTANT
Beryl Thin
CUSTOMER SERVICES ASSISTANTValda Rigley
CUSTOMER
SERVICES
ASSISTANT
Levi Quayle
COMPUTER
TECHNICIAN
No clear levels to hierarchy ndash organise so that diagram reads top to bottom and positions at similar level are in same horizontal space
Different sized boxes and borders on some boxes are meaningless ndash need consistent style for similar elements
Connectors cross over each other and boxes overlap ndash arrange space to avoid this
Text size and font is mostly consistent but one typo needs correcting
3) Which of the following computer applications can be used to create schematic diagrams
a) Microsoft Visio
b) Microsoft Paint
c) Microsoft Word
d) All of the above correct
4) Which frequently used shapes does the Microsoft Paint Tool bar contain templates for
Polygon rectangle ovalellipse
Foundation Computing
Basic Schematic Diagrams 5957docx Page 55
5) Where in the Microsoft Paint window would you be able to select the thickness of line that you wanted for a brushstroke
Options area below the Toolbar
6) Identify the purpose and intended audience for a diagram showing a businessrsquos marketing plan
The purpose would be to provide an overview of the businessrsquos marketing strategy Audience could include management and employees of the business especially the Marketing department potential investors shareholders and directors of the business
7) Name two characteristics of well-designed schematic diagrams Any of simple easy for the target audience to understand include all relevant elements or parts of the process clear and logical connections between elements accurate 8) Identify four steps involved in designing schematic diagrams Gather information organise information make connections between elements test your diagram 9) Why is it important to use conventionally accepted and familiar shapes and
symbols in your schematic diagrams So that the diagram will be easily understood by the target audience
Foundation Computing
Basic Schematic Diagrams 5957docx Page 56
References httpwindowsmicrosoftcomen-NZwindows7Getting-started-with-Paint accessed Sat 5th December in Timaru New Zealand httpenwikipediaorgwikiSchematic_diagrams accessed Sat 5th December in Timaru New Zealand httpenwikipediaorgwikiSymbol accessed Sat 5th December in Timaru New Zealand
Foundation Computing
Basic Schematic Diagrams 5957docx Page 10
TOPIC 1 Identifying the purpose and the target audience
Letrsquos define a few terms (both definitions taken from NZQA Unit Standard 5957) A brief is defined as a clear description of both the desirable outcomes sought and the constraints to be met by the solution It contains requirements against which the success or otherwise of the desktop published document can be evaluated The brief can be supplied either as part of the candidatersquos employment (in the case of workplace assessment) or in response to a set task Text graphics and specified page layout will be provided for the task A plan outlines how the requirements of the brief will be realised For this unit standard the plan may be informal and it may be more appropriate to produce evidence of it during task completion rather than prior to starting the task or project Evidence of planning may be oral written andor graphic Accordingly we need to plan schematic diagrams from a given brief There are many ways to achieve our purpose However a) What are schematic diagrams b) What is the purpose for these schematic diagrams c) Who is our target audience
Schematic Diagrams Schematic diagrams are used to show the different parts or elements of a system or process and how they are connected and related to each other Examples of systems include
organisations like your school or
computer networks or
electrical circuits A mind map that you might use to plan an essay is a simple example of a schematic diagram In this case your essay is the system and the different elements are the different facts and ideas and headings that you need to include in your essay Processes can include
instructions for how to do something
software programming or
plans for an event such as a wedding
Foundation Computing
Basic Schematic Diagrams 5957docx Page 11
A schematic is a diagram that represents the elements of a system using abstract graphic symbols rather than realistic pictures A schematic usually omits all details that are not relevant to the information the schematic is intended to convey and may add unrealistic elements that aid comprehension For example
a subway map intended for riders may represent a subway station with a dot the dot doesnt resemble the actual station at all but gives the viewer information without unnecessary visual clutter
A schematic diagram of a chemical process uses symbols to represent the vessels piping valves pumps and other equipment of the system emphasizing their interconnection paths and suppressing physical details
In an electronic circuit diagram the layout of the symbols may not resemble the layout in the physical circuit In the schematic diagram the symbolic elements are arranged to be more easily interpreted by the viewer
A schematic of the Washington Metro The schematic is not drawn to scale distances
between stations are fixed and lines are drawn at 45 and 90-degree angles
Foundation Computing
Basic Schematic Diagrams 5957docx Page 12
In the electrical industry a schematic diagram is often used to describe the design of equipment Schematic diagrams are often used for the maintenance and repair of electronic and electromechanical systems Original schematics were done by hand using standardized templates or pre-printed adhesive symbols but today Electrical CAD software is often used Schematic diagrams are used extensively in repair manuals to help users understand the interconnections of parts and to provide graphical instruction to assist in taking apart and rebuilding mechanical assemblies Many automotive and motorcycle repair manuals devote a significant number of pages to schematic diagrams
Exercise 1 See if you can match each of the names in the box with one of the schematic diagrams below
Flow Chart
Organisation Chart
Electrical circuit
Mind map A)
Marketing Plan
Placement
ProductPromotion
Price
Competitive
weaknesses
Competitive
strengths
New features
Trade shows
Mailings
Advertising
B)
Jeremy Nash
CEO
Adam Jurgensen
Operations
Manager
Aneru Jacobs
Sales and
Marketing
Obed Tambo
District Coodinator
Manaia Pehi
Financial
Manager
Hashim Mohamed
Accountant
Janet Brookes
Personal Assistant
Steven Alleroo
IT Manager
Cindy Wahoo
Technician
Foundation Computing
Basic Schematic Diagrams 5957docx Page 13
C)
120V
480V
U
L
L
U
LOR
RESET
OL
TR2
TR3
VIB
VIB
WTR
MOTOR
BLOWER
PS
LOR
ON-OFF
SS
TR3
START
M
START
RUN
HAND
OFF
REMOTE
LOR
M
REMOTE
MODE
M
PS
TR1
TR2
S
To LOR COIL CIRCUIT
M
MSH
ON-OFF
R
W
TR1
X1
D
C
B
A
4 3 2 1
D
C
B
A
4 3 2 1
D)
Foundation Computing
Basic Schematic Diagrams 5957docx Page 14
Answers A = Mindmap B = Organisation chart C = Electrical circuit diagram D = Flow chart Schematic diagram production Before suitable computer applications were developed schematic diagrams were produced manually using tools such as typewriters stencils stickers or labels and drawing by hand Sometimes it can be quicker to produce simple schematic diagrams by hand or you may not have a computer available or the computer application available might be too complex or take so long to learn that it makes more sense to use manual methods Alternatively you may have a highly complex schematic diagram that is too big to print out on the computer printers available and would not make sense if spread over a number of pages
Exercise 2) In the space below or on a piece of paper describe some situations in which you would choose to use a computer application to produce your schematic diagram and explain why
Exercise 3) Now describe some situations in which you would choose NOT to produce your schematic diagram using a computer application and explain why not
Exercise 4) Working with a partner brainstorm the advantages and disadvantages of producing schematic diagrams with a computer application rather than by hand
Foundation Computing
Basic Schematic Diagrams 5957docx Page 15
Suggested answers to the exercises 2) In the space below describe some situations in which you would choose to use a computer application to produce your schematic diagram and explain why Situations could include (and there are many more)
Preparing a flow chart to send by email to all the members of a team ndash because doing it on computer would allow me to make multiple copies and email them easily
Producing a complex network diagram as part of a report to present ndash because it would look more professional and could be easily changed or updated
Preparing an organisation chart to include in a computerised slideshow - because it could easily be imported
3) Now describe some situations in which you would choose NOT to produce your schematic diagram using a computer application and explain why not
Situations could include
Presenting an organisation diagram or a flow chart to a community organisation as a one-off event if I did not have access to a large-scale printer or projector I would draw or paint the diagram by hand ndash because it would be the simplest way to make it large enough for everyone to see and I would be unlikely to need more copies
In an assessment situation drawing a mind map or brainstorming diagram to organise my ideas before writing an essay or report ndash because it would be quickest
Working with a team to sketch out a plan for a process because it would be quickest and wouldnrsquot rely on being close to a computer
Foundation Computing
Basic Schematic Diagrams 5957docx Page 16
4) Working with a partner brainstorm the advantages and disadvantages of producing schematic diagrams with a computer application rather than by hand
Your results of your brainstorm might look like this (diagram produced using MS Visio)
Using computers AdvantagesDisadvantages
need to learn
application
can take longer
sometimes difficult
to plan
limited options for
layout
frustrating
too many options
incompatible file
types
can store on
computer
can fit more smaller
text
easy to read
can email to people
use templates
easy to change or
update
Can be quick
easy to make
copies
professional looking
import into
computer
documents
Expensive
equipment needed
technical problems
Security
Foundation Computing
Basic Schematic Diagrams 5957docx Page 17
Process for producing schematic diagrams on computer There are many different computer applications that can be used to produce schematic diagrams Some applications like Microsoft Visio are specifically designed to help you create a wide range of complex schematic diagrams easily However almost any computer application that has a drawing tool can be used to produce a schematic diagram and the process will usually involve the following steps 1) Design the diagram
a Identify your target audience b Collect all the information you need c Arrange your information in a logical order d Test your diagram
2) Create the diagram in the computer application
a Open the drawing window b Draw the shapes you want c Arrange the shapes according to your design d Add connectors between each of the shapes e Add text where required
Designing effective diagrams The main purpose of a schematic diagram is to provide a clear and easy to understand visual overview of how the different parts of a system fit together Schematic diagrams that are well-designed
are as simple as possible
are easy for the target audience to understand
include all relevant elements or parts of the process
have clear and logical connections between elements
communicate an accurate picture of the system or process
Foundation Computing
Basic Schematic Diagrams 5957docx Page 18
Identifying the target audience The target audience is the group of people who will read your schematic diagram The main question you need to ask yourself is Who is my audience In order to identify the target audience for your schematic diagram think about the following
What sort of person will read your diagram Think about that personrsquos job age education language environment and other characteristics that could affect the sort of language and symbols they will understand and relate to
What information will that person look for Why are they reading your diagram What do they want or need to know What information is most important What information is not so important
How much time will that person have to look at your diagram Will they be in a hurry or will they have time to study all the details Does your diagram have to stand alone or will it have a lot of text next to it to explain it
What do you want your audience to learn or do as a result of reading your diagram
What does the diagram need to show What information do you have to include How should this information be arranged
Foundation Computing
Basic Schematic Diagrams 5957docx Page 19
Exercise Complete the table below with information about the target audience and purpose for each of the examples of schematic diagrams given Use the questions above to help you
Example diagram Target audience
You work as an electrician and Mr Jones has asked you to design an electrical wiring plan for the dream house he wants to build
You are a computer programmer and you are using a flowchart to plan a computer program that farmers can use to keep count of their sheep
You have to write an essay about your most embarrassing childhood experience and you create a mindmap to organise your ideas
You are researching your family history and have been asked to create a family tree diagram for a booklet that will be handed out at an upcoming family reunion
Foundation Computing
Basic Schematic Diagrams 5957docx Page 20
Suggested Answer Complete the table below with information about the target audience and purpose for each of the examples of schematic diagrams given Use the questions above to help you
Example diagram Target audience
You work as an electrician and Mr Jones has asked you to design an electrical wiring plan for the dream house he wants to build
Mr Jones his builder local council officials theyrsquoll need detailed information that will be studied in depth and referred to during the planning and building process
You are a computer programmer and you are using a flowchart to plan a computer program that farmers can use to keep count of their sheep
You and other computer programmers will use the flowchart to understand the process of the programme and to identify flaws in its logic
You have to write an essay about your most embarrassing childhood experience and you create a mindmap to organise your ideas
You are the only person who will use your mindmap and you will refer to it as you write your essay
You are researching your family history and have been asked to create a family tree diagram for a booklet that will be handed out at an upcoming family reunion
Members of your family will look for their names and those of relatives in order to see how people are related to each other
Foundation Computing
Basic Schematic Diagrams 5957docx Page 21
TOPIC 2 Identifying the computer application required There are many computer applications that can be used to create schematic diagrams Microsoft Visio is specifically designed for this purpose but any application with basic drawing tools such as those found in Microsoft Word can be used One of the simplest and most widely available computer drawing applications is Microsoft Paint We will use this application is used to demonstrate the tools However most of the tools and principles we will focus on in Microsoft Paint can be found in other drawing applications The following diagram shows the Microsoft Paint window
The tools are arranged to the left of the drawing area in the Tool bar An overview of how to use the tools you need to create a simple schematic diagram is provided below Underneath the Tool bar is the Options box When you click on a tool icon in the Tool bar the options available for that tool appear in the Options box To select an option click on the tool you want to use then click on the option and then click in the drawing area and drag the mouse pointer to draw The Colour palette is underneath the drawing area To use a colour click on the tool you want to use then click on the colour and then click in the drawing area ndash the shape line or text you create will appear in the colour you have selected
Foundation Computing
Basic Schematic Diagrams 5957docx Page 22
Tools Selection Tools Use the selection tools to select the parts of your schematic diagram that you want to work with or change in some way To use these tools click on the button of the tool you want and then click on your diagram and drag until the area you want to work with is selected The Freeform Select tool (on the left) is used to select an irregularly shaped area The Rectangle Select tool is used to select a rectangular area To copy a part of your diagram eg a shape line or text it must first be selected using a selection tool Select Copy from the Edit menu click where you want the copy to be positioned and select Paste from the Edit menu Shapes tools
The shapes tools which can be used to create symbols in schematic diagrams consist of the Rectangle tool for creating squares or rectangles the Polygon tool for creating multi-sided shapes the Rounded Rectangle tool for creating rounded rectangles and the Oval tool for creating circles or ovals These tools provide templates for creating frequently used symbols To use them simply click on the icon of the shape you want to use and drag it onto your diagram where you can resize it if necessary and add text or
Foundation Computing
Basic Schematic Diagrams 5957docx Page 23
effects For the Polygon tool click and drag to draw the first side and click each time you want to change direction Double-click when you have finished To create a perfect circle hold down the Shift key while you are dragging the mouse pointer
Line tools In schematic diagrams line tools can be used to draw connectors between symbols and to draw shapes or symbols
The Straight Line tool creates straight lines simply click on the Straight Line icon click in your picture where you want the line to start and drag to where you want the line to finish The Curve tool will create a curve with at least one and no more than two bends in it click on the Curve icon then click in your picture to draw a straight line and drag to where you want the first bend to be click again where you want the second curve to be and drag to shape the curve You can make more complex shapes by joining lines and curves together
The Pencil tool can be used to draw freeform shapes or lines with as many bends and curves as you want Click on the icon click in your diagram and ldquodrawrdquo with your mouse pointer To draw straight lines hold down the shift key as you are drawing with the mouse
Foundation Computing
Basic Schematic Diagrams 5957docx Page 24
The Paint Brush tool draws freeform lines in the same way as the Pencil tool but can be used to create lines of varying widths and styles To select a paintbrush style click on the Paint Brush icon and then click in the Options box on the style you want to use
The Airbrush tool creates lines with an airbrushed effect of clustered dots It can be used in the same way as the pencil tool to draw freeform shapes or symbols In the Options box you can choose the size of the area covered by the Airbrush tool
Text tool
Add text to your schematic diagram by clicking on the Text icon and clicking in your diagram where you want the text to appear As you drag a rectangle will be formed within which text can be typed The Fonts dialogue box will also open
Foundation Computing
Basic Schematic Diagrams 5957docx Page 25
Fill Tool
The Fill tool will add colour to a shape that you have drawn Click on the icon click on a colour from the colour palette and then click on the shape in the diagram that you want to fill with colour
Zoom tool
Use the Zoom tool to magnify a section of the diagram that you are working with Click on the magnifying glass icon select the size you want in the Options box and click on the part of the image you want to enlarge As the picture zooms in the cursor will change back to the tool you were using before
Adding colour
The Colour box to the left of the Colour palette shows the foreground and background colours you are using If you click on a tool and then drag while holding down the left mouse button the line or shape will be drawn using the foreground colour If you hold down the right mouse button the background colour will be used To use any other colour click on the tool you want to use click on an option (if using) then click on the colour you want from the colour palette As you draw the colour you have clicked on will be used
Foundation Computing
Basic Schematic Diagrams 5957docx Page 26
Additional resources For more detailed information about these tools refer to the Help menu in Microsoft Paint (httpwindowshelpmicrosoftcom )
The following online tutorials may also be useful
httplkwdplorgclassesMSPaintpainthtml
httpwwwlesleyedufacultyahuntMSPttutrhtm
Exercise The example below shows a simple organisation chart produced using Microsoft Paint In the space that follows identify which tools were used to create this schematic diagram and what each tool was used for
Rectangle tool used to create Manager symbol
Oval tool used to create Team Leader symbols
Rounded Rectangle tool used for Team member symbols
Straight line tool used to create connectors
Text tool used to add text to shapes
Rectangle Select tool used to select shapes to move into
position
Foundation Computing
Basic Schematic Diagrams 5957docx Page 27
Suggested Answer The example below shows a simple organisation chart produced using Microsoft Paint In the space that follows identify which tools were used to create this schematic diagram and what each tool was used for
Rectangle tool used to create Manager symbol
Oval tool used to create Team Leader symbols
Rounded Rectangle tool used for Team member symbols
Straight line tool used to create connectors
Text tool used to add text to shapes
Rectangle Select tool used to select shapes to move into position
Foundation Computing
Basic Schematic Diagrams 5957docx Page 28
Exercise Which tools would you use to produce the following symbols or diagrams and why
Symbol Tools and justification
Resistor (Electrical circuit diagram)
Speaker (Electrical circuit diagram)
AC
AC source (Electrical circuit diagram)
Start or end of process (Flowchart)
Decision (yes or no) (Flowchart)
Instructions or actions (Flowchart)
Foundation Computing
Basic Schematic Diagrams 5957docx Page 29
Symbol Tools and justification
Document produced (Flowchart)
Data entered or received (Flowchart)
Foundation Computing
Basic Schematic Diagrams 5957docx Page 30
Suggested Answers Which tools would you use to produce the following symbols or diagrams and why
Symbol Tools and justification
Resistor (Electrical circuit diagram)
Straight line tool (hold down shift key)It creates regular 45 degree angled lines that are perfectly straight
Speaker (Electrical circuit diagram)
Polygon tool (hold down shift key) Rectangle tool and Straight line tool These are used in order to create a symbol with uniform angles and straight edges
AC
AC source (Electrical circuit diagram)
Oval tool (hold down shift key) to draw circle Curve tool to draw wavy line Straight line tool and Text tool These tools produce cleaner shapes than drawing freeform
Start or end of process (Flowchart)
Rounded rectangle tool This provides a template for creating this symbol
Decision (yes or no) (Flowchart)
Polygon tool This creates more accurate joins between sides than the Straight line tool
Instructions or actions (Flowchart)
Rectangle tool It provides a template for drawing this shape
Foundation Computing
Basic Schematic Diagrams 5957docx Page 31
Symbol Tools and justification
Document produced (Flowchart)
Line tool and Curve tool ndash need two tools in MSPaint other applications may have a template for this shape
Data entered or received (Flowchart)
Polygon tool ndash better than Straight line tool because can produce more regular shape
Foundation Computing
Basic Schematic Diagrams 5957docx Page 32
TOPIC 3 Getting started with MS Paint Sourced from httpwindowsmicrosoftcomen-NZwindows7Getting-started-with-Paint MS Paint is a feature in Windows that you can use to draw colour and edit pictures You can use Paint like a digital sketchpad to make simple pictures creative projects or to add text and designs to other pictures such as those taken with your digital camera The parts of Paint Open Paint by clicking the Start button clicking All Programs clicking Accessories and then clicking Paint When you start Paint youll see an empty window drawing and painting tools are located in the ribbon at the top of the window The following illustration shows the different parts of the Paint window
The Paint window
Foundation Computing
Basic Schematic Diagrams 5957docx Page 33
Working with tools The ribbon in Paint includes a handy collection of drawing tools You can use these tools to create freehand drawings and add a variety of shapes to your pictures This section describes some common tasks For more detailed information on how to use the different tools in Paint see Using Paint Draw a line Some tools and shapes such as the Pencil Brush Line and Curve let you make a variety of straight curved and squiggly lines What you draw is determined by how you move the mouse as you draw You can use the Line to draw a straight line for example
1) On the Home tab in the Shapes group click the Line 2) In the Colors group click Color 1 and then click the color you want to use 3) To draw drag the pointer across the drawing area
Draw a squiggly line Your drawings dont have to be composed of only straight lines The Pencil and Brushes can be used to make completely random free-form shapes
1) On the Home tab in the Tools group click the Pencil tool 2) In the Colors group click Color 1 and then click the color you want to use 3) To draw drag the pointer across the drawing area and make a squiggly line
Note If you want to make a line that has a different appearance use one of the Brushes instead Draw a shape Paint lets you draw many different shapes For example you can draw ready-made defined shapes such as rectangles circles squares triangles and arrows (to name a
few) You can also make your own custom shape by using the Polygon shape to draw a polygon which is a shape that can have any number of sides
1) On the Home tab in the Shapes group click a ready-made shape such as the
Rectangle 2) To add a ready-made shape drag the pointer across the drawing area to make
the shape 3) To change the outline style in the Shapes group click Outline and then click an
outline style 4) If you dont want your shape to have an outline click No outline 5) In the Colors group click Color 1 and then click a color for the outline 6) In the Colors group click Color 2 and then click a color to use to fill the shape 7) To change the fill style in the Shapes group click Fill and then click a fill style 8) If you dont want your shape to be filled click No fill
Foundation Computing
Basic Schematic Diagrams 5957docx Page 34
Add text You can also add text to your picture The Text tool lets you add a simple message or title
1) On the Home tab in the Tools group click the Text tool 2) Drag the pointer in the drawing area where you want to add text 3) Under Text Tools on the Text tab click the font face size and style in the Font
group The Font group
4) In the Colors group click Color 1 and then click a color This is the text color 5) Type the text that you want to add
Erase part of your picture If you make a mistake or need to change part of a picture use the eraser By default the eraser changes any area you erase to white but you can change the eraser color For example if you set the background color to yellow anything you erase turns to yellow
1) On the Home tab in the Tools group click the Eraser tool 2) In the Colors group click Color 2 and then click the color that you want to erase
with If you want to erase with white you dont have to select a color 3) Drag the pointer over the area you want to erase
Saving a picture Save your picture frequently so you dont accidentally lose your work To save click the
Paint button and then click Save This saves all of the changes made to the picture since the last time you saved The very first time that you save a new picture you will need to give your picture a file name Follow these steps
1) Click the Paint button and then click Save 2) In the Save as type box select the file format you want 3) In the File name box type a name and then click Save
Foundation Computing
Basic Schematic Diagrams 5957docx Page 35
Topic 4 Designing your diagram Although there are many different types of schematic diagrams the basic process and principles involved in designing a clear and coherent diagram are similar The principles apply to designing an electrical circuit diagram an organisation chart a mind map a flow chart and many other diagrams Some of these principles are also worth applying to other disciplines such as designing a Web page Letrsquos work step-by-step through the process of creating a flow chart to help people make money selling things on an on-line auction site such as wwwtrademeconz or wwwebaycom
Step 1 Gather your information Start by brainstorming all the information you need to include in your diagram Write down everything you think might be important or should be included
trademe
choose things that
sell
good photograph
feedback
keep track
prompt answers
postage
auction length
similar listings
postal system
setting reserve
describing item
correct category
re-listing
fixed offers
Look at the information you have gathered and think about your target audience Highlight the information that is most important to your target audience Cross out any irrelevant information Put question marks next to information that you are unsure about or may be able to leave out
Foundation Computing
Basic Schematic Diagrams 5957docx Page 36
Step 2 Organise your information Take the information that you have left and sort through it How you organise your information will depend on the type of diagram you are designing For example an organisationrsquos chart usually has different levels and shows who its members report to so you might group people by department and by level A flow chart like the example wersquore creating usually shows a process Information is grouped in the order we would use it If any other steps or information occurs to you as you are organising your information add them in Herersquos an example of how the key steps involved in selling on trademe could be ordered
Choose items that sell
Look at similar listings
Decide on a reserve price
Take a clear photograph
Identify your target audience
Write a clear description
Upload your item
Choose the correct category
Monitor watchers bids and views
Lower your reserve
Fixed price offers
Relist
Step 3 Make connections Once the elements are grouped or arranged in a logical order a clearer picture of the process or system you are representing in your diagram should start to emerge However unlike a list which usually reads from top to bottom only a diagram can show connections in many different directions and working out the links between elements is an essential part of designing a coherent diagram At this stage of the design process it is helpful to sketch out a basic plan of the elements you want to include and the flow-lines or connections between them In order to work out the connections between the elements ask questions such as What happens ifhellip What do I do beforeafter this What decisions need to be made now What actions need to be taken Use arrows to show connections between elements group elements that are part of the same stage or level of the process next to or near to each other and use shapes to show which elements are similar to each other eg diamonds for decisions rectangles for instructions or actions Make up your own meanings for shapes if necessary but be sure to use them consistently
Foundation Computing
Basic Schematic Diagrams 5957docx Page 37
The flow chart below shows how our list of elements above changes and gets re-ordered as we ask these questions and organise the information into a logical and coherent diagram
Decide on your
reserve price
START
Relist
Take a photo that is
clear and item looks
good
Decide on your
ideal buyer
Write a description
of your item
highlighting its
benefits for your
buyer
Upload your item in
a category your
buyer is likely to be
looking in
Monitor how many
views watchers and
bids your item gets
Lower your reserve
Item meets reserve
and sellsItem doesnrsquot sell
Offer to watchers for
your reserve
Decide what you
want to sell
Check what similar
items are currently
selling for
Lots of views but
no watchers
No interestFINISH
Foundation Computing
Basic Schematic Diagrams 5957docx Page 38
Step 4 Test your diagram The final step in designing your diagram is checking that it is as effective as possible To do this you should work through each stage step by step challenging it as you go Picture the process in your mind as you follow the links checking that you have included all the actions and decisions required that they are in the correct order and that no steps are duplicated Once yoursquore confident that the diagram is correct look at it again critically to see if you can improve it or clarify it Is there anywhere you can simplify it by removing unnecessary steps Is there anywhere that seems vague and would be easier to understand if you added a step or a connector Now imagine that you are a member of your target audience For a moment try to forget everything you know about the system or process you have designed a diagram for except for what your target audience knows Look at the diagram with fresh eyes does it make sense to you now Does anything seem odd confusing or out of place Finally look at the layout of your diagram Is it easy to read and follow Have you used shapes texts and arrows consistently Are your shapes and texts uniform and lined up properly Are your connectors clearly defined or are they criss-crossing all over each other Check the spelling of labels carefully ndash go through letter by letter to make sure all names and technical or unfamiliar terms are correct
Discussion With a partner look critically at our example diagram above Discuss any parts of it that you think could be better and any changes you would make to improve the readability of the flow chart Make note on the flow chart above of any areas that you think could be improved Share your answers with the rest of the class
Foundation Computing
Basic Schematic Diagrams 5957docx Page 39
Self Test 1) Mr Biggles owns Biggles Air Supplies a company that makes aircraft supplies He asks you to create an organisation chart for his company He gives you the following list of all his employees and who they report to
Mr James Biggles Chief Executive Officer
Jane Doep Personal Assistant to CEO
Mrs Monica Stepworth Financial Manager (reports to CEO)
Judith Zantes Accountant (reports to Financial Manager)
Mary Smallville Accountant (reports to Financial Manager)
Janey Poretuna Admin Assistant (reports to Judith Zantes)
Mickey Laluevu IT technician (reports to Financial Manager)
Mr Hank Johnson Operations Manager (reports to CEO)
Frank Hapil Engineering Manager (reports to Operations Manager)
Joe Smither Engineering Supervisor (reports to Engineering Manager)
Howie Fartherton Engineering Technician (reports to Engineering Supervisor)
Ernie Jusef Engineering Technician (reports to Engineering Supervisor)
Rob Luxemburg Apprentice Technician (reports to Ernie Jusef)
Harry Monahan Interiors Manager (reports to Operations Manager)
Barney Jokka Interiors Technician (reports to Interiors Supervisor) Design an organisation chart for Biggles Air Supplies and draw it in the space below
2) Think of a simple process that has at least five steps and involves some form of feedback or choice For example operating a vending machine topping up your mobile phone using EFTPOS checking messages on an answering machine
Design a flow chart to represent your process
Foundation Computing
Basic Schematic Diagrams 5957docx Page 40
Self Test Answers
1) Mr Biggles owns Biggles Air Supplies a company that makes aircraft supplies He asks you to create an organisation chart for his company He gives you the following list of all his employees and who they report to
Mr James Biggles Chief Executive Officer
Jane Doep Personal Assistant to CEO
Mrs Monica Stepworth Financial Manager (reports to CEO)
Judith Zantes Accountant (reports to Financial Manager)
Mary Smallville Accountant (reports to Financial Manager)
Janey Poretuna Admin Assistant (reports to Judith Zantes)
Mickey Laluevu IT technician (reports to Financial Manager)
Mr Hank Johnson Operations Manager (reports to CEO)
Frank Hapil Engineering Manager (reports to Operations Manager)
Joe Smither Engineering Supervisor (reports to Engineering Manager)
Howie Fartherton Engineering Technician (reports to Engineering Supervisor)
Ernie Jusef Engineering Technician (reports to Engineering Supervisor)
Rob Luxemburg Apprentice Technician (reports to Ernie Jusef)
Harry Monahan Interiors Manager (reports to Operations Manager)
Barney Jokka Interiors Technician (reports to Interiors Supervisor) Design an organisation chart for Biggles Air Supplies and draw it in the space below
Mr James Biggles
CEO
Jane Doep
Personal
Assistant
Mrs Monica Stepworth
Financial Manager
Judith Zantes
Accountant
Janey Poretuna
Admin Assistant
Mary Smallville
Accountant
Mickey Laluevu
IT technician
Mr Hank Johnson
Operations Manager
Frank Hapil
Engineering
Manager
Harry Monahan
Interiors Manager
Joe Smither
Engineering
Supervisor
Howie Fartherton
Engineering
Technician
Ernie Jusef
Engineering
Technician
Rob Luxemburg
Apprentice
Technician
Barney Jokka
Interiors
Technician
Foundation Computing
Basic Schematic Diagrams 5957docx Page 41
2) Think of a simple process that has at least five steps and involves some form of feedback or choice For example operating a vending machine topping up your mobile phone using EFTPOS checking messages on an answering machine
Design a flow chart to represent your process
Dial 06345
Enter your dialing code and
phone number followed by
the key
Dial number for
service you require
Listen to saved messagesListen to new messages
Dial number for
service you require
Save message Delete message
START
FINISH
Dial 2
Dial 1
Dial 1
Dial 2
Dial 1
Dial 2
Foundation Computing
Basic Schematic Diagrams 5957docx Page 42
Foundation Computing
Basic Schematic Diagrams 5957docx Page 43
Part 2
Produce schematic diagrams from a given brief using a computer application
OBJECTIVES
On successful completion of this section you will be able to Produce schematic diagrams from a given brief using a computer application
Performance criteria
21 The symbols used in each diagram are consistent with the type of diagram and the specifications of the brief
22 The final diagram is readable clearly illustrates the object being diagrammed
and is consistent with the specifications of the brief
TOPICS
Topic 1 Symbols used are consistent with diagram type and specifications Topic 2 Diagram is clear readable and consistent with specifications
Self Test
Self Test Answers
Foundation Computing
Basic Schematic Diagrams 5957docx Page 44
TOPIC 1 Symbols used are consistent with diagram type and specifications A symbol is something such as an object picture written word sound or particular mark that represents something else by association resemblance or convention For example a red octagon may be a symbol for STOP On maps crossed sabres may indicate a battlefield Numerals are symbols for numbers All language consists of symbols The word cat is not a cat but is an arbitrary symbol representing the idea of a cat There are many symbols for many things Examples range from Peace Pipe Red Cross to Electrical symbols It is good when doing schematic drawings to use symbols that are clearly recognised and interpreted Symbols that have been internationally standardised are the best Circuit diagram symbols have differed from country to country and have changed over time They are now to a large extent internationally standardized Simple components often had symbols intended to represent some feature of the physical construction of the device There are several national and international standards for graphical symbols in circuit diagrams in particular
IEC 60617 (also known as British Standard BS 3939)
ANSI standard Y32 (also known as IEEE Std 315) IEC 60617 originally consisted of 13 parts from resistors and capacitors to logic symbols and even a generalised drawing standard of connections and bus line widths It is now published as a subscription online database IEC 60617-DB Different symbols may be used depending on the discipline using the drawing for example lighting and power symbols used as part of architectural drawings may be different from symbols for devices used in electronics Different electronic components have different characteristics it is necessary to distinguish between them in any circuit diagram Of course we could use the block diagram approach and just identify each component with words Unfortunately this takes up a lot of space and makes the overall diagram harder to recognize or understand quickly We need a way to understand electrical diagrams far more quickly and easily
Foundation Computing
Basic Schematic Diagrams 5957docx Page 45
The answer is to use schematic symbols to represent electronic components as shown in the diagram below In this diagram we show the schematic symbol of a battery as the electrical source and the symbol of a resistor as the load Even without the words and arrows the symbols define exactly what this circuit is and how it behaves
Some good procedures to follow with symbols include
Using templates for frequently used symbols
Use symbols consistently
Use a library of symbols such as from IEC 60617-DB
Foundation Computing
Basic Schematic Diagrams 5957docx Page 46
TOPIC 2 Diagram is clear readable and consistent with specifications Creating a simple diagram using MSPaint To start with letrsquos create a simple flow chart representing the stages in designing a schematic diagram There are four stages in this process
1) Gather your information 2) Organise your information 3) Make connections 4) Test your diagram
Our flow chart will consist of four rectangles arranged vertically with downward pointing arrows as connectors A rounded rectangle at the top and at the bottom of the flowchart will indicate START and FINISH respectively Step by step
Open Microsoft Paint
Click on the Rectangle tool then click and drag in the drawing area to draw a rectangle
Repeat this step to draw four boxes in the drawing area OR click on the Select tool and click and drag to select the first rectangle then right-click to copy and paste three more rectangles the same size in the drawing area
Foundation Computing
Basic Schematic Diagrams 5957docx Page 47
Using the Rounded Rectangle tool draw a rounded rectangle at the top and bottom of your flow chart
Foundation Computing
Basic Schematic Diagrams 5957docx Page 48
Use the Line tool to draw arrows between each box In the Options area under the Tool bar you can choose the thickness of line that you want to use Remember too that if you hold down the Shift key on the keyboard while you are drawing a line you can create a 45 degree angle
Use the Text tool to add text to the shapes by clicking on the Text tool clicking and dragging to create a textbox inside your shape then typing your text Check your spelling carefully letter by letter as you go
Foundation Computing
Basic Schematic Diagrams 5957docx Page 49
The basic flowchart created in Microsoft Paint could look something like this
Foundation Computing
Basic Schematic Diagrams 5957docx Page 50
Common problems with diagrams Even well-designed schematic diagrams will be difficult for the target audience to read and understand if symbols are used inconsistently or the layout of the diagram is unfamiliar For example if a flowchart has different shapes used for each element and different types of arrows used randomly it will be more difficult for readers to see the overall direction and meaning of the diagram If the shapes on an organisation chart are different sizes and randomly positioned with no clear levels or hierarchy the diagram will not provide a clear overview of the organisationrsquos structure If an electrical circuit diagram has unfamiliar symbols used for elements such as switches resistors and batteries then it will not make sense to its intended audience
Tips for improving the readability of your schematic diagrams
Use symbols and shapes consistently ie elements that are similar should have the same symbol or shape
Avoid having connectors crossing over each other
Avoid having symbols or shapes overlapping
Use arrows on connectors or flow lines to indicate direction
Use colours text size and font consistently
Diagrams that can be read top-to-bottom and left-to-right are easier to read
In a process diagram have only one connector leading into a symbol but have more coming out where necessary to indicate different directions or decisions
Diagrams for a technical audience such as electrical or computer programming schematics should follow accepted conventions for symbols and layout
Diagrams indicating a hierarchy of positions ideas or stages are clearer if elements belonging to the same level are a similar shape size and position on the page
Keep labels as clear and as brief as possible Carefully check the spelling of all names and labels letter by letter ndash errors in the spelling of names or scientific and technical terms look unprofessional and can be confusing for readers
Foundation Computing
Basic Schematic Diagrams 5957docx Page 51
Self Test Look at the schematic diagrams that follow Make notes under each example of what is wrong with the diagram what is right about the diagram and what could be changed to make it clear and meaningful to its intended audience 1) This flow chart is supposed to show police officers how to get a suspect to confess to a crime
START
Confidently accuse
suspect of crime
Describe a
scenario that
enables suspect
to admit guiltAllow suspect to
voice objections
Invade suspectrsquos
personal space
Suspect becomes
uncomfortable
Suspect
doesnrsquot
deny guilt
Suspect
denies guilt
No reaction
Elicit confession
Rephrase objections as
confessions
FINISH
Foundation Computing
Basic Schematic Diagrams 5957docx Page 52
2) The following diagram is an organisation chart for Widget Enterprises
John Smith
MANAGER
Seth Drew
IT MANAGER
May Furur
SECRETARY
Judith Holland
CUSTOMER SERVICES manager
Jad Ling
HELPDESK
Harry Petal
FINANCIAL MANAGER
Wanda Springer
MARKETING
MANAGER
Bob Smithells
CLEANER
Kelly Inlerl
MARKETING ASSISTANT
Beryl Thin
CUSTOMER SERVICES ASSISTANTValda Rigley
CUSTOMER
SERVICES
ASSISTANT
Levi Quayle
COMPUTER
TECHNICIAN
3) Which of the following computer applications can be used to create schematic diagrams
a) Microsoft Visio
b) Microsoft Paint
c) Microsoft Word
d) All of the above
4) Which frequently used shapes does the Microsoft Paint Tool bar contain templates for
5) Where in the Microsoft Paint window would you be able to select the thickness of line that you wanted for a brushstroke 6) Identify the purpose and intended audience for a diagram showing a businessrsquos marketing plan 7) Name two characteristics of well-designed schematic diagrams 8) Identify four steps involved in designing schematic diagrams 9) Why is it important to use conventionally accepted and familiar shapes and symbols in your schematic diagrams
Foundation Computing
Basic Schematic Diagrams 5957docx Page 53
Self Test Answers 1) This flow chart is supposed to show police officers how to get a suspect to confess to a crime
START
Confidently accuse
suspect of crime
Describe a
scenario that
enables suspect
to admit guiltAllow suspect to
voice objections
Invade suspectrsquos
personal space
Suspect becomes
uncomfortable
Suspect
doesnrsquot
deny guilt
Suspect
denies guilt
No reaction
Elicit confession
Rephrase objections as
confessions
FINISH
Random shapes are meaningless and confusing ndash use conventional flow chart symbols
Stages of process are not clear ndash arrange shapes top to bottom with options at each stage branching off to side at same level
Connectors that are either straight or curved would be more consistent
Labels are clear
Text uses consistent font and size
Foundation Computing
Basic Schematic Diagrams 5957docx Page 54
2) The following diagram is an organisation chart for Widget Enterprises
John Smith
MANAGER
Seth Drew
IT MANAGER
May Furur
SECRETARY
Judith Holland
CUSTOMER SERVICES manager
Jad Ling
HELPDESK
Harry Petal
FINANCIAL MANAGER
Wanda Springer
MARKETING
MANAGER
Bob Smithells
CLEANER
Kelly Inlerl
MARKETING ASSISTANT
Beryl Thin
CUSTOMER SERVICES ASSISTANTValda Rigley
CUSTOMER
SERVICES
ASSISTANT
Levi Quayle
COMPUTER
TECHNICIAN
No clear levels to hierarchy ndash organise so that diagram reads top to bottom and positions at similar level are in same horizontal space
Different sized boxes and borders on some boxes are meaningless ndash need consistent style for similar elements
Connectors cross over each other and boxes overlap ndash arrange space to avoid this
Text size and font is mostly consistent but one typo needs correcting
3) Which of the following computer applications can be used to create schematic diagrams
a) Microsoft Visio
b) Microsoft Paint
c) Microsoft Word
d) All of the above correct
4) Which frequently used shapes does the Microsoft Paint Tool bar contain templates for
Polygon rectangle ovalellipse
Foundation Computing
Basic Schematic Diagrams 5957docx Page 55
5) Where in the Microsoft Paint window would you be able to select the thickness of line that you wanted for a brushstroke
Options area below the Toolbar
6) Identify the purpose and intended audience for a diagram showing a businessrsquos marketing plan
The purpose would be to provide an overview of the businessrsquos marketing strategy Audience could include management and employees of the business especially the Marketing department potential investors shareholders and directors of the business
7) Name two characteristics of well-designed schematic diagrams Any of simple easy for the target audience to understand include all relevant elements or parts of the process clear and logical connections between elements accurate 8) Identify four steps involved in designing schematic diagrams Gather information organise information make connections between elements test your diagram 9) Why is it important to use conventionally accepted and familiar shapes and
symbols in your schematic diagrams So that the diagram will be easily understood by the target audience
Foundation Computing
Basic Schematic Diagrams 5957docx Page 56
References httpwindowsmicrosoftcomen-NZwindows7Getting-started-with-Paint accessed Sat 5th December in Timaru New Zealand httpenwikipediaorgwikiSchematic_diagrams accessed Sat 5th December in Timaru New Zealand httpenwikipediaorgwikiSymbol accessed Sat 5th December in Timaru New Zealand
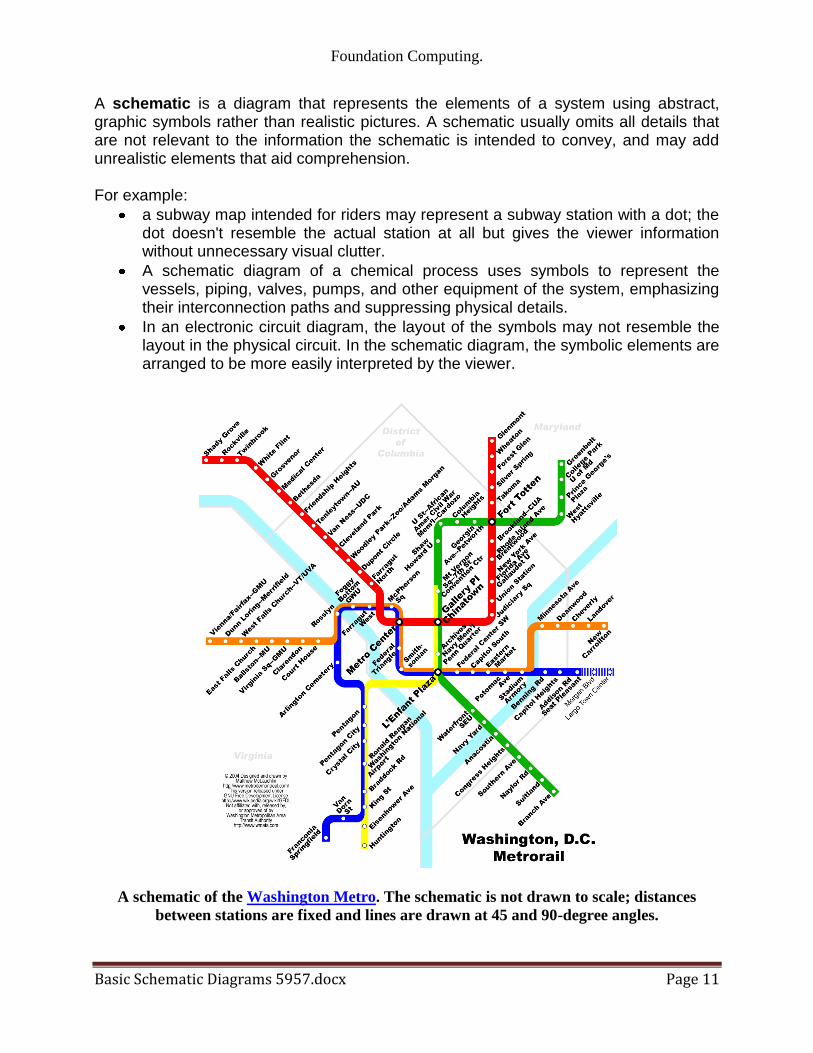
Foundation Computing
Basic Schematic Diagrams 5957docx Page 11
A schematic is a diagram that represents the elements of a system using abstract graphic symbols rather than realistic pictures A schematic usually omits all details that are not relevant to the information the schematic is intended to convey and may add unrealistic elements that aid comprehension For example
a subway map intended for riders may represent a subway station with a dot the dot doesnt resemble the actual station at all but gives the viewer information without unnecessary visual clutter
A schematic diagram of a chemical process uses symbols to represent the vessels piping valves pumps and other equipment of the system emphasizing their interconnection paths and suppressing physical details
In an electronic circuit diagram the layout of the symbols may not resemble the layout in the physical circuit In the schematic diagram the symbolic elements are arranged to be more easily interpreted by the viewer
A schematic of the Washington Metro The schematic is not drawn to scale distances
between stations are fixed and lines are drawn at 45 and 90-degree angles
Foundation Computing
Basic Schematic Diagrams 5957docx Page 12
In the electrical industry a schematic diagram is often used to describe the design of equipment Schematic diagrams are often used for the maintenance and repair of electronic and electromechanical systems Original schematics were done by hand using standardized templates or pre-printed adhesive symbols but today Electrical CAD software is often used Schematic diagrams are used extensively in repair manuals to help users understand the interconnections of parts and to provide graphical instruction to assist in taking apart and rebuilding mechanical assemblies Many automotive and motorcycle repair manuals devote a significant number of pages to schematic diagrams
Exercise 1 See if you can match each of the names in the box with one of the schematic diagrams below
Flow Chart
Organisation Chart
Electrical circuit
Mind map A)
Marketing Plan
Placement
ProductPromotion
Price
Competitive
weaknesses
Competitive
strengths
New features
Trade shows
Mailings
Advertising
B)
Jeremy Nash
CEO
Adam Jurgensen
Operations
Manager
Aneru Jacobs
Sales and
Marketing
Obed Tambo
District Coodinator
Manaia Pehi
Financial
Manager
Hashim Mohamed
Accountant
Janet Brookes
Personal Assistant
Steven Alleroo
IT Manager
Cindy Wahoo
Technician
Foundation Computing
Basic Schematic Diagrams 5957docx Page 13
C)
120V
480V
U
L
L
U
LOR
RESET
OL
TR2
TR3
VIB
VIB
WTR
MOTOR
BLOWER
PS
LOR
ON-OFF
SS
TR3
START
M
START
RUN
HAND
OFF
REMOTE
LOR
M
REMOTE
MODE
M
PS
TR1
TR2
S
To LOR COIL CIRCUIT
M
MSH
ON-OFF
R
W
TR1
X1
D
C
B
A
4 3 2 1
D
C
B
A
4 3 2 1
D)
Foundation Computing
Basic Schematic Diagrams 5957docx Page 14
Answers A = Mindmap B = Organisation chart C = Electrical circuit diagram D = Flow chart Schematic diagram production Before suitable computer applications were developed schematic diagrams were produced manually using tools such as typewriters stencils stickers or labels and drawing by hand Sometimes it can be quicker to produce simple schematic diagrams by hand or you may not have a computer available or the computer application available might be too complex or take so long to learn that it makes more sense to use manual methods Alternatively you may have a highly complex schematic diagram that is too big to print out on the computer printers available and would not make sense if spread over a number of pages
Exercise 2) In the space below or on a piece of paper describe some situations in which you would choose to use a computer application to produce your schematic diagram and explain why
Exercise 3) Now describe some situations in which you would choose NOT to produce your schematic diagram using a computer application and explain why not
Exercise 4) Working with a partner brainstorm the advantages and disadvantages of producing schematic diagrams with a computer application rather than by hand
Foundation Computing
Basic Schematic Diagrams 5957docx Page 15
Suggested answers to the exercises 2) In the space below describe some situations in which you would choose to use a computer application to produce your schematic diagram and explain why Situations could include (and there are many more)
Preparing a flow chart to send by email to all the members of a team ndash because doing it on computer would allow me to make multiple copies and email them easily
Producing a complex network diagram as part of a report to present ndash because it would look more professional and could be easily changed or updated
Preparing an organisation chart to include in a computerised slideshow - because it could easily be imported
3) Now describe some situations in which you would choose NOT to produce your schematic diagram using a computer application and explain why not
Situations could include
Presenting an organisation diagram or a flow chart to a community organisation as a one-off event if I did not have access to a large-scale printer or projector I would draw or paint the diagram by hand ndash because it would be the simplest way to make it large enough for everyone to see and I would be unlikely to need more copies
In an assessment situation drawing a mind map or brainstorming diagram to organise my ideas before writing an essay or report ndash because it would be quickest
Working with a team to sketch out a plan for a process because it would be quickest and wouldnrsquot rely on being close to a computer
Foundation Computing
Basic Schematic Diagrams 5957docx Page 16
4) Working with a partner brainstorm the advantages and disadvantages of producing schematic diagrams with a computer application rather than by hand
Your results of your brainstorm might look like this (diagram produced using MS Visio)
Using computers AdvantagesDisadvantages
need to learn
application
can take longer
sometimes difficult
to plan
limited options for
layout
frustrating
too many options
incompatible file
types
can store on
computer
can fit more smaller
text
easy to read
can email to people
use templates
easy to change or
update
Can be quick
easy to make
copies
professional looking
import into
computer
documents
Expensive
equipment needed
technical problems
Security
Foundation Computing
Basic Schematic Diagrams 5957docx Page 17
Process for producing schematic diagrams on computer There are many different computer applications that can be used to produce schematic diagrams Some applications like Microsoft Visio are specifically designed to help you create a wide range of complex schematic diagrams easily However almost any computer application that has a drawing tool can be used to produce a schematic diagram and the process will usually involve the following steps 1) Design the diagram
a Identify your target audience b Collect all the information you need c Arrange your information in a logical order d Test your diagram
2) Create the diagram in the computer application
a Open the drawing window b Draw the shapes you want c Arrange the shapes according to your design d Add connectors between each of the shapes e Add text where required
Designing effective diagrams The main purpose of a schematic diagram is to provide a clear and easy to understand visual overview of how the different parts of a system fit together Schematic diagrams that are well-designed
are as simple as possible
are easy for the target audience to understand
include all relevant elements or parts of the process
have clear and logical connections between elements
communicate an accurate picture of the system or process
Foundation Computing
Basic Schematic Diagrams 5957docx Page 18
Identifying the target audience The target audience is the group of people who will read your schematic diagram The main question you need to ask yourself is Who is my audience In order to identify the target audience for your schematic diagram think about the following
What sort of person will read your diagram Think about that personrsquos job age education language environment and other characteristics that could affect the sort of language and symbols they will understand and relate to
What information will that person look for Why are they reading your diagram What do they want or need to know What information is most important What information is not so important
How much time will that person have to look at your diagram Will they be in a hurry or will they have time to study all the details Does your diagram have to stand alone or will it have a lot of text next to it to explain it
What do you want your audience to learn or do as a result of reading your diagram
What does the diagram need to show What information do you have to include How should this information be arranged
Foundation Computing
Basic Schematic Diagrams 5957docx Page 19
Exercise Complete the table below with information about the target audience and purpose for each of the examples of schematic diagrams given Use the questions above to help you
Example diagram Target audience
You work as an electrician and Mr Jones has asked you to design an electrical wiring plan for the dream house he wants to build
You are a computer programmer and you are using a flowchart to plan a computer program that farmers can use to keep count of their sheep
You have to write an essay about your most embarrassing childhood experience and you create a mindmap to organise your ideas
You are researching your family history and have been asked to create a family tree diagram for a booklet that will be handed out at an upcoming family reunion
Foundation Computing
Basic Schematic Diagrams 5957docx Page 20
Suggested Answer Complete the table below with information about the target audience and purpose for each of the examples of schematic diagrams given Use the questions above to help you
Example diagram Target audience
You work as an electrician and Mr Jones has asked you to design an electrical wiring plan for the dream house he wants to build
Mr Jones his builder local council officials theyrsquoll need detailed information that will be studied in depth and referred to during the planning and building process
You are a computer programmer and you are using a flowchart to plan a computer program that farmers can use to keep count of their sheep
You and other computer programmers will use the flowchart to understand the process of the programme and to identify flaws in its logic
You have to write an essay about your most embarrassing childhood experience and you create a mindmap to organise your ideas
You are the only person who will use your mindmap and you will refer to it as you write your essay
You are researching your family history and have been asked to create a family tree diagram for a booklet that will be handed out at an upcoming family reunion
Members of your family will look for their names and those of relatives in order to see how people are related to each other
Foundation Computing
Basic Schematic Diagrams 5957docx Page 21
TOPIC 2 Identifying the computer application required There are many computer applications that can be used to create schematic diagrams Microsoft Visio is specifically designed for this purpose but any application with basic drawing tools such as those found in Microsoft Word can be used One of the simplest and most widely available computer drawing applications is Microsoft Paint We will use this application is used to demonstrate the tools However most of the tools and principles we will focus on in Microsoft Paint can be found in other drawing applications The following diagram shows the Microsoft Paint window
The tools are arranged to the left of the drawing area in the Tool bar An overview of how to use the tools you need to create a simple schematic diagram is provided below Underneath the Tool bar is the Options box When you click on a tool icon in the Tool bar the options available for that tool appear in the Options box To select an option click on the tool you want to use then click on the option and then click in the drawing area and drag the mouse pointer to draw The Colour palette is underneath the drawing area To use a colour click on the tool you want to use then click on the colour and then click in the drawing area ndash the shape line or text you create will appear in the colour you have selected
Foundation Computing
Basic Schematic Diagrams 5957docx Page 22
Tools Selection Tools Use the selection tools to select the parts of your schematic diagram that you want to work with or change in some way To use these tools click on the button of the tool you want and then click on your diagram and drag until the area you want to work with is selected The Freeform Select tool (on the left) is used to select an irregularly shaped area The Rectangle Select tool is used to select a rectangular area To copy a part of your diagram eg a shape line or text it must first be selected using a selection tool Select Copy from the Edit menu click where you want the copy to be positioned and select Paste from the Edit menu Shapes tools
The shapes tools which can be used to create symbols in schematic diagrams consist of the Rectangle tool for creating squares or rectangles the Polygon tool for creating multi-sided shapes the Rounded Rectangle tool for creating rounded rectangles and the Oval tool for creating circles or ovals These tools provide templates for creating frequently used symbols To use them simply click on the icon of the shape you want to use and drag it onto your diagram where you can resize it if necessary and add text or
Foundation Computing
Basic Schematic Diagrams 5957docx Page 23
effects For the Polygon tool click and drag to draw the first side and click each time you want to change direction Double-click when you have finished To create a perfect circle hold down the Shift key while you are dragging the mouse pointer
Line tools In schematic diagrams line tools can be used to draw connectors between symbols and to draw shapes or symbols
The Straight Line tool creates straight lines simply click on the Straight Line icon click in your picture where you want the line to start and drag to where you want the line to finish The Curve tool will create a curve with at least one and no more than two bends in it click on the Curve icon then click in your picture to draw a straight line and drag to where you want the first bend to be click again where you want the second curve to be and drag to shape the curve You can make more complex shapes by joining lines and curves together
The Pencil tool can be used to draw freeform shapes or lines with as many bends and curves as you want Click on the icon click in your diagram and ldquodrawrdquo with your mouse pointer To draw straight lines hold down the shift key as you are drawing with the mouse
Foundation Computing
Basic Schematic Diagrams 5957docx Page 24
The Paint Brush tool draws freeform lines in the same way as the Pencil tool but can be used to create lines of varying widths and styles To select a paintbrush style click on the Paint Brush icon and then click in the Options box on the style you want to use
The Airbrush tool creates lines with an airbrushed effect of clustered dots It can be used in the same way as the pencil tool to draw freeform shapes or symbols In the Options box you can choose the size of the area covered by the Airbrush tool
Text tool
Add text to your schematic diagram by clicking on the Text icon and clicking in your diagram where you want the text to appear As you drag a rectangle will be formed within which text can be typed The Fonts dialogue box will also open
Foundation Computing
Basic Schematic Diagrams 5957docx Page 25
Fill Tool
The Fill tool will add colour to a shape that you have drawn Click on the icon click on a colour from the colour palette and then click on the shape in the diagram that you want to fill with colour
Zoom tool
Use the Zoom tool to magnify a section of the diagram that you are working with Click on the magnifying glass icon select the size you want in the Options box and click on the part of the image you want to enlarge As the picture zooms in the cursor will change back to the tool you were using before
Adding colour
The Colour box to the left of the Colour palette shows the foreground and background colours you are using If you click on a tool and then drag while holding down the left mouse button the line or shape will be drawn using the foreground colour If you hold down the right mouse button the background colour will be used To use any other colour click on the tool you want to use click on an option (if using) then click on the colour you want from the colour palette As you draw the colour you have clicked on will be used
Foundation Computing
Basic Schematic Diagrams 5957docx Page 26
Additional resources For more detailed information about these tools refer to the Help menu in Microsoft Paint (httpwindowshelpmicrosoftcom )
The following online tutorials may also be useful
httplkwdplorgclassesMSPaintpainthtml
httpwwwlesleyedufacultyahuntMSPttutrhtm
Exercise The example below shows a simple organisation chart produced using Microsoft Paint In the space that follows identify which tools were used to create this schematic diagram and what each tool was used for
Rectangle tool used to create Manager symbol
Oval tool used to create Team Leader symbols
Rounded Rectangle tool used for Team member symbols
Straight line tool used to create connectors
Text tool used to add text to shapes
Rectangle Select tool used to select shapes to move into
position
Foundation Computing
Basic Schematic Diagrams 5957docx Page 27
Suggested Answer The example below shows a simple organisation chart produced using Microsoft Paint In the space that follows identify which tools were used to create this schematic diagram and what each tool was used for
Rectangle tool used to create Manager symbol
Oval tool used to create Team Leader symbols
Rounded Rectangle tool used for Team member symbols
Straight line tool used to create connectors
Text tool used to add text to shapes
Rectangle Select tool used to select shapes to move into position
Foundation Computing
Basic Schematic Diagrams 5957docx Page 28
Exercise Which tools would you use to produce the following symbols or diagrams and why
Symbol Tools and justification
Resistor (Electrical circuit diagram)
Speaker (Electrical circuit diagram)
AC
AC source (Electrical circuit diagram)
Start or end of process (Flowchart)
Decision (yes or no) (Flowchart)
Instructions or actions (Flowchart)
Foundation Computing
Basic Schematic Diagrams 5957docx Page 29
Symbol Tools and justification
Document produced (Flowchart)
Data entered or received (Flowchart)
Foundation Computing
Basic Schematic Diagrams 5957docx Page 30
Suggested Answers Which tools would you use to produce the following symbols or diagrams and why
Symbol Tools and justification
Resistor (Electrical circuit diagram)
Straight line tool (hold down shift key)It creates regular 45 degree angled lines that are perfectly straight
Speaker (Electrical circuit diagram)
Polygon tool (hold down shift key) Rectangle tool and Straight line tool These are used in order to create a symbol with uniform angles and straight edges
AC
AC source (Electrical circuit diagram)
Oval tool (hold down shift key) to draw circle Curve tool to draw wavy line Straight line tool and Text tool These tools produce cleaner shapes than drawing freeform
Start or end of process (Flowchart)
Rounded rectangle tool This provides a template for creating this symbol
Decision (yes or no) (Flowchart)
Polygon tool This creates more accurate joins between sides than the Straight line tool
Instructions or actions (Flowchart)
Rectangle tool It provides a template for drawing this shape
Foundation Computing
Basic Schematic Diagrams 5957docx Page 31
Symbol Tools and justification
Document produced (Flowchart)
Line tool and Curve tool ndash need two tools in MSPaint other applications may have a template for this shape
Data entered or received (Flowchart)
Polygon tool ndash better than Straight line tool because can produce more regular shape
Foundation Computing
Basic Schematic Diagrams 5957docx Page 32
TOPIC 3 Getting started with MS Paint Sourced from httpwindowsmicrosoftcomen-NZwindows7Getting-started-with-Paint MS Paint is a feature in Windows that you can use to draw colour and edit pictures You can use Paint like a digital sketchpad to make simple pictures creative projects or to add text and designs to other pictures such as those taken with your digital camera The parts of Paint Open Paint by clicking the Start button clicking All Programs clicking Accessories and then clicking Paint When you start Paint youll see an empty window drawing and painting tools are located in the ribbon at the top of the window The following illustration shows the different parts of the Paint window
The Paint window
Foundation Computing
Basic Schematic Diagrams 5957docx Page 33
Working with tools The ribbon in Paint includes a handy collection of drawing tools You can use these tools to create freehand drawings and add a variety of shapes to your pictures This section describes some common tasks For more detailed information on how to use the different tools in Paint see Using Paint Draw a line Some tools and shapes such as the Pencil Brush Line and Curve let you make a variety of straight curved and squiggly lines What you draw is determined by how you move the mouse as you draw You can use the Line to draw a straight line for example
1) On the Home tab in the Shapes group click the Line 2) In the Colors group click Color 1 and then click the color you want to use 3) To draw drag the pointer across the drawing area
Draw a squiggly line Your drawings dont have to be composed of only straight lines The Pencil and Brushes can be used to make completely random free-form shapes
1) On the Home tab in the Tools group click the Pencil tool 2) In the Colors group click Color 1 and then click the color you want to use 3) To draw drag the pointer across the drawing area and make a squiggly line
Note If you want to make a line that has a different appearance use one of the Brushes instead Draw a shape Paint lets you draw many different shapes For example you can draw ready-made defined shapes such as rectangles circles squares triangles and arrows (to name a
few) You can also make your own custom shape by using the Polygon shape to draw a polygon which is a shape that can have any number of sides
1) On the Home tab in the Shapes group click a ready-made shape such as the
Rectangle 2) To add a ready-made shape drag the pointer across the drawing area to make
the shape 3) To change the outline style in the Shapes group click Outline and then click an
outline style 4) If you dont want your shape to have an outline click No outline 5) In the Colors group click Color 1 and then click a color for the outline 6) In the Colors group click Color 2 and then click a color to use to fill the shape 7) To change the fill style in the Shapes group click Fill and then click a fill style 8) If you dont want your shape to be filled click No fill
Foundation Computing
Basic Schematic Diagrams 5957docx Page 34
Add text You can also add text to your picture The Text tool lets you add a simple message or title
1) On the Home tab in the Tools group click the Text tool 2) Drag the pointer in the drawing area where you want to add text 3) Under Text Tools on the Text tab click the font face size and style in the Font
group The Font group
4) In the Colors group click Color 1 and then click a color This is the text color 5) Type the text that you want to add
Erase part of your picture If you make a mistake or need to change part of a picture use the eraser By default the eraser changes any area you erase to white but you can change the eraser color For example if you set the background color to yellow anything you erase turns to yellow
1) On the Home tab in the Tools group click the Eraser tool 2) In the Colors group click Color 2 and then click the color that you want to erase
with If you want to erase with white you dont have to select a color 3) Drag the pointer over the area you want to erase
Saving a picture Save your picture frequently so you dont accidentally lose your work To save click the
Paint button and then click Save This saves all of the changes made to the picture since the last time you saved The very first time that you save a new picture you will need to give your picture a file name Follow these steps
1) Click the Paint button and then click Save 2) In the Save as type box select the file format you want 3) In the File name box type a name and then click Save
Foundation Computing
Basic Schematic Diagrams 5957docx Page 35
Topic 4 Designing your diagram Although there are many different types of schematic diagrams the basic process and principles involved in designing a clear and coherent diagram are similar The principles apply to designing an electrical circuit diagram an organisation chart a mind map a flow chart and many other diagrams Some of these principles are also worth applying to other disciplines such as designing a Web page Letrsquos work step-by-step through the process of creating a flow chart to help people make money selling things on an on-line auction site such as wwwtrademeconz or wwwebaycom
Step 1 Gather your information Start by brainstorming all the information you need to include in your diagram Write down everything you think might be important or should be included
trademe
choose things that
sell
good photograph
feedback
keep track
prompt answers
postage
auction length
similar listings
postal system
setting reserve
describing item
correct category
re-listing
fixed offers
Look at the information you have gathered and think about your target audience Highlight the information that is most important to your target audience Cross out any irrelevant information Put question marks next to information that you are unsure about or may be able to leave out
Foundation Computing
Basic Schematic Diagrams 5957docx Page 36
Step 2 Organise your information Take the information that you have left and sort through it How you organise your information will depend on the type of diagram you are designing For example an organisationrsquos chart usually has different levels and shows who its members report to so you might group people by department and by level A flow chart like the example wersquore creating usually shows a process Information is grouped in the order we would use it If any other steps or information occurs to you as you are organising your information add them in Herersquos an example of how the key steps involved in selling on trademe could be ordered
Choose items that sell
Look at similar listings
Decide on a reserve price
Take a clear photograph
Identify your target audience
Write a clear description
Upload your item
Choose the correct category
Monitor watchers bids and views
Lower your reserve
Fixed price offers
Relist
Step 3 Make connections Once the elements are grouped or arranged in a logical order a clearer picture of the process or system you are representing in your diagram should start to emerge However unlike a list which usually reads from top to bottom only a diagram can show connections in many different directions and working out the links between elements is an essential part of designing a coherent diagram At this stage of the design process it is helpful to sketch out a basic plan of the elements you want to include and the flow-lines or connections between them In order to work out the connections between the elements ask questions such as What happens ifhellip What do I do beforeafter this What decisions need to be made now What actions need to be taken Use arrows to show connections between elements group elements that are part of the same stage or level of the process next to or near to each other and use shapes to show which elements are similar to each other eg diamonds for decisions rectangles for instructions or actions Make up your own meanings for shapes if necessary but be sure to use them consistently
Foundation Computing
Basic Schematic Diagrams 5957docx Page 37
The flow chart below shows how our list of elements above changes and gets re-ordered as we ask these questions and organise the information into a logical and coherent diagram
Decide on your
reserve price
START
Relist
Take a photo that is
clear and item looks
good
Decide on your
ideal buyer
Write a description
of your item
highlighting its
benefits for your
buyer
Upload your item in
a category your
buyer is likely to be
looking in
Monitor how many
views watchers and
bids your item gets
Lower your reserve
Item meets reserve
and sellsItem doesnrsquot sell
Offer to watchers for
your reserve
Decide what you
want to sell
Check what similar
items are currently
selling for
Lots of views but
no watchers
No interestFINISH
Foundation Computing
Basic Schematic Diagrams 5957docx Page 38
Step 4 Test your diagram The final step in designing your diagram is checking that it is as effective as possible To do this you should work through each stage step by step challenging it as you go Picture the process in your mind as you follow the links checking that you have included all the actions and decisions required that they are in the correct order and that no steps are duplicated Once yoursquore confident that the diagram is correct look at it again critically to see if you can improve it or clarify it Is there anywhere you can simplify it by removing unnecessary steps Is there anywhere that seems vague and would be easier to understand if you added a step or a connector Now imagine that you are a member of your target audience For a moment try to forget everything you know about the system or process you have designed a diagram for except for what your target audience knows Look at the diagram with fresh eyes does it make sense to you now Does anything seem odd confusing or out of place Finally look at the layout of your diagram Is it easy to read and follow Have you used shapes texts and arrows consistently Are your shapes and texts uniform and lined up properly Are your connectors clearly defined or are they criss-crossing all over each other Check the spelling of labels carefully ndash go through letter by letter to make sure all names and technical or unfamiliar terms are correct
Discussion With a partner look critically at our example diagram above Discuss any parts of it that you think could be better and any changes you would make to improve the readability of the flow chart Make note on the flow chart above of any areas that you think could be improved Share your answers with the rest of the class
Foundation Computing
Basic Schematic Diagrams 5957docx Page 39
Self Test 1) Mr Biggles owns Biggles Air Supplies a company that makes aircraft supplies He asks you to create an organisation chart for his company He gives you the following list of all his employees and who they report to
Mr James Biggles Chief Executive Officer
Jane Doep Personal Assistant to CEO
Mrs Monica Stepworth Financial Manager (reports to CEO)
Judith Zantes Accountant (reports to Financial Manager)
Mary Smallville Accountant (reports to Financial Manager)
Janey Poretuna Admin Assistant (reports to Judith Zantes)
Mickey Laluevu IT technician (reports to Financial Manager)
Mr Hank Johnson Operations Manager (reports to CEO)
Frank Hapil Engineering Manager (reports to Operations Manager)
Joe Smither Engineering Supervisor (reports to Engineering Manager)
Howie Fartherton Engineering Technician (reports to Engineering Supervisor)
Ernie Jusef Engineering Technician (reports to Engineering Supervisor)
Rob Luxemburg Apprentice Technician (reports to Ernie Jusef)
Harry Monahan Interiors Manager (reports to Operations Manager)
Barney Jokka Interiors Technician (reports to Interiors Supervisor) Design an organisation chart for Biggles Air Supplies and draw it in the space below
2) Think of a simple process that has at least five steps and involves some form of feedback or choice For example operating a vending machine topping up your mobile phone using EFTPOS checking messages on an answering machine
Design a flow chart to represent your process
Foundation Computing
Basic Schematic Diagrams 5957docx Page 40
Self Test Answers
1) Mr Biggles owns Biggles Air Supplies a company that makes aircraft supplies He asks you to create an organisation chart for his company He gives you the following list of all his employees and who they report to
Mr James Biggles Chief Executive Officer
Jane Doep Personal Assistant to CEO
Mrs Monica Stepworth Financial Manager (reports to CEO)
Judith Zantes Accountant (reports to Financial Manager)
Mary Smallville Accountant (reports to Financial Manager)
Janey Poretuna Admin Assistant (reports to Judith Zantes)
Mickey Laluevu IT technician (reports to Financial Manager)
Mr Hank Johnson Operations Manager (reports to CEO)
Frank Hapil Engineering Manager (reports to Operations Manager)
Joe Smither Engineering Supervisor (reports to Engineering Manager)
Howie Fartherton Engineering Technician (reports to Engineering Supervisor)
Ernie Jusef Engineering Technician (reports to Engineering Supervisor)
Rob Luxemburg Apprentice Technician (reports to Ernie Jusef)
Harry Monahan Interiors Manager (reports to Operations Manager)
Barney Jokka Interiors Technician (reports to Interiors Supervisor) Design an organisation chart for Biggles Air Supplies and draw it in the space below
Mr James Biggles
CEO
Jane Doep
Personal
Assistant
Mrs Monica Stepworth
Financial Manager
Judith Zantes
Accountant
Janey Poretuna
Admin Assistant
Mary Smallville
Accountant
Mickey Laluevu
IT technician
Mr Hank Johnson
Operations Manager
Frank Hapil
Engineering
Manager
Harry Monahan
Interiors Manager
Joe Smither
Engineering
Supervisor
Howie Fartherton
Engineering
Technician
Ernie Jusef
Engineering
Technician
Rob Luxemburg
Apprentice
Technician
Barney Jokka
Interiors
Technician
Foundation Computing
Basic Schematic Diagrams 5957docx Page 41
2) Think of a simple process that has at least five steps and involves some form of feedback or choice For example operating a vending machine topping up your mobile phone using EFTPOS checking messages on an answering machine
Design a flow chart to represent your process
Dial 06345
Enter your dialing code and
phone number followed by
the key
Dial number for
service you require
Listen to saved messagesListen to new messages
Dial number for
service you require
Save message Delete message
START
FINISH
Dial 2
Dial 1
Dial 1
Dial 2
Dial 1
Dial 2
Foundation Computing
Basic Schematic Diagrams 5957docx Page 42
Foundation Computing
Basic Schematic Diagrams 5957docx Page 43
Part 2
Produce schematic diagrams from a given brief using a computer application
OBJECTIVES
On successful completion of this section you will be able to Produce schematic diagrams from a given brief using a computer application
Performance criteria
21 The symbols used in each diagram are consistent with the type of diagram and the specifications of the brief
22 The final diagram is readable clearly illustrates the object being diagrammed
and is consistent with the specifications of the brief
TOPICS
Topic 1 Symbols used are consistent with diagram type and specifications Topic 2 Diagram is clear readable and consistent with specifications
Self Test
Self Test Answers
Foundation Computing
Basic Schematic Diagrams 5957docx Page 44
TOPIC 1 Symbols used are consistent with diagram type and specifications A symbol is something such as an object picture written word sound or particular mark that represents something else by association resemblance or convention For example a red octagon may be a symbol for STOP On maps crossed sabres may indicate a battlefield Numerals are symbols for numbers All language consists of symbols The word cat is not a cat but is an arbitrary symbol representing the idea of a cat There are many symbols for many things Examples range from Peace Pipe Red Cross to Electrical symbols It is good when doing schematic drawings to use symbols that are clearly recognised and interpreted Symbols that have been internationally standardised are the best Circuit diagram symbols have differed from country to country and have changed over time They are now to a large extent internationally standardized Simple components often had symbols intended to represent some feature of the physical construction of the device There are several national and international standards for graphical symbols in circuit diagrams in particular
IEC 60617 (also known as British Standard BS 3939)
ANSI standard Y32 (also known as IEEE Std 315) IEC 60617 originally consisted of 13 parts from resistors and capacitors to logic symbols and even a generalised drawing standard of connections and bus line widths It is now published as a subscription online database IEC 60617-DB Different symbols may be used depending on the discipline using the drawing for example lighting and power symbols used as part of architectural drawings may be different from symbols for devices used in electronics Different electronic components have different characteristics it is necessary to distinguish between them in any circuit diagram Of course we could use the block diagram approach and just identify each component with words Unfortunately this takes up a lot of space and makes the overall diagram harder to recognize or understand quickly We need a way to understand electrical diagrams far more quickly and easily
Foundation Computing
Basic Schematic Diagrams 5957docx Page 45
The answer is to use schematic symbols to represent electronic components as shown in the diagram below In this diagram we show the schematic symbol of a battery as the electrical source and the symbol of a resistor as the load Even without the words and arrows the symbols define exactly what this circuit is and how it behaves
Some good procedures to follow with symbols include
Using templates for frequently used symbols
Use symbols consistently
Use a library of symbols such as from IEC 60617-DB
Foundation Computing
Basic Schematic Diagrams 5957docx Page 46
TOPIC 2 Diagram is clear readable and consistent with specifications Creating a simple diagram using MSPaint To start with letrsquos create a simple flow chart representing the stages in designing a schematic diagram There are four stages in this process
1) Gather your information 2) Organise your information 3) Make connections 4) Test your diagram
Our flow chart will consist of four rectangles arranged vertically with downward pointing arrows as connectors A rounded rectangle at the top and at the bottom of the flowchart will indicate START and FINISH respectively Step by step
Open Microsoft Paint
Click on the Rectangle tool then click and drag in the drawing area to draw a rectangle
Repeat this step to draw four boxes in the drawing area OR click on the Select tool and click and drag to select the first rectangle then right-click to copy and paste three more rectangles the same size in the drawing area
Foundation Computing
Basic Schematic Diagrams 5957docx Page 47
Using the Rounded Rectangle tool draw a rounded rectangle at the top and bottom of your flow chart
Foundation Computing
Basic Schematic Diagrams 5957docx Page 48
Use the Line tool to draw arrows between each box In the Options area under the Tool bar you can choose the thickness of line that you want to use Remember too that if you hold down the Shift key on the keyboard while you are drawing a line you can create a 45 degree angle
Use the Text tool to add text to the shapes by clicking on the Text tool clicking and dragging to create a textbox inside your shape then typing your text Check your spelling carefully letter by letter as you go
Foundation Computing
Basic Schematic Diagrams 5957docx Page 49
The basic flowchart created in Microsoft Paint could look something like this
Foundation Computing
Basic Schematic Diagrams 5957docx Page 50
Common problems with diagrams Even well-designed schematic diagrams will be difficult for the target audience to read and understand if symbols are used inconsistently or the layout of the diagram is unfamiliar For example if a flowchart has different shapes used for each element and different types of arrows used randomly it will be more difficult for readers to see the overall direction and meaning of the diagram If the shapes on an organisation chart are different sizes and randomly positioned with no clear levels or hierarchy the diagram will not provide a clear overview of the organisationrsquos structure If an electrical circuit diagram has unfamiliar symbols used for elements such as switches resistors and batteries then it will not make sense to its intended audience
Tips for improving the readability of your schematic diagrams
Use symbols and shapes consistently ie elements that are similar should have the same symbol or shape
Avoid having connectors crossing over each other
Avoid having symbols or shapes overlapping
Use arrows on connectors or flow lines to indicate direction
Use colours text size and font consistently
Diagrams that can be read top-to-bottom and left-to-right are easier to read
In a process diagram have only one connector leading into a symbol but have more coming out where necessary to indicate different directions or decisions
Diagrams for a technical audience such as electrical or computer programming schematics should follow accepted conventions for symbols and layout
Diagrams indicating a hierarchy of positions ideas or stages are clearer if elements belonging to the same level are a similar shape size and position on the page
Keep labels as clear and as brief as possible Carefully check the spelling of all names and labels letter by letter ndash errors in the spelling of names or scientific and technical terms look unprofessional and can be confusing for readers
Foundation Computing
Basic Schematic Diagrams 5957docx Page 51
Self Test Look at the schematic diagrams that follow Make notes under each example of what is wrong with the diagram what is right about the diagram and what could be changed to make it clear and meaningful to its intended audience 1) This flow chart is supposed to show police officers how to get a suspect to confess to a crime
START
Confidently accuse
suspect of crime
Describe a
scenario that
enables suspect
to admit guiltAllow suspect to
voice objections
Invade suspectrsquos
personal space
Suspect becomes
uncomfortable
Suspect
doesnrsquot
deny guilt
Suspect
denies guilt
No reaction
Elicit confession
Rephrase objections as
confessions
FINISH
Foundation Computing
Basic Schematic Diagrams 5957docx Page 52
2) The following diagram is an organisation chart for Widget Enterprises
John Smith
MANAGER
Seth Drew
IT MANAGER
May Furur
SECRETARY
Judith Holland
CUSTOMER SERVICES manager
Jad Ling
HELPDESK
Harry Petal
FINANCIAL MANAGER
Wanda Springer
MARKETING
MANAGER
Bob Smithells
CLEANER
Kelly Inlerl
MARKETING ASSISTANT
Beryl Thin
CUSTOMER SERVICES ASSISTANTValda Rigley
CUSTOMER
SERVICES
ASSISTANT
Levi Quayle
COMPUTER
TECHNICIAN
3) Which of the following computer applications can be used to create schematic diagrams
a) Microsoft Visio
b) Microsoft Paint
c) Microsoft Word
d) All of the above
4) Which frequently used shapes does the Microsoft Paint Tool bar contain templates for
5) Where in the Microsoft Paint window would you be able to select the thickness of line that you wanted for a brushstroke 6) Identify the purpose and intended audience for a diagram showing a businessrsquos marketing plan 7) Name two characteristics of well-designed schematic diagrams 8) Identify four steps involved in designing schematic diagrams 9) Why is it important to use conventionally accepted and familiar shapes and symbols in your schematic diagrams
Foundation Computing
Basic Schematic Diagrams 5957docx Page 53
Self Test Answers 1) This flow chart is supposed to show police officers how to get a suspect to confess to a crime
START
Confidently accuse
suspect of crime
Describe a
scenario that
enables suspect
to admit guiltAllow suspect to
voice objections
Invade suspectrsquos
personal space
Suspect becomes
uncomfortable
Suspect
doesnrsquot
deny guilt
Suspect
denies guilt
No reaction
Elicit confession
Rephrase objections as
confessions
FINISH
Random shapes are meaningless and confusing ndash use conventional flow chart symbols
Stages of process are not clear ndash arrange shapes top to bottom with options at each stage branching off to side at same level
Connectors that are either straight or curved would be more consistent
Labels are clear
Text uses consistent font and size
Foundation Computing
Basic Schematic Diagrams 5957docx Page 54
2) The following diagram is an organisation chart for Widget Enterprises
John Smith
MANAGER
Seth Drew
IT MANAGER
May Furur
SECRETARY
Judith Holland
CUSTOMER SERVICES manager
Jad Ling
HELPDESK
Harry Petal
FINANCIAL MANAGER
Wanda Springer
MARKETING
MANAGER
Bob Smithells
CLEANER
Kelly Inlerl
MARKETING ASSISTANT
Beryl Thin
CUSTOMER SERVICES ASSISTANTValda Rigley
CUSTOMER
SERVICES
ASSISTANT
Levi Quayle
COMPUTER
TECHNICIAN
No clear levels to hierarchy ndash organise so that diagram reads top to bottom and positions at similar level are in same horizontal space
Different sized boxes and borders on some boxes are meaningless ndash need consistent style for similar elements
Connectors cross over each other and boxes overlap ndash arrange space to avoid this
Text size and font is mostly consistent but one typo needs correcting
3) Which of the following computer applications can be used to create schematic diagrams
a) Microsoft Visio
b) Microsoft Paint
c) Microsoft Word
d) All of the above correct
4) Which frequently used shapes does the Microsoft Paint Tool bar contain templates for
Polygon rectangle ovalellipse
Foundation Computing
Basic Schematic Diagrams 5957docx Page 55
5) Where in the Microsoft Paint window would you be able to select the thickness of line that you wanted for a brushstroke
Options area below the Toolbar
6) Identify the purpose and intended audience for a diagram showing a businessrsquos marketing plan
The purpose would be to provide an overview of the businessrsquos marketing strategy Audience could include management and employees of the business especially the Marketing department potential investors shareholders and directors of the business
7) Name two characteristics of well-designed schematic diagrams Any of simple easy for the target audience to understand include all relevant elements or parts of the process clear and logical connections between elements accurate 8) Identify four steps involved in designing schematic diagrams Gather information organise information make connections between elements test your diagram 9) Why is it important to use conventionally accepted and familiar shapes and
symbols in your schematic diagrams So that the diagram will be easily understood by the target audience
Foundation Computing
Basic Schematic Diagrams 5957docx Page 56
References httpwindowsmicrosoftcomen-NZwindows7Getting-started-with-Paint accessed Sat 5th December in Timaru New Zealand httpenwikipediaorgwikiSchematic_diagrams accessed Sat 5th December in Timaru New Zealand httpenwikipediaorgwikiSymbol accessed Sat 5th December in Timaru New Zealand
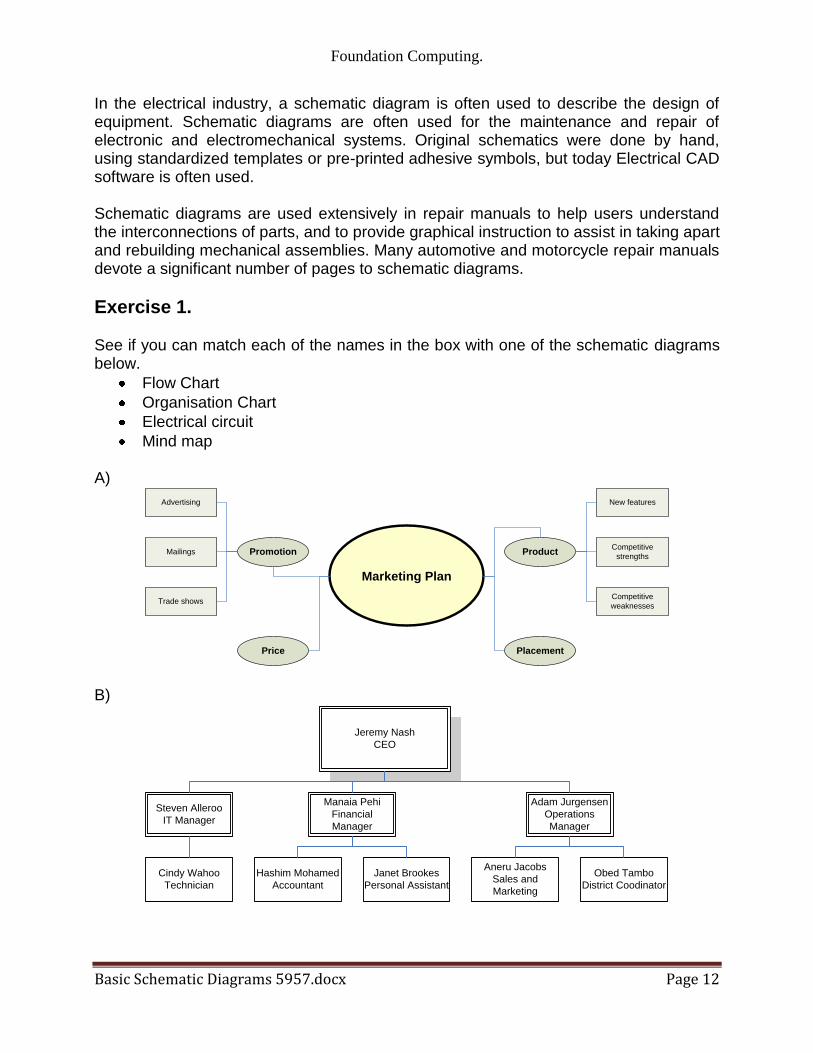
Foundation Computing
Basic Schematic Diagrams 5957docx Page 12
In the electrical industry a schematic diagram is often used to describe the design of equipment Schematic diagrams are often used for the maintenance and repair of electronic and electromechanical systems Original schematics were done by hand using standardized templates or pre-printed adhesive symbols but today Electrical CAD software is often used Schematic diagrams are used extensively in repair manuals to help users understand the interconnections of parts and to provide graphical instruction to assist in taking apart and rebuilding mechanical assemblies Many automotive and motorcycle repair manuals devote a significant number of pages to schematic diagrams
Exercise 1 See if you can match each of the names in the box with one of the schematic diagrams below
Flow Chart
Organisation Chart
Electrical circuit
Mind map A)
Marketing Plan
Placement
ProductPromotion
Price
Competitive
weaknesses
Competitive
strengths
New features
Trade shows
Mailings
Advertising
B)
Jeremy Nash
CEO
Adam Jurgensen
Operations
Manager
Aneru Jacobs
Sales and
Marketing
Obed Tambo
District Coodinator
Manaia Pehi
Financial
Manager
Hashim Mohamed
Accountant
Janet Brookes
Personal Assistant
Steven Alleroo
IT Manager
Cindy Wahoo
Technician
Foundation Computing
Basic Schematic Diagrams 5957docx Page 13
C)
120V
480V
U
L
L
U
LOR
RESET
OL
TR2
TR3
VIB
VIB
WTR
MOTOR
BLOWER
PS
LOR
ON-OFF
SS
TR3
START
M
START
RUN
HAND
OFF
REMOTE
LOR
M
REMOTE
MODE
M
PS
TR1
TR2
S
To LOR COIL CIRCUIT
M
MSH
ON-OFF
R
W
TR1
X1
D
C
B
A
4 3 2 1
D
C
B
A
4 3 2 1
D)
Foundation Computing
Basic Schematic Diagrams 5957docx Page 14
Answers A = Mindmap B = Organisation chart C = Electrical circuit diagram D = Flow chart Schematic diagram production Before suitable computer applications were developed schematic diagrams were produced manually using tools such as typewriters stencils stickers or labels and drawing by hand Sometimes it can be quicker to produce simple schematic diagrams by hand or you may not have a computer available or the computer application available might be too complex or take so long to learn that it makes more sense to use manual methods Alternatively you may have a highly complex schematic diagram that is too big to print out on the computer printers available and would not make sense if spread over a number of pages
Exercise 2) In the space below or on a piece of paper describe some situations in which you would choose to use a computer application to produce your schematic diagram and explain why
Exercise 3) Now describe some situations in which you would choose NOT to produce your schematic diagram using a computer application and explain why not
Exercise 4) Working with a partner brainstorm the advantages and disadvantages of producing schematic diagrams with a computer application rather than by hand
Foundation Computing
Basic Schematic Diagrams 5957docx Page 15
Suggested answers to the exercises 2) In the space below describe some situations in which you would choose to use a computer application to produce your schematic diagram and explain why Situations could include (and there are many more)
Preparing a flow chart to send by email to all the members of a team ndash because doing it on computer would allow me to make multiple copies and email them easily
Producing a complex network diagram as part of a report to present ndash because it would look more professional and could be easily changed or updated
Preparing an organisation chart to include in a computerised slideshow - because it could easily be imported
3) Now describe some situations in which you would choose NOT to produce your schematic diagram using a computer application and explain why not
Situations could include
Presenting an organisation diagram or a flow chart to a community organisation as a one-off event if I did not have access to a large-scale printer or projector I would draw or paint the diagram by hand ndash because it would be the simplest way to make it large enough for everyone to see and I would be unlikely to need more copies
In an assessment situation drawing a mind map or brainstorming diagram to organise my ideas before writing an essay or report ndash because it would be quickest
Working with a team to sketch out a plan for a process because it would be quickest and wouldnrsquot rely on being close to a computer
Foundation Computing
Basic Schematic Diagrams 5957docx Page 16
4) Working with a partner brainstorm the advantages and disadvantages of producing schematic diagrams with a computer application rather than by hand
Your results of your brainstorm might look like this (diagram produced using MS Visio)
Using computers AdvantagesDisadvantages
need to learn
application
can take longer
sometimes difficult
to plan
limited options for
layout
frustrating
too many options
incompatible file
types
can store on
computer
can fit more smaller
text
easy to read
can email to people
use templates
easy to change or
update
Can be quick
easy to make
copies
professional looking
import into
computer
documents
Expensive
equipment needed
technical problems
Security
Foundation Computing
Basic Schematic Diagrams 5957docx Page 17
Process for producing schematic diagrams on computer There are many different computer applications that can be used to produce schematic diagrams Some applications like Microsoft Visio are specifically designed to help you create a wide range of complex schematic diagrams easily However almost any computer application that has a drawing tool can be used to produce a schematic diagram and the process will usually involve the following steps 1) Design the diagram
a Identify your target audience b Collect all the information you need c Arrange your information in a logical order d Test your diagram
2) Create the diagram in the computer application
a Open the drawing window b Draw the shapes you want c Arrange the shapes according to your design d Add connectors between each of the shapes e Add text where required
Designing effective diagrams The main purpose of a schematic diagram is to provide a clear and easy to understand visual overview of how the different parts of a system fit together Schematic diagrams that are well-designed
are as simple as possible
are easy for the target audience to understand
include all relevant elements or parts of the process
have clear and logical connections between elements
communicate an accurate picture of the system or process
Foundation Computing
Basic Schematic Diagrams 5957docx Page 18
Identifying the target audience The target audience is the group of people who will read your schematic diagram The main question you need to ask yourself is Who is my audience In order to identify the target audience for your schematic diagram think about the following
What sort of person will read your diagram Think about that personrsquos job age education language environment and other characteristics that could affect the sort of language and symbols they will understand and relate to
What information will that person look for Why are they reading your diagram What do they want or need to know What information is most important What information is not so important
How much time will that person have to look at your diagram Will they be in a hurry or will they have time to study all the details Does your diagram have to stand alone or will it have a lot of text next to it to explain it
What do you want your audience to learn or do as a result of reading your diagram
What does the diagram need to show What information do you have to include How should this information be arranged
Foundation Computing
Basic Schematic Diagrams 5957docx Page 19
Exercise Complete the table below with information about the target audience and purpose for each of the examples of schematic diagrams given Use the questions above to help you
Example diagram Target audience
You work as an electrician and Mr Jones has asked you to design an electrical wiring plan for the dream house he wants to build
You are a computer programmer and you are using a flowchart to plan a computer program that farmers can use to keep count of their sheep
You have to write an essay about your most embarrassing childhood experience and you create a mindmap to organise your ideas
You are researching your family history and have been asked to create a family tree diagram for a booklet that will be handed out at an upcoming family reunion
Foundation Computing
Basic Schematic Diagrams 5957docx Page 20
Suggested Answer Complete the table below with information about the target audience and purpose for each of the examples of schematic diagrams given Use the questions above to help you
Example diagram Target audience
You work as an electrician and Mr Jones has asked you to design an electrical wiring plan for the dream house he wants to build
Mr Jones his builder local council officials theyrsquoll need detailed information that will be studied in depth and referred to during the planning and building process
You are a computer programmer and you are using a flowchart to plan a computer program that farmers can use to keep count of their sheep
You and other computer programmers will use the flowchart to understand the process of the programme and to identify flaws in its logic
You have to write an essay about your most embarrassing childhood experience and you create a mindmap to organise your ideas
You are the only person who will use your mindmap and you will refer to it as you write your essay
You are researching your family history and have been asked to create a family tree diagram for a booklet that will be handed out at an upcoming family reunion
Members of your family will look for their names and those of relatives in order to see how people are related to each other
Foundation Computing
Basic Schematic Diagrams 5957docx Page 21
TOPIC 2 Identifying the computer application required There are many computer applications that can be used to create schematic diagrams Microsoft Visio is specifically designed for this purpose but any application with basic drawing tools such as those found in Microsoft Word can be used One of the simplest and most widely available computer drawing applications is Microsoft Paint We will use this application is used to demonstrate the tools However most of the tools and principles we will focus on in Microsoft Paint can be found in other drawing applications The following diagram shows the Microsoft Paint window
The tools are arranged to the left of the drawing area in the Tool bar An overview of how to use the tools you need to create a simple schematic diagram is provided below Underneath the Tool bar is the Options box When you click on a tool icon in the Tool bar the options available for that tool appear in the Options box To select an option click on the tool you want to use then click on the option and then click in the drawing area and drag the mouse pointer to draw The Colour palette is underneath the drawing area To use a colour click on the tool you want to use then click on the colour and then click in the drawing area ndash the shape line or text you create will appear in the colour you have selected
Foundation Computing
Basic Schematic Diagrams 5957docx Page 22
Tools Selection Tools Use the selection tools to select the parts of your schematic diagram that you want to work with or change in some way To use these tools click on the button of the tool you want and then click on your diagram and drag until the area you want to work with is selected The Freeform Select tool (on the left) is used to select an irregularly shaped area The Rectangle Select tool is used to select a rectangular area To copy a part of your diagram eg a shape line or text it must first be selected using a selection tool Select Copy from the Edit menu click where you want the copy to be positioned and select Paste from the Edit menu Shapes tools
The shapes tools which can be used to create symbols in schematic diagrams consist of the Rectangle tool for creating squares or rectangles the Polygon tool for creating multi-sided shapes the Rounded Rectangle tool for creating rounded rectangles and the Oval tool for creating circles or ovals These tools provide templates for creating frequently used symbols To use them simply click on the icon of the shape you want to use and drag it onto your diagram where you can resize it if necessary and add text or
Foundation Computing
Basic Schematic Diagrams 5957docx Page 23
effects For the Polygon tool click and drag to draw the first side and click each time you want to change direction Double-click when you have finished To create a perfect circle hold down the Shift key while you are dragging the mouse pointer
Line tools In schematic diagrams line tools can be used to draw connectors between symbols and to draw shapes or symbols
The Straight Line tool creates straight lines simply click on the Straight Line icon click in your picture where you want the line to start and drag to where you want the line to finish The Curve tool will create a curve with at least one and no more than two bends in it click on the Curve icon then click in your picture to draw a straight line and drag to where you want the first bend to be click again where you want the second curve to be and drag to shape the curve You can make more complex shapes by joining lines and curves together
The Pencil tool can be used to draw freeform shapes or lines with as many bends and curves as you want Click on the icon click in your diagram and ldquodrawrdquo with your mouse pointer To draw straight lines hold down the shift key as you are drawing with the mouse
Foundation Computing
Basic Schematic Diagrams 5957docx Page 24
The Paint Brush tool draws freeform lines in the same way as the Pencil tool but can be used to create lines of varying widths and styles To select a paintbrush style click on the Paint Brush icon and then click in the Options box on the style you want to use
The Airbrush tool creates lines with an airbrushed effect of clustered dots It can be used in the same way as the pencil tool to draw freeform shapes or symbols In the Options box you can choose the size of the area covered by the Airbrush tool
Text tool
Add text to your schematic diagram by clicking on the Text icon and clicking in your diagram where you want the text to appear As you drag a rectangle will be formed within which text can be typed The Fonts dialogue box will also open
Foundation Computing
Basic Schematic Diagrams 5957docx Page 25
Fill Tool
The Fill tool will add colour to a shape that you have drawn Click on the icon click on a colour from the colour palette and then click on the shape in the diagram that you want to fill with colour
Zoom tool
Use the Zoom tool to magnify a section of the diagram that you are working with Click on the magnifying glass icon select the size you want in the Options box and click on the part of the image you want to enlarge As the picture zooms in the cursor will change back to the tool you were using before
Adding colour
The Colour box to the left of the Colour palette shows the foreground and background colours you are using If you click on a tool and then drag while holding down the left mouse button the line or shape will be drawn using the foreground colour If you hold down the right mouse button the background colour will be used To use any other colour click on the tool you want to use click on an option (if using) then click on the colour you want from the colour palette As you draw the colour you have clicked on will be used
Foundation Computing
Basic Schematic Diagrams 5957docx Page 26
Additional resources For more detailed information about these tools refer to the Help menu in Microsoft Paint (httpwindowshelpmicrosoftcom )
The following online tutorials may also be useful
httplkwdplorgclassesMSPaintpainthtml
httpwwwlesleyedufacultyahuntMSPttutrhtm
Exercise The example below shows a simple organisation chart produced using Microsoft Paint In the space that follows identify which tools were used to create this schematic diagram and what each tool was used for
Rectangle tool used to create Manager symbol
Oval tool used to create Team Leader symbols
Rounded Rectangle tool used for Team member symbols
Straight line tool used to create connectors
Text tool used to add text to shapes
Rectangle Select tool used to select shapes to move into
position
Foundation Computing
Basic Schematic Diagrams 5957docx Page 27
Suggested Answer The example below shows a simple organisation chart produced using Microsoft Paint In the space that follows identify which tools were used to create this schematic diagram and what each tool was used for
Rectangle tool used to create Manager symbol
Oval tool used to create Team Leader symbols
Rounded Rectangle tool used for Team member symbols
Straight line tool used to create connectors
Text tool used to add text to shapes
Rectangle Select tool used to select shapes to move into position
Foundation Computing
Basic Schematic Diagrams 5957docx Page 28
Exercise Which tools would you use to produce the following symbols or diagrams and why
Symbol Tools and justification
Resistor (Electrical circuit diagram)
Speaker (Electrical circuit diagram)
AC
AC source (Electrical circuit diagram)
Start or end of process (Flowchart)
Decision (yes or no) (Flowchart)
Instructions or actions (Flowchart)
Foundation Computing
Basic Schematic Diagrams 5957docx Page 29
Symbol Tools and justification
Document produced (Flowchart)
Data entered or received (Flowchart)
Foundation Computing
Basic Schematic Diagrams 5957docx Page 30
Suggested Answers Which tools would you use to produce the following symbols or diagrams and why
Symbol Tools and justification
Resistor (Electrical circuit diagram)
Straight line tool (hold down shift key)It creates regular 45 degree angled lines that are perfectly straight
Speaker (Electrical circuit diagram)
Polygon tool (hold down shift key) Rectangle tool and Straight line tool These are used in order to create a symbol with uniform angles and straight edges
AC
AC source (Electrical circuit diagram)
Oval tool (hold down shift key) to draw circle Curve tool to draw wavy line Straight line tool and Text tool These tools produce cleaner shapes than drawing freeform
Start or end of process (Flowchart)
Rounded rectangle tool This provides a template for creating this symbol
Decision (yes or no) (Flowchart)
Polygon tool This creates more accurate joins between sides than the Straight line tool
Instructions or actions (Flowchart)
Rectangle tool It provides a template for drawing this shape
Foundation Computing
Basic Schematic Diagrams 5957docx Page 31
Symbol Tools and justification
Document produced (Flowchart)
Line tool and Curve tool ndash need two tools in MSPaint other applications may have a template for this shape
Data entered or received (Flowchart)
Polygon tool ndash better than Straight line tool because can produce more regular shape
Foundation Computing
Basic Schematic Diagrams 5957docx Page 32
TOPIC 3 Getting started with MS Paint Sourced from httpwindowsmicrosoftcomen-NZwindows7Getting-started-with-Paint MS Paint is a feature in Windows that you can use to draw colour and edit pictures You can use Paint like a digital sketchpad to make simple pictures creative projects or to add text and designs to other pictures such as those taken with your digital camera The parts of Paint Open Paint by clicking the Start button clicking All Programs clicking Accessories and then clicking Paint When you start Paint youll see an empty window drawing and painting tools are located in the ribbon at the top of the window The following illustration shows the different parts of the Paint window
The Paint window
Foundation Computing
Basic Schematic Diagrams 5957docx Page 33
Working with tools The ribbon in Paint includes a handy collection of drawing tools You can use these tools to create freehand drawings and add a variety of shapes to your pictures This section describes some common tasks For more detailed information on how to use the different tools in Paint see Using Paint Draw a line Some tools and shapes such as the Pencil Brush Line and Curve let you make a variety of straight curved and squiggly lines What you draw is determined by how you move the mouse as you draw You can use the Line to draw a straight line for example
1) On the Home tab in the Shapes group click the Line 2) In the Colors group click Color 1 and then click the color you want to use 3) To draw drag the pointer across the drawing area
Draw a squiggly line Your drawings dont have to be composed of only straight lines The Pencil and Brushes can be used to make completely random free-form shapes
1) On the Home tab in the Tools group click the Pencil tool 2) In the Colors group click Color 1 and then click the color you want to use 3) To draw drag the pointer across the drawing area and make a squiggly line
Note If you want to make a line that has a different appearance use one of the Brushes instead Draw a shape Paint lets you draw many different shapes For example you can draw ready-made defined shapes such as rectangles circles squares triangles and arrows (to name a
few) You can also make your own custom shape by using the Polygon shape to draw a polygon which is a shape that can have any number of sides
1) On the Home tab in the Shapes group click a ready-made shape such as the
Rectangle 2) To add a ready-made shape drag the pointer across the drawing area to make
the shape 3) To change the outline style in the Shapes group click Outline and then click an
outline style 4) If you dont want your shape to have an outline click No outline 5) In the Colors group click Color 1 and then click a color for the outline 6) In the Colors group click Color 2 and then click a color to use to fill the shape 7) To change the fill style in the Shapes group click Fill and then click a fill style 8) If you dont want your shape to be filled click No fill
Foundation Computing
Basic Schematic Diagrams 5957docx Page 34
Add text You can also add text to your picture The Text tool lets you add a simple message or title
1) On the Home tab in the Tools group click the Text tool 2) Drag the pointer in the drawing area where you want to add text 3) Under Text Tools on the Text tab click the font face size and style in the Font
group The Font group
4) In the Colors group click Color 1 and then click a color This is the text color 5) Type the text that you want to add
Erase part of your picture If you make a mistake or need to change part of a picture use the eraser By default the eraser changes any area you erase to white but you can change the eraser color For example if you set the background color to yellow anything you erase turns to yellow
1) On the Home tab in the Tools group click the Eraser tool 2) In the Colors group click Color 2 and then click the color that you want to erase
with If you want to erase with white you dont have to select a color 3) Drag the pointer over the area you want to erase
Saving a picture Save your picture frequently so you dont accidentally lose your work To save click the
Paint button and then click Save This saves all of the changes made to the picture since the last time you saved The very first time that you save a new picture you will need to give your picture a file name Follow these steps
1) Click the Paint button and then click Save 2) In the Save as type box select the file format you want 3) In the File name box type a name and then click Save
Foundation Computing
Basic Schematic Diagrams 5957docx Page 35
Topic 4 Designing your diagram Although there are many different types of schematic diagrams the basic process and principles involved in designing a clear and coherent diagram are similar The principles apply to designing an electrical circuit diagram an organisation chart a mind map a flow chart and many other diagrams Some of these principles are also worth applying to other disciplines such as designing a Web page Letrsquos work step-by-step through the process of creating a flow chart to help people make money selling things on an on-line auction site such as wwwtrademeconz or wwwebaycom
Step 1 Gather your information Start by brainstorming all the information you need to include in your diagram Write down everything you think might be important or should be included
trademe
choose things that
sell
good photograph
feedback
keep track
prompt answers
postage
auction length
similar listings
postal system
setting reserve
describing item
correct category
re-listing
fixed offers
Look at the information you have gathered and think about your target audience Highlight the information that is most important to your target audience Cross out any irrelevant information Put question marks next to information that you are unsure about or may be able to leave out
Foundation Computing
Basic Schematic Diagrams 5957docx Page 36
Step 2 Organise your information Take the information that you have left and sort through it How you organise your information will depend on the type of diagram you are designing For example an organisationrsquos chart usually has different levels and shows who its members report to so you might group people by department and by level A flow chart like the example wersquore creating usually shows a process Information is grouped in the order we would use it If any other steps or information occurs to you as you are organising your information add them in Herersquos an example of how the key steps involved in selling on trademe could be ordered
Choose items that sell
Look at similar listings
Decide on a reserve price
Take a clear photograph
Identify your target audience
Write a clear description
Upload your item
Choose the correct category
Monitor watchers bids and views
Lower your reserve
Fixed price offers
Relist
Step 3 Make connections Once the elements are grouped or arranged in a logical order a clearer picture of the process or system you are representing in your diagram should start to emerge However unlike a list which usually reads from top to bottom only a diagram can show connections in many different directions and working out the links between elements is an essential part of designing a coherent diagram At this stage of the design process it is helpful to sketch out a basic plan of the elements you want to include and the flow-lines or connections between them In order to work out the connections between the elements ask questions such as What happens ifhellip What do I do beforeafter this What decisions need to be made now What actions need to be taken Use arrows to show connections between elements group elements that are part of the same stage or level of the process next to or near to each other and use shapes to show which elements are similar to each other eg diamonds for decisions rectangles for instructions or actions Make up your own meanings for shapes if necessary but be sure to use them consistently
Foundation Computing
Basic Schematic Diagrams 5957docx Page 37
The flow chart below shows how our list of elements above changes and gets re-ordered as we ask these questions and organise the information into a logical and coherent diagram
Decide on your
reserve price
START
Relist
Take a photo that is
clear and item looks
good
Decide on your
ideal buyer
Write a description
of your item
highlighting its
benefits for your
buyer
Upload your item in
a category your
buyer is likely to be
looking in
Monitor how many
views watchers and
bids your item gets
Lower your reserve
Item meets reserve
and sellsItem doesnrsquot sell
Offer to watchers for
your reserve
Decide what you
want to sell
Check what similar
items are currently
selling for
Lots of views but
no watchers
No interestFINISH
Foundation Computing
Basic Schematic Diagrams 5957docx Page 38
Step 4 Test your diagram The final step in designing your diagram is checking that it is as effective as possible To do this you should work through each stage step by step challenging it as you go Picture the process in your mind as you follow the links checking that you have included all the actions and decisions required that they are in the correct order and that no steps are duplicated Once yoursquore confident that the diagram is correct look at it again critically to see if you can improve it or clarify it Is there anywhere you can simplify it by removing unnecessary steps Is there anywhere that seems vague and would be easier to understand if you added a step or a connector Now imagine that you are a member of your target audience For a moment try to forget everything you know about the system or process you have designed a diagram for except for what your target audience knows Look at the diagram with fresh eyes does it make sense to you now Does anything seem odd confusing or out of place Finally look at the layout of your diagram Is it easy to read and follow Have you used shapes texts and arrows consistently Are your shapes and texts uniform and lined up properly Are your connectors clearly defined or are they criss-crossing all over each other Check the spelling of labels carefully ndash go through letter by letter to make sure all names and technical or unfamiliar terms are correct
Discussion With a partner look critically at our example diagram above Discuss any parts of it that you think could be better and any changes you would make to improve the readability of the flow chart Make note on the flow chart above of any areas that you think could be improved Share your answers with the rest of the class
Foundation Computing
Basic Schematic Diagrams 5957docx Page 39
Self Test 1) Mr Biggles owns Biggles Air Supplies a company that makes aircraft supplies He asks you to create an organisation chart for his company He gives you the following list of all his employees and who they report to
Mr James Biggles Chief Executive Officer
Jane Doep Personal Assistant to CEO
Mrs Monica Stepworth Financial Manager (reports to CEO)
Judith Zantes Accountant (reports to Financial Manager)
Mary Smallville Accountant (reports to Financial Manager)
Janey Poretuna Admin Assistant (reports to Judith Zantes)
Mickey Laluevu IT technician (reports to Financial Manager)
Mr Hank Johnson Operations Manager (reports to CEO)
Frank Hapil Engineering Manager (reports to Operations Manager)
Joe Smither Engineering Supervisor (reports to Engineering Manager)
Howie Fartherton Engineering Technician (reports to Engineering Supervisor)
Ernie Jusef Engineering Technician (reports to Engineering Supervisor)
Rob Luxemburg Apprentice Technician (reports to Ernie Jusef)
Harry Monahan Interiors Manager (reports to Operations Manager)
Barney Jokka Interiors Technician (reports to Interiors Supervisor) Design an organisation chart for Biggles Air Supplies and draw it in the space below
2) Think of a simple process that has at least five steps and involves some form of feedback or choice For example operating a vending machine topping up your mobile phone using EFTPOS checking messages on an answering machine
Design a flow chart to represent your process
Foundation Computing
Basic Schematic Diagrams 5957docx Page 40
Self Test Answers
1) Mr Biggles owns Biggles Air Supplies a company that makes aircraft supplies He asks you to create an organisation chart for his company He gives you the following list of all his employees and who they report to
Mr James Biggles Chief Executive Officer
Jane Doep Personal Assistant to CEO
Mrs Monica Stepworth Financial Manager (reports to CEO)
Judith Zantes Accountant (reports to Financial Manager)
Mary Smallville Accountant (reports to Financial Manager)
Janey Poretuna Admin Assistant (reports to Judith Zantes)
Mickey Laluevu IT technician (reports to Financial Manager)
Mr Hank Johnson Operations Manager (reports to CEO)
Frank Hapil Engineering Manager (reports to Operations Manager)
Joe Smither Engineering Supervisor (reports to Engineering Manager)
Howie Fartherton Engineering Technician (reports to Engineering Supervisor)
Ernie Jusef Engineering Technician (reports to Engineering Supervisor)
Rob Luxemburg Apprentice Technician (reports to Ernie Jusef)
Harry Monahan Interiors Manager (reports to Operations Manager)
Barney Jokka Interiors Technician (reports to Interiors Supervisor) Design an organisation chart for Biggles Air Supplies and draw it in the space below
Mr James Biggles
CEO
Jane Doep
Personal
Assistant
Mrs Monica Stepworth
Financial Manager
Judith Zantes
Accountant
Janey Poretuna
Admin Assistant
Mary Smallville
Accountant
Mickey Laluevu
IT technician
Mr Hank Johnson
Operations Manager
Frank Hapil
Engineering
Manager
Harry Monahan
Interiors Manager
Joe Smither
Engineering
Supervisor
Howie Fartherton
Engineering
Technician
Ernie Jusef
Engineering
Technician
Rob Luxemburg
Apprentice
Technician
Barney Jokka
Interiors
Technician
Foundation Computing
Basic Schematic Diagrams 5957docx Page 41
2) Think of a simple process that has at least five steps and involves some form of feedback or choice For example operating a vending machine topping up your mobile phone using EFTPOS checking messages on an answering machine
Design a flow chart to represent your process
Dial 06345
Enter your dialing code and
phone number followed by
the key
Dial number for
service you require
Listen to saved messagesListen to new messages
Dial number for
service you require
Save message Delete message
START
FINISH
Dial 2
Dial 1
Dial 1
Dial 2
Dial 1
Dial 2
Foundation Computing
Basic Schematic Diagrams 5957docx Page 42
Foundation Computing
Basic Schematic Diagrams 5957docx Page 43
Part 2
Produce schematic diagrams from a given brief using a computer application
OBJECTIVES
On successful completion of this section you will be able to Produce schematic diagrams from a given brief using a computer application
Performance criteria
21 The symbols used in each diagram are consistent with the type of diagram and the specifications of the brief
22 The final diagram is readable clearly illustrates the object being diagrammed
and is consistent with the specifications of the brief
TOPICS
Topic 1 Symbols used are consistent with diagram type and specifications Topic 2 Diagram is clear readable and consistent with specifications
Self Test
Self Test Answers
Foundation Computing
Basic Schematic Diagrams 5957docx Page 44
TOPIC 1 Symbols used are consistent with diagram type and specifications A symbol is something such as an object picture written word sound or particular mark that represents something else by association resemblance or convention For example a red octagon may be a symbol for STOP On maps crossed sabres may indicate a battlefield Numerals are symbols for numbers All language consists of symbols The word cat is not a cat but is an arbitrary symbol representing the idea of a cat There are many symbols for many things Examples range from Peace Pipe Red Cross to Electrical symbols It is good when doing schematic drawings to use symbols that are clearly recognised and interpreted Symbols that have been internationally standardised are the best Circuit diagram symbols have differed from country to country and have changed over time They are now to a large extent internationally standardized Simple components often had symbols intended to represent some feature of the physical construction of the device There are several national and international standards for graphical symbols in circuit diagrams in particular
IEC 60617 (also known as British Standard BS 3939)
ANSI standard Y32 (also known as IEEE Std 315) IEC 60617 originally consisted of 13 parts from resistors and capacitors to logic symbols and even a generalised drawing standard of connections and bus line widths It is now published as a subscription online database IEC 60617-DB Different symbols may be used depending on the discipline using the drawing for example lighting and power symbols used as part of architectural drawings may be different from symbols for devices used in electronics Different electronic components have different characteristics it is necessary to distinguish between them in any circuit diagram Of course we could use the block diagram approach and just identify each component with words Unfortunately this takes up a lot of space and makes the overall diagram harder to recognize or understand quickly We need a way to understand electrical diagrams far more quickly and easily
Foundation Computing
Basic Schematic Diagrams 5957docx Page 45
The answer is to use schematic symbols to represent electronic components as shown in the diagram below In this diagram we show the schematic symbol of a battery as the electrical source and the symbol of a resistor as the load Even without the words and arrows the symbols define exactly what this circuit is and how it behaves
Some good procedures to follow with symbols include
Using templates for frequently used symbols
Use symbols consistently
Use a library of symbols such as from IEC 60617-DB
Foundation Computing
Basic Schematic Diagrams 5957docx Page 46
TOPIC 2 Diagram is clear readable and consistent with specifications Creating a simple diagram using MSPaint To start with letrsquos create a simple flow chart representing the stages in designing a schematic diagram There are four stages in this process
1) Gather your information 2) Organise your information 3) Make connections 4) Test your diagram
Our flow chart will consist of four rectangles arranged vertically with downward pointing arrows as connectors A rounded rectangle at the top and at the bottom of the flowchart will indicate START and FINISH respectively Step by step
Open Microsoft Paint
Click on the Rectangle tool then click and drag in the drawing area to draw a rectangle
Repeat this step to draw four boxes in the drawing area OR click on the Select tool and click and drag to select the first rectangle then right-click to copy and paste three more rectangles the same size in the drawing area
Foundation Computing
Basic Schematic Diagrams 5957docx Page 47
Using the Rounded Rectangle tool draw a rounded rectangle at the top and bottom of your flow chart
Foundation Computing
Basic Schematic Diagrams 5957docx Page 48
Use the Line tool to draw arrows between each box In the Options area under the Tool bar you can choose the thickness of line that you want to use Remember too that if you hold down the Shift key on the keyboard while you are drawing a line you can create a 45 degree angle
Use the Text tool to add text to the shapes by clicking on the Text tool clicking and dragging to create a textbox inside your shape then typing your text Check your spelling carefully letter by letter as you go
Foundation Computing
Basic Schematic Diagrams 5957docx Page 49
The basic flowchart created in Microsoft Paint could look something like this
Foundation Computing
Basic Schematic Diagrams 5957docx Page 50
Common problems with diagrams Even well-designed schematic diagrams will be difficult for the target audience to read and understand if symbols are used inconsistently or the layout of the diagram is unfamiliar For example if a flowchart has different shapes used for each element and different types of arrows used randomly it will be more difficult for readers to see the overall direction and meaning of the diagram If the shapes on an organisation chart are different sizes and randomly positioned with no clear levels or hierarchy the diagram will not provide a clear overview of the organisationrsquos structure If an electrical circuit diagram has unfamiliar symbols used for elements such as switches resistors and batteries then it will not make sense to its intended audience
Tips for improving the readability of your schematic diagrams
Use symbols and shapes consistently ie elements that are similar should have the same symbol or shape
Avoid having connectors crossing over each other
Avoid having symbols or shapes overlapping
Use arrows on connectors or flow lines to indicate direction
Use colours text size and font consistently
Diagrams that can be read top-to-bottom and left-to-right are easier to read
In a process diagram have only one connector leading into a symbol but have more coming out where necessary to indicate different directions or decisions
Diagrams for a technical audience such as electrical or computer programming schematics should follow accepted conventions for symbols and layout
Diagrams indicating a hierarchy of positions ideas or stages are clearer if elements belonging to the same level are a similar shape size and position on the page
Keep labels as clear and as brief as possible Carefully check the spelling of all names and labels letter by letter ndash errors in the spelling of names or scientific and technical terms look unprofessional and can be confusing for readers
Foundation Computing
Basic Schematic Diagrams 5957docx Page 51
Self Test Look at the schematic diagrams that follow Make notes under each example of what is wrong with the diagram what is right about the diagram and what could be changed to make it clear and meaningful to its intended audience 1) This flow chart is supposed to show police officers how to get a suspect to confess to a crime
START
Confidently accuse
suspect of crime
Describe a
scenario that
enables suspect
to admit guiltAllow suspect to
voice objections
Invade suspectrsquos
personal space
Suspect becomes
uncomfortable
Suspect
doesnrsquot
deny guilt
Suspect
denies guilt
No reaction
Elicit confession
Rephrase objections as
confessions
FINISH
Foundation Computing
Basic Schematic Diagrams 5957docx Page 52
2) The following diagram is an organisation chart for Widget Enterprises
John Smith
MANAGER
Seth Drew
IT MANAGER
May Furur
SECRETARY
Judith Holland
CUSTOMER SERVICES manager
Jad Ling
HELPDESK
Harry Petal
FINANCIAL MANAGER
Wanda Springer
MARKETING
MANAGER
Bob Smithells
CLEANER
Kelly Inlerl
MARKETING ASSISTANT
Beryl Thin
CUSTOMER SERVICES ASSISTANTValda Rigley
CUSTOMER
SERVICES
ASSISTANT
Levi Quayle
COMPUTER
TECHNICIAN
3) Which of the following computer applications can be used to create schematic diagrams
a) Microsoft Visio
b) Microsoft Paint
c) Microsoft Word
d) All of the above
4) Which frequently used shapes does the Microsoft Paint Tool bar contain templates for
5) Where in the Microsoft Paint window would you be able to select the thickness of line that you wanted for a brushstroke 6) Identify the purpose and intended audience for a diagram showing a businessrsquos marketing plan 7) Name two characteristics of well-designed schematic diagrams 8) Identify four steps involved in designing schematic diagrams 9) Why is it important to use conventionally accepted and familiar shapes and symbols in your schematic diagrams
Foundation Computing
Basic Schematic Diagrams 5957docx Page 53
Self Test Answers 1) This flow chart is supposed to show police officers how to get a suspect to confess to a crime
START
Confidently accuse
suspect of crime
Describe a
scenario that
enables suspect
to admit guiltAllow suspect to
voice objections
Invade suspectrsquos
personal space
Suspect becomes
uncomfortable
Suspect
doesnrsquot
deny guilt
Suspect
denies guilt
No reaction
Elicit confession
Rephrase objections as
confessions
FINISH
Random shapes are meaningless and confusing ndash use conventional flow chart symbols
Stages of process are not clear ndash arrange shapes top to bottom with options at each stage branching off to side at same level
Connectors that are either straight or curved would be more consistent
Labels are clear
Text uses consistent font and size
Foundation Computing
Basic Schematic Diagrams 5957docx Page 54
2) The following diagram is an organisation chart for Widget Enterprises
John Smith
MANAGER
Seth Drew
IT MANAGER
May Furur
SECRETARY
Judith Holland
CUSTOMER SERVICES manager
Jad Ling
HELPDESK
Harry Petal
FINANCIAL MANAGER
Wanda Springer
MARKETING
MANAGER
Bob Smithells
CLEANER
Kelly Inlerl
MARKETING ASSISTANT
Beryl Thin
CUSTOMER SERVICES ASSISTANTValda Rigley
CUSTOMER
SERVICES
ASSISTANT
Levi Quayle
COMPUTER
TECHNICIAN
No clear levels to hierarchy ndash organise so that diagram reads top to bottom and positions at similar level are in same horizontal space
Different sized boxes and borders on some boxes are meaningless ndash need consistent style for similar elements
Connectors cross over each other and boxes overlap ndash arrange space to avoid this
Text size and font is mostly consistent but one typo needs correcting
3) Which of the following computer applications can be used to create schematic diagrams
a) Microsoft Visio
b) Microsoft Paint
c) Microsoft Word
d) All of the above correct
4) Which frequently used shapes does the Microsoft Paint Tool bar contain templates for
Polygon rectangle ovalellipse
Foundation Computing
Basic Schematic Diagrams 5957docx Page 55
5) Where in the Microsoft Paint window would you be able to select the thickness of line that you wanted for a brushstroke
Options area below the Toolbar
6) Identify the purpose and intended audience for a diagram showing a businessrsquos marketing plan
The purpose would be to provide an overview of the businessrsquos marketing strategy Audience could include management and employees of the business especially the Marketing department potential investors shareholders and directors of the business
7) Name two characteristics of well-designed schematic diagrams Any of simple easy for the target audience to understand include all relevant elements or parts of the process clear and logical connections between elements accurate 8) Identify four steps involved in designing schematic diagrams Gather information organise information make connections between elements test your diagram 9) Why is it important to use conventionally accepted and familiar shapes and
symbols in your schematic diagrams So that the diagram will be easily understood by the target audience
Foundation Computing
Basic Schematic Diagrams 5957docx Page 56
References httpwindowsmicrosoftcomen-NZwindows7Getting-started-with-Paint accessed Sat 5th December in Timaru New Zealand httpenwikipediaorgwikiSchematic_diagrams accessed Sat 5th December in Timaru New Zealand httpenwikipediaorgwikiSymbol accessed Sat 5th December in Timaru New Zealand
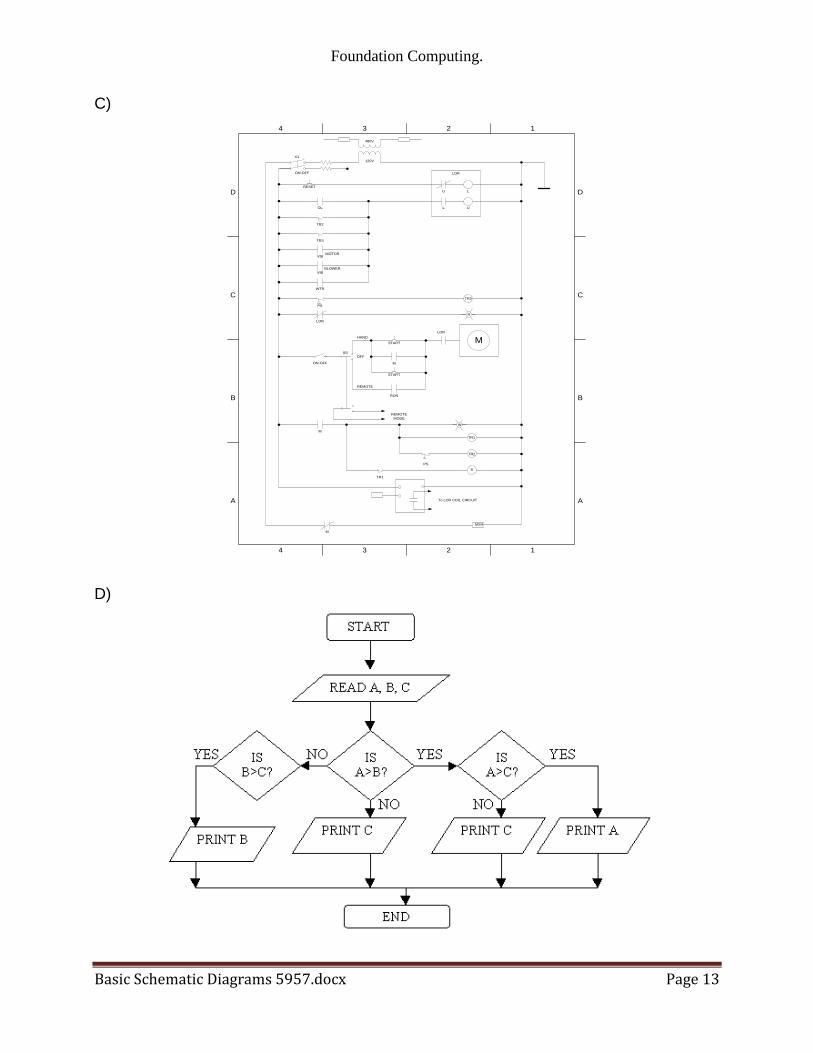
Foundation Computing
Basic Schematic Diagrams 5957docx Page 14
Answers A = Mindmap B = Organisation chart C = Electrical circuit diagram D = Flow chart Schematic diagram production Before suitable computer applications were developed schematic diagrams were produced manually using tools such as typewriters stencils stickers or labels and drawing by hand Sometimes it can be quicker to produce simple schematic diagrams by hand or you may not have a computer available or the computer application available might be too complex or take so long to learn that it makes more sense to use manual methods Alternatively you may have a highly complex schematic diagram that is too big to print out on the computer printers available and would not make sense if spread over a number of pages
Exercise 2) In the space below or on a piece of paper describe some situations in which you would choose to use a computer application to produce your schematic diagram and explain why
Exercise 3) Now describe some situations in which you would choose NOT to produce your schematic diagram using a computer application and explain why not
Exercise 4) Working with a partner brainstorm the advantages and disadvantages of producing schematic diagrams with a computer application rather than by hand
Foundation Computing
Basic Schematic Diagrams 5957docx Page 15
Suggested answers to the exercises 2) In the space below describe some situations in which you would choose to use a computer application to produce your schematic diagram and explain why Situations could include (and there are many more)
Preparing a flow chart to send by email to all the members of a team ndash because doing it on computer would allow me to make multiple copies and email them easily
Producing a complex network diagram as part of a report to present ndash because it would look more professional and could be easily changed or updated
Preparing an organisation chart to include in a computerised slideshow - because it could easily be imported
3) Now describe some situations in which you would choose NOT to produce your schematic diagram using a computer application and explain why not
Situations could include
Presenting an organisation diagram or a flow chart to a community organisation as a one-off event if I did not have access to a large-scale printer or projector I would draw or paint the diagram by hand ndash because it would be the simplest way to make it large enough for everyone to see and I would be unlikely to need more copies
In an assessment situation drawing a mind map or brainstorming diagram to organise my ideas before writing an essay or report ndash because it would be quickest
Working with a team to sketch out a plan for a process because it would be quickest and wouldnrsquot rely on being close to a computer
Foundation Computing
Basic Schematic Diagrams 5957docx Page 16
4) Working with a partner brainstorm the advantages and disadvantages of producing schematic diagrams with a computer application rather than by hand
Your results of your brainstorm might look like this (diagram produced using MS Visio)
Using computers AdvantagesDisadvantages
need to learn
application
can take longer
sometimes difficult
to plan
limited options for
layout
frustrating
too many options
incompatible file
types
can store on
computer
can fit more smaller
text
easy to read
can email to people
use templates
easy to change or
update
Can be quick
easy to make
copies
professional looking
import into
computer
documents
Expensive
equipment needed
technical problems
Security
Foundation Computing
Basic Schematic Diagrams 5957docx Page 17
Process for producing schematic diagrams on computer There are many different computer applications that can be used to produce schematic diagrams Some applications like Microsoft Visio are specifically designed to help you create a wide range of complex schematic diagrams easily However almost any computer application that has a drawing tool can be used to produce a schematic diagram and the process will usually involve the following steps 1) Design the diagram
a Identify your target audience b Collect all the information you need c Arrange your information in a logical order d Test your diagram
2) Create the diagram in the computer application
a Open the drawing window b Draw the shapes you want c Arrange the shapes according to your design d Add connectors between each of the shapes e Add text where required
Designing effective diagrams The main purpose of a schematic diagram is to provide a clear and easy to understand visual overview of how the different parts of a system fit together Schematic diagrams that are well-designed
are as simple as possible
are easy for the target audience to understand
include all relevant elements or parts of the process
have clear and logical connections between elements
communicate an accurate picture of the system or process
Foundation Computing
Basic Schematic Diagrams 5957docx Page 18
Identifying the target audience The target audience is the group of people who will read your schematic diagram The main question you need to ask yourself is Who is my audience In order to identify the target audience for your schematic diagram think about the following
What sort of person will read your diagram Think about that personrsquos job age education language environment and other characteristics that could affect the sort of language and symbols they will understand and relate to
What information will that person look for Why are they reading your diagram What do they want or need to know What information is most important What information is not so important
How much time will that person have to look at your diagram Will they be in a hurry or will they have time to study all the details Does your diagram have to stand alone or will it have a lot of text next to it to explain it
What do you want your audience to learn or do as a result of reading your diagram
What does the diagram need to show What information do you have to include How should this information be arranged
Foundation Computing
Basic Schematic Diagrams 5957docx Page 19
Exercise Complete the table below with information about the target audience and purpose for each of the examples of schematic diagrams given Use the questions above to help you
Example diagram Target audience
You work as an electrician and Mr Jones has asked you to design an electrical wiring plan for the dream house he wants to build
You are a computer programmer and you are using a flowchart to plan a computer program that farmers can use to keep count of their sheep
You have to write an essay about your most embarrassing childhood experience and you create a mindmap to organise your ideas
You are researching your family history and have been asked to create a family tree diagram for a booklet that will be handed out at an upcoming family reunion
Foundation Computing
Basic Schematic Diagrams 5957docx Page 20
Suggested Answer Complete the table below with information about the target audience and purpose for each of the examples of schematic diagrams given Use the questions above to help you
Example diagram Target audience
You work as an electrician and Mr Jones has asked you to design an electrical wiring plan for the dream house he wants to build
Mr Jones his builder local council officials theyrsquoll need detailed information that will be studied in depth and referred to during the planning and building process
You are a computer programmer and you are using a flowchart to plan a computer program that farmers can use to keep count of their sheep
You and other computer programmers will use the flowchart to understand the process of the programme and to identify flaws in its logic
You have to write an essay about your most embarrassing childhood experience and you create a mindmap to organise your ideas
You are the only person who will use your mindmap and you will refer to it as you write your essay
You are researching your family history and have been asked to create a family tree diagram for a booklet that will be handed out at an upcoming family reunion
Members of your family will look for their names and those of relatives in order to see how people are related to each other
Foundation Computing
Basic Schematic Diagrams 5957docx Page 21
TOPIC 2 Identifying the computer application required There are many computer applications that can be used to create schematic diagrams Microsoft Visio is specifically designed for this purpose but any application with basic drawing tools such as those found in Microsoft Word can be used One of the simplest and most widely available computer drawing applications is Microsoft Paint We will use this application is used to demonstrate the tools However most of the tools and principles we will focus on in Microsoft Paint can be found in other drawing applications The following diagram shows the Microsoft Paint window
The tools are arranged to the left of the drawing area in the Tool bar An overview of how to use the tools you need to create a simple schematic diagram is provided below Underneath the Tool bar is the Options box When you click on a tool icon in the Tool bar the options available for that tool appear in the Options box To select an option click on the tool you want to use then click on the option and then click in the drawing area and drag the mouse pointer to draw The Colour palette is underneath the drawing area To use a colour click on the tool you want to use then click on the colour and then click in the drawing area ndash the shape line or text you create will appear in the colour you have selected
Foundation Computing
Basic Schematic Diagrams 5957docx Page 22
Tools Selection Tools Use the selection tools to select the parts of your schematic diagram that you want to work with or change in some way To use these tools click on the button of the tool you want and then click on your diagram and drag until the area you want to work with is selected The Freeform Select tool (on the left) is used to select an irregularly shaped area The Rectangle Select tool is used to select a rectangular area To copy a part of your diagram eg a shape line or text it must first be selected using a selection tool Select Copy from the Edit menu click where you want the copy to be positioned and select Paste from the Edit menu Shapes tools
The shapes tools which can be used to create symbols in schematic diagrams consist of the Rectangle tool for creating squares or rectangles the Polygon tool for creating multi-sided shapes the Rounded Rectangle tool for creating rounded rectangles and the Oval tool for creating circles or ovals These tools provide templates for creating frequently used symbols To use them simply click on the icon of the shape you want to use and drag it onto your diagram where you can resize it if necessary and add text or
Foundation Computing
Basic Schematic Diagrams 5957docx Page 23
effects For the Polygon tool click and drag to draw the first side and click each time you want to change direction Double-click when you have finished To create a perfect circle hold down the Shift key while you are dragging the mouse pointer
Line tools In schematic diagrams line tools can be used to draw connectors between symbols and to draw shapes or symbols
The Straight Line tool creates straight lines simply click on the Straight Line icon click in your picture where you want the line to start and drag to where you want the line to finish The Curve tool will create a curve with at least one and no more than two bends in it click on the Curve icon then click in your picture to draw a straight line and drag to where you want the first bend to be click again where you want the second curve to be and drag to shape the curve You can make more complex shapes by joining lines and curves together
The Pencil tool can be used to draw freeform shapes or lines with as many bends and curves as you want Click on the icon click in your diagram and ldquodrawrdquo with your mouse pointer To draw straight lines hold down the shift key as you are drawing with the mouse
Foundation Computing
Basic Schematic Diagrams 5957docx Page 24
The Paint Brush tool draws freeform lines in the same way as the Pencil tool but can be used to create lines of varying widths and styles To select a paintbrush style click on the Paint Brush icon and then click in the Options box on the style you want to use
The Airbrush tool creates lines with an airbrushed effect of clustered dots It can be used in the same way as the pencil tool to draw freeform shapes or symbols In the Options box you can choose the size of the area covered by the Airbrush tool
Text tool
Add text to your schematic diagram by clicking on the Text icon and clicking in your diagram where you want the text to appear As you drag a rectangle will be formed within which text can be typed The Fonts dialogue box will also open
Foundation Computing
Basic Schematic Diagrams 5957docx Page 25
Fill Tool
The Fill tool will add colour to a shape that you have drawn Click on the icon click on a colour from the colour palette and then click on the shape in the diagram that you want to fill with colour
Zoom tool
Use the Zoom tool to magnify a section of the diagram that you are working with Click on the magnifying glass icon select the size you want in the Options box and click on the part of the image you want to enlarge As the picture zooms in the cursor will change back to the tool you were using before
Adding colour
The Colour box to the left of the Colour palette shows the foreground and background colours you are using If you click on a tool and then drag while holding down the left mouse button the line or shape will be drawn using the foreground colour If you hold down the right mouse button the background colour will be used To use any other colour click on the tool you want to use click on an option (if using) then click on the colour you want from the colour palette As you draw the colour you have clicked on will be used
Foundation Computing
Basic Schematic Diagrams 5957docx Page 26
Additional resources For more detailed information about these tools refer to the Help menu in Microsoft Paint (httpwindowshelpmicrosoftcom )
The following online tutorials may also be useful
httplkwdplorgclassesMSPaintpainthtml
httpwwwlesleyedufacultyahuntMSPttutrhtm
Exercise The example below shows a simple organisation chart produced using Microsoft Paint In the space that follows identify which tools were used to create this schematic diagram and what each tool was used for
Rectangle tool used to create Manager symbol
Oval tool used to create Team Leader symbols
Rounded Rectangle tool used for Team member symbols
Straight line tool used to create connectors
Text tool used to add text to shapes
Rectangle Select tool used to select shapes to move into
position
Foundation Computing
Basic Schematic Diagrams 5957docx Page 27
Suggested Answer The example below shows a simple organisation chart produced using Microsoft Paint In the space that follows identify which tools were used to create this schematic diagram and what each tool was used for
Rectangle tool used to create Manager symbol
Oval tool used to create Team Leader symbols
Rounded Rectangle tool used for Team member symbols
Straight line tool used to create connectors
Text tool used to add text to shapes
Rectangle Select tool used to select shapes to move into position
Foundation Computing
Basic Schematic Diagrams 5957docx Page 28
Exercise Which tools would you use to produce the following symbols or diagrams and why
Symbol Tools and justification
Resistor (Electrical circuit diagram)
Speaker (Electrical circuit diagram)
AC
AC source (Electrical circuit diagram)
Start or end of process (Flowchart)
Decision (yes or no) (Flowchart)
Instructions or actions (Flowchart)
Foundation Computing
Basic Schematic Diagrams 5957docx Page 29
Symbol Tools and justification
Document produced (Flowchart)
Data entered or received (Flowchart)
Foundation Computing
Basic Schematic Diagrams 5957docx Page 30
Suggested Answers Which tools would you use to produce the following symbols or diagrams and why
Symbol Tools and justification
Resistor (Electrical circuit diagram)
Straight line tool (hold down shift key)It creates regular 45 degree angled lines that are perfectly straight
Speaker (Electrical circuit diagram)
Polygon tool (hold down shift key) Rectangle tool and Straight line tool These are used in order to create a symbol with uniform angles and straight edges
AC
AC source (Electrical circuit diagram)
Oval tool (hold down shift key) to draw circle Curve tool to draw wavy line Straight line tool and Text tool These tools produce cleaner shapes than drawing freeform
Start or end of process (Flowchart)
Rounded rectangle tool This provides a template for creating this symbol
Decision (yes or no) (Flowchart)
Polygon tool This creates more accurate joins between sides than the Straight line tool
Instructions or actions (Flowchart)
Rectangle tool It provides a template for drawing this shape
Foundation Computing
Basic Schematic Diagrams 5957docx Page 31
Symbol Tools and justification
Document produced (Flowchart)
Line tool and Curve tool ndash need two tools in MSPaint other applications may have a template for this shape
Data entered or received (Flowchart)
Polygon tool ndash better than Straight line tool because can produce more regular shape
Foundation Computing
Basic Schematic Diagrams 5957docx Page 32
TOPIC 3 Getting started with MS Paint Sourced from httpwindowsmicrosoftcomen-NZwindows7Getting-started-with-Paint MS Paint is a feature in Windows that you can use to draw colour and edit pictures You can use Paint like a digital sketchpad to make simple pictures creative projects or to add text and designs to other pictures such as those taken with your digital camera The parts of Paint Open Paint by clicking the Start button clicking All Programs clicking Accessories and then clicking Paint When you start Paint youll see an empty window drawing and painting tools are located in the ribbon at the top of the window The following illustration shows the different parts of the Paint window
The Paint window
Foundation Computing
Basic Schematic Diagrams 5957docx Page 33
Working with tools The ribbon in Paint includes a handy collection of drawing tools You can use these tools to create freehand drawings and add a variety of shapes to your pictures This section describes some common tasks For more detailed information on how to use the different tools in Paint see Using Paint Draw a line Some tools and shapes such as the Pencil Brush Line and Curve let you make a variety of straight curved and squiggly lines What you draw is determined by how you move the mouse as you draw You can use the Line to draw a straight line for example
1) On the Home tab in the Shapes group click the Line 2) In the Colors group click Color 1 and then click the color you want to use 3) To draw drag the pointer across the drawing area
Draw a squiggly line Your drawings dont have to be composed of only straight lines The Pencil and Brushes can be used to make completely random free-form shapes
1) On the Home tab in the Tools group click the Pencil tool 2) In the Colors group click Color 1 and then click the color you want to use 3) To draw drag the pointer across the drawing area and make a squiggly line
Note If you want to make a line that has a different appearance use one of the Brushes instead Draw a shape Paint lets you draw many different shapes For example you can draw ready-made defined shapes such as rectangles circles squares triangles and arrows (to name a
few) You can also make your own custom shape by using the Polygon shape to draw a polygon which is a shape that can have any number of sides
1) On the Home tab in the Shapes group click a ready-made shape such as the
Rectangle 2) To add a ready-made shape drag the pointer across the drawing area to make
the shape 3) To change the outline style in the Shapes group click Outline and then click an
outline style 4) If you dont want your shape to have an outline click No outline 5) In the Colors group click Color 1 and then click a color for the outline 6) In the Colors group click Color 2 and then click a color to use to fill the shape 7) To change the fill style in the Shapes group click Fill and then click a fill style 8) If you dont want your shape to be filled click No fill
Foundation Computing
Basic Schematic Diagrams 5957docx Page 34
Add text You can also add text to your picture The Text tool lets you add a simple message or title
1) On the Home tab in the Tools group click the Text tool 2) Drag the pointer in the drawing area where you want to add text 3) Under Text Tools on the Text tab click the font face size and style in the Font
group The Font group
4) In the Colors group click Color 1 and then click a color This is the text color 5) Type the text that you want to add
Erase part of your picture If you make a mistake or need to change part of a picture use the eraser By default the eraser changes any area you erase to white but you can change the eraser color For example if you set the background color to yellow anything you erase turns to yellow
1) On the Home tab in the Tools group click the Eraser tool 2) In the Colors group click Color 2 and then click the color that you want to erase
with If you want to erase with white you dont have to select a color 3) Drag the pointer over the area you want to erase
Saving a picture Save your picture frequently so you dont accidentally lose your work To save click the
Paint button and then click Save This saves all of the changes made to the picture since the last time you saved The very first time that you save a new picture you will need to give your picture a file name Follow these steps
1) Click the Paint button and then click Save 2) In the Save as type box select the file format you want 3) In the File name box type a name and then click Save
Foundation Computing
Basic Schematic Diagrams 5957docx Page 35
Topic 4 Designing your diagram Although there are many different types of schematic diagrams the basic process and principles involved in designing a clear and coherent diagram are similar The principles apply to designing an electrical circuit diagram an organisation chart a mind map a flow chart and many other diagrams Some of these principles are also worth applying to other disciplines such as designing a Web page Letrsquos work step-by-step through the process of creating a flow chart to help people make money selling things on an on-line auction site such as wwwtrademeconz or wwwebaycom
Step 1 Gather your information Start by brainstorming all the information you need to include in your diagram Write down everything you think might be important or should be included
trademe
choose things that
sell
good photograph
feedback
keep track
prompt answers
postage
auction length
similar listings
postal system
setting reserve
describing item
correct category
re-listing
fixed offers
Look at the information you have gathered and think about your target audience Highlight the information that is most important to your target audience Cross out any irrelevant information Put question marks next to information that you are unsure about or may be able to leave out
Foundation Computing
Basic Schematic Diagrams 5957docx Page 36
Step 2 Organise your information Take the information that you have left and sort through it How you organise your information will depend on the type of diagram you are designing For example an organisationrsquos chart usually has different levels and shows who its members report to so you might group people by department and by level A flow chart like the example wersquore creating usually shows a process Information is grouped in the order we would use it If any other steps or information occurs to you as you are organising your information add them in Herersquos an example of how the key steps involved in selling on trademe could be ordered
Choose items that sell
Look at similar listings
Decide on a reserve price
Take a clear photograph
Identify your target audience
Write a clear description
Upload your item
Choose the correct category
Monitor watchers bids and views
Lower your reserve
Fixed price offers
Relist
Step 3 Make connections Once the elements are grouped or arranged in a logical order a clearer picture of the process or system you are representing in your diagram should start to emerge However unlike a list which usually reads from top to bottom only a diagram can show connections in many different directions and working out the links between elements is an essential part of designing a coherent diagram At this stage of the design process it is helpful to sketch out a basic plan of the elements you want to include and the flow-lines or connections between them In order to work out the connections between the elements ask questions such as What happens ifhellip What do I do beforeafter this What decisions need to be made now What actions need to be taken Use arrows to show connections between elements group elements that are part of the same stage or level of the process next to or near to each other and use shapes to show which elements are similar to each other eg diamonds for decisions rectangles for instructions or actions Make up your own meanings for shapes if necessary but be sure to use them consistently
Foundation Computing
Basic Schematic Diagrams 5957docx Page 37
The flow chart below shows how our list of elements above changes and gets re-ordered as we ask these questions and organise the information into a logical and coherent diagram
Decide on your
reserve price
START
Relist
Take a photo that is
clear and item looks
good
Decide on your
ideal buyer
Write a description
of your item
highlighting its
benefits for your
buyer
Upload your item in
a category your
buyer is likely to be
looking in
Monitor how many
views watchers and
bids your item gets
Lower your reserve
Item meets reserve
and sellsItem doesnrsquot sell
Offer to watchers for
your reserve
Decide what you
want to sell
Check what similar
items are currently
selling for
Lots of views but
no watchers
No interestFINISH
Foundation Computing
Basic Schematic Diagrams 5957docx Page 38
Step 4 Test your diagram The final step in designing your diagram is checking that it is as effective as possible To do this you should work through each stage step by step challenging it as you go Picture the process in your mind as you follow the links checking that you have included all the actions and decisions required that they are in the correct order and that no steps are duplicated Once yoursquore confident that the diagram is correct look at it again critically to see if you can improve it or clarify it Is there anywhere you can simplify it by removing unnecessary steps Is there anywhere that seems vague and would be easier to understand if you added a step or a connector Now imagine that you are a member of your target audience For a moment try to forget everything you know about the system or process you have designed a diagram for except for what your target audience knows Look at the diagram with fresh eyes does it make sense to you now Does anything seem odd confusing or out of place Finally look at the layout of your diagram Is it easy to read and follow Have you used shapes texts and arrows consistently Are your shapes and texts uniform and lined up properly Are your connectors clearly defined or are they criss-crossing all over each other Check the spelling of labels carefully ndash go through letter by letter to make sure all names and technical or unfamiliar terms are correct
Discussion With a partner look critically at our example diagram above Discuss any parts of it that you think could be better and any changes you would make to improve the readability of the flow chart Make note on the flow chart above of any areas that you think could be improved Share your answers with the rest of the class
Foundation Computing
Basic Schematic Diagrams 5957docx Page 39
Self Test 1) Mr Biggles owns Biggles Air Supplies a company that makes aircraft supplies He asks you to create an organisation chart for his company He gives you the following list of all his employees and who they report to
Mr James Biggles Chief Executive Officer
Jane Doep Personal Assistant to CEO
Mrs Monica Stepworth Financial Manager (reports to CEO)
Judith Zantes Accountant (reports to Financial Manager)
Mary Smallville Accountant (reports to Financial Manager)
Janey Poretuna Admin Assistant (reports to Judith Zantes)
Mickey Laluevu IT technician (reports to Financial Manager)
Mr Hank Johnson Operations Manager (reports to CEO)
Frank Hapil Engineering Manager (reports to Operations Manager)
Joe Smither Engineering Supervisor (reports to Engineering Manager)
Howie Fartherton Engineering Technician (reports to Engineering Supervisor)
Ernie Jusef Engineering Technician (reports to Engineering Supervisor)
Rob Luxemburg Apprentice Technician (reports to Ernie Jusef)
Harry Monahan Interiors Manager (reports to Operations Manager)
Barney Jokka Interiors Technician (reports to Interiors Supervisor) Design an organisation chart for Biggles Air Supplies and draw it in the space below
2) Think of a simple process that has at least five steps and involves some form of feedback or choice For example operating a vending machine topping up your mobile phone using EFTPOS checking messages on an answering machine
Design a flow chart to represent your process
Foundation Computing
Basic Schematic Diagrams 5957docx Page 40
Self Test Answers
1) Mr Biggles owns Biggles Air Supplies a company that makes aircraft supplies He asks you to create an organisation chart for his company He gives you the following list of all his employees and who they report to
Mr James Biggles Chief Executive Officer
Jane Doep Personal Assistant to CEO
Mrs Monica Stepworth Financial Manager (reports to CEO)
Judith Zantes Accountant (reports to Financial Manager)
Mary Smallville Accountant (reports to Financial Manager)
Janey Poretuna Admin Assistant (reports to Judith Zantes)
Mickey Laluevu IT technician (reports to Financial Manager)
Mr Hank Johnson Operations Manager (reports to CEO)
Frank Hapil Engineering Manager (reports to Operations Manager)
Joe Smither Engineering Supervisor (reports to Engineering Manager)
Howie Fartherton Engineering Technician (reports to Engineering Supervisor)
Ernie Jusef Engineering Technician (reports to Engineering Supervisor)
Rob Luxemburg Apprentice Technician (reports to Ernie Jusef)
Harry Monahan Interiors Manager (reports to Operations Manager)
Barney Jokka Interiors Technician (reports to Interiors Supervisor) Design an organisation chart for Biggles Air Supplies and draw it in the space below
Mr James Biggles
CEO
Jane Doep
Personal
Assistant
Mrs Monica Stepworth
Financial Manager
Judith Zantes
Accountant
Janey Poretuna
Admin Assistant
Mary Smallville
Accountant
Mickey Laluevu
IT technician
Mr Hank Johnson
Operations Manager
Frank Hapil
Engineering
Manager
Harry Monahan
Interiors Manager
Joe Smither
Engineering
Supervisor
Howie Fartherton
Engineering
Technician
Ernie Jusef
Engineering
Technician
Rob Luxemburg
Apprentice
Technician
Barney Jokka
Interiors
Technician
Foundation Computing
Basic Schematic Diagrams 5957docx Page 41
2) Think of a simple process that has at least five steps and involves some form of feedback or choice For example operating a vending machine topping up your mobile phone using EFTPOS checking messages on an answering machine
Design a flow chart to represent your process
Dial 06345
Enter your dialing code and
phone number followed by
the key
Dial number for
service you require
Listen to saved messagesListen to new messages
Dial number for
service you require
Save message Delete message
START
FINISH
Dial 2
Dial 1
Dial 1
Dial 2
Dial 1
Dial 2
Foundation Computing
Basic Schematic Diagrams 5957docx Page 42
Foundation Computing
Basic Schematic Diagrams 5957docx Page 43
Part 2
Produce schematic diagrams from a given brief using a computer application
OBJECTIVES
On successful completion of this section you will be able to Produce schematic diagrams from a given brief using a computer application
Performance criteria
21 The symbols used in each diagram are consistent with the type of diagram and the specifications of the brief
22 The final diagram is readable clearly illustrates the object being diagrammed
and is consistent with the specifications of the brief
TOPICS
Topic 1 Symbols used are consistent with diagram type and specifications Topic 2 Diagram is clear readable and consistent with specifications
Self Test
Self Test Answers
Foundation Computing
Basic Schematic Diagrams 5957docx Page 44
TOPIC 1 Symbols used are consistent with diagram type and specifications A symbol is something such as an object picture written word sound or particular mark that represents something else by association resemblance or convention For example a red octagon may be a symbol for STOP On maps crossed sabres may indicate a battlefield Numerals are symbols for numbers All language consists of symbols The word cat is not a cat but is an arbitrary symbol representing the idea of a cat There are many symbols for many things Examples range from Peace Pipe Red Cross to Electrical symbols It is good when doing schematic drawings to use symbols that are clearly recognised and interpreted Symbols that have been internationally standardised are the best Circuit diagram symbols have differed from country to country and have changed over time They are now to a large extent internationally standardized Simple components often had symbols intended to represent some feature of the physical construction of the device There are several national and international standards for graphical symbols in circuit diagrams in particular
IEC 60617 (also known as British Standard BS 3939)
ANSI standard Y32 (also known as IEEE Std 315) IEC 60617 originally consisted of 13 parts from resistors and capacitors to logic symbols and even a generalised drawing standard of connections and bus line widths It is now published as a subscription online database IEC 60617-DB Different symbols may be used depending on the discipline using the drawing for example lighting and power symbols used as part of architectural drawings may be different from symbols for devices used in electronics Different electronic components have different characteristics it is necessary to distinguish between them in any circuit diagram Of course we could use the block diagram approach and just identify each component with words Unfortunately this takes up a lot of space and makes the overall diagram harder to recognize or understand quickly We need a way to understand electrical diagrams far more quickly and easily
Foundation Computing
Basic Schematic Diagrams 5957docx Page 45
The answer is to use schematic symbols to represent electronic components as shown in the diagram below In this diagram we show the schematic symbol of a battery as the electrical source and the symbol of a resistor as the load Even without the words and arrows the symbols define exactly what this circuit is and how it behaves
Some good procedures to follow with symbols include
Using templates for frequently used symbols
Use symbols consistently
Use a library of symbols such as from IEC 60617-DB
Foundation Computing
Basic Schematic Diagrams 5957docx Page 46
TOPIC 2 Diagram is clear readable and consistent with specifications Creating a simple diagram using MSPaint To start with letrsquos create a simple flow chart representing the stages in designing a schematic diagram There are four stages in this process
1) Gather your information 2) Organise your information 3) Make connections 4) Test your diagram
Our flow chart will consist of four rectangles arranged vertically with downward pointing arrows as connectors A rounded rectangle at the top and at the bottom of the flowchart will indicate START and FINISH respectively Step by step
Open Microsoft Paint
Click on the Rectangle tool then click and drag in the drawing area to draw a rectangle
Repeat this step to draw four boxes in the drawing area OR click on the Select tool and click and drag to select the first rectangle then right-click to copy and paste three more rectangles the same size in the drawing area
Foundation Computing
Basic Schematic Diagrams 5957docx Page 47
Using the Rounded Rectangle tool draw a rounded rectangle at the top and bottom of your flow chart
Foundation Computing
Basic Schematic Diagrams 5957docx Page 48
Use the Line tool to draw arrows between each box In the Options area under the Tool bar you can choose the thickness of line that you want to use Remember too that if you hold down the Shift key on the keyboard while you are drawing a line you can create a 45 degree angle
Use the Text tool to add text to the shapes by clicking on the Text tool clicking and dragging to create a textbox inside your shape then typing your text Check your spelling carefully letter by letter as you go
Foundation Computing
Basic Schematic Diagrams 5957docx Page 49
The basic flowchart created in Microsoft Paint could look something like this
Foundation Computing
Basic Schematic Diagrams 5957docx Page 50
Common problems with diagrams Even well-designed schematic diagrams will be difficult for the target audience to read and understand if symbols are used inconsistently or the layout of the diagram is unfamiliar For example if a flowchart has different shapes used for each element and different types of arrows used randomly it will be more difficult for readers to see the overall direction and meaning of the diagram If the shapes on an organisation chart are different sizes and randomly positioned with no clear levels or hierarchy the diagram will not provide a clear overview of the organisationrsquos structure If an electrical circuit diagram has unfamiliar symbols used for elements such as switches resistors and batteries then it will not make sense to its intended audience
Tips for improving the readability of your schematic diagrams
Use symbols and shapes consistently ie elements that are similar should have the same symbol or shape
Avoid having connectors crossing over each other
Avoid having symbols or shapes overlapping
Use arrows on connectors or flow lines to indicate direction
Use colours text size and font consistently
Diagrams that can be read top-to-bottom and left-to-right are easier to read
In a process diagram have only one connector leading into a symbol but have more coming out where necessary to indicate different directions or decisions
Diagrams for a technical audience such as electrical or computer programming schematics should follow accepted conventions for symbols and layout
Diagrams indicating a hierarchy of positions ideas or stages are clearer if elements belonging to the same level are a similar shape size and position on the page
Keep labels as clear and as brief as possible Carefully check the spelling of all names and labels letter by letter ndash errors in the spelling of names or scientific and technical terms look unprofessional and can be confusing for readers
Foundation Computing
Basic Schematic Diagrams 5957docx Page 51
Self Test Look at the schematic diagrams that follow Make notes under each example of what is wrong with the diagram what is right about the diagram and what could be changed to make it clear and meaningful to its intended audience 1) This flow chart is supposed to show police officers how to get a suspect to confess to a crime
START
Confidently accuse
suspect of crime
Describe a
scenario that
enables suspect
to admit guiltAllow suspect to
voice objections
Invade suspectrsquos
personal space
Suspect becomes
uncomfortable
Suspect
doesnrsquot
deny guilt
Suspect
denies guilt
No reaction
Elicit confession
Rephrase objections as
confessions
FINISH
Foundation Computing
Basic Schematic Diagrams 5957docx Page 52
2) The following diagram is an organisation chart for Widget Enterprises
John Smith
MANAGER
Seth Drew
IT MANAGER
May Furur
SECRETARY
Judith Holland
CUSTOMER SERVICES manager
Jad Ling
HELPDESK
Harry Petal
FINANCIAL MANAGER
Wanda Springer
MARKETING
MANAGER
Bob Smithells
CLEANER
Kelly Inlerl
MARKETING ASSISTANT
Beryl Thin
CUSTOMER SERVICES ASSISTANTValda Rigley
CUSTOMER
SERVICES
ASSISTANT
Levi Quayle
COMPUTER
TECHNICIAN
3) Which of the following computer applications can be used to create schematic diagrams
a) Microsoft Visio
b) Microsoft Paint
c) Microsoft Word
d) All of the above
4) Which frequently used shapes does the Microsoft Paint Tool bar contain templates for
5) Where in the Microsoft Paint window would you be able to select the thickness of line that you wanted for a brushstroke 6) Identify the purpose and intended audience for a diagram showing a businessrsquos marketing plan 7) Name two characteristics of well-designed schematic diagrams 8) Identify four steps involved in designing schematic diagrams 9) Why is it important to use conventionally accepted and familiar shapes and symbols in your schematic diagrams
Foundation Computing
Basic Schematic Diagrams 5957docx Page 53
Self Test Answers 1) This flow chart is supposed to show police officers how to get a suspect to confess to a crime
START
Confidently accuse
suspect of crime
Describe a
scenario that
enables suspect
to admit guiltAllow suspect to
voice objections
Invade suspectrsquos
personal space
Suspect becomes
uncomfortable
Suspect
doesnrsquot
deny guilt
Suspect
denies guilt
No reaction
Elicit confession
Rephrase objections as
confessions
FINISH
Random shapes are meaningless and confusing ndash use conventional flow chart symbols
Stages of process are not clear ndash arrange shapes top to bottom with options at each stage branching off to side at same level
Connectors that are either straight or curved would be more consistent
Labels are clear
Text uses consistent font and size
Foundation Computing
Basic Schematic Diagrams 5957docx Page 54
2) The following diagram is an organisation chart for Widget Enterprises
John Smith
MANAGER
Seth Drew
IT MANAGER
May Furur
SECRETARY
Judith Holland
CUSTOMER SERVICES manager
Jad Ling
HELPDESK
Harry Petal
FINANCIAL MANAGER
Wanda Springer
MARKETING
MANAGER
Bob Smithells
CLEANER
Kelly Inlerl
MARKETING ASSISTANT
Beryl Thin
CUSTOMER SERVICES ASSISTANTValda Rigley
CUSTOMER
SERVICES
ASSISTANT
Levi Quayle
COMPUTER
TECHNICIAN
No clear levels to hierarchy ndash organise so that diagram reads top to bottom and positions at similar level are in same horizontal space
Different sized boxes and borders on some boxes are meaningless ndash need consistent style for similar elements
Connectors cross over each other and boxes overlap ndash arrange space to avoid this
Text size and font is mostly consistent but one typo needs correcting
3) Which of the following computer applications can be used to create schematic diagrams
a) Microsoft Visio
b) Microsoft Paint
c) Microsoft Word
d) All of the above correct
4) Which frequently used shapes does the Microsoft Paint Tool bar contain templates for
Polygon rectangle ovalellipse
Foundation Computing
Basic Schematic Diagrams 5957docx Page 55
5) Where in the Microsoft Paint window would you be able to select the thickness of line that you wanted for a brushstroke
Options area below the Toolbar
6) Identify the purpose and intended audience for a diagram showing a businessrsquos marketing plan
The purpose would be to provide an overview of the businessrsquos marketing strategy Audience could include management and employees of the business especially the Marketing department potential investors shareholders and directors of the business
7) Name two characteristics of well-designed schematic diagrams Any of simple easy for the target audience to understand include all relevant elements or parts of the process clear and logical connections between elements accurate 8) Identify four steps involved in designing schematic diagrams Gather information organise information make connections between elements test your diagram 9) Why is it important to use conventionally accepted and familiar shapes and
symbols in your schematic diagrams So that the diagram will be easily understood by the target audience
Foundation Computing
Basic Schematic Diagrams 5957docx Page 56
References httpwindowsmicrosoftcomen-NZwindows7Getting-started-with-Paint accessed Sat 5th December in Timaru New Zealand httpenwikipediaorgwikiSchematic_diagrams accessed Sat 5th December in Timaru New Zealand httpenwikipediaorgwikiSymbol accessed Sat 5th December in Timaru New Zealand
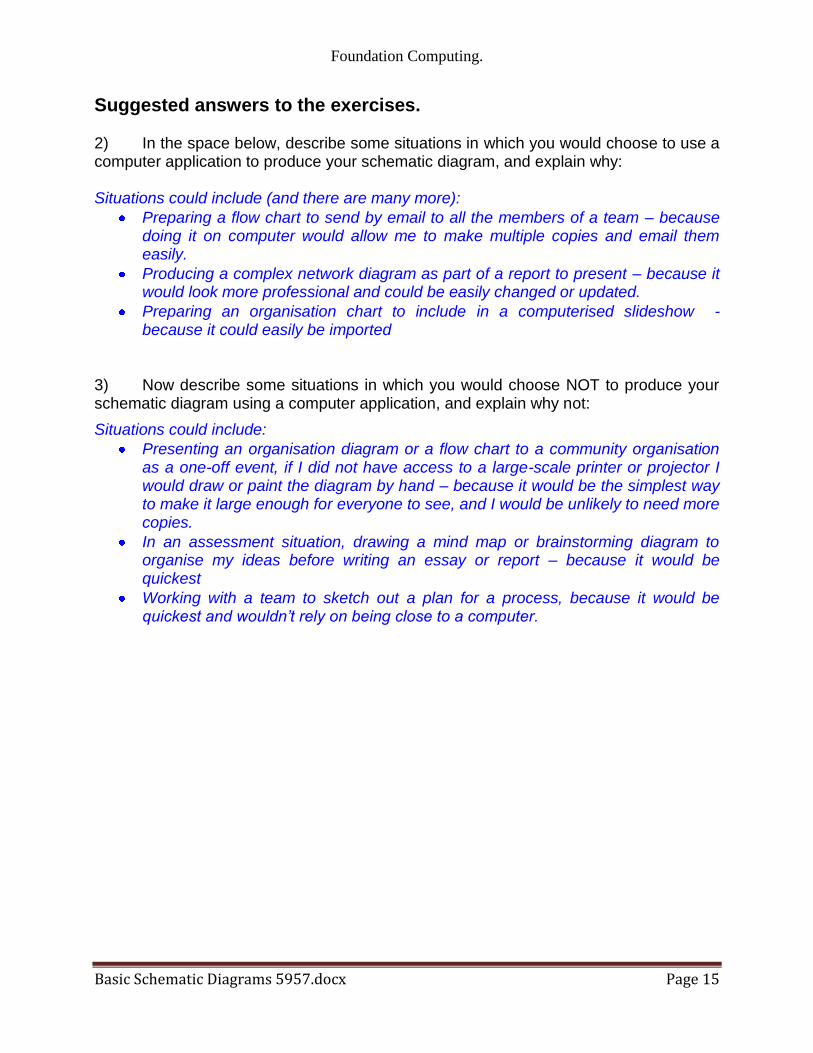
Foundation Computing
Basic Schematic Diagrams 5957docx Page 15
Suggested answers to the exercises 2) In the space below describe some situations in which you would choose to use a computer application to produce your schematic diagram and explain why Situations could include (and there are many more)
Preparing a flow chart to send by email to all the members of a team ndash because doing it on computer would allow me to make multiple copies and email them easily
Producing a complex network diagram as part of a report to present ndash because it would look more professional and could be easily changed or updated
Preparing an organisation chart to include in a computerised slideshow - because it could easily be imported
3) Now describe some situations in which you would choose NOT to produce your schematic diagram using a computer application and explain why not
Situations could include
Presenting an organisation diagram or a flow chart to a community organisation as a one-off event if I did not have access to a large-scale printer or projector I would draw or paint the diagram by hand ndash because it would be the simplest way to make it large enough for everyone to see and I would be unlikely to need more copies
In an assessment situation drawing a mind map or brainstorming diagram to organise my ideas before writing an essay or report ndash because it would be quickest
Working with a team to sketch out a plan for a process because it would be quickest and wouldnrsquot rely on being close to a computer
Foundation Computing
Basic Schematic Diagrams 5957docx Page 16
4) Working with a partner brainstorm the advantages and disadvantages of producing schematic diagrams with a computer application rather than by hand
Your results of your brainstorm might look like this (diagram produced using MS Visio)
Using computers AdvantagesDisadvantages
need to learn
application
can take longer
sometimes difficult
to plan
limited options for
layout
frustrating
too many options
incompatible file
types
can store on
computer
can fit more smaller
text
easy to read
can email to people
use templates
easy to change or
update
Can be quick
easy to make
copies
professional looking
import into
computer
documents
Expensive
equipment needed
technical problems
Security
Foundation Computing
Basic Schematic Diagrams 5957docx Page 17
Process for producing schematic diagrams on computer There are many different computer applications that can be used to produce schematic diagrams Some applications like Microsoft Visio are specifically designed to help you create a wide range of complex schematic diagrams easily However almost any computer application that has a drawing tool can be used to produce a schematic diagram and the process will usually involve the following steps 1) Design the diagram
a Identify your target audience b Collect all the information you need c Arrange your information in a logical order d Test your diagram
2) Create the diagram in the computer application
a Open the drawing window b Draw the shapes you want c Arrange the shapes according to your design d Add connectors between each of the shapes e Add text where required
Designing effective diagrams The main purpose of a schematic diagram is to provide a clear and easy to understand visual overview of how the different parts of a system fit together Schematic diagrams that are well-designed
are as simple as possible
are easy for the target audience to understand
include all relevant elements or parts of the process
have clear and logical connections between elements
communicate an accurate picture of the system or process
Foundation Computing
Basic Schematic Diagrams 5957docx Page 18
Identifying the target audience The target audience is the group of people who will read your schematic diagram The main question you need to ask yourself is Who is my audience In order to identify the target audience for your schematic diagram think about the following
What sort of person will read your diagram Think about that personrsquos job age education language environment and other characteristics that could affect the sort of language and symbols they will understand and relate to
What information will that person look for Why are they reading your diagram What do they want or need to know What information is most important What information is not so important
How much time will that person have to look at your diagram Will they be in a hurry or will they have time to study all the details Does your diagram have to stand alone or will it have a lot of text next to it to explain it
What do you want your audience to learn or do as a result of reading your diagram
What does the diagram need to show What information do you have to include How should this information be arranged
Foundation Computing
Basic Schematic Diagrams 5957docx Page 19
Exercise Complete the table below with information about the target audience and purpose for each of the examples of schematic diagrams given Use the questions above to help you
Example diagram Target audience
You work as an electrician and Mr Jones has asked you to design an electrical wiring plan for the dream house he wants to build
You are a computer programmer and you are using a flowchart to plan a computer program that farmers can use to keep count of their sheep
You have to write an essay about your most embarrassing childhood experience and you create a mindmap to organise your ideas
You are researching your family history and have been asked to create a family tree diagram for a booklet that will be handed out at an upcoming family reunion
Foundation Computing
Basic Schematic Diagrams 5957docx Page 20
Suggested Answer Complete the table below with information about the target audience and purpose for each of the examples of schematic diagrams given Use the questions above to help you
Example diagram Target audience
You work as an electrician and Mr Jones has asked you to design an electrical wiring plan for the dream house he wants to build
Mr Jones his builder local council officials theyrsquoll need detailed information that will be studied in depth and referred to during the planning and building process
You are a computer programmer and you are using a flowchart to plan a computer program that farmers can use to keep count of their sheep
You and other computer programmers will use the flowchart to understand the process of the programme and to identify flaws in its logic
You have to write an essay about your most embarrassing childhood experience and you create a mindmap to organise your ideas
You are the only person who will use your mindmap and you will refer to it as you write your essay
You are researching your family history and have been asked to create a family tree diagram for a booklet that will be handed out at an upcoming family reunion
Members of your family will look for their names and those of relatives in order to see how people are related to each other
Foundation Computing
Basic Schematic Diagrams 5957docx Page 21
TOPIC 2 Identifying the computer application required There are many computer applications that can be used to create schematic diagrams Microsoft Visio is specifically designed for this purpose but any application with basic drawing tools such as those found in Microsoft Word can be used One of the simplest and most widely available computer drawing applications is Microsoft Paint We will use this application is used to demonstrate the tools However most of the tools and principles we will focus on in Microsoft Paint can be found in other drawing applications The following diagram shows the Microsoft Paint window
The tools are arranged to the left of the drawing area in the Tool bar An overview of how to use the tools you need to create a simple schematic diagram is provided below Underneath the Tool bar is the Options box When you click on a tool icon in the Tool bar the options available for that tool appear in the Options box To select an option click on the tool you want to use then click on the option and then click in the drawing area and drag the mouse pointer to draw The Colour palette is underneath the drawing area To use a colour click on the tool you want to use then click on the colour and then click in the drawing area ndash the shape line or text you create will appear in the colour you have selected
Foundation Computing
Basic Schematic Diagrams 5957docx Page 22
Tools Selection Tools Use the selection tools to select the parts of your schematic diagram that you want to work with or change in some way To use these tools click on the button of the tool you want and then click on your diagram and drag until the area you want to work with is selected The Freeform Select tool (on the left) is used to select an irregularly shaped area The Rectangle Select tool is used to select a rectangular area To copy a part of your diagram eg a shape line or text it must first be selected using a selection tool Select Copy from the Edit menu click where you want the copy to be positioned and select Paste from the Edit menu Shapes tools
The shapes tools which can be used to create symbols in schematic diagrams consist of the Rectangle tool for creating squares or rectangles the Polygon tool for creating multi-sided shapes the Rounded Rectangle tool for creating rounded rectangles and the Oval tool for creating circles or ovals These tools provide templates for creating frequently used symbols To use them simply click on the icon of the shape you want to use and drag it onto your diagram where you can resize it if necessary and add text or
Foundation Computing
Basic Schematic Diagrams 5957docx Page 23
effects For the Polygon tool click and drag to draw the first side and click each time you want to change direction Double-click when you have finished To create a perfect circle hold down the Shift key while you are dragging the mouse pointer
Line tools In schematic diagrams line tools can be used to draw connectors between symbols and to draw shapes or symbols
The Straight Line tool creates straight lines simply click on the Straight Line icon click in your picture where you want the line to start and drag to where you want the line to finish The Curve tool will create a curve with at least one and no more than two bends in it click on the Curve icon then click in your picture to draw a straight line and drag to where you want the first bend to be click again where you want the second curve to be and drag to shape the curve You can make more complex shapes by joining lines and curves together
The Pencil tool can be used to draw freeform shapes or lines with as many bends and curves as you want Click on the icon click in your diagram and ldquodrawrdquo with your mouse pointer To draw straight lines hold down the shift key as you are drawing with the mouse
Foundation Computing
Basic Schematic Diagrams 5957docx Page 24
The Paint Brush tool draws freeform lines in the same way as the Pencil tool but can be used to create lines of varying widths and styles To select a paintbrush style click on the Paint Brush icon and then click in the Options box on the style you want to use
The Airbrush tool creates lines with an airbrushed effect of clustered dots It can be used in the same way as the pencil tool to draw freeform shapes or symbols In the Options box you can choose the size of the area covered by the Airbrush tool
Text tool
Add text to your schematic diagram by clicking on the Text icon and clicking in your diagram where you want the text to appear As you drag a rectangle will be formed within which text can be typed The Fonts dialogue box will also open
Foundation Computing
Basic Schematic Diagrams 5957docx Page 25
Fill Tool
The Fill tool will add colour to a shape that you have drawn Click on the icon click on a colour from the colour palette and then click on the shape in the diagram that you want to fill with colour
Zoom tool
Use the Zoom tool to magnify a section of the diagram that you are working with Click on the magnifying glass icon select the size you want in the Options box and click on the part of the image you want to enlarge As the picture zooms in the cursor will change back to the tool you were using before
Adding colour
The Colour box to the left of the Colour palette shows the foreground and background colours you are using If you click on a tool and then drag while holding down the left mouse button the line or shape will be drawn using the foreground colour If you hold down the right mouse button the background colour will be used To use any other colour click on the tool you want to use click on an option (if using) then click on the colour you want from the colour palette As you draw the colour you have clicked on will be used
Foundation Computing
Basic Schematic Diagrams 5957docx Page 26
Additional resources For more detailed information about these tools refer to the Help menu in Microsoft Paint (httpwindowshelpmicrosoftcom )
The following online tutorials may also be useful
httplkwdplorgclassesMSPaintpainthtml
httpwwwlesleyedufacultyahuntMSPttutrhtm
Exercise The example below shows a simple organisation chart produced using Microsoft Paint In the space that follows identify which tools were used to create this schematic diagram and what each tool was used for
Rectangle tool used to create Manager symbol
Oval tool used to create Team Leader symbols
Rounded Rectangle tool used for Team member symbols
Straight line tool used to create connectors
Text tool used to add text to shapes
Rectangle Select tool used to select shapes to move into
position
Foundation Computing
Basic Schematic Diagrams 5957docx Page 27
Suggested Answer The example below shows a simple organisation chart produced using Microsoft Paint In the space that follows identify which tools were used to create this schematic diagram and what each tool was used for
Rectangle tool used to create Manager symbol
Oval tool used to create Team Leader symbols
Rounded Rectangle tool used for Team member symbols
Straight line tool used to create connectors
Text tool used to add text to shapes
Rectangle Select tool used to select shapes to move into position
Foundation Computing
Basic Schematic Diagrams 5957docx Page 28
Exercise Which tools would you use to produce the following symbols or diagrams and why
Symbol Tools and justification
Resistor (Electrical circuit diagram)
Speaker (Electrical circuit diagram)
AC
AC source (Electrical circuit diagram)
Start or end of process (Flowchart)
Decision (yes or no) (Flowchart)
Instructions or actions (Flowchart)
Foundation Computing
Basic Schematic Diagrams 5957docx Page 29
Symbol Tools and justification
Document produced (Flowchart)
Data entered or received (Flowchart)
Foundation Computing
Basic Schematic Diagrams 5957docx Page 30
Suggested Answers Which tools would you use to produce the following symbols or diagrams and why
Symbol Tools and justification
Resistor (Electrical circuit diagram)
Straight line tool (hold down shift key)It creates regular 45 degree angled lines that are perfectly straight
Speaker (Electrical circuit diagram)
Polygon tool (hold down shift key) Rectangle tool and Straight line tool These are used in order to create a symbol with uniform angles and straight edges
AC
AC source (Electrical circuit diagram)
Oval tool (hold down shift key) to draw circle Curve tool to draw wavy line Straight line tool and Text tool These tools produce cleaner shapes than drawing freeform
Start or end of process (Flowchart)
Rounded rectangle tool This provides a template for creating this symbol
Decision (yes or no) (Flowchart)
Polygon tool This creates more accurate joins between sides than the Straight line tool
Instructions or actions (Flowchart)
Rectangle tool It provides a template for drawing this shape
Foundation Computing
Basic Schematic Diagrams 5957docx Page 31
Symbol Tools and justification
Document produced (Flowchart)
Line tool and Curve tool ndash need two tools in MSPaint other applications may have a template for this shape
Data entered or received (Flowchart)
Polygon tool ndash better than Straight line tool because can produce more regular shape
Foundation Computing
Basic Schematic Diagrams 5957docx Page 32
TOPIC 3 Getting started with MS Paint Sourced from httpwindowsmicrosoftcomen-NZwindows7Getting-started-with-Paint MS Paint is a feature in Windows that you can use to draw colour and edit pictures You can use Paint like a digital sketchpad to make simple pictures creative projects or to add text and designs to other pictures such as those taken with your digital camera The parts of Paint Open Paint by clicking the Start button clicking All Programs clicking Accessories and then clicking Paint When you start Paint youll see an empty window drawing and painting tools are located in the ribbon at the top of the window The following illustration shows the different parts of the Paint window
The Paint window
Foundation Computing
Basic Schematic Diagrams 5957docx Page 33
Working with tools The ribbon in Paint includes a handy collection of drawing tools You can use these tools to create freehand drawings and add a variety of shapes to your pictures This section describes some common tasks For more detailed information on how to use the different tools in Paint see Using Paint Draw a line Some tools and shapes such as the Pencil Brush Line and Curve let you make a variety of straight curved and squiggly lines What you draw is determined by how you move the mouse as you draw You can use the Line to draw a straight line for example
1) On the Home tab in the Shapes group click the Line 2) In the Colors group click Color 1 and then click the color you want to use 3) To draw drag the pointer across the drawing area
Draw a squiggly line Your drawings dont have to be composed of only straight lines The Pencil and Brushes can be used to make completely random free-form shapes
1) On the Home tab in the Tools group click the Pencil tool 2) In the Colors group click Color 1 and then click the color you want to use 3) To draw drag the pointer across the drawing area and make a squiggly line
Note If you want to make a line that has a different appearance use one of the Brushes instead Draw a shape Paint lets you draw many different shapes For example you can draw ready-made defined shapes such as rectangles circles squares triangles and arrows (to name a
few) You can also make your own custom shape by using the Polygon shape to draw a polygon which is a shape that can have any number of sides
1) On the Home tab in the Shapes group click a ready-made shape such as the
Rectangle 2) To add a ready-made shape drag the pointer across the drawing area to make
the shape 3) To change the outline style in the Shapes group click Outline and then click an
outline style 4) If you dont want your shape to have an outline click No outline 5) In the Colors group click Color 1 and then click a color for the outline 6) In the Colors group click Color 2 and then click a color to use to fill the shape 7) To change the fill style in the Shapes group click Fill and then click a fill style 8) If you dont want your shape to be filled click No fill
Foundation Computing
Basic Schematic Diagrams 5957docx Page 34
Add text You can also add text to your picture The Text tool lets you add a simple message or title
1) On the Home tab in the Tools group click the Text tool 2) Drag the pointer in the drawing area where you want to add text 3) Under Text Tools on the Text tab click the font face size and style in the Font
group The Font group
4) In the Colors group click Color 1 and then click a color This is the text color 5) Type the text that you want to add
Erase part of your picture If you make a mistake or need to change part of a picture use the eraser By default the eraser changes any area you erase to white but you can change the eraser color For example if you set the background color to yellow anything you erase turns to yellow
1) On the Home tab in the Tools group click the Eraser tool 2) In the Colors group click Color 2 and then click the color that you want to erase
with If you want to erase with white you dont have to select a color 3) Drag the pointer over the area you want to erase
Saving a picture Save your picture frequently so you dont accidentally lose your work To save click the
Paint button and then click Save This saves all of the changes made to the picture since the last time you saved The very first time that you save a new picture you will need to give your picture a file name Follow these steps
1) Click the Paint button and then click Save 2) In the Save as type box select the file format you want 3) In the File name box type a name and then click Save
Foundation Computing
Basic Schematic Diagrams 5957docx Page 35
Topic 4 Designing your diagram Although there are many different types of schematic diagrams the basic process and principles involved in designing a clear and coherent diagram are similar The principles apply to designing an electrical circuit diagram an organisation chart a mind map a flow chart and many other diagrams Some of these principles are also worth applying to other disciplines such as designing a Web page Letrsquos work step-by-step through the process of creating a flow chart to help people make money selling things on an on-line auction site such as wwwtrademeconz or wwwebaycom
Step 1 Gather your information Start by brainstorming all the information you need to include in your diagram Write down everything you think might be important or should be included
trademe
choose things that
sell
good photograph
feedback
keep track
prompt answers
postage
auction length
similar listings
postal system
setting reserve
describing item
correct category
re-listing
fixed offers
Look at the information you have gathered and think about your target audience Highlight the information that is most important to your target audience Cross out any irrelevant information Put question marks next to information that you are unsure about or may be able to leave out
Foundation Computing
Basic Schematic Diagrams 5957docx Page 36
Step 2 Organise your information Take the information that you have left and sort through it How you organise your information will depend on the type of diagram you are designing For example an organisationrsquos chart usually has different levels and shows who its members report to so you might group people by department and by level A flow chart like the example wersquore creating usually shows a process Information is grouped in the order we would use it If any other steps or information occurs to you as you are organising your information add them in Herersquos an example of how the key steps involved in selling on trademe could be ordered
Choose items that sell
Look at similar listings
Decide on a reserve price
Take a clear photograph
Identify your target audience
Write a clear description
Upload your item
Choose the correct category
Monitor watchers bids and views
Lower your reserve
Fixed price offers
Relist
Step 3 Make connections Once the elements are grouped or arranged in a logical order a clearer picture of the process or system you are representing in your diagram should start to emerge However unlike a list which usually reads from top to bottom only a diagram can show connections in many different directions and working out the links between elements is an essential part of designing a coherent diagram At this stage of the design process it is helpful to sketch out a basic plan of the elements you want to include and the flow-lines or connections between them In order to work out the connections between the elements ask questions such as What happens ifhellip What do I do beforeafter this What decisions need to be made now What actions need to be taken Use arrows to show connections between elements group elements that are part of the same stage or level of the process next to or near to each other and use shapes to show which elements are similar to each other eg diamonds for decisions rectangles for instructions or actions Make up your own meanings for shapes if necessary but be sure to use them consistently
Foundation Computing
Basic Schematic Diagrams 5957docx Page 37
The flow chart below shows how our list of elements above changes and gets re-ordered as we ask these questions and organise the information into a logical and coherent diagram
Decide on your
reserve price
START
Relist
Take a photo that is
clear and item looks
good
Decide on your
ideal buyer
Write a description
of your item
highlighting its
benefits for your
buyer
Upload your item in
a category your
buyer is likely to be
looking in
Monitor how many
views watchers and
bids your item gets
Lower your reserve
Item meets reserve
and sellsItem doesnrsquot sell
Offer to watchers for
your reserve
Decide what you
want to sell
Check what similar
items are currently
selling for
Lots of views but
no watchers
No interestFINISH
Foundation Computing
Basic Schematic Diagrams 5957docx Page 38
Step 4 Test your diagram The final step in designing your diagram is checking that it is as effective as possible To do this you should work through each stage step by step challenging it as you go Picture the process in your mind as you follow the links checking that you have included all the actions and decisions required that they are in the correct order and that no steps are duplicated Once yoursquore confident that the diagram is correct look at it again critically to see if you can improve it or clarify it Is there anywhere you can simplify it by removing unnecessary steps Is there anywhere that seems vague and would be easier to understand if you added a step or a connector Now imagine that you are a member of your target audience For a moment try to forget everything you know about the system or process you have designed a diagram for except for what your target audience knows Look at the diagram with fresh eyes does it make sense to you now Does anything seem odd confusing or out of place Finally look at the layout of your diagram Is it easy to read and follow Have you used shapes texts and arrows consistently Are your shapes and texts uniform and lined up properly Are your connectors clearly defined or are they criss-crossing all over each other Check the spelling of labels carefully ndash go through letter by letter to make sure all names and technical or unfamiliar terms are correct
Discussion With a partner look critically at our example diagram above Discuss any parts of it that you think could be better and any changes you would make to improve the readability of the flow chart Make note on the flow chart above of any areas that you think could be improved Share your answers with the rest of the class
Foundation Computing
Basic Schematic Diagrams 5957docx Page 39
Self Test 1) Mr Biggles owns Biggles Air Supplies a company that makes aircraft supplies He asks you to create an organisation chart for his company He gives you the following list of all his employees and who they report to
Mr James Biggles Chief Executive Officer
Jane Doep Personal Assistant to CEO
Mrs Monica Stepworth Financial Manager (reports to CEO)
Judith Zantes Accountant (reports to Financial Manager)
Mary Smallville Accountant (reports to Financial Manager)
Janey Poretuna Admin Assistant (reports to Judith Zantes)
Mickey Laluevu IT technician (reports to Financial Manager)
Mr Hank Johnson Operations Manager (reports to CEO)
Frank Hapil Engineering Manager (reports to Operations Manager)
Joe Smither Engineering Supervisor (reports to Engineering Manager)
Howie Fartherton Engineering Technician (reports to Engineering Supervisor)
Ernie Jusef Engineering Technician (reports to Engineering Supervisor)
Rob Luxemburg Apprentice Technician (reports to Ernie Jusef)
Harry Monahan Interiors Manager (reports to Operations Manager)
Barney Jokka Interiors Technician (reports to Interiors Supervisor) Design an organisation chart for Biggles Air Supplies and draw it in the space below
2) Think of a simple process that has at least five steps and involves some form of feedback or choice For example operating a vending machine topping up your mobile phone using EFTPOS checking messages on an answering machine
Design a flow chart to represent your process
Foundation Computing
Basic Schematic Diagrams 5957docx Page 40
Self Test Answers
1) Mr Biggles owns Biggles Air Supplies a company that makes aircraft supplies He asks you to create an organisation chart for his company He gives you the following list of all his employees and who they report to
Mr James Biggles Chief Executive Officer
Jane Doep Personal Assistant to CEO
Mrs Monica Stepworth Financial Manager (reports to CEO)
Judith Zantes Accountant (reports to Financial Manager)
Mary Smallville Accountant (reports to Financial Manager)
Janey Poretuna Admin Assistant (reports to Judith Zantes)
Mickey Laluevu IT technician (reports to Financial Manager)
Mr Hank Johnson Operations Manager (reports to CEO)
Frank Hapil Engineering Manager (reports to Operations Manager)
Joe Smither Engineering Supervisor (reports to Engineering Manager)
Howie Fartherton Engineering Technician (reports to Engineering Supervisor)
Ernie Jusef Engineering Technician (reports to Engineering Supervisor)
Rob Luxemburg Apprentice Technician (reports to Ernie Jusef)
Harry Monahan Interiors Manager (reports to Operations Manager)
Barney Jokka Interiors Technician (reports to Interiors Supervisor) Design an organisation chart for Biggles Air Supplies and draw it in the space below
Mr James Biggles
CEO
Jane Doep
Personal
Assistant
Mrs Monica Stepworth
Financial Manager
Judith Zantes
Accountant
Janey Poretuna
Admin Assistant
Mary Smallville
Accountant
Mickey Laluevu
IT technician
Mr Hank Johnson
Operations Manager
Frank Hapil
Engineering
Manager
Harry Monahan
Interiors Manager
Joe Smither
Engineering
Supervisor
Howie Fartherton
Engineering
Technician
Ernie Jusef
Engineering
Technician
Rob Luxemburg
Apprentice
Technician
Barney Jokka
Interiors
Technician
Foundation Computing
Basic Schematic Diagrams 5957docx Page 41
2) Think of a simple process that has at least five steps and involves some form of feedback or choice For example operating a vending machine topping up your mobile phone using EFTPOS checking messages on an answering machine
Design a flow chart to represent your process
Dial 06345
Enter your dialing code and
phone number followed by
the key
Dial number for
service you require
Listen to saved messagesListen to new messages
Dial number for
service you require
Save message Delete message
START
FINISH
Dial 2
Dial 1
Dial 1
Dial 2
Dial 1
Dial 2
Foundation Computing
Basic Schematic Diagrams 5957docx Page 42
Foundation Computing
Basic Schematic Diagrams 5957docx Page 43
Part 2
Produce schematic diagrams from a given brief using a computer application
OBJECTIVES
On successful completion of this section you will be able to Produce schematic diagrams from a given brief using a computer application
Performance criteria
21 The symbols used in each diagram are consistent with the type of diagram and the specifications of the brief
22 The final diagram is readable clearly illustrates the object being diagrammed
and is consistent with the specifications of the brief
TOPICS
Topic 1 Symbols used are consistent with diagram type and specifications Topic 2 Diagram is clear readable and consistent with specifications
Self Test
Self Test Answers
Foundation Computing
Basic Schematic Diagrams 5957docx Page 44
TOPIC 1 Symbols used are consistent with diagram type and specifications A symbol is something such as an object picture written word sound or particular mark that represents something else by association resemblance or convention For example a red octagon may be a symbol for STOP On maps crossed sabres may indicate a battlefield Numerals are symbols for numbers All language consists of symbols The word cat is not a cat but is an arbitrary symbol representing the idea of a cat There are many symbols for many things Examples range from Peace Pipe Red Cross to Electrical symbols It is good when doing schematic drawings to use symbols that are clearly recognised and interpreted Symbols that have been internationally standardised are the best Circuit diagram symbols have differed from country to country and have changed over time They are now to a large extent internationally standardized Simple components often had symbols intended to represent some feature of the physical construction of the device There are several national and international standards for graphical symbols in circuit diagrams in particular
IEC 60617 (also known as British Standard BS 3939)
ANSI standard Y32 (also known as IEEE Std 315) IEC 60617 originally consisted of 13 parts from resistors and capacitors to logic symbols and even a generalised drawing standard of connections and bus line widths It is now published as a subscription online database IEC 60617-DB Different symbols may be used depending on the discipline using the drawing for example lighting and power symbols used as part of architectural drawings may be different from symbols for devices used in electronics Different electronic components have different characteristics it is necessary to distinguish between them in any circuit diagram Of course we could use the block diagram approach and just identify each component with words Unfortunately this takes up a lot of space and makes the overall diagram harder to recognize or understand quickly We need a way to understand electrical diagrams far more quickly and easily
Foundation Computing
Basic Schematic Diagrams 5957docx Page 45
The answer is to use schematic symbols to represent electronic components as shown in the diagram below In this diagram we show the schematic symbol of a battery as the electrical source and the symbol of a resistor as the load Even without the words and arrows the symbols define exactly what this circuit is and how it behaves
Some good procedures to follow with symbols include
Using templates for frequently used symbols
Use symbols consistently
Use a library of symbols such as from IEC 60617-DB
Foundation Computing
Basic Schematic Diagrams 5957docx Page 46
TOPIC 2 Diagram is clear readable and consistent with specifications Creating a simple diagram using MSPaint To start with letrsquos create a simple flow chart representing the stages in designing a schematic diagram There are four stages in this process
1) Gather your information 2) Organise your information 3) Make connections 4) Test your diagram
Our flow chart will consist of four rectangles arranged vertically with downward pointing arrows as connectors A rounded rectangle at the top and at the bottom of the flowchart will indicate START and FINISH respectively Step by step
Open Microsoft Paint
Click on the Rectangle tool then click and drag in the drawing area to draw a rectangle
Repeat this step to draw four boxes in the drawing area OR click on the Select tool and click and drag to select the first rectangle then right-click to copy and paste three more rectangles the same size in the drawing area
Foundation Computing
Basic Schematic Diagrams 5957docx Page 47
Using the Rounded Rectangle tool draw a rounded rectangle at the top and bottom of your flow chart
Foundation Computing
Basic Schematic Diagrams 5957docx Page 48
Use the Line tool to draw arrows between each box In the Options area under the Tool bar you can choose the thickness of line that you want to use Remember too that if you hold down the Shift key on the keyboard while you are drawing a line you can create a 45 degree angle
Use the Text tool to add text to the shapes by clicking on the Text tool clicking and dragging to create a textbox inside your shape then typing your text Check your spelling carefully letter by letter as you go
Foundation Computing
Basic Schematic Diagrams 5957docx Page 49
The basic flowchart created in Microsoft Paint could look something like this
Foundation Computing
Basic Schematic Diagrams 5957docx Page 50
Common problems with diagrams Even well-designed schematic diagrams will be difficult for the target audience to read and understand if symbols are used inconsistently or the layout of the diagram is unfamiliar For example if a flowchart has different shapes used for each element and different types of arrows used randomly it will be more difficult for readers to see the overall direction and meaning of the diagram If the shapes on an organisation chart are different sizes and randomly positioned with no clear levels or hierarchy the diagram will not provide a clear overview of the organisationrsquos structure If an electrical circuit diagram has unfamiliar symbols used for elements such as switches resistors and batteries then it will not make sense to its intended audience
Tips for improving the readability of your schematic diagrams
Use symbols and shapes consistently ie elements that are similar should have the same symbol or shape
Avoid having connectors crossing over each other
Avoid having symbols or shapes overlapping
Use arrows on connectors or flow lines to indicate direction
Use colours text size and font consistently
Diagrams that can be read top-to-bottom and left-to-right are easier to read
In a process diagram have only one connector leading into a symbol but have more coming out where necessary to indicate different directions or decisions
Diagrams for a technical audience such as electrical or computer programming schematics should follow accepted conventions for symbols and layout
Diagrams indicating a hierarchy of positions ideas or stages are clearer if elements belonging to the same level are a similar shape size and position on the page
Keep labels as clear and as brief as possible Carefully check the spelling of all names and labels letter by letter ndash errors in the spelling of names or scientific and technical terms look unprofessional and can be confusing for readers
Foundation Computing
Basic Schematic Diagrams 5957docx Page 51
Self Test Look at the schematic diagrams that follow Make notes under each example of what is wrong with the diagram what is right about the diagram and what could be changed to make it clear and meaningful to its intended audience 1) This flow chart is supposed to show police officers how to get a suspect to confess to a crime
START
Confidently accuse
suspect of crime
Describe a
scenario that
enables suspect
to admit guiltAllow suspect to
voice objections
Invade suspectrsquos
personal space
Suspect becomes
uncomfortable
Suspect
doesnrsquot
deny guilt
Suspect
denies guilt
No reaction
Elicit confession
Rephrase objections as
confessions
FINISH
Foundation Computing
Basic Schematic Diagrams 5957docx Page 52
2) The following diagram is an organisation chart for Widget Enterprises
John Smith
MANAGER
Seth Drew
IT MANAGER
May Furur
SECRETARY
Judith Holland
CUSTOMER SERVICES manager
Jad Ling
HELPDESK
Harry Petal
FINANCIAL MANAGER
Wanda Springer
MARKETING
MANAGER
Bob Smithells
CLEANER
Kelly Inlerl
MARKETING ASSISTANT
Beryl Thin
CUSTOMER SERVICES ASSISTANTValda Rigley
CUSTOMER
SERVICES
ASSISTANT
Levi Quayle
COMPUTER
TECHNICIAN
3) Which of the following computer applications can be used to create schematic diagrams
a) Microsoft Visio
b) Microsoft Paint
c) Microsoft Word
d) All of the above
4) Which frequently used shapes does the Microsoft Paint Tool bar contain templates for
5) Where in the Microsoft Paint window would you be able to select the thickness of line that you wanted for a brushstroke 6) Identify the purpose and intended audience for a diagram showing a businessrsquos marketing plan 7) Name two characteristics of well-designed schematic diagrams 8) Identify four steps involved in designing schematic diagrams 9) Why is it important to use conventionally accepted and familiar shapes and symbols in your schematic diagrams
Foundation Computing
Basic Schematic Diagrams 5957docx Page 53
Self Test Answers 1) This flow chart is supposed to show police officers how to get a suspect to confess to a crime
START
Confidently accuse
suspect of crime
Describe a
scenario that
enables suspect
to admit guiltAllow suspect to
voice objections
Invade suspectrsquos
personal space
Suspect becomes
uncomfortable
Suspect
doesnrsquot
deny guilt
Suspect
denies guilt
No reaction
Elicit confession
Rephrase objections as
confessions
FINISH
Random shapes are meaningless and confusing ndash use conventional flow chart symbols
Stages of process are not clear ndash arrange shapes top to bottom with options at each stage branching off to side at same level
Connectors that are either straight or curved would be more consistent
Labels are clear
Text uses consistent font and size
Foundation Computing
Basic Schematic Diagrams 5957docx Page 54
2) The following diagram is an organisation chart for Widget Enterprises
John Smith
MANAGER
Seth Drew
IT MANAGER
May Furur
SECRETARY
Judith Holland
CUSTOMER SERVICES manager
Jad Ling
HELPDESK
Harry Petal
FINANCIAL MANAGER
Wanda Springer
MARKETING
MANAGER
Bob Smithells
CLEANER
Kelly Inlerl
MARKETING ASSISTANT
Beryl Thin
CUSTOMER SERVICES ASSISTANTValda Rigley
CUSTOMER
SERVICES
ASSISTANT
Levi Quayle
COMPUTER
TECHNICIAN
No clear levels to hierarchy ndash organise so that diagram reads top to bottom and positions at similar level are in same horizontal space
Different sized boxes and borders on some boxes are meaningless ndash need consistent style for similar elements
Connectors cross over each other and boxes overlap ndash arrange space to avoid this
Text size and font is mostly consistent but one typo needs correcting
3) Which of the following computer applications can be used to create schematic diagrams
a) Microsoft Visio
b) Microsoft Paint
c) Microsoft Word
d) All of the above correct
4) Which frequently used shapes does the Microsoft Paint Tool bar contain templates for
Polygon rectangle ovalellipse
Foundation Computing
Basic Schematic Diagrams 5957docx Page 55
5) Where in the Microsoft Paint window would you be able to select the thickness of line that you wanted for a brushstroke
Options area below the Toolbar
6) Identify the purpose and intended audience for a diagram showing a businessrsquos marketing plan
The purpose would be to provide an overview of the businessrsquos marketing strategy Audience could include management and employees of the business especially the Marketing department potential investors shareholders and directors of the business
7) Name two characteristics of well-designed schematic diagrams Any of simple easy for the target audience to understand include all relevant elements or parts of the process clear and logical connections between elements accurate 8) Identify four steps involved in designing schematic diagrams Gather information organise information make connections between elements test your diagram 9) Why is it important to use conventionally accepted and familiar shapes and
symbols in your schematic diagrams So that the diagram will be easily understood by the target audience
Foundation Computing
Basic Schematic Diagrams 5957docx Page 56
References httpwindowsmicrosoftcomen-NZwindows7Getting-started-with-Paint accessed Sat 5th December in Timaru New Zealand httpenwikipediaorgwikiSchematic_diagrams accessed Sat 5th December in Timaru New Zealand httpenwikipediaorgwikiSymbol accessed Sat 5th December in Timaru New Zealand
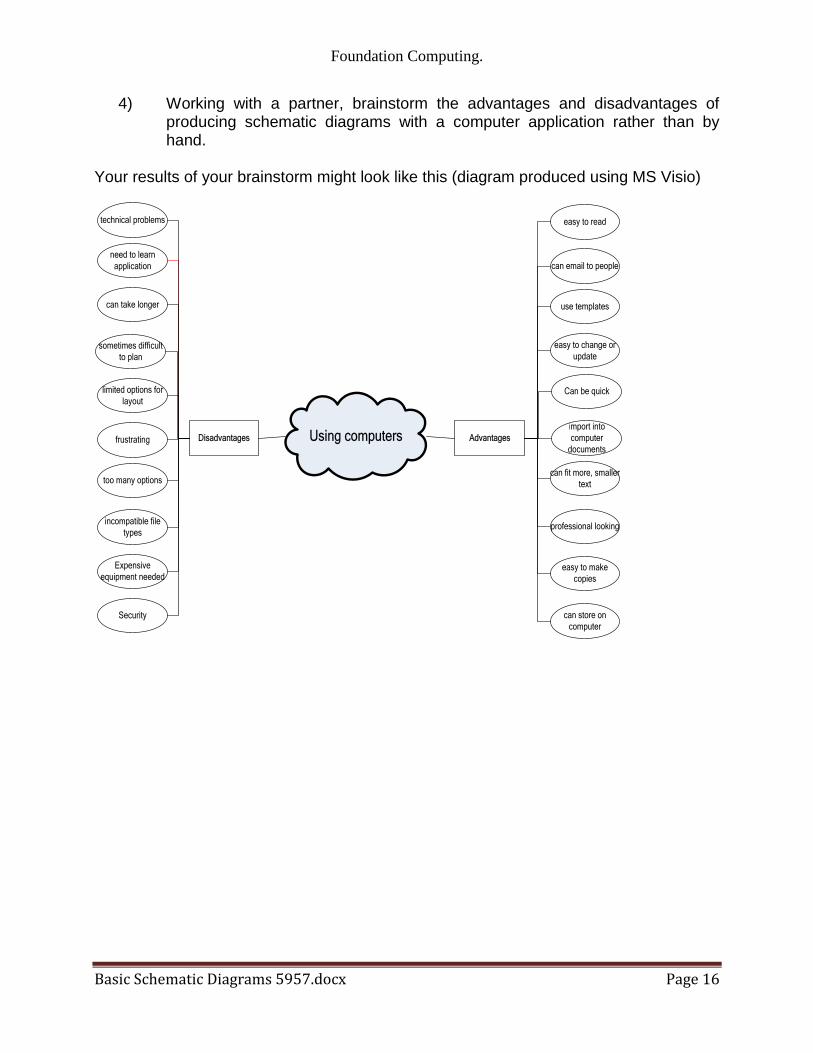
Foundation Computing
Basic Schematic Diagrams 5957docx Page 16
4) Working with a partner brainstorm the advantages and disadvantages of producing schematic diagrams with a computer application rather than by hand
Your results of your brainstorm might look like this (diagram produced using MS Visio)
Using computers AdvantagesDisadvantages
need to learn
application
can take longer
sometimes difficult
to plan
limited options for
layout
frustrating
too many options
incompatible file
types
can store on
computer
can fit more smaller
text
easy to read
can email to people
use templates
easy to change or
update
Can be quick
easy to make
copies
professional looking
import into
computer
documents
Expensive
equipment needed
technical problems
Security
Foundation Computing
Basic Schematic Diagrams 5957docx Page 17
Process for producing schematic diagrams on computer There are many different computer applications that can be used to produce schematic diagrams Some applications like Microsoft Visio are specifically designed to help you create a wide range of complex schematic diagrams easily However almost any computer application that has a drawing tool can be used to produce a schematic diagram and the process will usually involve the following steps 1) Design the diagram
a Identify your target audience b Collect all the information you need c Arrange your information in a logical order d Test your diagram
2) Create the diagram in the computer application
a Open the drawing window b Draw the shapes you want c Arrange the shapes according to your design d Add connectors between each of the shapes e Add text where required
Designing effective diagrams The main purpose of a schematic diagram is to provide a clear and easy to understand visual overview of how the different parts of a system fit together Schematic diagrams that are well-designed
are as simple as possible
are easy for the target audience to understand
include all relevant elements or parts of the process
have clear and logical connections between elements
communicate an accurate picture of the system or process
Foundation Computing
Basic Schematic Diagrams 5957docx Page 18
Identifying the target audience The target audience is the group of people who will read your schematic diagram The main question you need to ask yourself is Who is my audience In order to identify the target audience for your schematic diagram think about the following
What sort of person will read your diagram Think about that personrsquos job age education language environment and other characteristics that could affect the sort of language and symbols they will understand and relate to
What information will that person look for Why are they reading your diagram What do they want or need to know What information is most important What information is not so important
How much time will that person have to look at your diagram Will they be in a hurry or will they have time to study all the details Does your diagram have to stand alone or will it have a lot of text next to it to explain it
What do you want your audience to learn or do as a result of reading your diagram
What does the diagram need to show What information do you have to include How should this information be arranged
Foundation Computing
Basic Schematic Diagrams 5957docx Page 19
Exercise Complete the table below with information about the target audience and purpose for each of the examples of schematic diagrams given Use the questions above to help you
Example diagram Target audience
You work as an electrician and Mr Jones has asked you to design an electrical wiring plan for the dream house he wants to build
You are a computer programmer and you are using a flowchart to plan a computer program that farmers can use to keep count of their sheep
You have to write an essay about your most embarrassing childhood experience and you create a mindmap to organise your ideas
You are researching your family history and have been asked to create a family tree diagram for a booklet that will be handed out at an upcoming family reunion
Foundation Computing
Basic Schematic Diagrams 5957docx Page 20
Suggested Answer Complete the table below with information about the target audience and purpose for each of the examples of schematic diagrams given Use the questions above to help you
Example diagram Target audience
You work as an electrician and Mr Jones has asked you to design an electrical wiring plan for the dream house he wants to build
Mr Jones his builder local council officials theyrsquoll need detailed information that will be studied in depth and referred to during the planning and building process
You are a computer programmer and you are using a flowchart to plan a computer program that farmers can use to keep count of their sheep
You and other computer programmers will use the flowchart to understand the process of the programme and to identify flaws in its logic
You have to write an essay about your most embarrassing childhood experience and you create a mindmap to organise your ideas
You are the only person who will use your mindmap and you will refer to it as you write your essay
You are researching your family history and have been asked to create a family tree diagram for a booklet that will be handed out at an upcoming family reunion
Members of your family will look for their names and those of relatives in order to see how people are related to each other
Foundation Computing
Basic Schematic Diagrams 5957docx Page 21
TOPIC 2 Identifying the computer application required There are many computer applications that can be used to create schematic diagrams Microsoft Visio is specifically designed for this purpose but any application with basic drawing tools such as those found in Microsoft Word can be used One of the simplest and most widely available computer drawing applications is Microsoft Paint We will use this application is used to demonstrate the tools However most of the tools and principles we will focus on in Microsoft Paint can be found in other drawing applications The following diagram shows the Microsoft Paint window
The tools are arranged to the left of the drawing area in the Tool bar An overview of how to use the tools you need to create a simple schematic diagram is provided below Underneath the Tool bar is the Options box When you click on a tool icon in the Tool bar the options available for that tool appear in the Options box To select an option click on the tool you want to use then click on the option and then click in the drawing area and drag the mouse pointer to draw The Colour palette is underneath the drawing area To use a colour click on the tool you want to use then click on the colour and then click in the drawing area ndash the shape line or text you create will appear in the colour you have selected
Foundation Computing
Basic Schematic Diagrams 5957docx Page 22
Tools Selection Tools Use the selection tools to select the parts of your schematic diagram that you want to work with or change in some way To use these tools click on the button of the tool you want and then click on your diagram and drag until the area you want to work with is selected The Freeform Select tool (on the left) is used to select an irregularly shaped area The Rectangle Select tool is used to select a rectangular area To copy a part of your diagram eg a shape line or text it must first be selected using a selection tool Select Copy from the Edit menu click where you want the copy to be positioned and select Paste from the Edit menu Shapes tools
The shapes tools which can be used to create symbols in schematic diagrams consist of the Rectangle tool for creating squares or rectangles the Polygon tool for creating multi-sided shapes the Rounded Rectangle tool for creating rounded rectangles and the Oval tool for creating circles or ovals These tools provide templates for creating frequently used symbols To use them simply click on the icon of the shape you want to use and drag it onto your diagram where you can resize it if necessary and add text or
Foundation Computing
Basic Schematic Diagrams 5957docx Page 23
effects For the Polygon tool click and drag to draw the first side and click each time you want to change direction Double-click when you have finished To create a perfect circle hold down the Shift key while you are dragging the mouse pointer
Line tools In schematic diagrams line tools can be used to draw connectors between symbols and to draw shapes or symbols
The Straight Line tool creates straight lines simply click on the Straight Line icon click in your picture where you want the line to start and drag to where you want the line to finish The Curve tool will create a curve with at least one and no more than two bends in it click on the Curve icon then click in your picture to draw a straight line and drag to where you want the first bend to be click again where you want the second curve to be and drag to shape the curve You can make more complex shapes by joining lines and curves together
The Pencil tool can be used to draw freeform shapes or lines with as many bends and curves as you want Click on the icon click in your diagram and ldquodrawrdquo with your mouse pointer To draw straight lines hold down the shift key as you are drawing with the mouse
Foundation Computing
Basic Schematic Diagrams 5957docx Page 24
The Paint Brush tool draws freeform lines in the same way as the Pencil tool but can be used to create lines of varying widths and styles To select a paintbrush style click on the Paint Brush icon and then click in the Options box on the style you want to use
The Airbrush tool creates lines with an airbrushed effect of clustered dots It can be used in the same way as the pencil tool to draw freeform shapes or symbols In the Options box you can choose the size of the area covered by the Airbrush tool
Text tool
Add text to your schematic diagram by clicking on the Text icon and clicking in your diagram where you want the text to appear As you drag a rectangle will be formed within which text can be typed The Fonts dialogue box will also open
Foundation Computing
Basic Schematic Diagrams 5957docx Page 25
Fill Tool
The Fill tool will add colour to a shape that you have drawn Click on the icon click on a colour from the colour palette and then click on the shape in the diagram that you want to fill with colour
Zoom tool
Use the Zoom tool to magnify a section of the diagram that you are working with Click on the magnifying glass icon select the size you want in the Options box and click on the part of the image you want to enlarge As the picture zooms in the cursor will change back to the tool you were using before
Adding colour
The Colour box to the left of the Colour palette shows the foreground and background colours you are using If you click on a tool and then drag while holding down the left mouse button the line or shape will be drawn using the foreground colour If you hold down the right mouse button the background colour will be used To use any other colour click on the tool you want to use click on an option (if using) then click on the colour you want from the colour palette As you draw the colour you have clicked on will be used
Foundation Computing
Basic Schematic Diagrams 5957docx Page 26
Additional resources For more detailed information about these tools refer to the Help menu in Microsoft Paint (httpwindowshelpmicrosoftcom )
The following online tutorials may also be useful
httplkwdplorgclassesMSPaintpainthtml
httpwwwlesleyedufacultyahuntMSPttutrhtm
Exercise The example below shows a simple organisation chart produced using Microsoft Paint In the space that follows identify which tools were used to create this schematic diagram and what each tool was used for
Rectangle tool used to create Manager symbol
Oval tool used to create Team Leader symbols
Rounded Rectangle tool used for Team member symbols
Straight line tool used to create connectors
Text tool used to add text to shapes
Rectangle Select tool used to select shapes to move into
position
Foundation Computing
Basic Schematic Diagrams 5957docx Page 27
Suggested Answer The example below shows a simple organisation chart produced using Microsoft Paint In the space that follows identify which tools were used to create this schematic diagram and what each tool was used for
Rectangle tool used to create Manager symbol
Oval tool used to create Team Leader symbols
Rounded Rectangle tool used for Team member symbols
Straight line tool used to create connectors
Text tool used to add text to shapes
Rectangle Select tool used to select shapes to move into position
Foundation Computing
Basic Schematic Diagrams 5957docx Page 28
Exercise Which tools would you use to produce the following symbols or diagrams and why
Symbol Tools and justification
Resistor (Electrical circuit diagram)
Speaker (Electrical circuit diagram)
AC
AC source (Electrical circuit diagram)
Start or end of process (Flowchart)
Decision (yes or no) (Flowchart)
Instructions or actions (Flowchart)
Foundation Computing
Basic Schematic Diagrams 5957docx Page 29
Symbol Tools and justification
Document produced (Flowchart)
Data entered or received (Flowchart)
Foundation Computing
Basic Schematic Diagrams 5957docx Page 30
Suggested Answers Which tools would you use to produce the following symbols or diagrams and why
Symbol Tools and justification
Resistor (Electrical circuit diagram)
Straight line tool (hold down shift key)It creates regular 45 degree angled lines that are perfectly straight
Speaker (Electrical circuit diagram)
Polygon tool (hold down shift key) Rectangle tool and Straight line tool These are used in order to create a symbol with uniform angles and straight edges
AC
AC source (Electrical circuit diagram)
Oval tool (hold down shift key) to draw circle Curve tool to draw wavy line Straight line tool and Text tool These tools produce cleaner shapes than drawing freeform
Start or end of process (Flowchart)
Rounded rectangle tool This provides a template for creating this symbol
Decision (yes or no) (Flowchart)
Polygon tool This creates more accurate joins between sides than the Straight line tool
Instructions or actions (Flowchart)
Rectangle tool It provides a template for drawing this shape
Foundation Computing
Basic Schematic Diagrams 5957docx Page 31
Symbol Tools and justification
Document produced (Flowchart)
Line tool and Curve tool ndash need two tools in MSPaint other applications may have a template for this shape
Data entered or received (Flowchart)
Polygon tool ndash better than Straight line tool because can produce more regular shape
Foundation Computing
Basic Schematic Diagrams 5957docx Page 32
TOPIC 3 Getting started with MS Paint Sourced from httpwindowsmicrosoftcomen-NZwindows7Getting-started-with-Paint MS Paint is a feature in Windows that you can use to draw colour and edit pictures You can use Paint like a digital sketchpad to make simple pictures creative projects or to add text and designs to other pictures such as those taken with your digital camera The parts of Paint Open Paint by clicking the Start button clicking All Programs clicking Accessories and then clicking Paint When you start Paint youll see an empty window drawing and painting tools are located in the ribbon at the top of the window The following illustration shows the different parts of the Paint window
The Paint window
Foundation Computing
Basic Schematic Diagrams 5957docx Page 33
Working with tools The ribbon in Paint includes a handy collection of drawing tools You can use these tools to create freehand drawings and add a variety of shapes to your pictures This section describes some common tasks For more detailed information on how to use the different tools in Paint see Using Paint Draw a line Some tools and shapes such as the Pencil Brush Line and Curve let you make a variety of straight curved and squiggly lines What you draw is determined by how you move the mouse as you draw You can use the Line to draw a straight line for example
1) On the Home tab in the Shapes group click the Line 2) In the Colors group click Color 1 and then click the color you want to use 3) To draw drag the pointer across the drawing area
Draw a squiggly line Your drawings dont have to be composed of only straight lines The Pencil and Brushes can be used to make completely random free-form shapes
1) On the Home tab in the Tools group click the Pencil tool 2) In the Colors group click Color 1 and then click the color you want to use 3) To draw drag the pointer across the drawing area and make a squiggly line
Note If you want to make a line that has a different appearance use one of the Brushes instead Draw a shape Paint lets you draw many different shapes For example you can draw ready-made defined shapes such as rectangles circles squares triangles and arrows (to name a
few) You can also make your own custom shape by using the Polygon shape to draw a polygon which is a shape that can have any number of sides
1) On the Home tab in the Shapes group click a ready-made shape such as the
Rectangle 2) To add a ready-made shape drag the pointer across the drawing area to make
the shape 3) To change the outline style in the Shapes group click Outline and then click an
outline style 4) If you dont want your shape to have an outline click No outline 5) In the Colors group click Color 1 and then click a color for the outline 6) In the Colors group click Color 2 and then click a color to use to fill the shape 7) To change the fill style in the Shapes group click Fill and then click a fill style 8) If you dont want your shape to be filled click No fill
Foundation Computing
Basic Schematic Diagrams 5957docx Page 34
Add text You can also add text to your picture The Text tool lets you add a simple message or title
1) On the Home tab in the Tools group click the Text tool 2) Drag the pointer in the drawing area where you want to add text 3) Under Text Tools on the Text tab click the font face size and style in the Font
group The Font group
4) In the Colors group click Color 1 and then click a color This is the text color 5) Type the text that you want to add
Erase part of your picture If you make a mistake or need to change part of a picture use the eraser By default the eraser changes any area you erase to white but you can change the eraser color For example if you set the background color to yellow anything you erase turns to yellow
1) On the Home tab in the Tools group click the Eraser tool 2) In the Colors group click Color 2 and then click the color that you want to erase
with If you want to erase with white you dont have to select a color 3) Drag the pointer over the area you want to erase
Saving a picture Save your picture frequently so you dont accidentally lose your work To save click the
Paint button and then click Save This saves all of the changes made to the picture since the last time you saved The very first time that you save a new picture you will need to give your picture a file name Follow these steps
1) Click the Paint button and then click Save 2) In the Save as type box select the file format you want 3) In the File name box type a name and then click Save
Foundation Computing
Basic Schematic Diagrams 5957docx Page 35
Topic 4 Designing your diagram Although there are many different types of schematic diagrams the basic process and principles involved in designing a clear and coherent diagram are similar The principles apply to designing an electrical circuit diagram an organisation chart a mind map a flow chart and many other diagrams Some of these principles are also worth applying to other disciplines such as designing a Web page Letrsquos work step-by-step through the process of creating a flow chart to help people make money selling things on an on-line auction site such as wwwtrademeconz or wwwebaycom
Step 1 Gather your information Start by brainstorming all the information you need to include in your diagram Write down everything you think might be important or should be included
trademe
choose things that
sell
good photograph
feedback
keep track
prompt answers
postage
auction length
similar listings
postal system
setting reserve
describing item
correct category
re-listing
fixed offers
Look at the information you have gathered and think about your target audience Highlight the information that is most important to your target audience Cross out any irrelevant information Put question marks next to information that you are unsure about or may be able to leave out
Foundation Computing
Basic Schematic Diagrams 5957docx Page 36
Step 2 Organise your information Take the information that you have left and sort through it How you organise your information will depend on the type of diagram you are designing For example an organisationrsquos chart usually has different levels and shows who its members report to so you might group people by department and by level A flow chart like the example wersquore creating usually shows a process Information is grouped in the order we would use it If any other steps or information occurs to you as you are organising your information add them in Herersquos an example of how the key steps involved in selling on trademe could be ordered
Choose items that sell
Look at similar listings
Decide on a reserve price
Take a clear photograph
Identify your target audience
Write a clear description
Upload your item
Choose the correct category
Monitor watchers bids and views
Lower your reserve
Fixed price offers
Relist
Step 3 Make connections Once the elements are grouped or arranged in a logical order a clearer picture of the process or system you are representing in your diagram should start to emerge However unlike a list which usually reads from top to bottom only a diagram can show connections in many different directions and working out the links between elements is an essential part of designing a coherent diagram At this stage of the design process it is helpful to sketch out a basic plan of the elements you want to include and the flow-lines or connections between them In order to work out the connections between the elements ask questions such as What happens ifhellip What do I do beforeafter this What decisions need to be made now What actions need to be taken Use arrows to show connections between elements group elements that are part of the same stage or level of the process next to or near to each other and use shapes to show which elements are similar to each other eg diamonds for decisions rectangles for instructions or actions Make up your own meanings for shapes if necessary but be sure to use them consistently
Foundation Computing
Basic Schematic Diagrams 5957docx Page 37
The flow chart below shows how our list of elements above changes and gets re-ordered as we ask these questions and organise the information into a logical and coherent diagram
Decide on your
reserve price
START
Relist
Take a photo that is
clear and item looks
good
Decide on your
ideal buyer
Write a description
of your item
highlighting its
benefits for your
buyer
Upload your item in
a category your
buyer is likely to be
looking in
Monitor how many
views watchers and
bids your item gets
Lower your reserve
Item meets reserve
and sellsItem doesnrsquot sell
Offer to watchers for
your reserve
Decide what you
want to sell
Check what similar
items are currently
selling for
Lots of views but
no watchers
No interestFINISH
Foundation Computing
Basic Schematic Diagrams 5957docx Page 38
Step 4 Test your diagram The final step in designing your diagram is checking that it is as effective as possible To do this you should work through each stage step by step challenging it as you go Picture the process in your mind as you follow the links checking that you have included all the actions and decisions required that they are in the correct order and that no steps are duplicated Once yoursquore confident that the diagram is correct look at it again critically to see if you can improve it or clarify it Is there anywhere you can simplify it by removing unnecessary steps Is there anywhere that seems vague and would be easier to understand if you added a step or a connector Now imagine that you are a member of your target audience For a moment try to forget everything you know about the system or process you have designed a diagram for except for what your target audience knows Look at the diagram with fresh eyes does it make sense to you now Does anything seem odd confusing or out of place Finally look at the layout of your diagram Is it easy to read and follow Have you used shapes texts and arrows consistently Are your shapes and texts uniform and lined up properly Are your connectors clearly defined or are they criss-crossing all over each other Check the spelling of labels carefully ndash go through letter by letter to make sure all names and technical or unfamiliar terms are correct
Discussion With a partner look critically at our example diagram above Discuss any parts of it that you think could be better and any changes you would make to improve the readability of the flow chart Make note on the flow chart above of any areas that you think could be improved Share your answers with the rest of the class
Foundation Computing
Basic Schematic Diagrams 5957docx Page 39
Self Test 1) Mr Biggles owns Biggles Air Supplies a company that makes aircraft supplies He asks you to create an organisation chart for his company He gives you the following list of all his employees and who they report to
Mr James Biggles Chief Executive Officer
Jane Doep Personal Assistant to CEO
Mrs Monica Stepworth Financial Manager (reports to CEO)
Judith Zantes Accountant (reports to Financial Manager)
Mary Smallville Accountant (reports to Financial Manager)
Janey Poretuna Admin Assistant (reports to Judith Zantes)
Mickey Laluevu IT technician (reports to Financial Manager)
Mr Hank Johnson Operations Manager (reports to CEO)
Frank Hapil Engineering Manager (reports to Operations Manager)
Joe Smither Engineering Supervisor (reports to Engineering Manager)
Howie Fartherton Engineering Technician (reports to Engineering Supervisor)
Ernie Jusef Engineering Technician (reports to Engineering Supervisor)
Rob Luxemburg Apprentice Technician (reports to Ernie Jusef)
Harry Monahan Interiors Manager (reports to Operations Manager)
Barney Jokka Interiors Technician (reports to Interiors Supervisor) Design an organisation chart for Biggles Air Supplies and draw it in the space below
2) Think of a simple process that has at least five steps and involves some form of feedback or choice For example operating a vending machine topping up your mobile phone using EFTPOS checking messages on an answering machine
Design a flow chart to represent your process
Foundation Computing
Basic Schematic Diagrams 5957docx Page 40
Self Test Answers
1) Mr Biggles owns Biggles Air Supplies a company that makes aircraft supplies He asks you to create an organisation chart for his company He gives you the following list of all his employees and who they report to
Mr James Biggles Chief Executive Officer
Jane Doep Personal Assistant to CEO
Mrs Monica Stepworth Financial Manager (reports to CEO)
Judith Zantes Accountant (reports to Financial Manager)
Mary Smallville Accountant (reports to Financial Manager)
Janey Poretuna Admin Assistant (reports to Judith Zantes)
Mickey Laluevu IT technician (reports to Financial Manager)
Mr Hank Johnson Operations Manager (reports to CEO)
Frank Hapil Engineering Manager (reports to Operations Manager)
Joe Smither Engineering Supervisor (reports to Engineering Manager)
Howie Fartherton Engineering Technician (reports to Engineering Supervisor)
Ernie Jusef Engineering Technician (reports to Engineering Supervisor)
Rob Luxemburg Apprentice Technician (reports to Ernie Jusef)
Harry Monahan Interiors Manager (reports to Operations Manager)
Barney Jokka Interiors Technician (reports to Interiors Supervisor) Design an organisation chart for Biggles Air Supplies and draw it in the space below
Mr James Biggles
CEO
Jane Doep
Personal
Assistant
Mrs Monica Stepworth
Financial Manager
Judith Zantes
Accountant
Janey Poretuna
Admin Assistant
Mary Smallville
Accountant
Mickey Laluevu
IT technician
Mr Hank Johnson
Operations Manager
Frank Hapil
Engineering
Manager
Harry Monahan
Interiors Manager
Joe Smither
Engineering
Supervisor
Howie Fartherton
Engineering
Technician
Ernie Jusef
Engineering
Technician
Rob Luxemburg
Apprentice
Technician
Barney Jokka
Interiors
Technician
Foundation Computing
Basic Schematic Diagrams 5957docx Page 41
2) Think of a simple process that has at least five steps and involves some form of feedback or choice For example operating a vending machine topping up your mobile phone using EFTPOS checking messages on an answering machine
Design a flow chart to represent your process
Dial 06345
Enter your dialing code and
phone number followed by
the key
Dial number for
service you require
Listen to saved messagesListen to new messages
Dial number for
service you require
Save message Delete message
START
FINISH
Dial 2
Dial 1
Dial 1
Dial 2
Dial 1
Dial 2
Foundation Computing
Basic Schematic Diagrams 5957docx Page 42
Foundation Computing
Basic Schematic Diagrams 5957docx Page 43
Part 2
Produce schematic diagrams from a given brief using a computer application
OBJECTIVES
On successful completion of this section you will be able to Produce schematic diagrams from a given brief using a computer application
Performance criteria
21 The symbols used in each diagram are consistent with the type of diagram and the specifications of the brief
22 The final diagram is readable clearly illustrates the object being diagrammed
and is consistent with the specifications of the brief
TOPICS
Topic 1 Symbols used are consistent with diagram type and specifications Topic 2 Diagram is clear readable and consistent with specifications
Self Test
Self Test Answers
Foundation Computing
Basic Schematic Diagrams 5957docx Page 44
TOPIC 1 Symbols used are consistent with diagram type and specifications A symbol is something such as an object picture written word sound or particular mark that represents something else by association resemblance or convention For example a red octagon may be a symbol for STOP On maps crossed sabres may indicate a battlefield Numerals are symbols for numbers All language consists of symbols The word cat is not a cat but is an arbitrary symbol representing the idea of a cat There are many symbols for many things Examples range from Peace Pipe Red Cross to Electrical symbols It is good when doing schematic drawings to use symbols that are clearly recognised and interpreted Symbols that have been internationally standardised are the best Circuit diagram symbols have differed from country to country and have changed over time They are now to a large extent internationally standardized Simple components often had symbols intended to represent some feature of the physical construction of the device There are several national and international standards for graphical symbols in circuit diagrams in particular
IEC 60617 (also known as British Standard BS 3939)
ANSI standard Y32 (also known as IEEE Std 315) IEC 60617 originally consisted of 13 parts from resistors and capacitors to logic symbols and even a generalised drawing standard of connections and bus line widths It is now published as a subscription online database IEC 60617-DB Different symbols may be used depending on the discipline using the drawing for example lighting and power symbols used as part of architectural drawings may be different from symbols for devices used in electronics Different electronic components have different characteristics it is necessary to distinguish between them in any circuit diagram Of course we could use the block diagram approach and just identify each component with words Unfortunately this takes up a lot of space and makes the overall diagram harder to recognize or understand quickly We need a way to understand electrical diagrams far more quickly and easily
Foundation Computing
Basic Schematic Diagrams 5957docx Page 45
The answer is to use schematic symbols to represent electronic components as shown in the diagram below In this diagram we show the schematic symbol of a battery as the electrical source and the symbol of a resistor as the load Even without the words and arrows the symbols define exactly what this circuit is and how it behaves
Some good procedures to follow with symbols include
Using templates for frequently used symbols
Use symbols consistently
Use a library of symbols such as from IEC 60617-DB
Foundation Computing
Basic Schematic Diagrams 5957docx Page 46
TOPIC 2 Diagram is clear readable and consistent with specifications Creating a simple diagram using MSPaint To start with letrsquos create a simple flow chart representing the stages in designing a schematic diagram There are four stages in this process
1) Gather your information 2) Organise your information 3) Make connections 4) Test your diagram
Our flow chart will consist of four rectangles arranged vertically with downward pointing arrows as connectors A rounded rectangle at the top and at the bottom of the flowchart will indicate START and FINISH respectively Step by step
Open Microsoft Paint
Click on the Rectangle tool then click and drag in the drawing area to draw a rectangle
Repeat this step to draw four boxes in the drawing area OR click on the Select tool and click and drag to select the first rectangle then right-click to copy and paste three more rectangles the same size in the drawing area
Foundation Computing
Basic Schematic Diagrams 5957docx Page 47
Using the Rounded Rectangle tool draw a rounded rectangle at the top and bottom of your flow chart
Foundation Computing
Basic Schematic Diagrams 5957docx Page 48
Use the Line tool to draw arrows between each box In the Options area under the Tool bar you can choose the thickness of line that you want to use Remember too that if you hold down the Shift key on the keyboard while you are drawing a line you can create a 45 degree angle
Use the Text tool to add text to the shapes by clicking on the Text tool clicking and dragging to create a textbox inside your shape then typing your text Check your spelling carefully letter by letter as you go
Foundation Computing
Basic Schematic Diagrams 5957docx Page 49
The basic flowchart created in Microsoft Paint could look something like this
Foundation Computing
Basic Schematic Diagrams 5957docx Page 50
Common problems with diagrams Even well-designed schematic diagrams will be difficult for the target audience to read and understand if symbols are used inconsistently or the layout of the diagram is unfamiliar For example if a flowchart has different shapes used for each element and different types of arrows used randomly it will be more difficult for readers to see the overall direction and meaning of the diagram If the shapes on an organisation chart are different sizes and randomly positioned with no clear levels or hierarchy the diagram will not provide a clear overview of the organisationrsquos structure If an electrical circuit diagram has unfamiliar symbols used for elements such as switches resistors and batteries then it will not make sense to its intended audience
Tips for improving the readability of your schematic diagrams
Use symbols and shapes consistently ie elements that are similar should have the same symbol or shape
Avoid having connectors crossing over each other
Avoid having symbols or shapes overlapping
Use arrows on connectors or flow lines to indicate direction
Use colours text size and font consistently
Diagrams that can be read top-to-bottom and left-to-right are easier to read
In a process diagram have only one connector leading into a symbol but have more coming out where necessary to indicate different directions or decisions
Diagrams for a technical audience such as electrical or computer programming schematics should follow accepted conventions for symbols and layout
Diagrams indicating a hierarchy of positions ideas or stages are clearer if elements belonging to the same level are a similar shape size and position on the page
Keep labels as clear and as brief as possible Carefully check the spelling of all names and labels letter by letter ndash errors in the spelling of names or scientific and technical terms look unprofessional and can be confusing for readers
Foundation Computing
Basic Schematic Diagrams 5957docx Page 51
Self Test Look at the schematic diagrams that follow Make notes under each example of what is wrong with the diagram what is right about the diagram and what could be changed to make it clear and meaningful to its intended audience 1) This flow chart is supposed to show police officers how to get a suspect to confess to a crime
START
Confidently accuse
suspect of crime
Describe a
scenario that
enables suspect
to admit guiltAllow suspect to
voice objections
Invade suspectrsquos
personal space
Suspect becomes
uncomfortable
Suspect
doesnrsquot
deny guilt
Suspect
denies guilt
No reaction
Elicit confession
Rephrase objections as
confessions
FINISH
Foundation Computing
Basic Schematic Diagrams 5957docx Page 52
2) The following diagram is an organisation chart for Widget Enterprises
John Smith
MANAGER
Seth Drew
IT MANAGER
May Furur
SECRETARY
Judith Holland
CUSTOMER SERVICES manager
Jad Ling
HELPDESK
Harry Petal
FINANCIAL MANAGER
Wanda Springer
MARKETING
MANAGER
Bob Smithells
CLEANER
Kelly Inlerl
MARKETING ASSISTANT
Beryl Thin
CUSTOMER SERVICES ASSISTANTValda Rigley
CUSTOMER
SERVICES
ASSISTANT
Levi Quayle
COMPUTER
TECHNICIAN
3) Which of the following computer applications can be used to create schematic diagrams
a) Microsoft Visio
b) Microsoft Paint
c) Microsoft Word
d) All of the above
4) Which frequently used shapes does the Microsoft Paint Tool bar contain templates for
5) Where in the Microsoft Paint window would you be able to select the thickness of line that you wanted for a brushstroke 6) Identify the purpose and intended audience for a diagram showing a businessrsquos marketing plan 7) Name two characteristics of well-designed schematic diagrams 8) Identify four steps involved in designing schematic diagrams 9) Why is it important to use conventionally accepted and familiar shapes and symbols in your schematic diagrams
Foundation Computing
Basic Schematic Diagrams 5957docx Page 53
Self Test Answers 1) This flow chart is supposed to show police officers how to get a suspect to confess to a crime
START
Confidently accuse
suspect of crime
Describe a
scenario that
enables suspect
to admit guiltAllow suspect to
voice objections
Invade suspectrsquos
personal space
Suspect becomes
uncomfortable
Suspect
doesnrsquot
deny guilt
Suspect
denies guilt
No reaction
Elicit confession
Rephrase objections as
confessions
FINISH
Random shapes are meaningless and confusing ndash use conventional flow chart symbols
Stages of process are not clear ndash arrange shapes top to bottom with options at each stage branching off to side at same level
Connectors that are either straight or curved would be more consistent
Labels are clear
Text uses consistent font and size
Foundation Computing
Basic Schematic Diagrams 5957docx Page 54
2) The following diagram is an organisation chart for Widget Enterprises
John Smith
MANAGER
Seth Drew
IT MANAGER
May Furur
SECRETARY
Judith Holland
CUSTOMER SERVICES manager
Jad Ling
HELPDESK
Harry Petal
FINANCIAL MANAGER
Wanda Springer
MARKETING
MANAGER
Bob Smithells
CLEANER
Kelly Inlerl
MARKETING ASSISTANT
Beryl Thin
CUSTOMER SERVICES ASSISTANTValda Rigley
CUSTOMER
SERVICES
ASSISTANT
Levi Quayle
COMPUTER
TECHNICIAN
No clear levels to hierarchy ndash organise so that diagram reads top to bottom and positions at similar level are in same horizontal space
Different sized boxes and borders on some boxes are meaningless ndash need consistent style for similar elements
Connectors cross over each other and boxes overlap ndash arrange space to avoid this
Text size and font is mostly consistent but one typo needs correcting
3) Which of the following computer applications can be used to create schematic diagrams
a) Microsoft Visio
b) Microsoft Paint
c) Microsoft Word
d) All of the above correct
4) Which frequently used shapes does the Microsoft Paint Tool bar contain templates for
Polygon rectangle ovalellipse
Foundation Computing
Basic Schematic Diagrams 5957docx Page 55
5) Where in the Microsoft Paint window would you be able to select the thickness of line that you wanted for a brushstroke
Options area below the Toolbar
6) Identify the purpose and intended audience for a diagram showing a businessrsquos marketing plan
The purpose would be to provide an overview of the businessrsquos marketing strategy Audience could include management and employees of the business especially the Marketing department potential investors shareholders and directors of the business
7) Name two characteristics of well-designed schematic diagrams Any of simple easy for the target audience to understand include all relevant elements or parts of the process clear and logical connections between elements accurate 8) Identify four steps involved in designing schematic diagrams Gather information organise information make connections between elements test your diagram 9) Why is it important to use conventionally accepted and familiar shapes and
symbols in your schematic diagrams So that the diagram will be easily understood by the target audience
Foundation Computing
Basic Schematic Diagrams 5957docx Page 56
References httpwindowsmicrosoftcomen-NZwindows7Getting-started-with-Paint accessed Sat 5th December in Timaru New Zealand httpenwikipediaorgwikiSchematic_diagrams accessed Sat 5th December in Timaru New Zealand httpenwikipediaorgwikiSymbol accessed Sat 5th December in Timaru New Zealand
Foundation Computing
Basic Schematic Diagrams 5957docx Page 17
Process for producing schematic diagrams on computer There are many different computer applications that can be used to produce schematic diagrams Some applications like Microsoft Visio are specifically designed to help you create a wide range of complex schematic diagrams easily However almost any computer application that has a drawing tool can be used to produce a schematic diagram and the process will usually involve the following steps 1) Design the diagram
a Identify your target audience b Collect all the information you need c Arrange your information in a logical order d Test your diagram
2) Create the diagram in the computer application
a Open the drawing window b Draw the shapes you want c Arrange the shapes according to your design d Add connectors between each of the shapes e Add text where required
Designing effective diagrams The main purpose of a schematic diagram is to provide a clear and easy to understand visual overview of how the different parts of a system fit together Schematic diagrams that are well-designed
are as simple as possible
are easy for the target audience to understand
include all relevant elements or parts of the process
have clear and logical connections between elements
communicate an accurate picture of the system or process
Foundation Computing
Basic Schematic Diagrams 5957docx Page 18
Identifying the target audience The target audience is the group of people who will read your schematic diagram The main question you need to ask yourself is Who is my audience In order to identify the target audience for your schematic diagram think about the following
What sort of person will read your diagram Think about that personrsquos job age education language environment and other characteristics that could affect the sort of language and symbols they will understand and relate to
What information will that person look for Why are they reading your diagram What do they want or need to know What information is most important What information is not so important
How much time will that person have to look at your diagram Will they be in a hurry or will they have time to study all the details Does your diagram have to stand alone or will it have a lot of text next to it to explain it
What do you want your audience to learn or do as a result of reading your diagram
What does the diagram need to show What information do you have to include How should this information be arranged
Foundation Computing
Basic Schematic Diagrams 5957docx Page 19
Exercise Complete the table below with information about the target audience and purpose for each of the examples of schematic diagrams given Use the questions above to help you
Example diagram Target audience
You work as an electrician and Mr Jones has asked you to design an electrical wiring plan for the dream house he wants to build
You are a computer programmer and you are using a flowchart to plan a computer program that farmers can use to keep count of their sheep
You have to write an essay about your most embarrassing childhood experience and you create a mindmap to organise your ideas
You are researching your family history and have been asked to create a family tree diagram for a booklet that will be handed out at an upcoming family reunion
Foundation Computing
Basic Schematic Diagrams 5957docx Page 20
Suggested Answer Complete the table below with information about the target audience and purpose for each of the examples of schematic diagrams given Use the questions above to help you
Example diagram Target audience
You work as an electrician and Mr Jones has asked you to design an electrical wiring plan for the dream house he wants to build
Mr Jones his builder local council officials theyrsquoll need detailed information that will be studied in depth and referred to during the planning and building process
You are a computer programmer and you are using a flowchart to plan a computer program that farmers can use to keep count of their sheep
You and other computer programmers will use the flowchart to understand the process of the programme and to identify flaws in its logic
You have to write an essay about your most embarrassing childhood experience and you create a mindmap to organise your ideas
You are the only person who will use your mindmap and you will refer to it as you write your essay
You are researching your family history and have been asked to create a family tree diagram for a booklet that will be handed out at an upcoming family reunion
Members of your family will look for their names and those of relatives in order to see how people are related to each other
Foundation Computing
Basic Schematic Diagrams 5957docx Page 21
TOPIC 2 Identifying the computer application required There are many computer applications that can be used to create schematic diagrams Microsoft Visio is specifically designed for this purpose but any application with basic drawing tools such as those found in Microsoft Word can be used One of the simplest and most widely available computer drawing applications is Microsoft Paint We will use this application is used to demonstrate the tools However most of the tools and principles we will focus on in Microsoft Paint can be found in other drawing applications The following diagram shows the Microsoft Paint window
The tools are arranged to the left of the drawing area in the Tool bar An overview of how to use the tools you need to create a simple schematic diagram is provided below Underneath the Tool bar is the Options box When you click on a tool icon in the Tool bar the options available for that tool appear in the Options box To select an option click on the tool you want to use then click on the option and then click in the drawing area and drag the mouse pointer to draw The Colour palette is underneath the drawing area To use a colour click on the tool you want to use then click on the colour and then click in the drawing area ndash the shape line or text you create will appear in the colour you have selected
Foundation Computing
Basic Schematic Diagrams 5957docx Page 22
Tools Selection Tools Use the selection tools to select the parts of your schematic diagram that you want to work with or change in some way To use these tools click on the button of the tool you want and then click on your diagram and drag until the area you want to work with is selected The Freeform Select tool (on the left) is used to select an irregularly shaped area The Rectangle Select tool is used to select a rectangular area To copy a part of your diagram eg a shape line or text it must first be selected using a selection tool Select Copy from the Edit menu click where you want the copy to be positioned and select Paste from the Edit menu Shapes tools
The shapes tools which can be used to create symbols in schematic diagrams consist of the Rectangle tool for creating squares or rectangles the Polygon tool for creating multi-sided shapes the Rounded Rectangle tool for creating rounded rectangles and the Oval tool for creating circles or ovals These tools provide templates for creating frequently used symbols To use them simply click on the icon of the shape you want to use and drag it onto your diagram where you can resize it if necessary and add text or
Foundation Computing
Basic Schematic Diagrams 5957docx Page 23
effects For the Polygon tool click and drag to draw the first side and click each time you want to change direction Double-click when you have finished To create a perfect circle hold down the Shift key while you are dragging the mouse pointer
Line tools In schematic diagrams line tools can be used to draw connectors between symbols and to draw shapes or symbols
The Straight Line tool creates straight lines simply click on the Straight Line icon click in your picture where you want the line to start and drag to where you want the line to finish The Curve tool will create a curve with at least one and no more than two bends in it click on the Curve icon then click in your picture to draw a straight line and drag to where you want the first bend to be click again where you want the second curve to be and drag to shape the curve You can make more complex shapes by joining lines and curves together
The Pencil tool can be used to draw freeform shapes or lines with as many bends and curves as you want Click on the icon click in your diagram and ldquodrawrdquo with your mouse pointer To draw straight lines hold down the shift key as you are drawing with the mouse
Foundation Computing
Basic Schematic Diagrams 5957docx Page 24
The Paint Brush tool draws freeform lines in the same way as the Pencil tool but can be used to create lines of varying widths and styles To select a paintbrush style click on the Paint Brush icon and then click in the Options box on the style you want to use
The Airbrush tool creates lines with an airbrushed effect of clustered dots It can be used in the same way as the pencil tool to draw freeform shapes or symbols In the Options box you can choose the size of the area covered by the Airbrush tool
Text tool
Add text to your schematic diagram by clicking on the Text icon and clicking in your diagram where you want the text to appear As you drag a rectangle will be formed within which text can be typed The Fonts dialogue box will also open
Foundation Computing
Basic Schematic Diagrams 5957docx Page 25
Fill Tool
The Fill tool will add colour to a shape that you have drawn Click on the icon click on a colour from the colour palette and then click on the shape in the diagram that you want to fill with colour
Zoom tool
Use the Zoom tool to magnify a section of the diagram that you are working with Click on the magnifying glass icon select the size you want in the Options box and click on the part of the image you want to enlarge As the picture zooms in the cursor will change back to the tool you were using before
Adding colour
The Colour box to the left of the Colour palette shows the foreground and background colours you are using If you click on a tool and then drag while holding down the left mouse button the line or shape will be drawn using the foreground colour If you hold down the right mouse button the background colour will be used To use any other colour click on the tool you want to use click on an option (if using) then click on the colour you want from the colour palette As you draw the colour you have clicked on will be used
Foundation Computing
Basic Schematic Diagrams 5957docx Page 26
Additional resources For more detailed information about these tools refer to the Help menu in Microsoft Paint (httpwindowshelpmicrosoftcom )
The following online tutorials may also be useful
httplkwdplorgclassesMSPaintpainthtml
httpwwwlesleyedufacultyahuntMSPttutrhtm
Exercise The example below shows a simple organisation chart produced using Microsoft Paint In the space that follows identify which tools were used to create this schematic diagram and what each tool was used for
Rectangle tool used to create Manager symbol
Oval tool used to create Team Leader symbols
Rounded Rectangle tool used for Team member symbols
Straight line tool used to create connectors
Text tool used to add text to shapes
Rectangle Select tool used to select shapes to move into
position
Foundation Computing
Basic Schematic Diagrams 5957docx Page 27
Suggested Answer The example below shows a simple organisation chart produced using Microsoft Paint In the space that follows identify which tools were used to create this schematic diagram and what each tool was used for
Rectangle tool used to create Manager symbol
Oval tool used to create Team Leader symbols
Rounded Rectangle tool used for Team member symbols
Straight line tool used to create connectors
Text tool used to add text to shapes
Rectangle Select tool used to select shapes to move into position
Foundation Computing
Basic Schematic Diagrams 5957docx Page 28
Exercise Which tools would you use to produce the following symbols or diagrams and why
Symbol Tools and justification
Resistor (Electrical circuit diagram)
Speaker (Electrical circuit diagram)
AC
AC source (Electrical circuit diagram)
Start or end of process (Flowchart)
Decision (yes or no) (Flowchart)
Instructions or actions (Flowchart)
Foundation Computing
Basic Schematic Diagrams 5957docx Page 29
Symbol Tools and justification
Document produced (Flowchart)
Data entered or received (Flowchart)
Foundation Computing
Basic Schematic Diagrams 5957docx Page 30
Suggested Answers Which tools would you use to produce the following symbols or diagrams and why
Symbol Tools and justification
Resistor (Electrical circuit diagram)
Straight line tool (hold down shift key)It creates regular 45 degree angled lines that are perfectly straight
Speaker (Electrical circuit diagram)
Polygon tool (hold down shift key) Rectangle tool and Straight line tool These are used in order to create a symbol with uniform angles and straight edges
AC
AC source (Electrical circuit diagram)
Oval tool (hold down shift key) to draw circle Curve tool to draw wavy line Straight line tool and Text tool These tools produce cleaner shapes than drawing freeform
Start or end of process (Flowchart)
Rounded rectangle tool This provides a template for creating this symbol
Decision (yes or no) (Flowchart)
Polygon tool This creates more accurate joins between sides than the Straight line tool
Instructions or actions (Flowchart)
Rectangle tool It provides a template for drawing this shape
Foundation Computing
Basic Schematic Diagrams 5957docx Page 31
Symbol Tools and justification
Document produced (Flowchart)
Line tool and Curve tool ndash need two tools in MSPaint other applications may have a template for this shape
Data entered or received (Flowchart)
Polygon tool ndash better than Straight line tool because can produce more regular shape
Foundation Computing
Basic Schematic Diagrams 5957docx Page 32
TOPIC 3 Getting started with MS Paint Sourced from httpwindowsmicrosoftcomen-NZwindows7Getting-started-with-Paint MS Paint is a feature in Windows that you can use to draw colour and edit pictures You can use Paint like a digital sketchpad to make simple pictures creative projects or to add text and designs to other pictures such as those taken with your digital camera The parts of Paint Open Paint by clicking the Start button clicking All Programs clicking Accessories and then clicking Paint When you start Paint youll see an empty window drawing and painting tools are located in the ribbon at the top of the window The following illustration shows the different parts of the Paint window
The Paint window
Foundation Computing
Basic Schematic Diagrams 5957docx Page 33
Working with tools The ribbon in Paint includes a handy collection of drawing tools You can use these tools to create freehand drawings and add a variety of shapes to your pictures This section describes some common tasks For more detailed information on how to use the different tools in Paint see Using Paint Draw a line Some tools and shapes such as the Pencil Brush Line and Curve let you make a variety of straight curved and squiggly lines What you draw is determined by how you move the mouse as you draw You can use the Line to draw a straight line for example
1) On the Home tab in the Shapes group click the Line 2) In the Colors group click Color 1 and then click the color you want to use 3) To draw drag the pointer across the drawing area
Draw a squiggly line Your drawings dont have to be composed of only straight lines The Pencil and Brushes can be used to make completely random free-form shapes
1) On the Home tab in the Tools group click the Pencil tool 2) In the Colors group click Color 1 and then click the color you want to use 3) To draw drag the pointer across the drawing area and make a squiggly line
Note If you want to make a line that has a different appearance use one of the Brushes instead Draw a shape Paint lets you draw many different shapes For example you can draw ready-made defined shapes such as rectangles circles squares triangles and arrows (to name a
few) You can also make your own custom shape by using the Polygon shape to draw a polygon which is a shape that can have any number of sides
1) On the Home tab in the Shapes group click a ready-made shape such as the
Rectangle 2) To add a ready-made shape drag the pointer across the drawing area to make
the shape 3) To change the outline style in the Shapes group click Outline and then click an
outline style 4) If you dont want your shape to have an outline click No outline 5) In the Colors group click Color 1 and then click a color for the outline 6) In the Colors group click Color 2 and then click a color to use to fill the shape 7) To change the fill style in the Shapes group click Fill and then click a fill style 8) If you dont want your shape to be filled click No fill
Foundation Computing
Basic Schematic Diagrams 5957docx Page 34
Add text You can also add text to your picture The Text tool lets you add a simple message or title
1) On the Home tab in the Tools group click the Text tool 2) Drag the pointer in the drawing area where you want to add text 3) Under Text Tools on the Text tab click the font face size and style in the Font
group The Font group
4) In the Colors group click Color 1 and then click a color This is the text color 5) Type the text that you want to add
Erase part of your picture If you make a mistake or need to change part of a picture use the eraser By default the eraser changes any area you erase to white but you can change the eraser color For example if you set the background color to yellow anything you erase turns to yellow
1) On the Home tab in the Tools group click the Eraser tool 2) In the Colors group click Color 2 and then click the color that you want to erase
with If you want to erase with white you dont have to select a color 3) Drag the pointer over the area you want to erase
Saving a picture Save your picture frequently so you dont accidentally lose your work To save click the
Paint button and then click Save This saves all of the changes made to the picture since the last time you saved The very first time that you save a new picture you will need to give your picture a file name Follow these steps
1) Click the Paint button and then click Save 2) In the Save as type box select the file format you want 3) In the File name box type a name and then click Save
Foundation Computing
Basic Schematic Diagrams 5957docx Page 35
Topic 4 Designing your diagram Although there are many different types of schematic diagrams the basic process and principles involved in designing a clear and coherent diagram are similar The principles apply to designing an electrical circuit diagram an organisation chart a mind map a flow chart and many other diagrams Some of these principles are also worth applying to other disciplines such as designing a Web page Letrsquos work step-by-step through the process of creating a flow chart to help people make money selling things on an on-line auction site such as wwwtrademeconz or wwwebaycom
Step 1 Gather your information Start by brainstorming all the information you need to include in your diagram Write down everything you think might be important or should be included
trademe
choose things that
sell
good photograph
feedback
keep track
prompt answers
postage
auction length
similar listings
postal system
setting reserve
describing item
correct category
re-listing
fixed offers
Look at the information you have gathered and think about your target audience Highlight the information that is most important to your target audience Cross out any irrelevant information Put question marks next to information that you are unsure about or may be able to leave out
Foundation Computing
Basic Schematic Diagrams 5957docx Page 36
Step 2 Organise your information Take the information that you have left and sort through it How you organise your information will depend on the type of diagram you are designing For example an organisationrsquos chart usually has different levels and shows who its members report to so you might group people by department and by level A flow chart like the example wersquore creating usually shows a process Information is grouped in the order we would use it If any other steps or information occurs to you as you are organising your information add them in Herersquos an example of how the key steps involved in selling on trademe could be ordered
Choose items that sell
Look at similar listings
Decide on a reserve price
Take a clear photograph
Identify your target audience
Write a clear description
Upload your item
Choose the correct category
Monitor watchers bids and views
Lower your reserve
Fixed price offers
Relist
Step 3 Make connections Once the elements are grouped or arranged in a logical order a clearer picture of the process or system you are representing in your diagram should start to emerge However unlike a list which usually reads from top to bottom only a diagram can show connections in many different directions and working out the links between elements is an essential part of designing a coherent diagram At this stage of the design process it is helpful to sketch out a basic plan of the elements you want to include and the flow-lines or connections between them In order to work out the connections between the elements ask questions such as What happens ifhellip What do I do beforeafter this What decisions need to be made now What actions need to be taken Use arrows to show connections between elements group elements that are part of the same stage or level of the process next to or near to each other and use shapes to show which elements are similar to each other eg diamonds for decisions rectangles for instructions or actions Make up your own meanings for shapes if necessary but be sure to use them consistently
Foundation Computing
Basic Schematic Diagrams 5957docx Page 37
The flow chart below shows how our list of elements above changes and gets re-ordered as we ask these questions and organise the information into a logical and coherent diagram
Decide on your
reserve price
START
Relist
Take a photo that is
clear and item looks
good
Decide on your
ideal buyer
Write a description
of your item
highlighting its
benefits for your
buyer
Upload your item in
a category your
buyer is likely to be
looking in
Monitor how many
views watchers and
bids your item gets
Lower your reserve
Item meets reserve
and sellsItem doesnrsquot sell
Offer to watchers for
your reserve
Decide what you
want to sell
Check what similar
items are currently
selling for
Lots of views but
no watchers
No interestFINISH
Foundation Computing
Basic Schematic Diagrams 5957docx Page 38
Step 4 Test your diagram The final step in designing your diagram is checking that it is as effective as possible To do this you should work through each stage step by step challenging it as you go Picture the process in your mind as you follow the links checking that you have included all the actions and decisions required that they are in the correct order and that no steps are duplicated Once yoursquore confident that the diagram is correct look at it again critically to see if you can improve it or clarify it Is there anywhere you can simplify it by removing unnecessary steps Is there anywhere that seems vague and would be easier to understand if you added a step or a connector Now imagine that you are a member of your target audience For a moment try to forget everything you know about the system or process you have designed a diagram for except for what your target audience knows Look at the diagram with fresh eyes does it make sense to you now Does anything seem odd confusing or out of place Finally look at the layout of your diagram Is it easy to read and follow Have you used shapes texts and arrows consistently Are your shapes and texts uniform and lined up properly Are your connectors clearly defined or are they criss-crossing all over each other Check the spelling of labels carefully ndash go through letter by letter to make sure all names and technical or unfamiliar terms are correct
Discussion With a partner look critically at our example diagram above Discuss any parts of it that you think could be better and any changes you would make to improve the readability of the flow chart Make note on the flow chart above of any areas that you think could be improved Share your answers with the rest of the class
Foundation Computing
Basic Schematic Diagrams 5957docx Page 39
Self Test 1) Mr Biggles owns Biggles Air Supplies a company that makes aircraft supplies He asks you to create an organisation chart for his company He gives you the following list of all his employees and who they report to
Mr James Biggles Chief Executive Officer
Jane Doep Personal Assistant to CEO
Mrs Monica Stepworth Financial Manager (reports to CEO)
Judith Zantes Accountant (reports to Financial Manager)
Mary Smallville Accountant (reports to Financial Manager)
Janey Poretuna Admin Assistant (reports to Judith Zantes)
Mickey Laluevu IT technician (reports to Financial Manager)
Mr Hank Johnson Operations Manager (reports to CEO)
Frank Hapil Engineering Manager (reports to Operations Manager)
Joe Smither Engineering Supervisor (reports to Engineering Manager)
Howie Fartherton Engineering Technician (reports to Engineering Supervisor)
Ernie Jusef Engineering Technician (reports to Engineering Supervisor)
Rob Luxemburg Apprentice Technician (reports to Ernie Jusef)
Harry Monahan Interiors Manager (reports to Operations Manager)
Barney Jokka Interiors Technician (reports to Interiors Supervisor) Design an organisation chart for Biggles Air Supplies and draw it in the space below
2) Think of a simple process that has at least five steps and involves some form of feedback or choice For example operating a vending machine topping up your mobile phone using EFTPOS checking messages on an answering machine
Design a flow chart to represent your process
Foundation Computing
Basic Schematic Diagrams 5957docx Page 40
Self Test Answers
1) Mr Biggles owns Biggles Air Supplies a company that makes aircraft supplies He asks you to create an organisation chart for his company He gives you the following list of all his employees and who they report to
Mr James Biggles Chief Executive Officer
Jane Doep Personal Assistant to CEO
Mrs Monica Stepworth Financial Manager (reports to CEO)
Judith Zantes Accountant (reports to Financial Manager)
Mary Smallville Accountant (reports to Financial Manager)
Janey Poretuna Admin Assistant (reports to Judith Zantes)
Mickey Laluevu IT technician (reports to Financial Manager)
Mr Hank Johnson Operations Manager (reports to CEO)
Frank Hapil Engineering Manager (reports to Operations Manager)
Joe Smither Engineering Supervisor (reports to Engineering Manager)
Howie Fartherton Engineering Technician (reports to Engineering Supervisor)
Ernie Jusef Engineering Technician (reports to Engineering Supervisor)
Rob Luxemburg Apprentice Technician (reports to Ernie Jusef)
Harry Monahan Interiors Manager (reports to Operations Manager)
Barney Jokka Interiors Technician (reports to Interiors Supervisor) Design an organisation chart for Biggles Air Supplies and draw it in the space below
Mr James Biggles
CEO
Jane Doep
Personal
Assistant
Mrs Monica Stepworth
Financial Manager
Judith Zantes
Accountant
Janey Poretuna
Admin Assistant
Mary Smallville
Accountant
Mickey Laluevu
IT technician
Mr Hank Johnson
Operations Manager
Frank Hapil
Engineering
Manager
Harry Monahan
Interiors Manager
Joe Smither
Engineering
Supervisor
Howie Fartherton
Engineering
Technician
Ernie Jusef
Engineering
Technician
Rob Luxemburg
Apprentice
Technician
Barney Jokka
Interiors
Technician
Foundation Computing
Basic Schematic Diagrams 5957docx Page 41
2) Think of a simple process that has at least five steps and involves some form of feedback or choice For example operating a vending machine topping up your mobile phone using EFTPOS checking messages on an answering machine
Design a flow chart to represent your process
Dial 06345
Enter your dialing code and
phone number followed by
the key
Dial number for
service you require
Listen to saved messagesListen to new messages
Dial number for
service you require
Save message Delete message
START
FINISH
Dial 2
Dial 1
Dial 1
Dial 2
Dial 1
Dial 2
Foundation Computing
Basic Schematic Diagrams 5957docx Page 42
Foundation Computing
Basic Schematic Diagrams 5957docx Page 43
Part 2
Produce schematic diagrams from a given brief using a computer application
OBJECTIVES
On successful completion of this section you will be able to Produce schematic diagrams from a given brief using a computer application
Performance criteria
21 The symbols used in each diagram are consistent with the type of diagram and the specifications of the brief
22 The final diagram is readable clearly illustrates the object being diagrammed
and is consistent with the specifications of the brief
TOPICS
Topic 1 Symbols used are consistent with diagram type and specifications Topic 2 Diagram is clear readable and consistent with specifications
Self Test
Self Test Answers
Foundation Computing
Basic Schematic Diagrams 5957docx Page 44
TOPIC 1 Symbols used are consistent with diagram type and specifications A symbol is something such as an object picture written word sound or particular mark that represents something else by association resemblance or convention For example a red octagon may be a symbol for STOP On maps crossed sabres may indicate a battlefield Numerals are symbols for numbers All language consists of symbols The word cat is not a cat but is an arbitrary symbol representing the idea of a cat There are many symbols for many things Examples range from Peace Pipe Red Cross to Electrical symbols It is good when doing schematic drawings to use symbols that are clearly recognised and interpreted Symbols that have been internationally standardised are the best Circuit diagram symbols have differed from country to country and have changed over time They are now to a large extent internationally standardized Simple components often had symbols intended to represent some feature of the physical construction of the device There are several national and international standards for graphical symbols in circuit diagrams in particular
IEC 60617 (also known as British Standard BS 3939)
ANSI standard Y32 (also known as IEEE Std 315) IEC 60617 originally consisted of 13 parts from resistors and capacitors to logic symbols and even a generalised drawing standard of connections and bus line widths It is now published as a subscription online database IEC 60617-DB Different symbols may be used depending on the discipline using the drawing for example lighting and power symbols used as part of architectural drawings may be different from symbols for devices used in electronics Different electronic components have different characteristics it is necessary to distinguish between them in any circuit diagram Of course we could use the block diagram approach and just identify each component with words Unfortunately this takes up a lot of space and makes the overall diagram harder to recognize or understand quickly We need a way to understand electrical diagrams far more quickly and easily
Foundation Computing
Basic Schematic Diagrams 5957docx Page 45
The answer is to use schematic symbols to represent electronic components as shown in the diagram below In this diagram we show the schematic symbol of a battery as the electrical source and the symbol of a resistor as the load Even without the words and arrows the symbols define exactly what this circuit is and how it behaves
Some good procedures to follow with symbols include
Using templates for frequently used symbols
Use symbols consistently
Use a library of symbols such as from IEC 60617-DB
Foundation Computing
Basic Schematic Diagrams 5957docx Page 46
TOPIC 2 Diagram is clear readable and consistent with specifications Creating a simple diagram using MSPaint To start with letrsquos create a simple flow chart representing the stages in designing a schematic diagram There are four stages in this process
1) Gather your information 2) Organise your information 3) Make connections 4) Test your diagram
Our flow chart will consist of four rectangles arranged vertically with downward pointing arrows as connectors A rounded rectangle at the top and at the bottom of the flowchart will indicate START and FINISH respectively Step by step
Open Microsoft Paint
Click on the Rectangle tool then click and drag in the drawing area to draw a rectangle
Repeat this step to draw four boxes in the drawing area OR click on the Select tool and click and drag to select the first rectangle then right-click to copy and paste three more rectangles the same size in the drawing area
Foundation Computing
Basic Schematic Diagrams 5957docx Page 47
Using the Rounded Rectangle tool draw a rounded rectangle at the top and bottom of your flow chart
Foundation Computing
Basic Schematic Diagrams 5957docx Page 48
Use the Line tool to draw arrows between each box In the Options area under the Tool bar you can choose the thickness of line that you want to use Remember too that if you hold down the Shift key on the keyboard while you are drawing a line you can create a 45 degree angle
Use the Text tool to add text to the shapes by clicking on the Text tool clicking and dragging to create a textbox inside your shape then typing your text Check your spelling carefully letter by letter as you go
Foundation Computing
Basic Schematic Diagrams 5957docx Page 49
The basic flowchart created in Microsoft Paint could look something like this
Foundation Computing
Basic Schematic Diagrams 5957docx Page 50
Common problems with diagrams Even well-designed schematic diagrams will be difficult for the target audience to read and understand if symbols are used inconsistently or the layout of the diagram is unfamiliar For example if a flowchart has different shapes used for each element and different types of arrows used randomly it will be more difficult for readers to see the overall direction and meaning of the diagram If the shapes on an organisation chart are different sizes and randomly positioned with no clear levels or hierarchy the diagram will not provide a clear overview of the organisationrsquos structure If an electrical circuit diagram has unfamiliar symbols used for elements such as switches resistors and batteries then it will not make sense to its intended audience
Tips for improving the readability of your schematic diagrams
Use symbols and shapes consistently ie elements that are similar should have the same symbol or shape
Avoid having connectors crossing over each other
Avoid having symbols or shapes overlapping
Use arrows on connectors or flow lines to indicate direction
Use colours text size and font consistently
Diagrams that can be read top-to-bottom and left-to-right are easier to read
In a process diagram have only one connector leading into a symbol but have more coming out where necessary to indicate different directions or decisions
Diagrams for a technical audience such as electrical or computer programming schematics should follow accepted conventions for symbols and layout
Diagrams indicating a hierarchy of positions ideas or stages are clearer if elements belonging to the same level are a similar shape size and position on the page
Keep labels as clear and as brief as possible Carefully check the spelling of all names and labels letter by letter ndash errors in the spelling of names or scientific and technical terms look unprofessional and can be confusing for readers
Foundation Computing
Basic Schematic Diagrams 5957docx Page 51
Self Test Look at the schematic diagrams that follow Make notes under each example of what is wrong with the diagram what is right about the diagram and what could be changed to make it clear and meaningful to its intended audience 1) This flow chart is supposed to show police officers how to get a suspect to confess to a crime
START
Confidently accuse
suspect of crime
Describe a
scenario that
enables suspect
to admit guiltAllow suspect to
voice objections
Invade suspectrsquos
personal space
Suspect becomes
uncomfortable
Suspect
doesnrsquot
deny guilt
Suspect
denies guilt
No reaction
Elicit confession
Rephrase objections as
confessions
FINISH
Foundation Computing
Basic Schematic Diagrams 5957docx Page 52
2) The following diagram is an organisation chart for Widget Enterprises
John Smith
MANAGER
Seth Drew
IT MANAGER
May Furur
SECRETARY
Judith Holland
CUSTOMER SERVICES manager
Jad Ling
HELPDESK
Harry Petal
FINANCIAL MANAGER
Wanda Springer
MARKETING
MANAGER
Bob Smithells
CLEANER
Kelly Inlerl
MARKETING ASSISTANT
Beryl Thin
CUSTOMER SERVICES ASSISTANTValda Rigley
CUSTOMER
SERVICES
ASSISTANT
Levi Quayle
COMPUTER
TECHNICIAN
3) Which of the following computer applications can be used to create schematic diagrams
a) Microsoft Visio
b) Microsoft Paint
c) Microsoft Word
d) All of the above
4) Which frequently used shapes does the Microsoft Paint Tool bar contain templates for
5) Where in the Microsoft Paint window would you be able to select the thickness of line that you wanted for a brushstroke 6) Identify the purpose and intended audience for a diagram showing a businessrsquos marketing plan 7) Name two characteristics of well-designed schematic diagrams 8) Identify four steps involved in designing schematic diagrams 9) Why is it important to use conventionally accepted and familiar shapes and symbols in your schematic diagrams
Foundation Computing
Basic Schematic Diagrams 5957docx Page 53
Self Test Answers 1) This flow chart is supposed to show police officers how to get a suspect to confess to a crime
START
Confidently accuse
suspect of crime
Describe a
scenario that
enables suspect
to admit guiltAllow suspect to
voice objections
Invade suspectrsquos
personal space
Suspect becomes
uncomfortable
Suspect
doesnrsquot
deny guilt
Suspect
denies guilt
No reaction
Elicit confession
Rephrase objections as
confessions
FINISH
Random shapes are meaningless and confusing ndash use conventional flow chart symbols
Stages of process are not clear ndash arrange shapes top to bottom with options at each stage branching off to side at same level
Connectors that are either straight or curved would be more consistent
Labels are clear
Text uses consistent font and size
Foundation Computing
Basic Schematic Diagrams 5957docx Page 54
2) The following diagram is an organisation chart for Widget Enterprises
John Smith
MANAGER
Seth Drew
IT MANAGER
May Furur
SECRETARY
Judith Holland
CUSTOMER SERVICES manager
Jad Ling
HELPDESK
Harry Petal
FINANCIAL MANAGER
Wanda Springer
MARKETING
MANAGER
Bob Smithells
CLEANER
Kelly Inlerl
MARKETING ASSISTANT
Beryl Thin
CUSTOMER SERVICES ASSISTANTValda Rigley
CUSTOMER
SERVICES
ASSISTANT
Levi Quayle
COMPUTER
TECHNICIAN
No clear levels to hierarchy ndash organise so that diagram reads top to bottom and positions at similar level are in same horizontal space
Different sized boxes and borders on some boxes are meaningless ndash need consistent style for similar elements
Connectors cross over each other and boxes overlap ndash arrange space to avoid this
Text size and font is mostly consistent but one typo needs correcting
3) Which of the following computer applications can be used to create schematic diagrams
a) Microsoft Visio
b) Microsoft Paint
c) Microsoft Word
d) All of the above correct
4) Which frequently used shapes does the Microsoft Paint Tool bar contain templates for
Polygon rectangle ovalellipse
Foundation Computing
Basic Schematic Diagrams 5957docx Page 55
5) Where in the Microsoft Paint window would you be able to select the thickness of line that you wanted for a brushstroke
Options area below the Toolbar
6) Identify the purpose and intended audience for a diagram showing a businessrsquos marketing plan
The purpose would be to provide an overview of the businessrsquos marketing strategy Audience could include management and employees of the business especially the Marketing department potential investors shareholders and directors of the business
7) Name two characteristics of well-designed schematic diagrams Any of simple easy for the target audience to understand include all relevant elements or parts of the process clear and logical connections between elements accurate 8) Identify four steps involved in designing schematic diagrams Gather information organise information make connections between elements test your diagram 9) Why is it important to use conventionally accepted and familiar shapes and
symbols in your schematic diagrams So that the diagram will be easily understood by the target audience
Foundation Computing
Basic Schematic Diagrams 5957docx Page 56
References httpwindowsmicrosoftcomen-NZwindows7Getting-started-with-Paint accessed Sat 5th December in Timaru New Zealand httpenwikipediaorgwikiSchematic_diagrams accessed Sat 5th December in Timaru New Zealand httpenwikipediaorgwikiSymbol accessed Sat 5th December in Timaru New Zealand

Foundation Computing
Basic Schematic Diagrams 5957docx Page 18
Identifying the target audience The target audience is the group of people who will read your schematic diagram The main question you need to ask yourself is Who is my audience In order to identify the target audience for your schematic diagram think about the following
What sort of person will read your diagram Think about that personrsquos job age education language environment and other characteristics that could affect the sort of language and symbols they will understand and relate to
What information will that person look for Why are they reading your diagram What do they want or need to know What information is most important What information is not so important
How much time will that person have to look at your diagram Will they be in a hurry or will they have time to study all the details Does your diagram have to stand alone or will it have a lot of text next to it to explain it
What do you want your audience to learn or do as a result of reading your diagram
What does the diagram need to show What information do you have to include How should this information be arranged
Foundation Computing
Basic Schematic Diagrams 5957docx Page 19
Exercise Complete the table below with information about the target audience and purpose for each of the examples of schematic diagrams given Use the questions above to help you
Example diagram Target audience
You work as an electrician and Mr Jones has asked you to design an electrical wiring plan for the dream house he wants to build
You are a computer programmer and you are using a flowchart to plan a computer program that farmers can use to keep count of their sheep
You have to write an essay about your most embarrassing childhood experience and you create a mindmap to organise your ideas
You are researching your family history and have been asked to create a family tree diagram for a booklet that will be handed out at an upcoming family reunion
Foundation Computing
Basic Schematic Diagrams 5957docx Page 20
Suggested Answer Complete the table below with information about the target audience and purpose for each of the examples of schematic diagrams given Use the questions above to help you
Example diagram Target audience
You work as an electrician and Mr Jones has asked you to design an electrical wiring plan for the dream house he wants to build
Mr Jones his builder local council officials theyrsquoll need detailed information that will be studied in depth and referred to during the planning and building process
You are a computer programmer and you are using a flowchart to plan a computer program that farmers can use to keep count of their sheep
You and other computer programmers will use the flowchart to understand the process of the programme and to identify flaws in its logic
You have to write an essay about your most embarrassing childhood experience and you create a mindmap to organise your ideas
You are the only person who will use your mindmap and you will refer to it as you write your essay
You are researching your family history and have been asked to create a family tree diagram for a booklet that will be handed out at an upcoming family reunion
Members of your family will look for their names and those of relatives in order to see how people are related to each other
Foundation Computing
Basic Schematic Diagrams 5957docx Page 21
TOPIC 2 Identifying the computer application required There are many computer applications that can be used to create schematic diagrams Microsoft Visio is specifically designed for this purpose but any application with basic drawing tools such as those found in Microsoft Word can be used One of the simplest and most widely available computer drawing applications is Microsoft Paint We will use this application is used to demonstrate the tools However most of the tools and principles we will focus on in Microsoft Paint can be found in other drawing applications The following diagram shows the Microsoft Paint window
The tools are arranged to the left of the drawing area in the Tool bar An overview of how to use the tools you need to create a simple schematic diagram is provided below Underneath the Tool bar is the Options box When you click on a tool icon in the Tool bar the options available for that tool appear in the Options box To select an option click on the tool you want to use then click on the option and then click in the drawing area and drag the mouse pointer to draw The Colour palette is underneath the drawing area To use a colour click on the tool you want to use then click on the colour and then click in the drawing area ndash the shape line or text you create will appear in the colour you have selected
Foundation Computing
Basic Schematic Diagrams 5957docx Page 22
Tools Selection Tools Use the selection tools to select the parts of your schematic diagram that you want to work with or change in some way To use these tools click on the button of the tool you want and then click on your diagram and drag until the area you want to work with is selected The Freeform Select tool (on the left) is used to select an irregularly shaped area The Rectangle Select tool is used to select a rectangular area To copy a part of your diagram eg a shape line or text it must first be selected using a selection tool Select Copy from the Edit menu click where you want the copy to be positioned and select Paste from the Edit menu Shapes tools
The shapes tools which can be used to create symbols in schematic diagrams consist of the Rectangle tool for creating squares or rectangles the Polygon tool for creating multi-sided shapes the Rounded Rectangle tool for creating rounded rectangles and the Oval tool for creating circles or ovals These tools provide templates for creating frequently used symbols To use them simply click on the icon of the shape you want to use and drag it onto your diagram where you can resize it if necessary and add text or
Foundation Computing
Basic Schematic Diagrams 5957docx Page 23
effects For the Polygon tool click and drag to draw the first side and click each time you want to change direction Double-click when you have finished To create a perfect circle hold down the Shift key while you are dragging the mouse pointer
Line tools In schematic diagrams line tools can be used to draw connectors between symbols and to draw shapes or symbols
The Straight Line tool creates straight lines simply click on the Straight Line icon click in your picture where you want the line to start and drag to where you want the line to finish The Curve tool will create a curve with at least one and no more than two bends in it click on the Curve icon then click in your picture to draw a straight line and drag to where you want the first bend to be click again where you want the second curve to be and drag to shape the curve You can make more complex shapes by joining lines and curves together
The Pencil tool can be used to draw freeform shapes or lines with as many bends and curves as you want Click on the icon click in your diagram and ldquodrawrdquo with your mouse pointer To draw straight lines hold down the shift key as you are drawing with the mouse
Foundation Computing
Basic Schematic Diagrams 5957docx Page 24
The Paint Brush tool draws freeform lines in the same way as the Pencil tool but can be used to create lines of varying widths and styles To select a paintbrush style click on the Paint Brush icon and then click in the Options box on the style you want to use
The Airbrush tool creates lines with an airbrushed effect of clustered dots It can be used in the same way as the pencil tool to draw freeform shapes or symbols In the Options box you can choose the size of the area covered by the Airbrush tool
Text tool
Add text to your schematic diagram by clicking on the Text icon and clicking in your diagram where you want the text to appear As you drag a rectangle will be formed within which text can be typed The Fonts dialogue box will also open
Foundation Computing
Basic Schematic Diagrams 5957docx Page 25
Fill Tool
The Fill tool will add colour to a shape that you have drawn Click on the icon click on a colour from the colour palette and then click on the shape in the diagram that you want to fill with colour
Zoom tool
Use the Zoom tool to magnify a section of the diagram that you are working with Click on the magnifying glass icon select the size you want in the Options box and click on the part of the image you want to enlarge As the picture zooms in the cursor will change back to the tool you were using before
Adding colour
The Colour box to the left of the Colour palette shows the foreground and background colours you are using If you click on a tool and then drag while holding down the left mouse button the line or shape will be drawn using the foreground colour If you hold down the right mouse button the background colour will be used To use any other colour click on the tool you want to use click on an option (if using) then click on the colour you want from the colour palette As you draw the colour you have clicked on will be used
Foundation Computing
Basic Schematic Diagrams 5957docx Page 26
Additional resources For more detailed information about these tools refer to the Help menu in Microsoft Paint (httpwindowshelpmicrosoftcom )
The following online tutorials may also be useful
httplkwdplorgclassesMSPaintpainthtml
httpwwwlesleyedufacultyahuntMSPttutrhtm
Exercise The example below shows a simple organisation chart produced using Microsoft Paint In the space that follows identify which tools were used to create this schematic diagram and what each tool was used for
Rectangle tool used to create Manager symbol
Oval tool used to create Team Leader symbols
Rounded Rectangle tool used for Team member symbols
Straight line tool used to create connectors
Text tool used to add text to shapes
Rectangle Select tool used to select shapes to move into
position
Foundation Computing
Basic Schematic Diagrams 5957docx Page 27
Suggested Answer The example below shows a simple organisation chart produced using Microsoft Paint In the space that follows identify which tools were used to create this schematic diagram and what each tool was used for
Rectangle tool used to create Manager symbol
Oval tool used to create Team Leader symbols
Rounded Rectangle tool used for Team member symbols
Straight line tool used to create connectors
Text tool used to add text to shapes
Rectangle Select tool used to select shapes to move into position
Foundation Computing
Basic Schematic Diagrams 5957docx Page 28
Exercise Which tools would you use to produce the following symbols or diagrams and why
Symbol Tools and justification
Resistor (Electrical circuit diagram)
Speaker (Electrical circuit diagram)
AC
AC source (Electrical circuit diagram)
Start or end of process (Flowchart)
Decision (yes or no) (Flowchart)
Instructions or actions (Flowchart)
Foundation Computing
Basic Schematic Diagrams 5957docx Page 29
Symbol Tools and justification
Document produced (Flowchart)
Data entered or received (Flowchart)
Foundation Computing
Basic Schematic Diagrams 5957docx Page 30
Suggested Answers Which tools would you use to produce the following symbols or diagrams and why
Symbol Tools and justification
Resistor (Electrical circuit diagram)
Straight line tool (hold down shift key)It creates regular 45 degree angled lines that are perfectly straight
Speaker (Electrical circuit diagram)
Polygon tool (hold down shift key) Rectangle tool and Straight line tool These are used in order to create a symbol with uniform angles and straight edges
AC
AC source (Electrical circuit diagram)
Oval tool (hold down shift key) to draw circle Curve tool to draw wavy line Straight line tool and Text tool These tools produce cleaner shapes than drawing freeform
Start or end of process (Flowchart)
Rounded rectangle tool This provides a template for creating this symbol
Decision (yes or no) (Flowchart)
Polygon tool This creates more accurate joins between sides than the Straight line tool
Instructions or actions (Flowchart)
Rectangle tool It provides a template for drawing this shape
Foundation Computing
Basic Schematic Diagrams 5957docx Page 31
Symbol Tools and justification
Document produced (Flowchart)
Line tool and Curve tool ndash need two tools in MSPaint other applications may have a template for this shape
Data entered or received (Flowchart)
Polygon tool ndash better than Straight line tool because can produce more regular shape
Foundation Computing
Basic Schematic Diagrams 5957docx Page 32
TOPIC 3 Getting started with MS Paint Sourced from httpwindowsmicrosoftcomen-NZwindows7Getting-started-with-Paint MS Paint is a feature in Windows that you can use to draw colour and edit pictures You can use Paint like a digital sketchpad to make simple pictures creative projects or to add text and designs to other pictures such as those taken with your digital camera The parts of Paint Open Paint by clicking the Start button clicking All Programs clicking Accessories and then clicking Paint When you start Paint youll see an empty window drawing and painting tools are located in the ribbon at the top of the window The following illustration shows the different parts of the Paint window
The Paint window
Foundation Computing
Basic Schematic Diagrams 5957docx Page 33
Working with tools The ribbon in Paint includes a handy collection of drawing tools You can use these tools to create freehand drawings and add a variety of shapes to your pictures This section describes some common tasks For more detailed information on how to use the different tools in Paint see Using Paint Draw a line Some tools and shapes such as the Pencil Brush Line and Curve let you make a variety of straight curved and squiggly lines What you draw is determined by how you move the mouse as you draw You can use the Line to draw a straight line for example
1) On the Home tab in the Shapes group click the Line 2) In the Colors group click Color 1 and then click the color you want to use 3) To draw drag the pointer across the drawing area
Draw a squiggly line Your drawings dont have to be composed of only straight lines The Pencil and Brushes can be used to make completely random free-form shapes
1) On the Home tab in the Tools group click the Pencil tool 2) In the Colors group click Color 1 and then click the color you want to use 3) To draw drag the pointer across the drawing area and make a squiggly line
Note If you want to make a line that has a different appearance use one of the Brushes instead Draw a shape Paint lets you draw many different shapes For example you can draw ready-made defined shapes such as rectangles circles squares triangles and arrows (to name a
few) You can also make your own custom shape by using the Polygon shape to draw a polygon which is a shape that can have any number of sides
1) On the Home tab in the Shapes group click a ready-made shape such as the
Rectangle 2) To add a ready-made shape drag the pointer across the drawing area to make
the shape 3) To change the outline style in the Shapes group click Outline and then click an
outline style 4) If you dont want your shape to have an outline click No outline 5) In the Colors group click Color 1 and then click a color for the outline 6) In the Colors group click Color 2 and then click a color to use to fill the shape 7) To change the fill style in the Shapes group click Fill and then click a fill style 8) If you dont want your shape to be filled click No fill
Foundation Computing
Basic Schematic Diagrams 5957docx Page 34
Add text You can also add text to your picture The Text tool lets you add a simple message or title
1) On the Home tab in the Tools group click the Text tool 2) Drag the pointer in the drawing area where you want to add text 3) Under Text Tools on the Text tab click the font face size and style in the Font
group The Font group
4) In the Colors group click Color 1 and then click a color This is the text color 5) Type the text that you want to add
Erase part of your picture If you make a mistake or need to change part of a picture use the eraser By default the eraser changes any area you erase to white but you can change the eraser color For example if you set the background color to yellow anything you erase turns to yellow
1) On the Home tab in the Tools group click the Eraser tool 2) In the Colors group click Color 2 and then click the color that you want to erase
with If you want to erase with white you dont have to select a color 3) Drag the pointer over the area you want to erase
Saving a picture Save your picture frequently so you dont accidentally lose your work To save click the
Paint button and then click Save This saves all of the changes made to the picture since the last time you saved The very first time that you save a new picture you will need to give your picture a file name Follow these steps
1) Click the Paint button and then click Save 2) In the Save as type box select the file format you want 3) In the File name box type a name and then click Save
Foundation Computing
Basic Schematic Diagrams 5957docx Page 35
Topic 4 Designing your diagram Although there are many different types of schematic diagrams the basic process and principles involved in designing a clear and coherent diagram are similar The principles apply to designing an electrical circuit diagram an organisation chart a mind map a flow chart and many other diagrams Some of these principles are also worth applying to other disciplines such as designing a Web page Letrsquos work step-by-step through the process of creating a flow chart to help people make money selling things on an on-line auction site such as wwwtrademeconz or wwwebaycom
Step 1 Gather your information Start by brainstorming all the information you need to include in your diagram Write down everything you think might be important or should be included
trademe
choose things that
sell
good photograph
feedback
keep track
prompt answers
postage
auction length
similar listings
postal system
setting reserve
describing item
correct category
re-listing
fixed offers
Look at the information you have gathered and think about your target audience Highlight the information that is most important to your target audience Cross out any irrelevant information Put question marks next to information that you are unsure about or may be able to leave out
Foundation Computing
Basic Schematic Diagrams 5957docx Page 36
Step 2 Organise your information Take the information that you have left and sort through it How you organise your information will depend on the type of diagram you are designing For example an organisationrsquos chart usually has different levels and shows who its members report to so you might group people by department and by level A flow chart like the example wersquore creating usually shows a process Information is grouped in the order we would use it If any other steps or information occurs to you as you are organising your information add them in Herersquos an example of how the key steps involved in selling on trademe could be ordered
Choose items that sell
Look at similar listings
Decide on a reserve price
Take a clear photograph
Identify your target audience
Write a clear description
Upload your item
Choose the correct category
Monitor watchers bids and views
Lower your reserve
Fixed price offers
Relist
Step 3 Make connections Once the elements are grouped or arranged in a logical order a clearer picture of the process or system you are representing in your diagram should start to emerge However unlike a list which usually reads from top to bottom only a diagram can show connections in many different directions and working out the links between elements is an essential part of designing a coherent diagram At this stage of the design process it is helpful to sketch out a basic plan of the elements you want to include and the flow-lines or connections between them In order to work out the connections between the elements ask questions such as What happens ifhellip What do I do beforeafter this What decisions need to be made now What actions need to be taken Use arrows to show connections between elements group elements that are part of the same stage or level of the process next to or near to each other and use shapes to show which elements are similar to each other eg diamonds for decisions rectangles for instructions or actions Make up your own meanings for shapes if necessary but be sure to use them consistently
Foundation Computing
Basic Schematic Diagrams 5957docx Page 37
The flow chart below shows how our list of elements above changes and gets re-ordered as we ask these questions and organise the information into a logical and coherent diagram
Decide on your
reserve price
START
Relist
Take a photo that is
clear and item looks
good
Decide on your
ideal buyer
Write a description
of your item
highlighting its
benefits for your
buyer
Upload your item in
a category your
buyer is likely to be
looking in
Monitor how many
views watchers and
bids your item gets
Lower your reserve
Item meets reserve
and sellsItem doesnrsquot sell
Offer to watchers for
your reserve
Decide what you
want to sell
Check what similar
items are currently
selling for
Lots of views but
no watchers
No interestFINISH
Foundation Computing
Basic Schematic Diagrams 5957docx Page 38
Step 4 Test your diagram The final step in designing your diagram is checking that it is as effective as possible To do this you should work through each stage step by step challenging it as you go Picture the process in your mind as you follow the links checking that you have included all the actions and decisions required that they are in the correct order and that no steps are duplicated Once yoursquore confident that the diagram is correct look at it again critically to see if you can improve it or clarify it Is there anywhere you can simplify it by removing unnecessary steps Is there anywhere that seems vague and would be easier to understand if you added a step or a connector Now imagine that you are a member of your target audience For a moment try to forget everything you know about the system or process you have designed a diagram for except for what your target audience knows Look at the diagram with fresh eyes does it make sense to you now Does anything seem odd confusing or out of place Finally look at the layout of your diagram Is it easy to read and follow Have you used shapes texts and arrows consistently Are your shapes and texts uniform and lined up properly Are your connectors clearly defined or are they criss-crossing all over each other Check the spelling of labels carefully ndash go through letter by letter to make sure all names and technical or unfamiliar terms are correct
Discussion With a partner look critically at our example diagram above Discuss any parts of it that you think could be better and any changes you would make to improve the readability of the flow chart Make note on the flow chart above of any areas that you think could be improved Share your answers with the rest of the class
Foundation Computing
Basic Schematic Diagrams 5957docx Page 39
Self Test 1) Mr Biggles owns Biggles Air Supplies a company that makes aircraft supplies He asks you to create an organisation chart for his company He gives you the following list of all his employees and who they report to
Mr James Biggles Chief Executive Officer
Jane Doep Personal Assistant to CEO
Mrs Monica Stepworth Financial Manager (reports to CEO)
Judith Zantes Accountant (reports to Financial Manager)
Mary Smallville Accountant (reports to Financial Manager)
Janey Poretuna Admin Assistant (reports to Judith Zantes)
Mickey Laluevu IT technician (reports to Financial Manager)
Mr Hank Johnson Operations Manager (reports to CEO)
Frank Hapil Engineering Manager (reports to Operations Manager)
Joe Smither Engineering Supervisor (reports to Engineering Manager)
Howie Fartherton Engineering Technician (reports to Engineering Supervisor)
Ernie Jusef Engineering Technician (reports to Engineering Supervisor)
Rob Luxemburg Apprentice Technician (reports to Ernie Jusef)
Harry Monahan Interiors Manager (reports to Operations Manager)
Barney Jokka Interiors Technician (reports to Interiors Supervisor) Design an organisation chart for Biggles Air Supplies and draw it in the space below
2) Think of a simple process that has at least five steps and involves some form of feedback or choice For example operating a vending machine topping up your mobile phone using EFTPOS checking messages on an answering machine
Design a flow chart to represent your process
Foundation Computing
Basic Schematic Diagrams 5957docx Page 40
Self Test Answers
1) Mr Biggles owns Biggles Air Supplies a company that makes aircraft supplies He asks you to create an organisation chart for his company He gives you the following list of all his employees and who they report to
Mr James Biggles Chief Executive Officer
Jane Doep Personal Assistant to CEO
Mrs Monica Stepworth Financial Manager (reports to CEO)
Judith Zantes Accountant (reports to Financial Manager)
Mary Smallville Accountant (reports to Financial Manager)
Janey Poretuna Admin Assistant (reports to Judith Zantes)
Mickey Laluevu IT technician (reports to Financial Manager)
Mr Hank Johnson Operations Manager (reports to CEO)
Frank Hapil Engineering Manager (reports to Operations Manager)
Joe Smither Engineering Supervisor (reports to Engineering Manager)
Howie Fartherton Engineering Technician (reports to Engineering Supervisor)
Ernie Jusef Engineering Technician (reports to Engineering Supervisor)
Rob Luxemburg Apprentice Technician (reports to Ernie Jusef)
Harry Monahan Interiors Manager (reports to Operations Manager)
Barney Jokka Interiors Technician (reports to Interiors Supervisor) Design an organisation chart for Biggles Air Supplies and draw it in the space below
Mr James Biggles
CEO
Jane Doep
Personal
Assistant
Mrs Monica Stepworth
Financial Manager
Judith Zantes
Accountant
Janey Poretuna
Admin Assistant
Mary Smallville
Accountant
Mickey Laluevu
IT technician
Mr Hank Johnson
Operations Manager
Frank Hapil
Engineering
Manager
Harry Monahan
Interiors Manager
Joe Smither
Engineering
Supervisor
Howie Fartherton
Engineering
Technician
Ernie Jusef
Engineering
Technician
Rob Luxemburg
Apprentice
Technician
Barney Jokka
Interiors
Technician
Foundation Computing
Basic Schematic Diagrams 5957docx Page 41
2) Think of a simple process that has at least five steps and involves some form of feedback or choice For example operating a vending machine topping up your mobile phone using EFTPOS checking messages on an answering machine
Design a flow chart to represent your process
Dial 06345
Enter your dialing code and
phone number followed by
the key
Dial number for
service you require
Listen to saved messagesListen to new messages
Dial number for
service you require
Save message Delete message
START
FINISH
Dial 2
Dial 1
Dial 1
Dial 2
Dial 1
Dial 2
Foundation Computing
Basic Schematic Diagrams 5957docx Page 42
Foundation Computing
Basic Schematic Diagrams 5957docx Page 43
Part 2
Produce schematic diagrams from a given brief using a computer application
OBJECTIVES
On successful completion of this section you will be able to Produce schematic diagrams from a given brief using a computer application
Performance criteria
21 The symbols used in each diagram are consistent with the type of diagram and the specifications of the brief
22 The final diagram is readable clearly illustrates the object being diagrammed
and is consistent with the specifications of the brief
TOPICS
Topic 1 Symbols used are consistent with diagram type and specifications Topic 2 Diagram is clear readable and consistent with specifications
Self Test
Self Test Answers
Foundation Computing
Basic Schematic Diagrams 5957docx Page 44
TOPIC 1 Symbols used are consistent with diagram type and specifications A symbol is something such as an object picture written word sound or particular mark that represents something else by association resemblance or convention For example a red octagon may be a symbol for STOP On maps crossed sabres may indicate a battlefield Numerals are symbols for numbers All language consists of symbols The word cat is not a cat but is an arbitrary symbol representing the idea of a cat There are many symbols for many things Examples range from Peace Pipe Red Cross to Electrical symbols It is good when doing schematic drawings to use symbols that are clearly recognised and interpreted Symbols that have been internationally standardised are the best Circuit diagram symbols have differed from country to country and have changed over time They are now to a large extent internationally standardized Simple components often had symbols intended to represent some feature of the physical construction of the device There are several national and international standards for graphical symbols in circuit diagrams in particular
IEC 60617 (also known as British Standard BS 3939)
ANSI standard Y32 (also known as IEEE Std 315) IEC 60617 originally consisted of 13 parts from resistors and capacitors to logic symbols and even a generalised drawing standard of connections and bus line widths It is now published as a subscription online database IEC 60617-DB Different symbols may be used depending on the discipline using the drawing for example lighting and power symbols used as part of architectural drawings may be different from symbols for devices used in electronics Different electronic components have different characteristics it is necessary to distinguish between them in any circuit diagram Of course we could use the block diagram approach and just identify each component with words Unfortunately this takes up a lot of space and makes the overall diagram harder to recognize or understand quickly We need a way to understand electrical diagrams far more quickly and easily
Foundation Computing
Basic Schematic Diagrams 5957docx Page 45
The answer is to use schematic symbols to represent electronic components as shown in the diagram below In this diagram we show the schematic symbol of a battery as the electrical source and the symbol of a resistor as the load Even without the words and arrows the symbols define exactly what this circuit is and how it behaves
Some good procedures to follow with symbols include
Using templates for frequently used symbols
Use symbols consistently
Use a library of symbols such as from IEC 60617-DB
Foundation Computing
Basic Schematic Diagrams 5957docx Page 46
TOPIC 2 Diagram is clear readable and consistent with specifications Creating a simple diagram using MSPaint To start with letrsquos create a simple flow chart representing the stages in designing a schematic diagram There are four stages in this process
1) Gather your information 2) Organise your information 3) Make connections 4) Test your diagram
Our flow chart will consist of four rectangles arranged vertically with downward pointing arrows as connectors A rounded rectangle at the top and at the bottom of the flowchart will indicate START and FINISH respectively Step by step
Open Microsoft Paint
Click on the Rectangle tool then click and drag in the drawing area to draw a rectangle
Repeat this step to draw four boxes in the drawing area OR click on the Select tool and click and drag to select the first rectangle then right-click to copy and paste three more rectangles the same size in the drawing area
Foundation Computing
Basic Schematic Diagrams 5957docx Page 47
Using the Rounded Rectangle tool draw a rounded rectangle at the top and bottom of your flow chart
Foundation Computing
Basic Schematic Diagrams 5957docx Page 48
Use the Line tool to draw arrows between each box In the Options area under the Tool bar you can choose the thickness of line that you want to use Remember too that if you hold down the Shift key on the keyboard while you are drawing a line you can create a 45 degree angle
Use the Text tool to add text to the shapes by clicking on the Text tool clicking and dragging to create a textbox inside your shape then typing your text Check your spelling carefully letter by letter as you go
Foundation Computing
Basic Schematic Diagrams 5957docx Page 49
The basic flowchart created in Microsoft Paint could look something like this
Foundation Computing
Basic Schematic Diagrams 5957docx Page 50
Common problems with diagrams Even well-designed schematic diagrams will be difficult for the target audience to read and understand if symbols are used inconsistently or the layout of the diagram is unfamiliar For example if a flowchart has different shapes used for each element and different types of arrows used randomly it will be more difficult for readers to see the overall direction and meaning of the diagram If the shapes on an organisation chart are different sizes and randomly positioned with no clear levels or hierarchy the diagram will not provide a clear overview of the organisationrsquos structure If an electrical circuit diagram has unfamiliar symbols used for elements such as switches resistors and batteries then it will not make sense to its intended audience
Tips for improving the readability of your schematic diagrams
Use symbols and shapes consistently ie elements that are similar should have the same symbol or shape
Avoid having connectors crossing over each other
Avoid having symbols or shapes overlapping
Use arrows on connectors or flow lines to indicate direction
Use colours text size and font consistently
Diagrams that can be read top-to-bottom and left-to-right are easier to read
In a process diagram have only one connector leading into a symbol but have more coming out where necessary to indicate different directions or decisions
Diagrams for a technical audience such as electrical or computer programming schematics should follow accepted conventions for symbols and layout
Diagrams indicating a hierarchy of positions ideas or stages are clearer if elements belonging to the same level are a similar shape size and position on the page
Keep labels as clear and as brief as possible Carefully check the spelling of all names and labels letter by letter ndash errors in the spelling of names or scientific and technical terms look unprofessional and can be confusing for readers
Foundation Computing
Basic Schematic Diagrams 5957docx Page 51
Self Test Look at the schematic diagrams that follow Make notes under each example of what is wrong with the diagram what is right about the diagram and what could be changed to make it clear and meaningful to its intended audience 1) This flow chart is supposed to show police officers how to get a suspect to confess to a crime
START
Confidently accuse
suspect of crime
Describe a
scenario that
enables suspect
to admit guiltAllow suspect to
voice objections
Invade suspectrsquos
personal space
Suspect becomes
uncomfortable
Suspect
doesnrsquot
deny guilt
Suspect
denies guilt
No reaction
Elicit confession
Rephrase objections as
confessions
FINISH
Foundation Computing
Basic Schematic Diagrams 5957docx Page 52
2) The following diagram is an organisation chart for Widget Enterprises
John Smith
MANAGER
Seth Drew
IT MANAGER
May Furur
SECRETARY
Judith Holland
CUSTOMER SERVICES manager
Jad Ling
HELPDESK
Harry Petal
FINANCIAL MANAGER
Wanda Springer
MARKETING
MANAGER
Bob Smithells
CLEANER
Kelly Inlerl
MARKETING ASSISTANT
Beryl Thin
CUSTOMER SERVICES ASSISTANTValda Rigley
CUSTOMER
SERVICES
ASSISTANT
Levi Quayle
COMPUTER
TECHNICIAN
3) Which of the following computer applications can be used to create schematic diagrams
a) Microsoft Visio
b) Microsoft Paint
c) Microsoft Word
d) All of the above
4) Which frequently used shapes does the Microsoft Paint Tool bar contain templates for
5) Where in the Microsoft Paint window would you be able to select the thickness of line that you wanted for a brushstroke 6) Identify the purpose and intended audience for a diagram showing a businessrsquos marketing plan 7) Name two characteristics of well-designed schematic diagrams 8) Identify four steps involved in designing schematic diagrams 9) Why is it important to use conventionally accepted and familiar shapes and symbols in your schematic diagrams
Foundation Computing
Basic Schematic Diagrams 5957docx Page 53
Self Test Answers 1) This flow chart is supposed to show police officers how to get a suspect to confess to a crime
START
Confidently accuse
suspect of crime
Describe a
scenario that
enables suspect
to admit guiltAllow suspect to
voice objections
Invade suspectrsquos
personal space
Suspect becomes
uncomfortable
Suspect
doesnrsquot
deny guilt
Suspect
denies guilt
No reaction
Elicit confession
Rephrase objections as
confessions
FINISH
Random shapes are meaningless and confusing ndash use conventional flow chart symbols
Stages of process are not clear ndash arrange shapes top to bottom with options at each stage branching off to side at same level
Connectors that are either straight or curved would be more consistent
Labels are clear
Text uses consistent font and size
Foundation Computing
Basic Schematic Diagrams 5957docx Page 54
2) The following diagram is an organisation chart for Widget Enterprises
John Smith
MANAGER
Seth Drew
IT MANAGER
May Furur
SECRETARY
Judith Holland
CUSTOMER SERVICES manager
Jad Ling
HELPDESK
Harry Petal
FINANCIAL MANAGER
Wanda Springer
MARKETING
MANAGER
Bob Smithells
CLEANER
Kelly Inlerl
MARKETING ASSISTANT
Beryl Thin
CUSTOMER SERVICES ASSISTANTValda Rigley
CUSTOMER
SERVICES
ASSISTANT
Levi Quayle
COMPUTER
TECHNICIAN
No clear levels to hierarchy ndash organise so that diagram reads top to bottom and positions at similar level are in same horizontal space
Different sized boxes and borders on some boxes are meaningless ndash need consistent style for similar elements
Connectors cross over each other and boxes overlap ndash arrange space to avoid this
Text size and font is mostly consistent but one typo needs correcting
3) Which of the following computer applications can be used to create schematic diagrams
a) Microsoft Visio
b) Microsoft Paint
c) Microsoft Word
d) All of the above correct
4) Which frequently used shapes does the Microsoft Paint Tool bar contain templates for
Polygon rectangle ovalellipse
Foundation Computing
Basic Schematic Diagrams 5957docx Page 55
5) Where in the Microsoft Paint window would you be able to select the thickness of line that you wanted for a brushstroke
Options area below the Toolbar
6) Identify the purpose and intended audience for a diagram showing a businessrsquos marketing plan
The purpose would be to provide an overview of the businessrsquos marketing strategy Audience could include management and employees of the business especially the Marketing department potential investors shareholders and directors of the business
7) Name two characteristics of well-designed schematic diagrams Any of simple easy for the target audience to understand include all relevant elements or parts of the process clear and logical connections between elements accurate 8) Identify four steps involved in designing schematic diagrams Gather information organise information make connections between elements test your diagram 9) Why is it important to use conventionally accepted and familiar shapes and
symbols in your schematic diagrams So that the diagram will be easily understood by the target audience
Foundation Computing
Basic Schematic Diagrams 5957docx Page 56
References httpwindowsmicrosoftcomen-NZwindows7Getting-started-with-Paint accessed Sat 5th December in Timaru New Zealand httpenwikipediaorgwikiSchematic_diagrams accessed Sat 5th December in Timaru New Zealand httpenwikipediaorgwikiSymbol accessed Sat 5th December in Timaru New Zealand
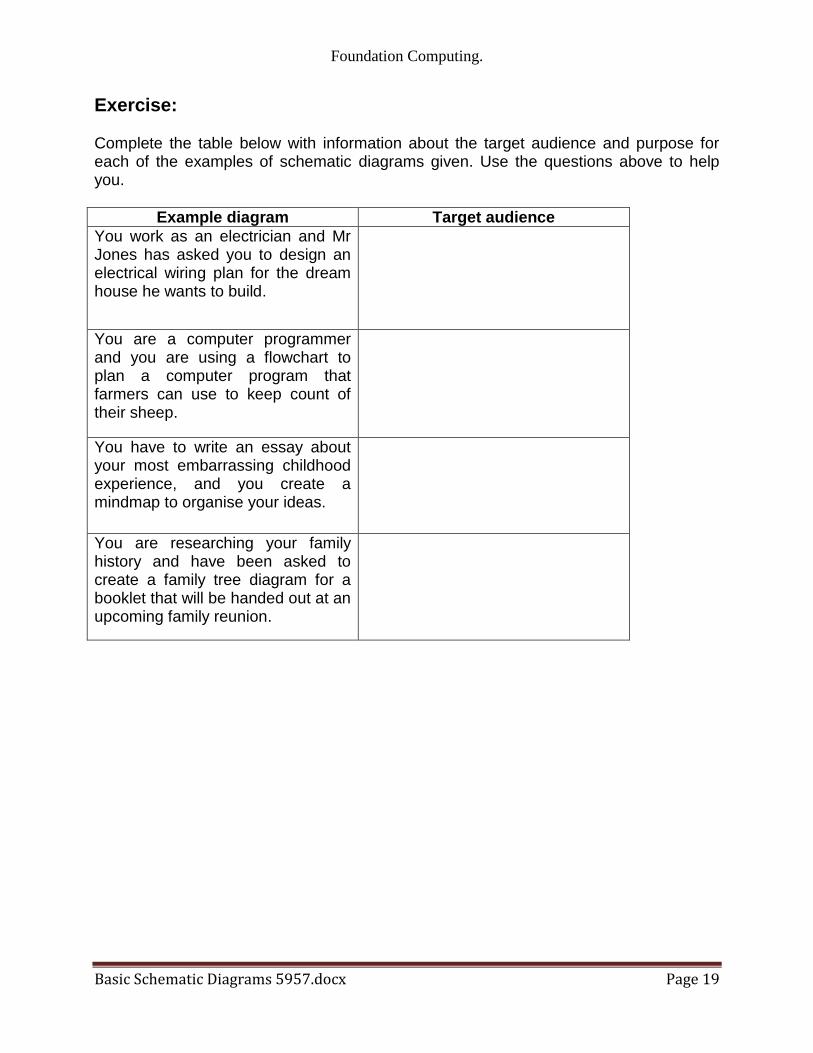
Foundation Computing
Basic Schematic Diagrams 5957docx Page 19
Exercise Complete the table below with information about the target audience and purpose for each of the examples of schematic diagrams given Use the questions above to help you
Example diagram Target audience
You work as an electrician and Mr Jones has asked you to design an electrical wiring plan for the dream house he wants to build
You are a computer programmer and you are using a flowchart to plan a computer program that farmers can use to keep count of their sheep
You have to write an essay about your most embarrassing childhood experience and you create a mindmap to organise your ideas
You are researching your family history and have been asked to create a family tree diagram for a booklet that will be handed out at an upcoming family reunion
Foundation Computing
Basic Schematic Diagrams 5957docx Page 20
Suggested Answer Complete the table below with information about the target audience and purpose for each of the examples of schematic diagrams given Use the questions above to help you
Example diagram Target audience
You work as an electrician and Mr Jones has asked you to design an electrical wiring plan for the dream house he wants to build
Mr Jones his builder local council officials theyrsquoll need detailed information that will be studied in depth and referred to during the planning and building process
You are a computer programmer and you are using a flowchart to plan a computer program that farmers can use to keep count of their sheep
You and other computer programmers will use the flowchart to understand the process of the programme and to identify flaws in its logic
You have to write an essay about your most embarrassing childhood experience and you create a mindmap to organise your ideas
You are the only person who will use your mindmap and you will refer to it as you write your essay
You are researching your family history and have been asked to create a family tree diagram for a booklet that will be handed out at an upcoming family reunion
Members of your family will look for their names and those of relatives in order to see how people are related to each other
Foundation Computing
Basic Schematic Diagrams 5957docx Page 21
TOPIC 2 Identifying the computer application required There are many computer applications that can be used to create schematic diagrams Microsoft Visio is specifically designed for this purpose but any application with basic drawing tools such as those found in Microsoft Word can be used One of the simplest and most widely available computer drawing applications is Microsoft Paint We will use this application is used to demonstrate the tools However most of the tools and principles we will focus on in Microsoft Paint can be found in other drawing applications The following diagram shows the Microsoft Paint window
The tools are arranged to the left of the drawing area in the Tool bar An overview of how to use the tools you need to create a simple schematic diagram is provided below Underneath the Tool bar is the Options box When you click on a tool icon in the Tool bar the options available for that tool appear in the Options box To select an option click on the tool you want to use then click on the option and then click in the drawing area and drag the mouse pointer to draw The Colour palette is underneath the drawing area To use a colour click on the tool you want to use then click on the colour and then click in the drawing area ndash the shape line or text you create will appear in the colour you have selected
Foundation Computing
Basic Schematic Diagrams 5957docx Page 22
Tools Selection Tools Use the selection tools to select the parts of your schematic diagram that you want to work with or change in some way To use these tools click on the button of the tool you want and then click on your diagram and drag until the area you want to work with is selected The Freeform Select tool (on the left) is used to select an irregularly shaped area The Rectangle Select tool is used to select a rectangular area To copy a part of your diagram eg a shape line or text it must first be selected using a selection tool Select Copy from the Edit menu click where you want the copy to be positioned and select Paste from the Edit menu Shapes tools
The shapes tools which can be used to create symbols in schematic diagrams consist of the Rectangle tool for creating squares or rectangles the Polygon tool for creating multi-sided shapes the Rounded Rectangle tool for creating rounded rectangles and the Oval tool for creating circles or ovals These tools provide templates for creating frequently used symbols To use them simply click on the icon of the shape you want to use and drag it onto your diagram where you can resize it if necessary and add text or
Foundation Computing
Basic Schematic Diagrams 5957docx Page 23
effects For the Polygon tool click and drag to draw the first side and click each time you want to change direction Double-click when you have finished To create a perfect circle hold down the Shift key while you are dragging the mouse pointer
Line tools In schematic diagrams line tools can be used to draw connectors between symbols and to draw shapes or symbols
The Straight Line tool creates straight lines simply click on the Straight Line icon click in your picture where you want the line to start and drag to where you want the line to finish The Curve tool will create a curve with at least one and no more than two bends in it click on the Curve icon then click in your picture to draw a straight line and drag to where you want the first bend to be click again where you want the second curve to be and drag to shape the curve You can make more complex shapes by joining lines and curves together
The Pencil tool can be used to draw freeform shapes or lines with as many bends and curves as you want Click on the icon click in your diagram and ldquodrawrdquo with your mouse pointer To draw straight lines hold down the shift key as you are drawing with the mouse
Foundation Computing
Basic Schematic Diagrams 5957docx Page 24
The Paint Brush tool draws freeform lines in the same way as the Pencil tool but can be used to create lines of varying widths and styles To select a paintbrush style click on the Paint Brush icon and then click in the Options box on the style you want to use
The Airbrush tool creates lines with an airbrushed effect of clustered dots It can be used in the same way as the pencil tool to draw freeform shapes or symbols In the Options box you can choose the size of the area covered by the Airbrush tool
Text tool
Add text to your schematic diagram by clicking on the Text icon and clicking in your diagram where you want the text to appear As you drag a rectangle will be formed within which text can be typed The Fonts dialogue box will also open
Foundation Computing
Basic Schematic Diagrams 5957docx Page 25
Fill Tool
The Fill tool will add colour to a shape that you have drawn Click on the icon click on a colour from the colour palette and then click on the shape in the diagram that you want to fill with colour
Zoom tool
Use the Zoom tool to magnify a section of the diagram that you are working with Click on the magnifying glass icon select the size you want in the Options box and click on the part of the image you want to enlarge As the picture zooms in the cursor will change back to the tool you were using before
Adding colour
The Colour box to the left of the Colour palette shows the foreground and background colours you are using If you click on a tool and then drag while holding down the left mouse button the line or shape will be drawn using the foreground colour If you hold down the right mouse button the background colour will be used To use any other colour click on the tool you want to use click on an option (if using) then click on the colour you want from the colour palette As you draw the colour you have clicked on will be used
Foundation Computing
Basic Schematic Diagrams 5957docx Page 26
Additional resources For more detailed information about these tools refer to the Help menu in Microsoft Paint (httpwindowshelpmicrosoftcom )
The following online tutorials may also be useful
httplkwdplorgclassesMSPaintpainthtml
httpwwwlesleyedufacultyahuntMSPttutrhtm
Exercise The example below shows a simple organisation chart produced using Microsoft Paint In the space that follows identify which tools were used to create this schematic diagram and what each tool was used for
Rectangle tool used to create Manager symbol
Oval tool used to create Team Leader symbols
Rounded Rectangle tool used for Team member symbols
Straight line tool used to create connectors
Text tool used to add text to shapes
Rectangle Select tool used to select shapes to move into
position
Foundation Computing
Basic Schematic Diagrams 5957docx Page 27
Suggested Answer The example below shows a simple organisation chart produced using Microsoft Paint In the space that follows identify which tools were used to create this schematic diagram and what each tool was used for
Rectangle tool used to create Manager symbol
Oval tool used to create Team Leader symbols
Rounded Rectangle tool used for Team member symbols
Straight line tool used to create connectors
Text tool used to add text to shapes
Rectangle Select tool used to select shapes to move into position
Foundation Computing
Basic Schematic Diagrams 5957docx Page 28
Exercise Which tools would you use to produce the following symbols or diagrams and why
Symbol Tools and justification
Resistor (Electrical circuit diagram)
Speaker (Electrical circuit diagram)
AC
AC source (Electrical circuit diagram)
Start or end of process (Flowchart)
Decision (yes or no) (Flowchart)
Instructions or actions (Flowchart)
Foundation Computing
Basic Schematic Diagrams 5957docx Page 29
Symbol Tools and justification
Document produced (Flowchart)
Data entered or received (Flowchart)
Foundation Computing
Basic Schematic Diagrams 5957docx Page 30
Suggested Answers Which tools would you use to produce the following symbols or diagrams and why
Symbol Tools and justification
Resistor (Electrical circuit diagram)
Straight line tool (hold down shift key)It creates regular 45 degree angled lines that are perfectly straight
Speaker (Electrical circuit diagram)
Polygon tool (hold down shift key) Rectangle tool and Straight line tool These are used in order to create a symbol with uniform angles and straight edges
AC
AC source (Electrical circuit diagram)
Oval tool (hold down shift key) to draw circle Curve tool to draw wavy line Straight line tool and Text tool These tools produce cleaner shapes than drawing freeform
Start or end of process (Flowchart)
Rounded rectangle tool This provides a template for creating this symbol
Decision (yes or no) (Flowchart)
Polygon tool This creates more accurate joins between sides than the Straight line tool
Instructions or actions (Flowchart)
Rectangle tool It provides a template for drawing this shape
Foundation Computing
Basic Schematic Diagrams 5957docx Page 31
Symbol Tools and justification
Document produced (Flowchart)
Line tool and Curve tool ndash need two tools in MSPaint other applications may have a template for this shape
Data entered or received (Flowchart)
Polygon tool ndash better than Straight line tool because can produce more regular shape
Foundation Computing
Basic Schematic Diagrams 5957docx Page 32
TOPIC 3 Getting started with MS Paint Sourced from httpwindowsmicrosoftcomen-NZwindows7Getting-started-with-Paint MS Paint is a feature in Windows that you can use to draw colour and edit pictures You can use Paint like a digital sketchpad to make simple pictures creative projects or to add text and designs to other pictures such as those taken with your digital camera The parts of Paint Open Paint by clicking the Start button clicking All Programs clicking Accessories and then clicking Paint When you start Paint youll see an empty window drawing and painting tools are located in the ribbon at the top of the window The following illustration shows the different parts of the Paint window
The Paint window
Foundation Computing
Basic Schematic Diagrams 5957docx Page 33
Working with tools The ribbon in Paint includes a handy collection of drawing tools You can use these tools to create freehand drawings and add a variety of shapes to your pictures This section describes some common tasks For more detailed information on how to use the different tools in Paint see Using Paint Draw a line Some tools and shapes such as the Pencil Brush Line and Curve let you make a variety of straight curved and squiggly lines What you draw is determined by how you move the mouse as you draw You can use the Line to draw a straight line for example
1) On the Home tab in the Shapes group click the Line 2) In the Colors group click Color 1 and then click the color you want to use 3) To draw drag the pointer across the drawing area
Draw a squiggly line Your drawings dont have to be composed of only straight lines The Pencil and Brushes can be used to make completely random free-form shapes
1) On the Home tab in the Tools group click the Pencil tool 2) In the Colors group click Color 1 and then click the color you want to use 3) To draw drag the pointer across the drawing area and make a squiggly line
Note If you want to make a line that has a different appearance use one of the Brushes instead Draw a shape Paint lets you draw many different shapes For example you can draw ready-made defined shapes such as rectangles circles squares triangles and arrows (to name a
few) You can also make your own custom shape by using the Polygon shape to draw a polygon which is a shape that can have any number of sides
1) On the Home tab in the Shapes group click a ready-made shape such as the
Rectangle 2) To add a ready-made shape drag the pointer across the drawing area to make
the shape 3) To change the outline style in the Shapes group click Outline and then click an
outline style 4) If you dont want your shape to have an outline click No outline 5) In the Colors group click Color 1 and then click a color for the outline 6) In the Colors group click Color 2 and then click a color to use to fill the shape 7) To change the fill style in the Shapes group click Fill and then click a fill style 8) If you dont want your shape to be filled click No fill
Foundation Computing
Basic Schematic Diagrams 5957docx Page 34
Add text You can also add text to your picture The Text tool lets you add a simple message or title
1) On the Home tab in the Tools group click the Text tool 2) Drag the pointer in the drawing area where you want to add text 3) Under Text Tools on the Text tab click the font face size and style in the Font
group The Font group
4) In the Colors group click Color 1 and then click a color This is the text color 5) Type the text that you want to add
Erase part of your picture If you make a mistake or need to change part of a picture use the eraser By default the eraser changes any area you erase to white but you can change the eraser color For example if you set the background color to yellow anything you erase turns to yellow
1) On the Home tab in the Tools group click the Eraser tool 2) In the Colors group click Color 2 and then click the color that you want to erase
with If you want to erase with white you dont have to select a color 3) Drag the pointer over the area you want to erase
Saving a picture Save your picture frequently so you dont accidentally lose your work To save click the
Paint button and then click Save This saves all of the changes made to the picture since the last time you saved The very first time that you save a new picture you will need to give your picture a file name Follow these steps
1) Click the Paint button and then click Save 2) In the Save as type box select the file format you want 3) In the File name box type a name and then click Save
Foundation Computing
Basic Schematic Diagrams 5957docx Page 35
Topic 4 Designing your diagram Although there are many different types of schematic diagrams the basic process and principles involved in designing a clear and coherent diagram are similar The principles apply to designing an electrical circuit diagram an organisation chart a mind map a flow chart and many other diagrams Some of these principles are also worth applying to other disciplines such as designing a Web page Letrsquos work step-by-step through the process of creating a flow chart to help people make money selling things on an on-line auction site such as wwwtrademeconz or wwwebaycom
Step 1 Gather your information Start by brainstorming all the information you need to include in your diagram Write down everything you think might be important or should be included
trademe
choose things that
sell
good photograph
feedback
keep track
prompt answers
postage
auction length
similar listings
postal system
setting reserve
describing item
correct category
re-listing
fixed offers
Look at the information you have gathered and think about your target audience Highlight the information that is most important to your target audience Cross out any irrelevant information Put question marks next to information that you are unsure about or may be able to leave out
Foundation Computing
Basic Schematic Diagrams 5957docx Page 36
Step 2 Organise your information Take the information that you have left and sort through it How you organise your information will depend on the type of diagram you are designing For example an organisationrsquos chart usually has different levels and shows who its members report to so you might group people by department and by level A flow chart like the example wersquore creating usually shows a process Information is grouped in the order we would use it If any other steps or information occurs to you as you are organising your information add them in Herersquos an example of how the key steps involved in selling on trademe could be ordered
Choose items that sell
Look at similar listings
Decide on a reserve price
Take a clear photograph
Identify your target audience
Write a clear description
Upload your item
Choose the correct category
Monitor watchers bids and views
Lower your reserve
Fixed price offers
Relist
Step 3 Make connections Once the elements are grouped or arranged in a logical order a clearer picture of the process or system you are representing in your diagram should start to emerge However unlike a list which usually reads from top to bottom only a diagram can show connections in many different directions and working out the links between elements is an essential part of designing a coherent diagram At this stage of the design process it is helpful to sketch out a basic plan of the elements you want to include and the flow-lines or connections between them In order to work out the connections between the elements ask questions such as What happens ifhellip What do I do beforeafter this What decisions need to be made now What actions need to be taken Use arrows to show connections between elements group elements that are part of the same stage or level of the process next to or near to each other and use shapes to show which elements are similar to each other eg diamonds for decisions rectangles for instructions or actions Make up your own meanings for shapes if necessary but be sure to use them consistently
Foundation Computing
Basic Schematic Diagrams 5957docx Page 37
The flow chart below shows how our list of elements above changes and gets re-ordered as we ask these questions and organise the information into a logical and coherent diagram
Decide on your
reserve price
START
Relist
Take a photo that is
clear and item looks
good
Decide on your
ideal buyer
Write a description
of your item
highlighting its
benefits for your
buyer
Upload your item in
a category your
buyer is likely to be
looking in
Monitor how many
views watchers and
bids your item gets
Lower your reserve
Item meets reserve
and sellsItem doesnrsquot sell
Offer to watchers for
your reserve
Decide what you
want to sell
Check what similar
items are currently
selling for
Lots of views but
no watchers
No interestFINISH
Foundation Computing
Basic Schematic Diagrams 5957docx Page 38
Step 4 Test your diagram The final step in designing your diagram is checking that it is as effective as possible To do this you should work through each stage step by step challenging it as you go Picture the process in your mind as you follow the links checking that you have included all the actions and decisions required that they are in the correct order and that no steps are duplicated Once yoursquore confident that the diagram is correct look at it again critically to see if you can improve it or clarify it Is there anywhere you can simplify it by removing unnecessary steps Is there anywhere that seems vague and would be easier to understand if you added a step or a connector Now imagine that you are a member of your target audience For a moment try to forget everything you know about the system or process you have designed a diagram for except for what your target audience knows Look at the diagram with fresh eyes does it make sense to you now Does anything seem odd confusing or out of place Finally look at the layout of your diagram Is it easy to read and follow Have you used shapes texts and arrows consistently Are your shapes and texts uniform and lined up properly Are your connectors clearly defined or are they criss-crossing all over each other Check the spelling of labels carefully ndash go through letter by letter to make sure all names and technical or unfamiliar terms are correct
Discussion With a partner look critically at our example diagram above Discuss any parts of it that you think could be better and any changes you would make to improve the readability of the flow chart Make note on the flow chart above of any areas that you think could be improved Share your answers with the rest of the class
Foundation Computing
Basic Schematic Diagrams 5957docx Page 39
Self Test 1) Mr Biggles owns Biggles Air Supplies a company that makes aircraft supplies He asks you to create an organisation chart for his company He gives you the following list of all his employees and who they report to
Mr James Biggles Chief Executive Officer
Jane Doep Personal Assistant to CEO
Mrs Monica Stepworth Financial Manager (reports to CEO)
Judith Zantes Accountant (reports to Financial Manager)
Mary Smallville Accountant (reports to Financial Manager)
Janey Poretuna Admin Assistant (reports to Judith Zantes)
Mickey Laluevu IT technician (reports to Financial Manager)
Mr Hank Johnson Operations Manager (reports to CEO)
Frank Hapil Engineering Manager (reports to Operations Manager)
Joe Smither Engineering Supervisor (reports to Engineering Manager)
Howie Fartherton Engineering Technician (reports to Engineering Supervisor)
Ernie Jusef Engineering Technician (reports to Engineering Supervisor)
Rob Luxemburg Apprentice Technician (reports to Ernie Jusef)
Harry Monahan Interiors Manager (reports to Operations Manager)
Barney Jokka Interiors Technician (reports to Interiors Supervisor) Design an organisation chart for Biggles Air Supplies and draw it in the space below
2) Think of a simple process that has at least five steps and involves some form of feedback or choice For example operating a vending machine topping up your mobile phone using EFTPOS checking messages on an answering machine
Design a flow chart to represent your process
Foundation Computing
Basic Schematic Diagrams 5957docx Page 40
Self Test Answers
1) Mr Biggles owns Biggles Air Supplies a company that makes aircraft supplies He asks you to create an organisation chart for his company He gives you the following list of all his employees and who they report to
Mr James Biggles Chief Executive Officer
Jane Doep Personal Assistant to CEO
Mrs Monica Stepworth Financial Manager (reports to CEO)
Judith Zantes Accountant (reports to Financial Manager)
Mary Smallville Accountant (reports to Financial Manager)
Janey Poretuna Admin Assistant (reports to Judith Zantes)
Mickey Laluevu IT technician (reports to Financial Manager)
Mr Hank Johnson Operations Manager (reports to CEO)
Frank Hapil Engineering Manager (reports to Operations Manager)
Joe Smither Engineering Supervisor (reports to Engineering Manager)
Howie Fartherton Engineering Technician (reports to Engineering Supervisor)
Ernie Jusef Engineering Technician (reports to Engineering Supervisor)
Rob Luxemburg Apprentice Technician (reports to Ernie Jusef)
Harry Monahan Interiors Manager (reports to Operations Manager)
Barney Jokka Interiors Technician (reports to Interiors Supervisor) Design an organisation chart for Biggles Air Supplies and draw it in the space below
Mr James Biggles
CEO
Jane Doep
Personal
Assistant
Mrs Monica Stepworth
Financial Manager
Judith Zantes
Accountant
Janey Poretuna
Admin Assistant
Mary Smallville
Accountant
Mickey Laluevu
IT technician
Mr Hank Johnson
Operations Manager
Frank Hapil
Engineering
Manager
Harry Monahan
Interiors Manager
Joe Smither
Engineering
Supervisor
Howie Fartherton
Engineering
Technician
Ernie Jusef
Engineering
Technician
Rob Luxemburg
Apprentice
Technician
Barney Jokka
Interiors
Technician
Foundation Computing
Basic Schematic Diagrams 5957docx Page 41
2) Think of a simple process that has at least five steps and involves some form of feedback or choice For example operating a vending machine topping up your mobile phone using EFTPOS checking messages on an answering machine
Design a flow chart to represent your process
Dial 06345
Enter your dialing code and
phone number followed by
the key
Dial number for
service you require
Listen to saved messagesListen to new messages
Dial number for
service you require
Save message Delete message
START
FINISH
Dial 2
Dial 1
Dial 1
Dial 2
Dial 1
Dial 2
Foundation Computing
Basic Schematic Diagrams 5957docx Page 42
Foundation Computing
Basic Schematic Diagrams 5957docx Page 43
Part 2
Produce schematic diagrams from a given brief using a computer application
OBJECTIVES
On successful completion of this section you will be able to Produce schematic diagrams from a given brief using a computer application
Performance criteria
21 The symbols used in each diagram are consistent with the type of diagram and the specifications of the brief
22 The final diagram is readable clearly illustrates the object being diagrammed
and is consistent with the specifications of the brief
TOPICS
Topic 1 Symbols used are consistent with diagram type and specifications Topic 2 Diagram is clear readable and consistent with specifications
Self Test
Self Test Answers
Foundation Computing
Basic Schematic Diagrams 5957docx Page 44
TOPIC 1 Symbols used are consistent with diagram type and specifications A symbol is something such as an object picture written word sound or particular mark that represents something else by association resemblance or convention For example a red octagon may be a symbol for STOP On maps crossed sabres may indicate a battlefield Numerals are symbols for numbers All language consists of symbols The word cat is not a cat but is an arbitrary symbol representing the idea of a cat There are many symbols for many things Examples range from Peace Pipe Red Cross to Electrical symbols It is good when doing schematic drawings to use symbols that are clearly recognised and interpreted Symbols that have been internationally standardised are the best Circuit diagram symbols have differed from country to country and have changed over time They are now to a large extent internationally standardized Simple components often had symbols intended to represent some feature of the physical construction of the device There are several national and international standards for graphical symbols in circuit diagrams in particular
IEC 60617 (also known as British Standard BS 3939)
ANSI standard Y32 (also known as IEEE Std 315) IEC 60617 originally consisted of 13 parts from resistors and capacitors to logic symbols and even a generalised drawing standard of connections and bus line widths It is now published as a subscription online database IEC 60617-DB Different symbols may be used depending on the discipline using the drawing for example lighting and power symbols used as part of architectural drawings may be different from symbols for devices used in electronics Different electronic components have different characteristics it is necessary to distinguish between them in any circuit diagram Of course we could use the block diagram approach and just identify each component with words Unfortunately this takes up a lot of space and makes the overall diagram harder to recognize or understand quickly We need a way to understand electrical diagrams far more quickly and easily
Foundation Computing
Basic Schematic Diagrams 5957docx Page 45
The answer is to use schematic symbols to represent electronic components as shown in the diagram below In this diagram we show the schematic symbol of a battery as the electrical source and the symbol of a resistor as the load Even without the words and arrows the symbols define exactly what this circuit is and how it behaves
Some good procedures to follow with symbols include
Using templates for frequently used symbols
Use symbols consistently
Use a library of symbols such as from IEC 60617-DB
Foundation Computing
Basic Schematic Diagrams 5957docx Page 46
TOPIC 2 Diagram is clear readable and consistent with specifications Creating a simple diagram using MSPaint To start with letrsquos create a simple flow chart representing the stages in designing a schematic diagram There are four stages in this process
1) Gather your information 2) Organise your information 3) Make connections 4) Test your diagram
Our flow chart will consist of four rectangles arranged vertically with downward pointing arrows as connectors A rounded rectangle at the top and at the bottom of the flowchart will indicate START and FINISH respectively Step by step
Open Microsoft Paint
Click on the Rectangle tool then click and drag in the drawing area to draw a rectangle
Repeat this step to draw four boxes in the drawing area OR click on the Select tool and click and drag to select the first rectangle then right-click to copy and paste three more rectangles the same size in the drawing area
Foundation Computing
Basic Schematic Diagrams 5957docx Page 47
Using the Rounded Rectangle tool draw a rounded rectangle at the top and bottom of your flow chart
Foundation Computing
Basic Schematic Diagrams 5957docx Page 48
Use the Line tool to draw arrows between each box In the Options area under the Tool bar you can choose the thickness of line that you want to use Remember too that if you hold down the Shift key on the keyboard while you are drawing a line you can create a 45 degree angle
Use the Text tool to add text to the shapes by clicking on the Text tool clicking and dragging to create a textbox inside your shape then typing your text Check your spelling carefully letter by letter as you go
Foundation Computing
Basic Schematic Diagrams 5957docx Page 49
The basic flowchart created in Microsoft Paint could look something like this
Foundation Computing
Basic Schematic Diagrams 5957docx Page 50
Common problems with diagrams Even well-designed schematic diagrams will be difficult for the target audience to read and understand if symbols are used inconsistently or the layout of the diagram is unfamiliar For example if a flowchart has different shapes used for each element and different types of arrows used randomly it will be more difficult for readers to see the overall direction and meaning of the diagram If the shapes on an organisation chart are different sizes and randomly positioned with no clear levels or hierarchy the diagram will not provide a clear overview of the organisationrsquos structure If an electrical circuit diagram has unfamiliar symbols used for elements such as switches resistors and batteries then it will not make sense to its intended audience
Tips for improving the readability of your schematic diagrams
Use symbols and shapes consistently ie elements that are similar should have the same symbol or shape
Avoid having connectors crossing over each other
Avoid having symbols or shapes overlapping
Use arrows on connectors or flow lines to indicate direction
Use colours text size and font consistently
Diagrams that can be read top-to-bottom and left-to-right are easier to read
In a process diagram have only one connector leading into a symbol but have more coming out where necessary to indicate different directions or decisions
Diagrams for a technical audience such as electrical or computer programming schematics should follow accepted conventions for symbols and layout
Diagrams indicating a hierarchy of positions ideas or stages are clearer if elements belonging to the same level are a similar shape size and position on the page
Keep labels as clear and as brief as possible Carefully check the spelling of all names and labels letter by letter ndash errors in the spelling of names or scientific and technical terms look unprofessional and can be confusing for readers
Foundation Computing
Basic Schematic Diagrams 5957docx Page 51
Self Test Look at the schematic diagrams that follow Make notes under each example of what is wrong with the diagram what is right about the diagram and what could be changed to make it clear and meaningful to its intended audience 1) This flow chart is supposed to show police officers how to get a suspect to confess to a crime
START
Confidently accuse
suspect of crime
Describe a
scenario that
enables suspect
to admit guiltAllow suspect to
voice objections
Invade suspectrsquos
personal space
Suspect becomes
uncomfortable
Suspect
doesnrsquot
deny guilt
Suspect
denies guilt
No reaction
Elicit confession
Rephrase objections as
confessions
FINISH
Foundation Computing
Basic Schematic Diagrams 5957docx Page 52
2) The following diagram is an organisation chart for Widget Enterprises
John Smith
MANAGER
Seth Drew
IT MANAGER
May Furur
SECRETARY
Judith Holland
CUSTOMER SERVICES manager
Jad Ling
HELPDESK
Harry Petal
FINANCIAL MANAGER
Wanda Springer
MARKETING
MANAGER
Bob Smithells
CLEANER
Kelly Inlerl
MARKETING ASSISTANT
Beryl Thin
CUSTOMER SERVICES ASSISTANTValda Rigley
CUSTOMER
SERVICES
ASSISTANT
Levi Quayle
COMPUTER
TECHNICIAN
3) Which of the following computer applications can be used to create schematic diagrams
a) Microsoft Visio
b) Microsoft Paint
c) Microsoft Word
d) All of the above
4) Which frequently used shapes does the Microsoft Paint Tool bar contain templates for
5) Where in the Microsoft Paint window would you be able to select the thickness of line that you wanted for a brushstroke 6) Identify the purpose and intended audience for a diagram showing a businessrsquos marketing plan 7) Name two characteristics of well-designed schematic diagrams 8) Identify four steps involved in designing schematic diagrams 9) Why is it important to use conventionally accepted and familiar shapes and symbols in your schematic diagrams
Foundation Computing
Basic Schematic Diagrams 5957docx Page 53
Self Test Answers 1) This flow chart is supposed to show police officers how to get a suspect to confess to a crime
START
Confidently accuse
suspect of crime
Describe a
scenario that
enables suspect
to admit guiltAllow suspect to
voice objections
Invade suspectrsquos
personal space
Suspect becomes
uncomfortable
Suspect
doesnrsquot
deny guilt
Suspect
denies guilt
No reaction
Elicit confession
Rephrase objections as
confessions
FINISH
Random shapes are meaningless and confusing ndash use conventional flow chart symbols
Stages of process are not clear ndash arrange shapes top to bottom with options at each stage branching off to side at same level
Connectors that are either straight or curved would be more consistent
Labels are clear
Text uses consistent font and size
Foundation Computing
Basic Schematic Diagrams 5957docx Page 54
2) The following diagram is an organisation chart for Widget Enterprises
John Smith
MANAGER
Seth Drew
IT MANAGER
May Furur
SECRETARY
Judith Holland
CUSTOMER SERVICES manager
Jad Ling
HELPDESK
Harry Petal
FINANCIAL MANAGER
Wanda Springer
MARKETING
MANAGER
Bob Smithells
CLEANER
Kelly Inlerl
MARKETING ASSISTANT
Beryl Thin
CUSTOMER SERVICES ASSISTANTValda Rigley
CUSTOMER
SERVICES
ASSISTANT
Levi Quayle
COMPUTER
TECHNICIAN
No clear levels to hierarchy ndash organise so that diagram reads top to bottom and positions at similar level are in same horizontal space
Different sized boxes and borders on some boxes are meaningless ndash need consistent style for similar elements
Connectors cross over each other and boxes overlap ndash arrange space to avoid this
Text size and font is mostly consistent but one typo needs correcting
3) Which of the following computer applications can be used to create schematic diagrams
a) Microsoft Visio
b) Microsoft Paint
c) Microsoft Word
d) All of the above correct
4) Which frequently used shapes does the Microsoft Paint Tool bar contain templates for
Polygon rectangle ovalellipse
Foundation Computing
Basic Schematic Diagrams 5957docx Page 55
5) Where in the Microsoft Paint window would you be able to select the thickness of line that you wanted for a brushstroke
Options area below the Toolbar
6) Identify the purpose and intended audience for a diagram showing a businessrsquos marketing plan
The purpose would be to provide an overview of the businessrsquos marketing strategy Audience could include management and employees of the business especially the Marketing department potential investors shareholders and directors of the business
7) Name two characteristics of well-designed schematic diagrams Any of simple easy for the target audience to understand include all relevant elements or parts of the process clear and logical connections between elements accurate 8) Identify four steps involved in designing schematic diagrams Gather information organise information make connections between elements test your diagram 9) Why is it important to use conventionally accepted and familiar shapes and
symbols in your schematic diagrams So that the diagram will be easily understood by the target audience
Foundation Computing
Basic Schematic Diagrams 5957docx Page 56
References httpwindowsmicrosoftcomen-NZwindows7Getting-started-with-Paint accessed Sat 5th December in Timaru New Zealand httpenwikipediaorgwikiSchematic_diagrams accessed Sat 5th December in Timaru New Zealand httpenwikipediaorgwikiSymbol accessed Sat 5th December in Timaru New Zealand
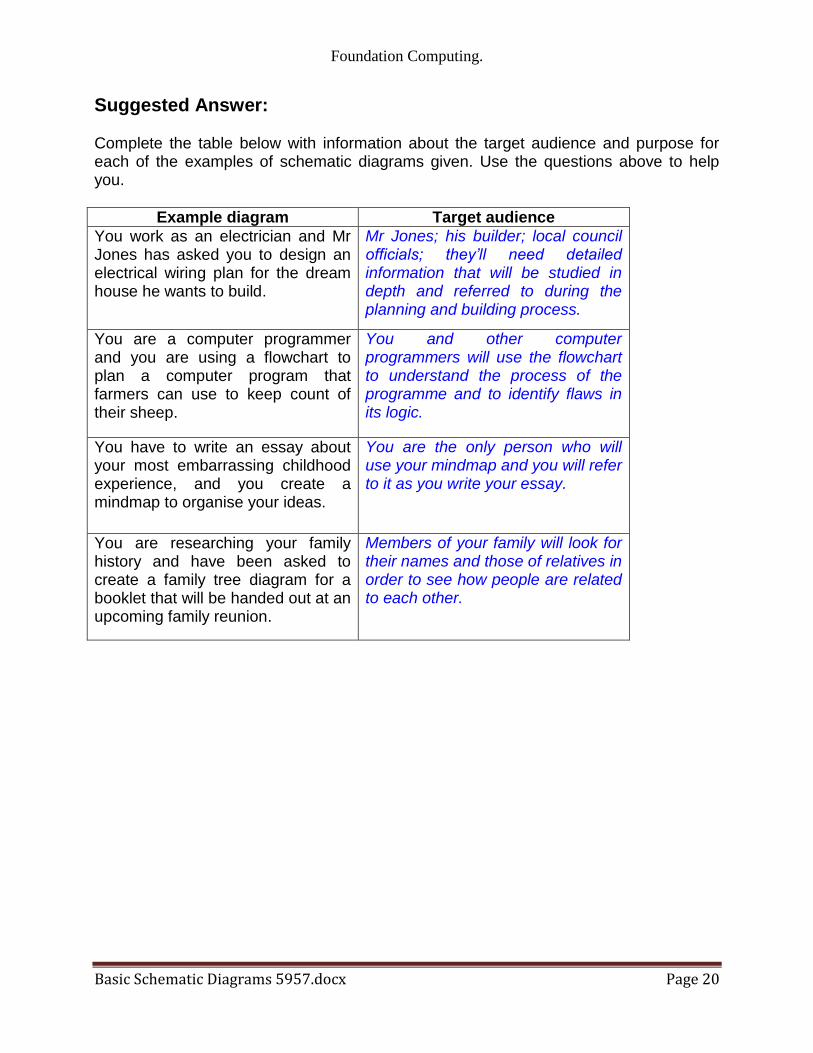
Foundation Computing
Basic Schematic Diagrams 5957docx Page 20
Suggested Answer Complete the table below with information about the target audience and purpose for each of the examples of schematic diagrams given Use the questions above to help you
Example diagram Target audience
You work as an electrician and Mr Jones has asked you to design an electrical wiring plan for the dream house he wants to build
Mr Jones his builder local council officials theyrsquoll need detailed information that will be studied in depth and referred to during the planning and building process
You are a computer programmer and you are using a flowchart to plan a computer program that farmers can use to keep count of their sheep
You and other computer programmers will use the flowchart to understand the process of the programme and to identify flaws in its logic
You have to write an essay about your most embarrassing childhood experience and you create a mindmap to organise your ideas
You are the only person who will use your mindmap and you will refer to it as you write your essay
You are researching your family history and have been asked to create a family tree diagram for a booklet that will be handed out at an upcoming family reunion
Members of your family will look for their names and those of relatives in order to see how people are related to each other
Foundation Computing
Basic Schematic Diagrams 5957docx Page 21
TOPIC 2 Identifying the computer application required There are many computer applications that can be used to create schematic diagrams Microsoft Visio is specifically designed for this purpose but any application with basic drawing tools such as those found in Microsoft Word can be used One of the simplest and most widely available computer drawing applications is Microsoft Paint We will use this application is used to demonstrate the tools However most of the tools and principles we will focus on in Microsoft Paint can be found in other drawing applications The following diagram shows the Microsoft Paint window
The tools are arranged to the left of the drawing area in the Tool bar An overview of how to use the tools you need to create a simple schematic diagram is provided below Underneath the Tool bar is the Options box When you click on a tool icon in the Tool bar the options available for that tool appear in the Options box To select an option click on the tool you want to use then click on the option and then click in the drawing area and drag the mouse pointer to draw The Colour palette is underneath the drawing area To use a colour click on the tool you want to use then click on the colour and then click in the drawing area ndash the shape line or text you create will appear in the colour you have selected
Foundation Computing
Basic Schematic Diagrams 5957docx Page 22
Tools Selection Tools Use the selection tools to select the parts of your schematic diagram that you want to work with or change in some way To use these tools click on the button of the tool you want and then click on your diagram and drag until the area you want to work with is selected The Freeform Select tool (on the left) is used to select an irregularly shaped area The Rectangle Select tool is used to select a rectangular area To copy a part of your diagram eg a shape line or text it must first be selected using a selection tool Select Copy from the Edit menu click where you want the copy to be positioned and select Paste from the Edit menu Shapes tools
The shapes tools which can be used to create symbols in schematic diagrams consist of the Rectangle tool for creating squares or rectangles the Polygon tool for creating multi-sided shapes the Rounded Rectangle tool for creating rounded rectangles and the Oval tool for creating circles or ovals These tools provide templates for creating frequently used symbols To use them simply click on the icon of the shape you want to use and drag it onto your diagram where you can resize it if necessary and add text or
Foundation Computing
Basic Schematic Diagrams 5957docx Page 23
effects For the Polygon tool click and drag to draw the first side and click each time you want to change direction Double-click when you have finished To create a perfect circle hold down the Shift key while you are dragging the mouse pointer
Line tools In schematic diagrams line tools can be used to draw connectors between symbols and to draw shapes or symbols
The Straight Line tool creates straight lines simply click on the Straight Line icon click in your picture where you want the line to start and drag to where you want the line to finish The Curve tool will create a curve with at least one and no more than two bends in it click on the Curve icon then click in your picture to draw a straight line and drag to where you want the first bend to be click again where you want the second curve to be and drag to shape the curve You can make more complex shapes by joining lines and curves together
The Pencil tool can be used to draw freeform shapes or lines with as many bends and curves as you want Click on the icon click in your diagram and ldquodrawrdquo with your mouse pointer To draw straight lines hold down the shift key as you are drawing with the mouse
Foundation Computing
Basic Schematic Diagrams 5957docx Page 24
The Paint Brush tool draws freeform lines in the same way as the Pencil tool but can be used to create lines of varying widths and styles To select a paintbrush style click on the Paint Brush icon and then click in the Options box on the style you want to use
The Airbrush tool creates lines with an airbrushed effect of clustered dots It can be used in the same way as the pencil tool to draw freeform shapes or symbols In the Options box you can choose the size of the area covered by the Airbrush tool
Text tool
Add text to your schematic diagram by clicking on the Text icon and clicking in your diagram where you want the text to appear As you drag a rectangle will be formed within which text can be typed The Fonts dialogue box will also open
Foundation Computing
Basic Schematic Diagrams 5957docx Page 25
Fill Tool
The Fill tool will add colour to a shape that you have drawn Click on the icon click on a colour from the colour palette and then click on the shape in the diagram that you want to fill with colour
Zoom tool
Use the Zoom tool to magnify a section of the diagram that you are working with Click on the magnifying glass icon select the size you want in the Options box and click on the part of the image you want to enlarge As the picture zooms in the cursor will change back to the tool you were using before
Adding colour
The Colour box to the left of the Colour palette shows the foreground and background colours you are using If you click on a tool and then drag while holding down the left mouse button the line or shape will be drawn using the foreground colour If you hold down the right mouse button the background colour will be used To use any other colour click on the tool you want to use click on an option (if using) then click on the colour you want from the colour palette As you draw the colour you have clicked on will be used
Foundation Computing
Basic Schematic Diagrams 5957docx Page 26
Additional resources For more detailed information about these tools refer to the Help menu in Microsoft Paint (httpwindowshelpmicrosoftcom )
The following online tutorials may also be useful
httplkwdplorgclassesMSPaintpainthtml
httpwwwlesleyedufacultyahuntMSPttutrhtm
Exercise The example below shows a simple organisation chart produced using Microsoft Paint In the space that follows identify which tools were used to create this schematic diagram and what each tool was used for
Rectangle tool used to create Manager symbol
Oval tool used to create Team Leader symbols
Rounded Rectangle tool used for Team member symbols
Straight line tool used to create connectors
Text tool used to add text to shapes
Rectangle Select tool used to select shapes to move into
position
Foundation Computing
Basic Schematic Diagrams 5957docx Page 27
Suggested Answer The example below shows a simple organisation chart produced using Microsoft Paint In the space that follows identify which tools were used to create this schematic diagram and what each tool was used for
Rectangle tool used to create Manager symbol
Oval tool used to create Team Leader symbols
Rounded Rectangle tool used for Team member symbols
Straight line tool used to create connectors
Text tool used to add text to shapes
Rectangle Select tool used to select shapes to move into position
Foundation Computing
Basic Schematic Diagrams 5957docx Page 28
Exercise Which tools would you use to produce the following symbols or diagrams and why
Symbol Tools and justification
Resistor (Electrical circuit diagram)
Speaker (Electrical circuit diagram)
AC
AC source (Electrical circuit diagram)
Start or end of process (Flowchart)
Decision (yes or no) (Flowchart)
Instructions or actions (Flowchart)
Foundation Computing
Basic Schematic Diagrams 5957docx Page 29
Symbol Tools and justification
Document produced (Flowchart)
Data entered or received (Flowchart)
Foundation Computing
Basic Schematic Diagrams 5957docx Page 30
Suggested Answers Which tools would you use to produce the following symbols or diagrams and why
Symbol Tools and justification
Resistor (Electrical circuit diagram)
Straight line tool (hold down shift key)It creates regular 45 degree angled lines that are perfectly straight
Speaker (Electrical circuit diagram)
Polygon tool (hold down shift key) Rectangle tool and Straight line tool These are used in order to create a symbol with uniform angles and straight edges
AC
AC source (Electrical circuit diagram)
Oval tool (hold down shift key) to draw circle Curve tool to draw wavy line Straight line tool and Text tool These tools produce cleaner shapes than drawing freeform
Start or end of process (Flowchart)
Rounded rectangle tool This provides a template for creating this symbol
Decision (yes or no) (Flowchart)
Polygon tool This creates more accurate joins between sides than the Straight line tool
Instructions or actions (Flowchart)
Rectangle tool It provides a template for drawing this shape
Foundation Computing
Basic Schematic Diagrams 5957docx Page 31
Symbol Tools and justification
Document produced (Flowchart)
Line tool and Curve tool ndash need two tools in MSPaint other applications may have a template for this shape
Data entered or received (Flowchart)
Polygon tool ndash better than Straight line tool because can produce more regular shape
Foundation Computing
Basic Schematic Diagrams 5957docx Page 32
TOPIC 3 Getting started with MS Paint Sourced from httpwindowsmicrosoftcomen-NZwindows7Getting-started-with-Paint MS Paint is a feature in Windows that you can use to draw colour and edit pictures You can use Paint like a digital sketchpad to make simple pictures creative projects or to add text and designs to other pictures such as those taken with your digital camera The parts of Paint Open Paint by clicking the Start button clicking All Programs clicking Accessories and then clicking Paint When you start Paint youll see an empty window drawing and painting tools are located in the ribbon at the top of the window The following illustration shows the different parts of the Paint window
The Paint window
Foundation Computing
Basic Schematic Diagrams 5957docx Page 33
Working with tools The ribbon in Paint includes a handy collection of drawing tools You can use these tools to create freehand drawings and add a variety of shapes to your pictures This section describes some common tasks For more detailed information on how to use the different tools in Paint see Using Paint Draw a line Some tools and shapes such as the Pencil Brush Line and Curve let you make a variety of straight curved and squiggly lines What you draw is determined by how you move the mouse as you draw You can use the Line to draw a straight line for example
1) On the Home tab in the Shapes group click the Line 2) In the Colors group click Color 1 and then click the color you want to use 3) To draw drag the pointer across the drawing area
Draw a squiggly line Your drawings dont have to be composed of only straight lines The Pencil and Brushes can be used to make completely random free-form shapes
1) On the Home tab in the Tools group click the Pencil tool 2) In the Colors group click Color 1 and then click the color you want to use 3) To draw drag the pointer across the drawing area and make a squiggly line
Note If you want to make a line that has a different appearance use one of the Brushes instead Draw a shape Paint lets you draw many different shapes For example you can draw ready-made defined shapes such as rectangles circles squares triangles and arrows (to name a
few) You can also make your own custom shape by using the Polygon shape to draw a polygon which is a shape that can have any number of sides
1) On the Home tab in the Shapes group click a ready-made shape such as the
Rectangle 2) To add a ready-made shape drag the pointer across the drawing area to make
the shape 3) To change the outline style in the Shapes group click Outline and then click an
outline style 4) If you dont want your shape to have an outline click No outline 5) In the Colors group click Color 1 and then click a color for the outline 6) In the Colors group click Color 2 and then click a color to use to fill the shape 7) To change the fill style in the Shapes group click Fill and then click a fill style 8) If you dont want your shape to be filled click No fill
Foundation Computing
Basic Schematic Diagrams 5957docx Page 34
Add text You can also add text to your picture The Text tool lets you add a simple message or title
1) On the Home tab in the Tools group click the Text tool 2) Drag the pointer in the drawing area where you want to add text 3) Under Text Tools on the Text tab click the font face size and style in the Font
group The Font group
4) In the Colors group click Color 1 and then click a color This is the text color 5) Type the text that you want to add
Erase part of your picture If you make a mistake or need to change part of a picture use the eraser By default the eraser changes any area you erase to white but you can change the eraser color For example if you set the background color to yellow anything you erase turns to yellow
1) On the Home tab in the Tools group click the Eraser tool 2) In the Colors group click Color 2 and then click the color that you want to erase
with If you want to erase with white you dont have to select a color 3) Drag the pointer over the area you want to erase
Saving a picture Save your picture frequently so you dont accidentally lose your work To save click the
Paint button and then click Save This saves all of the changes made to the picture since the last time you saved The very first time that you save a new picture you will need to give your picture a file name Follow these steps
1) Click the Paint button and then click Save 2) In the Save as type box select the file format you want 3) In the File name box type a name and then click Save
Foundation Computing
Basic Schematic Diagrams 5957docx Page 35
Topic 4 Designing your diagram Although there are many different types of schematic diagrams the basic process and principles involved in designing a clear and coherent diagram are similar The principles apply to designing an electrical circuit diagram an organisation chart a mind map a flow chart and many other diagrams Some of these principles are also worth applying to other disciplines such as designing a Web page Letrsquos work step-by-step through the process of creating a flow chart to help people make money selling things on an on-line auction site such as wwwtrademeconz or wwwebaycom
Step 1 Gather your information Start by brainstorming all the information you need to include in your diagram Write down everything you think might be important or should be included
trademe
choose things that
sell
good photograph
feedback
keep track
prompt answers
postage
auction length
similar listings
postal system
setting reserve
describing item
correct category
re-listing
fixed offers
Look at the information you have gathered and think about your target audience Highlight the information that is most important to your target audience Cross out any irrelevant information Put question marks next to information that you are unsure about or may be able to leave out
Foundation Computing
Basic Schematic Diagrams 5957docx Page 36
Step 2 Organise your information Take the information that you have left and sort through it How you organise your information will depend on the type of diagram you are designing For example an organisationrsquos chart usually has different levels and shows who its members report to so you might group people by department and by level A flow chart like the example wersquore creating usually shows a process Information is grouped in the order we would use it If any other steps or information occurs to you as you are organising your information add them in Herersquos an example of how the key steps involved in selling on trademe could be ordered
Choose items that sell
Look at similar listings
Decide on a reserve price
Take a clear photograph
Identify your target audience
Write a clear description
Upload your item
Choose the correct category
Monitor watchers bids and views
Lower your reserve
Fixed price offers
Relist
Step 3 Make connections Once the elements are grouped or arranged in a logical order a clearer picture of the process or system you are representing in your diagram should start to emerge However unlike a list which usually reads from top to bottom only a diagram can show connections in many different directions and working out the links between elements is an essential part of designing a coherent diagram At this stage of the design process it is helpful to sketch out a basic plan of the elements you want to include and the flow-lines or connections between them In order to work out the connections between the elements ask questions such as What happens ifhellip What do I do beforeafter this What decisions need to be made now What actions need to be taken Use arrows to show connections between elements group elements that are part of the same stage or level of the process next to or near to each other and use shapes to show which elements are similar to each other eg diamonds for decisions rectangles for instructions or actions Make up your own meanings for shapes if necessary but be sure to use them consistently
Foundation Computing
Basic Schematic Diagrams 5957docx Page 37
The flow chart below shows how our list of elements above changes and gets re-ordered as we ask these questions and organise the information into a logical and coherent diagram
Decide on your
reserve price
START
Relist
Take a photo that is
clear and item looks
good
Decide on your
ideal buyer
Write a description
of your item
highlighting its
benefits for your
buyer
Upload your item in
a category your
buyer is likely to be
looking in
Monitor how many
views watchers and
bids your item gets
Lower your reserve
Item meets reserve
and sellsItem doesnrsquot sell
Offer to watchers for
your reserve
Decide what you
want to sell
Check what similar
items are currently
selling for
Lots of views but
no watchers
No interestFINISH
Foundation Computing
Basic Schematic Diagrams 5957docx Page 38
Step 4 Test your diagram The final step in designing your diagram is checking that it is as effective as possible To do this you should work through each stage step by step challenging it as you go Picture the process in your mind as you follow the links checking that you have included all the actions and decisions required that they are in the correct order and that no steps are duplicated Once yoursquore confident that the diagram is correct look at it again critically to see if you can improve it or clarify it Is there anywhere you can simplify it by removing unnecessary steps Is there anywhere that seems vague and would be easier to understand if you added a step or a connector Now imagine that you are a member of your target audience For a moment try to forget everything you know about the system or process you have designed a diagram for except for what your target audience knows Look at the diagram with fresh eyes does it make sense to you now Does anything seem odd confusing or out of place Finally look at the layout of your diagram Is it easy to read and follow Have you used shapes texts and arrows consistently Are your shapes and texts uniform and lined up properly Are your connectors clearly defined or are they criss-crossing all over each other Check the spelling of labels carefully ndash go through letter by letter to make sure all names and technical or unfamiliar terms are correct
Discussion With a partner look critically at our example diagram above Discuss any parts of it that you think could be better and any changes you would make to improve the readability of the flow chart Make note on the flow chart above of any areas that you think could be improved Share your answers with the rest of the class
Foundation Computing
Basic Schematic Diagrams 5957docx Page 39
Self Test 1) Mr Biggles owns Biggles Air Supplies a company that makes aircraft supplies He asks you to create an organisation chart for his company He gives you the following list of all his employees and who they report to
Mr James Biggles Chief Executive Officer
Jane Doep Personal Assistant to CEO
Mrs Monica Stepworth Financial Manager (reports to CEO)
Judith Zantes Accountant (reports to Financial Manager)
Mary Smallville Accountant (reports to Financial Manager)
Janey Poretuna Admin Assistant (reports to Judith Zantes)
Mickey Laluevu IT technician (reports to Financial Manager)
Mr Hank Johnson Operations Manager (reports to CEO)
Frank Hapil Engineering Manager (reports to Operations Manager)
Joe Smither Engineering Supervisor (reports to Engineering Manager)
Howie Fartherton Engineering Technician (reports to Engineering Supervisor)
Ernie Jusef Engineering Technician (reports to Engineering Supervisor)
Rob Luxemburg Apprentice Technician (reports to Ernie Jusef)
Harry Monahan Interiors Manager (reports to Operations Manager)
Barney Jokka Interiors Technician (reports to Interiors Supervisor) Design an organisation chart for Biggles Air Supplies and draw it in the space below
2) Think of a simple process that has at least five steps and involves some form of feedback or choice For example operating a vending machine topping up your mobile phone using EFTPOS checking messages on an answering machine
Design a flow chart to represent your process
Foundation Computing
Basic Schematic Diagrams 5957docx Page 40
Self Test Answers
1) Mr Biggles owns Biggles Air Supplies a company that makes aircraft supplies He asks you to create an organisation chart for his company He gives you the following list of all his employees and who they report to
Mr James Biggles Chief Executive Officer
Jane Doep Personal Assistant to CEO
Mrs Monica Stepworth Financial Manager (reports to CEO)
Judith Zantes Accountant (reports to Financial Manager)
Mary Smallville Accountant (reports to Financial Manager)
Janey Poretuna Admin Assistant (reports to Judith Zantes)
Mickey Laluevu IT technician (reports to Financial Manager)
Mr Hank Johnson Operations Manager (reports to CEO)
Frank Hapil Engineering Manager (reports to Operations Manager)
Joe Smither Engineering Supervisor (reports to Engineering Manager)
Howie Fartherton Engineering Technician (reports to Engineering Supervisor)
Ernie Jusef Engineering Technician (reports to Engineering Supervisor)
Rob Luxemburg Apprentice Technician (reports to Ernie Jusef)
Harry Monahan Interiors Manager (reports to Operations Manager)
Barney Jokka Interiors Technician (reports to Interiors Supervisor) Design an organisation chart for Biggles Air Supplies and draw it in the space below
Mr James Biggles
CEO
Jane Doep
Personal
Assistant
Mrs Monica Stepworth
Financial Manager
Judith Zantes
Accountant
Janey Poretuna
Admin Assistant
Mary Smallville
Accountant
Mickey Laluevu
IT technician
Mr Hank Johnson
Operations Manager
Frank Hapil
Engineering
Manager
Harry Monahan
Interiors Manager
Joe Smither
Engineering
Supervisor
Howie Fartherton
Engineering
Technician
Ernie Jusef
Engineering
Technician
Rob Luxemburg
Apprentice
Technician
Barney Jokka
Interiors
Technician
Foundation Computing
Basic Schematic Diagrams 5957docx Page 41
2) Think of a simple process that has at least five steps and involves some form of feedback or choice For example operating a vending machine topping up your mobile phone using EFTPOS checking messages on an answering machine
Design a flow chart to represent your process
Dial 06345
Enter your dialing code and
phone number followed by
the key
Dial number for
service you require
Listen to saved messagesListen to new messages
Dial number for
service you require
Save message Delete message
START
FINISH
Dial 2
Dial 1
Dial 1
Dial 2
Dial 1
Dial 2
Foundation Computing
Basic Schematic Diagrams 5957docx Page 42
Foundation Computing
Basic Schematic Diagrams 5957docx Page 43
Part 2
Produce schematic diagrams from a given brief using a computer application
OBJECTIVES
On successful completion of this section you will be able to Produce schematic diagrams from a given brief using a computer application
Performance criteria
21 The symbols used in each diagram are consistent with the type of diagram and the specifications of the brief
22 The final diagram is readable clearly illustrates the object being diagrammed
and is consistent with the specifications of the brief
TOPICS
Topic 1 Symbols used are consistent with diagram type and specifications Topic 2 Diagram is clear readable and consistent with specifications
Self Test
Self Test Answers
Foundation Computing
Basic Schematic Diagrams 5957docx Page 44
TOPIC 1 Symbols used are consistent with diagram type and specifications A symbol is something such as an object picture written word sound or particular mark that represents something else by association resemblance or convention For example a red octagon may be a symbol for STOP On maps crossed sabres may indicate a battlefield Numerals are symbols for numbers All language consists of symbols The word cat is not a cat but is an arbitrary symbol representing the idea of a cat There are many symbols for many things Examples range from Peace Pipe Red Cross to Electrical symbols It is good when doing schematic drawings to use symbols that are clearly recognised and interpreted Symbols that have been internationally standardised are the best Circuit diagram symbols have differed from country to country and have changed over time They are now to a large extent internationally standardized Simple components often had symbols intended to represent some feature of the physical construction of the device There are several national and international standards for graphical symbols in circuit diagrams in particular
IEC 60617 (also known as British Standard BS 3939)
ANSI standard Y32 (also known as IEEE Std 315) IEC 60617 originally consisted of 13 parts from resistors and capacitors to logic symbols and even a generalised drawing standard of connections and bus line widths It is now published as a subscription online database IEC 60617-DB Different symbols may be used depending on the discipline using the drawing for example lighting and power symbols used as part of architectural drawings may be different from symbols for devices used in electronics Different electronic components have different characteristics it is necessary to distinguish between them in any circuit diagram Of course we could use the block diagram approach and just identify each component with words Unfortunately this takes up a lot of space and makes the overall diagram harder to recognize or understand quickly We need a way to understand electrical diagrams far more quickly and easily
Foundation Computing
Basic Schematic Diagrams 5957docx Page 45
The answer is to use schematic symbols to represent electronic components as shown in the diagram below In this diagram we show the schematic symbol of a battery as the electrical source and the symbol of a resistor as the load Even without the words and arrows the symbols define exactly what this circuit is and how it behaves
Some good procedures to follow with symbols include
Using templates for frequently used symbols
Use symbols consistently
Use a library of symbols such as from IEC 60617-DB
Foundation Computing
Basic Schematic Diagrams 5957docx Page 46
TOPIC 2 Diagram is clear readable and consistent with specifications Creating a simple diagram using MSPaint To start with letrsquos create a simple flow chart representing the stages in designing a schematic diagram There are four stages in this process
1) Gather your information 2) Organise your information 3) Make connections 4) Test your diagram
Our flow chart will consist of four rectangles arranged vertically with downward pointing arrows as connectors A rounded rectangle at the top and at the bottom of the flowchart will indicate START and FINISH respectively Step by step
Open Microsoft Paint
Click on the Rectangle tool then click and drag in the drawing area to draw a rectangle
Repeat this step to draw four boxes in the drawing area OR click on the Select tool and click and drag to select the first rectangle then right-click to copy and paste three more rectangles the same size in the drawing area
Foundation Computing
Basic Schematic Diagrams 5957docx Page 47
Using the Rounded Rectangle tool draw a rounded rectangle at the top and bottom of your flow chart
Foundation Computing
Basic Schematic Diagrams 5957docx Page 48
Use the Line tool to draw arrows between each box In the Options area under the Tool bar you can choose the thickness of line that you want to use Remember too that if you hold down the Shift key on the keyboard while you are drawing a line you can create a 45 degree angle
Use the Text tool to add text to the shapes by clicking on the Text tool clicking and dragging to create a textbox inside your shape then typing your text Check your spelling carefully letter by letter as you go
Foundation Computing
Basic Schematic Diagrams 5957docx Page 49
The basic flowchart created in Microsoft Paint could look something like this
Foundation Computing
Basic Schematic Diagrams 5957docx Page 50
Common problems with diagrams Even well-designed schematic diagrams will be difficult for the target audience to read and understand if symbols are used inconsistently or the layout of the diagram is unfamiliar For example if a flowchart has different shapes used for each element and different types of arrows used randomly it will be more difficult for readers to see the overall direction and meaning of the diagram If the shapes on an organisation chart are different sizes and randomly positioned with no clear levels or hierarchy the diagram will not provide a clear overview of the organisationrsquos structure If an electrical circuit diagram has unfamiliar symbols used for elements such as switches resistors and batteries then it will not make sense to its intended audience
Tips for improving the readability of your schematic diagrams
Use symbols and shapes consistently ie elements that are similar should have the same symbol or shape
Avoid having connectors crossing over each other
Avoid having symbols or shapes overlapping
Use arrows on connectors or flow lines to indicate direction
Use colours text size and font consistently
Diagrams that can be read top-to-bottom and left-to-right are easier to read
In a process diagram have only one connector leading into a symbol but have more coming out where necessary to indicate different directions or decisions
Diagrams for a technical audience such as electrical or computer programming schematics should follow accepted conventions for symbols and layout
Diagrams indicating a hierarchy of positions ideas or stages are clearer if elements belonging to the same level are a similar shape size and position on the page
Keep labels as clear and as brief as possible Carefully check the spelling of all names and labels letter by letter ndash errors in the spelling of names or scientific and technical terms look unprofessional and can be confusing for readers
Foundation Computing
Basic Schematic Diagrams 5957docx Page 51
Self Test Look at the schematic diagrams that follow Make notes under each example of what is wrong with the diagram what is right about the diagram and what could be changed to make it clear and meaningful to its intended audience 1) This flow chart is supposed to show police officers how to get a suspect to confess to a crime
START
Confidently accuse
suspect of crime
Describe a
scenario that
enables suspect
to admit guiltAllow suspect to
voice objections
Invade suspectrsquos
personal space
Suspect becomes
uncomfortable
Suspect
doesnrsquot
deny guilt
Suspect
denies guilt
No reaction
Elicit confession
Rephrase objections as
confessions
FINISH
Foundation Computing
Basic Schematic Diagrams 5957docx Page 52
2) The following diagram is an organisation chart for Widget Enterprises
John Smith
MANAGER
Seth Drew
IT MANAGER
May Furur
SECRETARY
Judith Holland
CUSTOMER SERVICES manager
Jad Ling
HELPDESK
Harry Petal
FINANCIAL MANAGER
Wanda Springer
MARKETING
MANAGER
Bob Smithells
CLEANER
Kelly Inlerl
MARKETING ASSISTANT
Beryl Thin
CUSTOMER SERVICES ASSISTANTValda Rigley
CUSTOMER
SERVICES
ASSISTANT
Levi Quayle
COMPUTER
TECHNICIAN
3) Which of the following computer applications can be used to create schematic diagrams
a) Microsoft Visio
b) Microsoft Paint
c) Microsoft Word
d) All of the above
4) Which frequently used shapes does the Microsoft Paint Tool bar contain templates for
5) Where in the Microsoft Paint window would you be able to select the thickness of line that you wanted for a brushstroke 6) Identify the purpose and intended audience for a diagram showing a businessrsquos marketing plan 7) Name two characteristics of well-designed schematic diagrams 8) Identify four steps involved in designing schematic diagrams 9) Why is it important to use conventionally accepted and familiar shapes and symbols in your schematic diagrams
Foundation Computing
Basic Schematic Diagrams 5957docx Page 53
Self Test Answers 1) This flow chart is supposed to show police officers how to get a suspect to confess to a crime
START
Confidently accuse
suspect of crime
Describe a
scenario that
enables suspect
to admit guiltAllow suspect to
voice objections
Invade suspectrsquos
personal space
Suspect becomes
uncomfortable
Suspect
doesnrsquot
deny guilt
Suspect
denies guilt
No reaction
Elicit confession
Rephrase objections as
confessions
FINISH
Random shapes are meaningless and confusing ndash use conventional flow chart symbols
Stages of process are not clear ndash arrange shapes top to bottom with options at each stage branching off to side at same level
Connectors that are either straight or curved would be more consistent
Labels are clear
Text uses consistent font and size
Foundation Computing
Basic Schematic Diagrams 5957docx Page 54
2) The following diagram is an organisation chart for Widget Enterprises
John Smith
MANAGER
Seth Drew
IT MANAGER
May Furur
SECRETARY
Judith Holland
CUSTOMER SERVICES manager
Jad Ling
HELPDESK
Harry Petal
FINANCIAL MANAGER
Wanda Springer
MARKETING
MANAGER
Bob Smithells
CLEANER
Kelly Inlerl
MARKETING ASSISTANT
Beryl Thin
CUSTOMER SERVICES ASSISTANTValda Rigley
CUSTOMER
SERVICES
ASSISTANT
Levi Quayle
COMPUTER
TECHNICIAN
No clear levels to hierarchy ndash organise so that diagram reads top to bottom and positions at similar level are in same horizontal space
Different sized boxes and borders on some boxes are meaningless ndash need consistent style for similar elements
Connectors cross over each other and boxes overlap ndash arrange space to avoid this
Text size and font is mostly consistent but one typo needs correcting
3) Which of the following computer applications can be used to create schematic diagrams
a) Microsoft Visio
b) Microsoft Paint
c) Microsoft Word
d) All of the above correct
4) Which frequently used shapes does the Microsoft Paint Tool bar contain templates for
Polygon rectangle ovalellipse
Foundation Computing
Basic Schematic Diagrams 5957docx Page 55
5) Where in the Microsoft Paint window would you be able to select the thickness of line that you wanted for a brushstroke
Options area below the Toolbar
6) Identify the purpose and intended audience for a diagram showing a businessrsquos marketing plan
The purpose would be to provide an overview of the businessrsquos marketing strategy Audience could include management and employees of the business especially the Marketing department potential investors shareholders and directors of the business
7) Name two characteristics of well-designed schematic diagrams Any of simple easy for the target audience to understand include all relevant elements or parts of the process clear and logical connections between elements accurate 8) Identify four steps involved in designing schematic diagrams Gather information organise information make connections between elements test your diagram 9) Why is it important to use conventionally accepted and familiar shapes and
symbols in your schematic diagrams So that the diagram will be easily understood by the target audience
Foundation Computing
Basic Schematic Diagrams 5957docx Page 56
References httpwindowsmicrosoftcomen-NZwindows7Getting-started-with-Paint accessed Sat 5th December in Timaru New Zealand httpenwikipediaorgwikiSchematic_diagrams accessed Sat 5th December in Timaru New Zealand httpenwikipediaorgwikiSymbol accessed Sat 5th December in Timaru New Zealand
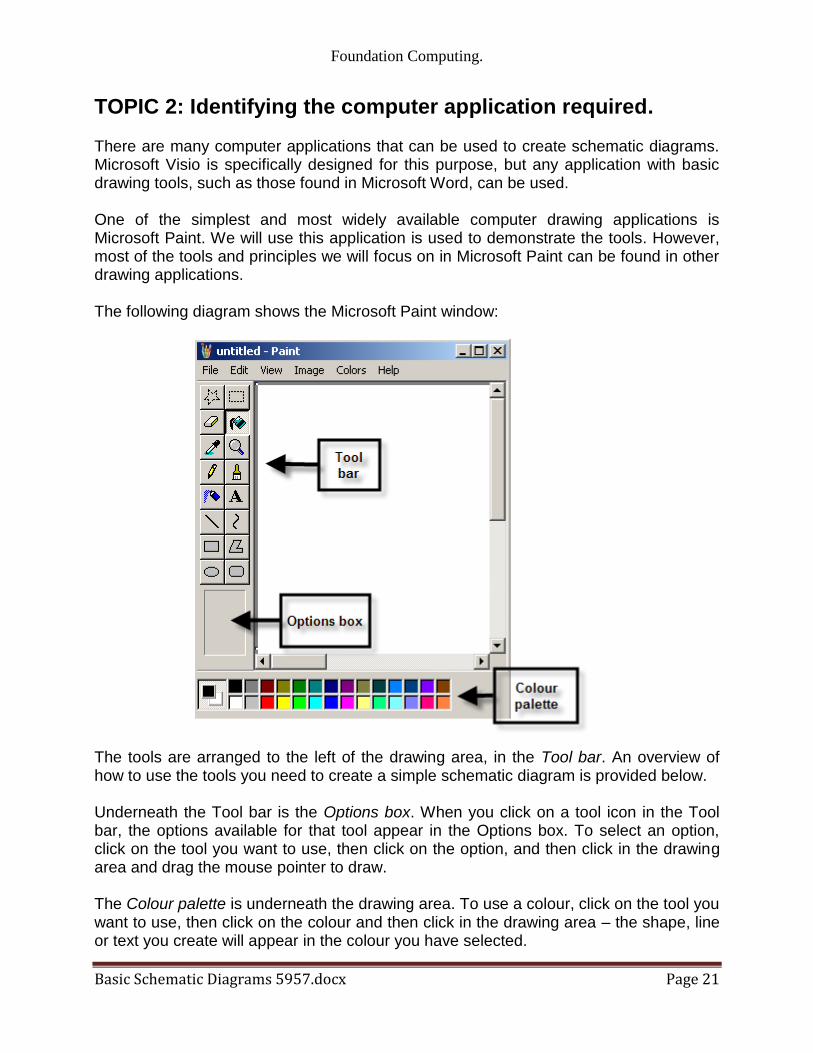
Foundation Computing
Basic Schematic Diagrams 5957docx Page 25
Fill Tool
The Fill tool will add colour to a shape that you have drawn Click on the icon click on a colour from the colour palette and then click on the shape in the diagram that you want to fill with colour
Zoom tool
Use the Zoom tool to magnify a section of the diagram that you are working with Click on the magnifying glass icon select the size you want in the Options box and click on the part of the image you want to enlarge As the picture zooms in the cursor will change back to the tool you were using before
Adding colour
The Colour box to the left of the Colour palette shows the foreground and background colours you are using If you click on a tool and then drag while holding down the left mouse button the line or shape will be drawn using the foreground colour If you hold down the right mouse button the background colour will be used To use any other colour click on the tool you want to use click on an option (if using) then click on the colour you want from the colour palette As you draw the colour you have clicked on will be used
Foundation Computing
Basic Schematic Diagrams 5957docx Page 26
Additional resources For more detailed information about these tools refer to the Help menu in Microsoft Paint (httpwindowshelpmicrosoftcom )
The following online tutorials may also be useful
httplkwdplorgclassesMSPaintpainthtml
httpwwwlesleyedufacultyahuntMSPttutrhtm
Exercise The example below shows a simple organisation chart produced using Microsoft Paint In the space that follows identify which tools were used to create this schematic diagram and what each tool was used for
Rectangle tool used to create Manager symbol
Oval tool used to create Team Leader symbols
Rounded Rectangle tool used for Team member symbols
Straight line tool used to create connectors
Text tool used to add text to shapes
Rectangle Select tool used to select shapes to move into
position
Foundation Computing
Basic Schematic Diagrams 5957docx Page 27
Suggested Answer The example below shows a simple organisation chart produced using Microsoft Paint In the space that follows identify which tools were used to create this schematic diagram and what each tool was used for
Rectangle tool used to create Manager symbol
Oval tool used to create Team Leader symbols
Rounded Rectangle tool used for Team member symbols
Straight line tool used to create connectors
Text tool used to add text to shapes
Rectangle Select tool used to select shapes to move into position
Foundation Computing
Basic Schematic Diagrams 5957docx Page 28
Exercise Which tools would you use to produce the following symbols or diagrams and why
Symbol Tools and justification
Resistor (Electrical circuit diagram)
Speaker (Electrical circuit diagram)
AC
AC source (Electrical circuit diagram)
Start or end of process (Flowchart)
Decision (yes or no) (Flowchart)
Instructions or actions (Flowchart)
Foundation Computing
Basic Schematic Diagrams 5957docx Page 29
Symbol Tools and justification
Document produced (Flowchart)
Data entered or received (Flowchart)
Foundation Computing
Basic Schematic Diagrams 5957docx Page 30
Suggested Answers Which tools would you use to produce the following symbols or diagrams and why
Symbol Tools and justification
Resistor (Electrical circuit diagram)
Straight line tool (hold down shift key)It creates regular 45 degree angled lines that are perfectly straight
Speaker (Electrical circuit diagram)
Polygon tool (hold down shift key) Rectangle tool and Straight line tool These are used in order to create a symbol with uniform angles and straight edges
AC
AC source (Electrical circuit diagram)
Oval tool (hold down shift key) to draw circle Curve tool to draw wavy line Straight line tool and Text tool These tools produce cleaner shapes than drawing freeform
Start or end of process (Flowchart)
Rounded rectangle tool This provides a template for creating this symbol
Decision (yes or no) (Flowchart)
Polygon tool This creates more accurate joins between sides than the Straight line tool
Instructions or actions (Flowchart)
Rectangle tool It provides a template for drawing this shape
Foundation Computing
Basic Schematic Diagrams 5957docx Page 31
Symbol Tools and justification
Document produced (Flowchart)
Line tool and Curve tool ndash need two tools in MSPaint other applications may have a template for this shape
Data entered or received (Flowchart)
Polygon tool ndash better than Straight line tool because can produce more regular shape
Foundation Computing
Basic Schematic Diagrams 5957docx Page 32
TOPIC 3 Getting started with MS Paint Sourced from httpwindowsmicrosoftcomen-NZwindows7Getting-started-with-Paint MS Paint is a feature in Windows that you can use to draw colour and edit pictures You can use Paint like a digital sketchpad to make simple pictures creative projects or to add text and designs to other pictures such as those taken with your digital camera The parts of Paint Open Paint by clicking the Start button clicking All Programs clicking Accessories and then clicking Paint When you start Paint youll see an empty window drawing and painting tools are located in the ribbon at the top of the window The following illustration shows the different parts of the Paint window
The Paint window
Foundation Computing
Basic Schematic Diagrams 5957docx Page 33
Working with tools The ribbon in Paint includes a handy collection of drawing tools You can use these tools to create freehand drawings and add a variety of shapes to your pictures This section describes some common tasks For more detailed information on how to use the different tools in Paint see Using Paint Draw a line Some tools and shapes such as the Pencil Brush Line and Curve let you make a variety of straight curved and squiggly lines What you draw is determined by how you move the mouse as you draw You can use the Line to draw a straight line for example
1) On the Home tab in the Shapes group click the Line 2) In the Colors group click Color 1 and then click the color you want to use 3) To draw drag the pointer across the drawing area
Draw a squiggly line Your drawings dont have to be composed of only straight lines The Pencil and Brushes can be used to make completely random free-form shapes
1) On the Home tab in the Tools group click the Pencil tool 2) In the Colors group click Color 1 and then click the color you want to use 3) To draw drag the pointer across the drawing area and make a squiggly line
Note If you want to make a line that has a different appearance use one of the Brushes instead Draw a shape Paint lets you draw many different shapes For example you can draw ready-made defined shapes such as rectangles circles squares triangles and arrows (to name a
few) You can also make your own custom shape by using the Polygon shape to draw a polygon which is a shape that can have any number of sides
1) On the Home tab in the Shapes group click a ready-made shape such as the
Rectangle 2) To add a ready-made shape drag the pointer across the drawing area to make
the shape 3) To change the outline style in the Shapes group click Outline and then click an
outline style 4) If you dont want your shape to have an outline click No outline 5) In the Colors group click Color 1 and then click a color for the outline 6) In the Colors group click Color 2 and then click a color to use to fill the shape 7) To change the fill style in the Shapes group click Fill and then click a fill style 8) If you dont want your shape to be filled click No fill
Foundation Computing
Basic Schematic Diagrams 5957docx Page 34
Add text You can also add text to your picture The Text tool lets you add a simple message or title
1) On the Home tab in the Tools group click the Text tool 2) Drag the pointer in the drawing area where you want to add text 3) Under Text Tools on the Text tab click the font face size and style in the Font
group The Font group
4) In the Colors group click Color 1 and then click a color This is the text color 5) Type the text that you want to add
Erase part of your picture If you make a mistake or need to change part of a picture use the eraser By default the eraser changes any area you erase to white but you can change the eraser color For example if you set the background color to yellow anything you erase turns to yellow
1) On the Home tab in the Tools group click the Eraser tool 2) In the Colors group click Color 2 and then click the color that you want to erase
with If you want to erase with white you dont have to select a color 3) Drag the pointer over the area you want to erase
Saving a picture Save your picture frequently so you dont accidentally lose your work To save click the
Paint button and then click Save This saves all of the changes made to the picture since the last time you saved The very first time that you save a new picture you will need to give your picture a file name Follow these steps
1) Click the Paint button and then click Save 2) In the Save as type box select the file format you want 3) In the File name box type a name and then click Save
Foundation Computing
Basic Schematic Diagrams 5957docx Page 35
Topic 4 Designing your diagram Although there are many different types of schematic diagrams the basic process and principles involved in designing a clear and coherent diagram are similar The principles apply to designing an electrical circuit diagram an organisation chart a mind map a flow chart and many other diagrams Some of these principles are also worth applying to other disciplines such as designing a Web page Letrsquos work step-by-step through the process of creating a flow chart to help people make money selling things on an on-line auction site such as wwwtrademeconz or wwwebaycom
Step 1 Gather your information Start by brainstorming all the information you need to include in your diagram Write down everything you think might be important or should be included
trademe
choose things that
sell
good photograph
feedback
keep track
prompt answers
postage
auction length
similar listings
postal system
setting reserve
describing item
correct category
re-listing
fixed offers
Look at the information you have gathered and think about your target audience Highlight the information that is most important to your target audience Cross out any irrelevant information Put question marks next to information that you are unsure about or may be able to leave out
Foundation Computing
Basic Schematic Diagrams 5957docx Page 36
Step 2 Organise your information Take the information that you have left and sort through it How you organise your information will depend on the type of diagram you are designing For example an organisationrsquos chart usually has different levels and shows who its members report to so you might group people by department and by level A flow chart like the example wersquore creating usually shows a process Information is grouped in the order we would use it If any other steps or information occurs to you as you are organising your information add them in Herersquos an example of how the key steps involved in selling on trademe could be ordered
Choose items that sell
Look at similar listings
Decide on a reserve price
Take a clear photograph
Identify your target audience
Write a clear description
Upload your item
Choose the correct category
Monitor watchers bids and views
Lower your reserve
Fixed price offers
Relist
Step 3 Make connections Once the elements are grouped or arranged in a logical order a clearer picture of the process or system you are representing in your diagram should start to emerge However unlike a list which usually reads from top to bottom only a diagram can show connections in many different directions and working out the links between elements is an essential part of designing a coherent diagram At this stage of the design process it is helpful to sketch out a basic plan of the elements you want to include and the flow-lines or connections between them In order to work out the connections between the elements ask questions such as What happens ifhellip What do I do beforeafter this What decisions need to be made now What actions need to be taken Use arrows to show connections between elements group elements that are part of the same stage or level of the process next to or near to each other and use shapes to show which elements are similar to each other eg diamonds for decisions rectangles for instructions or actions Make up your own meanings for shapes if necessary but be sure to use them consistently
Foundation Computing
Basic Schematic Diagrams 5957docx Page 37
The flow chart below shows how our list of elements above changes and gets re-ordered as we ask these questions and organise the information into a logical and coherent diagram
Decide on your
reserve price
START
Relist
Take a photo that is
clear and item looks
good
Decide on your
ideal buyer
Write a description
of your item
highlighting its
benefits for your
buyer
Upload your item in
a category your
buyer is likely to be
looking in
Monitor how many
views watchers and
bids your item gets
Lower your reserve
Item meets reserve
and sellsItem doesnrsquot sell
Offer to watchers for
your reserve
Decide what you
want to sell
Check what similar
items are currently
selling for
Lots of views but
no watchers
No interestFINISH
Foundation Computing
Basic Schematic Diagrams 5957docx Page 38
Step 4 Test your diagram The final step in designing your diagram is checking that it is as effective as possible To do this you should work through each stage step by step challenging it as you go Picture the process in your mind as you follow the links checking that you have included all the actions and decisions required that they are in the correct order and that no steps are duplicated Once yoursquore confident that the diagram is correct look at it again critically to see if you can improve it or clarify it Is there anywhere you can simplify it by removing unnecessary steps Is there anywhere that seems vague and would be easier to understand if you added a step or a connector Now imagine that you are a member of your target audience For a moment try to forget everything you know about the system or process you have designed a diagram for except for what your target audience knows Look at the diagram with fresh eyes does it make sense to you now Does anything seem odd confusing or out of place Finally look at the layout of your diagram Is it easy to read and follow Have you used shapes texts and arrows consistently Are your shapes and texts uniform and lined up properly Are your connectors clearly defined or are they criss-crossing all over each other Check the spelling of labels carefully ndash go through letter by letter to make sure all names and technical or unfamiliar terms are correct
Discussion With a partner look critically at our example diagram above Discuss any parts of it that you think could be better and any changes you would make to improve the readability of the flow chart Make note on the flow chart above of any areas that you think could be improved Share your answers with the rest of the class
Foundation Computing
Basic Schematic Diagrams 5957docx Page 39
Self Test 1) Mr Biggles owns Biggles Air Supplies a company that makes aircraft supplies He asks you to create an organisation chart for his company He gives you the following list of all his employees and who they report to
Mr James Biggles Chief Executive Officer
Jane Doep Personal Assistant to CEO
Mrs Monica Stepworth Financial Manager (reports to CEO)
Judith Zantes Accountant (reports to Financial Manager)
Mary Smallville Accountant (reports to Financial Manager)
Janey Poretuna Admin Assistant (reports to Judith Zantes)
Mickey Laluevu IT technician (reports to Financial Manager)
Mr Hank Johnson Operations Manager (reports to CEO)
Frank Hapil Engineering Manager (reports to Operations Manager)
Joe Smither Engineering Supervisor (reports to Engineering Manager)
Howie Fartherton Engineering Technician (reports to Engineering Supervisor)
Ernie Jusef Engineering Technician (reports to Engineering Supervisor)
Rob Luxemburg Apprentice Technician (reports to Ernie Jusef)
Harry Monahan Interiors Manager (reports to Operations Manager)
Barney Jokka Interiors Technician (reports to Interiors Supervisor) Design an organisation chart for Biggles Air Supplies and draw it in the space below
2) Think of a simple process that has at least five steps and involves some form of feedback or choice For example operating a vending machine topping up your mobile phone using EFTPOS checking messages on an answering machine
Design a flow chart to represent your process
Foundation Computing
Basic Schematic Diagrams 5957docx Page 40
Self Test Answers
1) Mr Biggles owns Biggles Air Supplies a company that makes aircraft supplies He asks you to create an organisation chart for his company He gives you the following list of all his employees and who they report to
Mr James Biggles Chief Executive Officer
Jane Doep Personal Assistant to CEO
Mrs Monica Stepworth Financial Manager (reports to CEO)
Judith Zantes Accountant (reports to Financial Manager)
Mary Smallville Accountant (reports to Financial Manager)
Janey Poretuna Admin Assistant (reports to Judith Zantes)
Mickey Laluevu IT technician (reports to Financial Manager)
Mr Hank Johnson Operations Manager (reports to CEO)
Frank Hapil Engineering Manager (reports to Operations Manager)
Joe Smither Engineering Supervisor (reports to Engineering Manager)
Howie Fartherton Engineering Technician (reports to Engineering Supervisor)
Ernie Jusef Engineering Technician (reports to Engineering Supervisor)
Rob Luxemburg Apprentice Technician (reports to Ernie Jusef)
Harry Monahan Interiors Manager (reports to Operations Manager)
Barney Jokka Interiors Technician (reports to Interiors Supervisor) Design an organisation chart for Biggles Air Supplies and draw it in the space below
Mr James Biggles
CEO
Jane Doep
Personal
Assistant
Mrs Monica Stepworth
Financial Manager
Judith Zantes
Accountant
Janey Poretuna
Admin Assistant
Mary Smallville
Accountant
Mickey Laluevu
IT technician
Mr Hank Johnson
Operations Manager
Frank Hapil
Engineering
Manager
Harry Monahan
Interiors Manager
Joe Smither
Engineering
Supervisor
Howie Fartherton
Engineering
Technician
Ernie Jusef
Engineering
Technician
Rob Luxemburg
Apprentice
Technician
Barney Jokka
Interiors
Technician
Foundation Computing
Basic Schematic Diagrams 5957docx Page 41
2) Think of a simple process that has at least five steps and involves some form of feedback or choice For example operating a vending machine topping up your mobile phone using EFTPOS checking messages on an answering machine
Design a flow chart to represent your process
Dial 06345
Enter your dialing code and
phone number followed by
the key
Dial number for
service you require
Listen to saved messagesListen to new messages
Dial number for
service you require
Save message Delete message
START
FINISH
Dial 2
Dial 1
Dial 1
Dial 2
Dial 1
Dial 2
Foundation Computing
Basic Schematic Diagrams 5957docx Page 42
Foundation Computing
Basic Schematic Diagrams 5957docx Page 43
Part 2
Produce schematic diagrams from a given brief using a computer application
OBJECTIVES
On successful completion of this section you will be able to Produce schematic diagrams from a given brief using a computer application
Performance criteria
21 The symbols used in each diagram are consistent with the type of diagram and the specifications of the brief
22 The final diagram is readable clearly illustrates the object being diagrammed
and is consistent with the specifications of the brief
TOPICS
Topic 1 Symbols used are consistent with diagram type and specifications Topic 2 Diagram is clear readable and consistent with specifications
Self Test
Self Test Answers
Foundation Computing
Basic Schematic Diagrams 5957docx Page 44
TOPIC 1 Symbols used are consistent with diagram type and specifications A symbol is something such as an object picture written word sound or particular mark that represents something else by association resemblance or convention For example a red octagon may be a symbol for STOP On maps crossed sabres may indicate a battlefield Numerals are symbols for numbers All language consists of symbols The word cat is not a cat but is an arbitrary symbol representing the idea of a cat There are many symbols for many things Examples range from Peace Pipe Red Cross to Electrical symbols It is good when doing schematic drawings to use symbols that are clearly recognised and interpreted Symbols that have been internationally standardised are the best Circuit diagram symbols have differed from country to country and have changed over time They are now to a large extent internationally standardized Simple components often had symbols intended to represent some feature of the physical construction of the device There are several national and international standards for graphical symbols in circuit diagrams in particular
IEC 60617 (also known as British Standard BS 3939)
ANSI standard Y32 (also known as IEEE Std 315) IEC 60617 originally consisted of 13 parts from resistors and capacitors to logic symbols and even a generalised drawing standard of connections and bus line widths It is now published as a subscription online database IEC 60617-DB Different symbols may be used depending on the discipline using the drawing for example lighting and power symbols used as part of architectural drawings may be different from symbols for devices used in electronics Different electronic components have different characteristics it is necessary to distinguish between them in any circuit diagram Of course we could use the block diagram approach and just identify each component with words Unfortunately this takes up a lot of space and makes the overall diagram harder to recognize or understand quickly We need a way to understand electrical diagrams far more quickly and easily
Foundation Computing
Basic Schematic Diagrams 5957docx Page 45
The answer is to use schematic symbols to represent electronic components as shown in the diagram below In this diagram we show the schematic symbol of a battery as the electrical source and the symbol of a resistor as the load Even without the words and arrows the symbols define exactly what this circuit is and how it behaves
Some good procedures to follow with symbols include
Using templates for frequently used symbols
Use symbols consistently
Use a library of symbols such as from IEC 60617-DB
Foundation Computing
Basic Schematic Diagrams 5957docx Page 46
TOPIC 2 Diagram is clear readable and consistent with specifications Creating a simple diagram using MSPaint To start with letrsquos create a simple flow chart representing the stages in designing a schematic diagram There are four stages in this process
1) Gather your information 2) Organise your information 3) Make connections 4) Test your diagram
Our flow chart will consist of four rectangles arranged vertically with downward pointing arrows as connectors A rounded rectangle at the top and at the bottom of the flowchart will indicate START and FINISH respectively Step by step
Open Microsoft Paint
Click on the Rectangle tool then click and drag in the drawing area to draw a rectangle
Repeat this step to draw four boxes in the drawing area OR click on the Select tool and click and drag to select the first rectangle then right-click to copy and paste three more rectangles the same size in the drawing area
Foundation Computing
Basic Schematic Diagrams 5957docx Page 47
Using the Rounded Rectangle tool draw a rounded rectangle at the top and bottom of your flow chart
Foundation Computing
Basic Schematic Diagrams 5957docx Page 48
Use the Line tool to draw arrows between each box In the Options area under the Tool bar you can choose the thickness of line that you want to use Remember too that if you hold down the Shift key on the keyboard while you are drawing a line you can create a 45 degree angle
Use the Text tool to add text to the shapes by clicking on the Text tool clicking and dragging to create a textbox inside your shape then typing your text Check your spelling carefully letter by letter as you go
Foundation Computing
Basic Schematic Diagrams 5957docx Page 49
The basic flowchart created in Microsoft Paint could look something like this
Foundation Computing
Basic Schematic Diagrams 5957docx Page 50
Common problems with diagrams Even well-designed schematic diagrams will be difficult for the target audience to read and understand if symbols are used inconsistently or the layout of the diagram is unfamiliar For example if a flowchart has different shapes used for each element and different types of arrows used randomly it will be more difficult for readers to see the overall direction and meaning of the diagram If the shapes on an organisation chart are different sizes and randomly positioned with no clear levels or hierarchy the diagram will not provide a clear overview of the organisationrsquos structure If an electrical circuit diagram has unfamiliar symbols used for elements such as switches resistors and batteries then it will not make sense to its intended audience
Tips for improving the readability of your schematic diagrams
Use symbols and shapes consistently ie elements that are similar should have the same symbol or shape
Avoid having connectors crossing over each other
Avoid having symbols or shapes overlapping
Use arrows on connectors or flow lines to indicate direction
Use colours text size and font consistently
Diagrams that can be read top-to-bottom and left-to-right are easier to read
In a process diagram have only one connector leading into a symbol but have more coming out where necessary to indicate different directions or decisions
Diagrams for a technical audience such as electrical or computer programming schematics should follow accepted conventions for symbols and layout
Diagrams indicating a hierarchy of positions ideas or stages are clearer if elements belonging to the same level are a similar shape size and position on the page
Keep labels as clear and as brief as possible Carefully check the spelling of all names and labels letter by letter ndash errors in the spelling of names or scientific and technical terms look unprofessional and can be confusing for readers
Foundation Computing
Basic Schematic Diagrams 5957docx Page 51
Self Test Look at the schematic diagrams that follow Make notes under each example of what is wrong with the diagram what is right about the diagram and what could be changed to make it clear and meaningful to its intended audience 1) This flow chart is supposed to show police officers how to get a suspect to confess to a crime
START
Confidently accuse
suspect of crime
Describe a
scenario that
enables suspect
to admit guiltAllow suspect to
voice objections
Invade suspectrsquos
personal space
Suspect becomes
uncomfortable
Suspect
doesnrsquot
deny guilt
Suspect
denies guilt
No reaction
Elicit confession
Rephrase objections as
confessions
FINISH
Foundation Computing
Basic Schematic Diagrams 5957docx Page 52
2) The following diagram is an organisation chart for Widget Enterprises
John Smith
MANAGER
Seth Drew
IT MANAGER
May Furur
SECRETARY
Judith Holland
CUSTOMER SERVICES manager
Jad Ling
HELPDESK
Harry Petal
FINANCIAL MANAGER
Wanda Springer
MARKETING
MANAGER
Bob Smithells
CLEANER
Kelly Inlerl
MARKETING ASSISTANT
Beryl Thin
CUSTOMER SERVICES ASSISTANTValda Rigley
CUSTOMER
SERVICES
ASSISTANT
Levi Quayle
COMPUTER
TECHNICIAN
3) Which of the following computer applications can be used to create schematic diagrams
a) Microsoft Visio
b) Microsoft Paint
c) Microsoft Word
d) All of the above
4) Which frequently used shapes does the Microsoft Paint Tool bar contain templates for
5) Where in the Microsoft Paint window would you be able to select the thickness of line that you wanted for a brushstroke 6) Identify the purpose and intended audience for a diagram showing a businessrsquos marketing plan 7) Name two characteristics of well-designed schematic diagrams 8) Identify four steps involved in designing schematic diagrams 9) Why is it important to use conventionally accepted and familiar shapes and symbols in your schematic diagrams
Foundation Computing
Basic Schematic Diagrams 5957docx Page 53
Self Test Answers 1) This flow chart is supposed to show police officers how to get a suspect to confess to a crime
START
Confidently accuse
suspect of crime
Describe a
scenario that
enables suspect
to admit guiltAllow suspect to
voice objections
Invade suspectrsquos
personal space
Suspect becomes
uncomfortable
Suspect
doesnrsquot
deny guilt
Suspect
denies guilt
No reaction
Elicit confession
Rephrase objections as
confessions
FINISH
Random shapes are meaningless and confusing ndash use conventional flow chart symbols
Stages of process are not clear ndash arrange shapes top to bottom with options at each stage branching off to side at same level
Connectors that are either straight or curved would be more consistent
Labels are clear
Text uses consistent font and size
Foundation Computing
Basic Schematic Diagrams 5957docx Page 54
2) The following diagram is an organisation chart for Widget Enterprises
John Smith
MANAGER
Seth Drew
IT MANAGER
May Furur
SECRETARY
Judith Holland
CUSTOMER SERVICES manager
Jad Ling
HELPDESK
Harry Petal
FINANCIAL MANAGER
Wanda Springer
MARKETING
MANAGER
Bob Smithells
CLEANER
Kelly Inlerl
MARKETING ASSISTANT
Beryl Thin
CUSTOMER SERVICES ASSISTANTValda Rigley
CUSTOMER
SERVICES
ASSISTANT
Levi Quayle
COMPUTER
TECHNICIAN
No clear levels to hierarchy ndash organise so that diagram reads top to bottom and positions at similar level are in same horizontal space
Different sized boxes and borders on some boxes are meaningless ndash need consistent style for similar elements
Connectors cross over each other and boxes overlap ndash arrange space to avoid this
Text size and font is mostly consistent but one typo needs correcting
3) Which of the following computer applications can be used to create schematic diagrams
a) Microsoft Visio
b) Microsoft Paint
c) Microsoft Word
d) All of the above correct
4) Which frequently used shapes does the Microsoft Paint Tool bar contain templates for
Polygon rectangle ovalellipse
Foundation Computing
Basic Schematic Diagrams 5957docx Page 55
5) Where in the Microsoft Paint window would you be able to select the thickness of line that you wanted for a brushstroke
Options area below the Toolbar
6) Identify the purpose and intended audience for a diagram showing a businessrsquos marketing plan
The purpose would be to provide an overview of the businessrsquos marketing strategy Audience could include management and employees of the business especially the Marketing department potential investors shareholders and directors of the business
7) Name two characteristics of well-designed schematic diagrams Any of simple easy for the target audience to understand include all relevant elements or parts of the process clear and logical connections between elements accurate 8) Identify four steps involved in designing schematic diagrams Gather information organise information make connections between elements test your diagram 9) Why is it important to use conventionally accepted and familiar shapes and
symbols in your schematic diagrams So that the diagram will be easily understood by the target audience
Foundation Computing
Basic Schematic Diagrams 5957docx Page 56
References httpwindowsmicrosoftcomen-NZwindows7Getting-started-with-Paint accessed Sat 5th December in Timaru New Zealand httpenwikipediaorgwikiSchematic_diagrams accessed Sat 5th December in Timaru New Zealand httpenwikipediaorgwikiSymbol accessed Sat 5th December in Timaru New Zealand
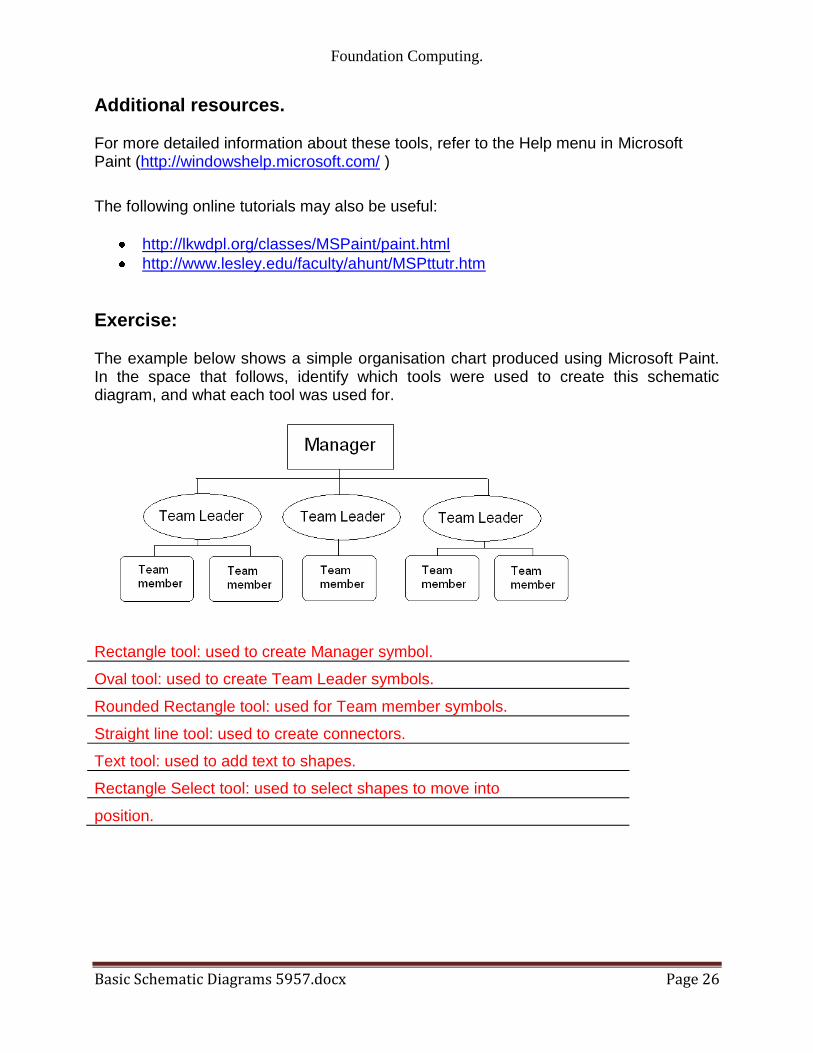
Foundation Computing
Basic Schematic Diagrams 5957docx Page 27
Suggested Answer The example below shows a simple organisation chart produced using Microsoft Paint In the space that follows identify which tools were used to create this schematic diagram and what each tool was used for
Rectangle tool used to create Manager symbol
Oval tool used to create Team Leader symbols
Rounded Rectangle tool used for Team member symbols
Straight line tool used to create connectors
Text tool used to add text to shapes
Rectangle Select tool used to select shapes to move into position
Foundation Computing
Basic Schematic Diagrams 5957docx Page 28
Exercise Which tools would you use to produce the following symbols or diagrams and why
Symbol Tools and justification
Resistor (Electrical circuit diagram)
Speaker (Electrical circuit diagram)
AC
AC source (Electrical circuit diagram)
Start or end of process (Flowchart)
Decision (yes or no) (Flowchart)
Instructions or actions (Flowchart)
Foundation Computing
Basic Schematic Diagrams 5957docx Page 29
Symbol Tools and justification
Document produced (Flowchart)
Data entered or received (Flowchart)
Foundation Computing
Basic Schematic Diagrams 5957docx Page 30
Suggested Answers Which tools would you use to produce the following symbols or diagrams and why
Symbol Tools and justification
Resistor (Electrical circuit diagram)
Straight line tool (hold down shift key)It creates regular 45 degree angled lines that are perfectly straight
Speaker (Electrical circuit diagram)
Polygon tool (hold down shift key) Rectangle tool and Straight line tool These are used in order to create a symbol with uniform angles and straight edges
AC
AC source (Electrical circuit diagram)
Oval tool (hold down shift key) to draw circle Curve tool to draw wavy line Straight line tool and Text tool These tools produce cleaner shapes than drawing freeform
Start or end of process (Flowchart)
Rounded rectangle tool This provides a template for creating this symbol
Decision (yes or no) (Flowchart)
Polygon tool This creates more accurate joins between sides than the Straight line tool
Instructions or actions (Flowchart)
Rectangle tool It provides a template for drawing this shape
Foundation Computing
Basic Schematic Diagrams 5957docx Page 31
Symbol Tools and justification
Document produced (Flowchart)
Line tool and Curve tool ndash need two tools in MSPaint other applications may have a template for this shape
Data entered or received (Flowchart)
Polygon tool ndash better than Straight line tool because can produce more regular shape
Foundation Computing
Basic Schematic Diagrams 5957docx Page 32
TOPIC 3 Getting started with MS Paint Sourced from httpwindowsmicrosoftcomen-NZwindows7Getting-started-with-Paint MS Paint is a feature in Windows that you can use to draw colour and edit pictures You can use Paint like a digital sketchpad to make simple pictures creative projects or to add text and designs to other pictures such as those taken with your digital camera The parts of Paint Open Paint by clicking the Start button clicking All Programs clicking Accessories and then clicking Paint When you start Paint youll see an empty window drawing and painting tools are located in the ribbon at the top of the window The following illustration shows the different parts of the Paint window
The Paint window
Foundation Computing
Basic Schematic Diagrams 5957docx Page 33
Working with tools The ribbon in Paint includes a handy collection of drawing tools You can use these tools to create freehand drawings and add a variety of shapes to your pictures This section describes some common tasks For more detailed information on how to use the different tools in Paint see Using Paint Draw a line Some tools and shapes such as the Pencil Brush Line and Curve let you make a variety of straight curved and squiggly lines What you draw is determined by how you move the mouse as you draw You can use the Line to draw a straight line for example
1) On the Home tab in the Shapes group click the Line 2) In the Colors group click Color 1 and then click the color you want to use 3) To draw drag the pointer across the drawing area
Draw a squiggly line Your drawings dont have to be composed of only straight lines The Pencil and Brushes can be used to make completely random free-form shapes
1) On the Home tab in the Tools group click the Pencil tool 2) In the Colors group click Color 1 and then click the color you want to use 3) To draw drag the pointer across the drawing area and make a squiggly line
Note If you want to make a line that has a different appearance use one of the Brushes instead Draw a shape Paint lets you draw many different shapes For example you can draw ready-made defined shapes such as rectangles circles squares triangles and arrows (to name a
few) You can also make your own custom shape by using the Polygon shape to draw a polygon which is a shape that can have any number of sides
1) On the Home tab in the Shapes group click a ready-made shape such as the
Rectangle 2) To add a ready-made shape drag the pointer across the drawing area to make
the shape 3) To change the outline style in the Shapes group click Outline and then click an
outline style 4) If you dont want your shape to have an outline click No outline 5) In the Colors group click Color 1 and then click a color for the outline 6) In the Colors group click Color 2 and then click a color to use to fill the shape 7) To change the fill style in the Shapes group click Fill and then click a fill style 8) If you dont want your shape to be filled click No fill
Foundation Computing
Basic Schematic Diagrams 5957docx Page 34
Add text You can also add text to your picture The Text tool lets you add a simple message or title
1) On the Home tab in the Tools group click the Text tool 2) Drag the pointer in the drawing area where you want to add text 3) Under Text Tools on the Text tab click the font face size and style in the Font
group The Font group
4) In the Colors group click Color 1 and then click a color This is the text color 5) Type the text that you want to add
Erase part of your picture If you make a mistake or need to change part of a picture use the eraser By default the eraser changes any area you erase to white but you can change the eraser color For example if you set the background color to yellow anything you erase turns to yellow
1) On the Home tab in the Tools group click the Eraser tool 2) In the Colors group click Color 2 and then click the color that you want to erase
with If you want to erase with white you dont have to select a color 3) Drag the pointer over the area you want to erase
Saving a picture Save your picture frequently so you dont accidentally lose your work To save click the
Paint button and then click Save This saves all of the changes made to the picture since the last time you saved The very first time that you save a new picture you will need to give your picture a file name Follow these steps
1) Click the Paint button and then click Save 2) In the Save as type box select the file format you want 3) In the File name box type a name and then click Save
Foundation Computing
Basic Schematic Diagrams 5957docx Page 35
Topic 4 Designing your diagram Although there are many different types of schematic diagrams the basic process and principles involved in designing a clear and coherent diagram are similar The principles apply to designing an electrical circuit diagram an organisation chart a mind map a flow chart and many other diagrams Some of these principles are also worth applying to other disciplines such as designing a Web page Letrsquos work step-by-step through the process of creating a flow chart to help people make money selling things on an on-line auction site such as wwwtrademeconz or wwwebaycom
Step 1 Gather your information Start by brainstorming all the information you need to include in your diagram Write down everything you think might be important or should be included
trademe
choose things that
sell
good photograph
feedback
keep track
prompt answers
postage
auction length
similar listings
postal system
setting reserve
describing item
correct category
re-listing
fixed offers
Look at the information you have gathered and think about your target audience Highlight the information that is most important to your target audience Cross out any irrelevant information Put question marks next to information that you are unsure about or may be able to leave out
Foundation Computing
Basic Schematic Diagrams 5957docx Page 36
Step 2 Organise your information Take the information that you have left and sort through it How you organise your information will depend on the type of diagram you are designing For example an organisationrsquos chart usually has different levels and shows who its members report to so you might group people by department and by level A flow chart like the example wersquore creating usually shows a process Information is grouped in the order we would use it If any other steps or information occurs to you as you are organising your information add them in Herersquos an example of how the key steps involved in selling on trademe could be ordered
Choose items that sell
Look at similar listings
Decide on a reserve price
Take a clear photograph
Identify your target audience
Write a clear description
Upload your item
Choose the correct category
Monitor watchers bids and views
Lower your reserve
Fixed price offers
Relist
Step 3 Make connections Once the elements are grouped or arranged in a logical order a clearer picture of the process or system you are representing in your diagram should start to emerge However unlike a list which usually reads from top to bottom only a diagram can show connections in many different directions and working out the links between elements is an essential part of designing a coherent diagram At this stage of the design process it is helpful to sketch out a basic plan of the elements you want to include and the flow-lines or connections between them In order to work out the connections between the elements ask questions such as What happens ifhellip What do I do beforeafter this What decisions need to be made now What actions need to be taken Use arrows to show connections between elements group elements that are part of the same stage or level of the process next to or near to each other and use shapes to show which elements are similar to each other eg diamonds for decisions rectangles for instructions or actions Make up your own meanings for shapes if necessary but be sure to use them consistently
Foundation Computing
Basic Schematic Diagrams 5957docx Page 37
The flow chart below shows how our list of elements above changes and gets re-ordered as we ask these questions and organise the information into a logical and coherent diagram
Decide on your
reserve price
START
Relist
Take a photo that is
clear and item looks
good
Decide on your
ideal buyer
Write a description
of your item
highlighting its
benefits for your
buyer
Upload your item in
a category your
buyer is likely to be
looking in
Monitor how many
views watchers and
bids your item gets
Lower your reserve
Item meets reserve
and sellsItem doesnrsquot sell
Offer to watchers for
your reserve
Decide what you
want to sell
Check what similar
items are currently
selling for
Lots of views but
no watchers
No interestFINISH
Foundation Computing
Basic Schematic Diagrams 5957docx Page 38
Step 4 Test your diagram The final step in designing your diagram is checking that it is as effective as possible To do this you should work through each stage step by step challenging it as you go Picture the process in your mind as you follow the links checking that you have included all the actions and decisions required that they are in the correct order and that no steps are duplicated Once yoursquore confident that the diagram is correct look at it again critically to see if you can improve it or clarify it Is there anywhere you can simplify it by removing unnecessary steps Is there anywhere that seems vague and would be easier to understand if you added a step or a connector Now imagine that you are a member of your target audience For a moment try to forget everything you know about the system or process you have designed a diagram for except for what your target audience knows Look at the diagram with fresh eyes does it make sense to you now Does anything seem odd confusing or out of place Finally look at the layout of your diagram Is it easy to read and follow Have you used shapes texts and arrows consistently Are your shapes and texts uniform and lined up properly Are your connectors clearly defined or are they criss-crossing all over each other Check the spelling of labels carefully ndash go through letter by letter to make sure all names and technical or unfamiliar terms are correct
Discussion With a partner look critically at our example diagram above Discuss any parts of it that you think could be better and any changes you would make to improve the readability of the flow chart Make note on the flow chart above of any areas that you think could be improved Share your answers with the rest of the class
Foundation Computing
Basic Schematic Diagrams 5957docx Page 39
Self Test 1) Mr Biggles owns Biggles Air Supplies a company that makes aircraft supplies He asks you to create an organisation chart for his company He gives you the following list of all his employees and who they report to
Mr James Biggles Chief Executive Officer
Jane Doep Personal Assistant to CEO
Mrs Monica Stepworth Financial Manager (reports to CEO)
Judith Zantes Accountant (reports to Financial Manager)
Mary Smallville Accountant (reports to Financial Manager)
Janey Poretuna Admin Assistant (reports to Judith Zantes)
Mickey Laluevu IT technician (reports to Financial Manager)
Mr Hank Johnson Operations Manager (reports to CEO)
Frank Hapil Engineering Manager (reports to Operations Manager)
Joe Smither Engineering Supervisor (reports to Engineering Manager)
Howie Fartherton Engineering Technician (reports to Engineering Supervisor)
Ernie Jusef Engineering Technician (reports to Engineering Supervisor)
Rob Luxemburg Apprentice Technician (reports to Ernie Jusef)
Harry Monahan Interiors Manager (reports to Operations Manager)
Barney Jokka Interiors Technician (reports to Interiors Supervisor) Design an organisation chart for Biggles Air Supplies and draw it in the space below
2) Think of a simple process that has at least five steps and involves some form of feedback or choice For example operating a vending machine topping up your mobile phone using EFTPOS checking messages on an answering machine
Design a flow chart to represent your process
Foundation Computing
Basic Schematic Diagrams 5957docx Page 40
Self Test Answers
1) Mr Biggles owns Biggles Air Supplies a company that makes aircraft supplies He asks you to create an organisation chart for his company He gives you the following list of all his employees and who they report to
Mr James Biggles Chief Executive Officer
Jane Doep Personal Assistant to CEO
Mrs Monica Stepworth Financial Manager (reports to CEO)
Judith Zantes Accountant (reports to Financial Manager)
Mary Smallville Accountant (reports to Financial Manager)
Janey Poretuna Admin Assistant (reports to Judith Zantes)
Mickey Laluevu IT technician (reports to Financial Manager)
Mr Hank Johnson Operations Manager (reports to CEO)
Frank Hapil Engineering Manager (reports to Operations Manager)
Joe Smither Engineering Supervisor (reports to Engineering Manager)
Howie Fartherton Engineering Technician (reports to Engineering Supervisor)
Ernie Jusef Engineering Technician (reports to Engineering Supervisor)
Rob Luxemburg Apprentice Technician (reports to Ernie Jusef)
Harry Monahan Interiors Manager (reports to Operations Manager)
Barney Jokka Interiors Technician (reports to Interiors Supervisor) Design an organisation chart for Biggles Air Supplies and draw it in the space below
Mr James Biggles
CEO
Jane Doep
Personal
Assistant
Mrs Monica Stepworth
Financial Manager
Judith Zantes
Accountant
Janey Poretuna
Admin Assistant
Mary Smallville
Accountant
Mickey Laluevu
IT technician
Mr Hank Johnson
Operations Manager
Frank Hapil
Engineering
Manager
Harry Monahan
Interiors Manager
Joe Smither
Engineering
Supervisor
Howie Fartherton
Engineering
Technician
Ernie Jusef
Engineering
Technician
Rob Luxemburg
Apprentice
Technician
Barney Jokka
Interiors
Technician
Foundation Computing
Basic Schematic Diagrams 5957docx Page 41
2) Think of a simple process that has at least five steps and involves some form of feedback or choice For example operating a vending machine topping up your mobile phone using EFTPOS checking messages on an answering machine
Design a flow chart to represent your process
Dial 06345
Enter your dialing code and
phone number followed by
the key
Dial number for
service you require
Listen to saved messagesListen to new messages
Dial number for
service you require
Save message Delete message
START
FINISH
Dial 2
Dial 1
Dial 1
Dial 2
Dial 1
Dial 2
Foundation Computing
Basic Schematic Diagrams 5957docx Page 42
Foundation Computing
Basic Schematic Diagrams 5957docx Page 43
Part 2
Produce schematic diagrams from a given brief using a computer application
OBJECTIVES
On successful completion of this section you will be able to Produce schematic diagrams from a given brief using a computer application
Performance criteria
21 The symbols used in each diagram are consistent with the type of diagram and the specifications of the brief
22 The final diagram is readable clearly illustrates the object being diagrammed
and is consistent with the specifications of the brief
TOPICS
Topic 1 Symbols used are consistent with diagram type and specifications Topic 2 Diagram is clear readable and consistent with specifications
Self Test
Self Test Answers
Foundation Computing
Basic Schematic Diagrams 5957docx Page 44
TOPIC 1 Symbols used are consistent with diagram type and specifications A symbol is something such as an object picture written word sound or particular mark that represents something else by association resemblance or convention For example a red octagon may be a symbol for STOP On maps crossed sabres may indicate a battlefield Numerals are symbols for numbers All language consists of symbols The word cat is not a cat but is an arbitrary symbol representing the idea of a cat There are many symbols for many things Examples range from Peace Pipe Red Cross to Electrical symbols It is good when doing schematic drawings to use symbols that are clearly recognised and interpreted Symbols that have been internationally standardised are the best Circuit diagram symbols have differed from country to country and have changed over time They are now to a large extent internationally standardized Simple components often had symbols intended to represent some feature of the physical construction of the device There are several national and international standards for graphical symbols in circuit diagrams in particular
IEC 60617 (also known as British Standard BS 3939)
ANSI standard Y32 (also known as IEEE Std 315) IEC 60617 originally consisted of 13 parts from resistors and capacitors to logic symbols and even a generalised drawing standard of connections and bus line widths It is now published as a subscription online database IEC 60617-DB Different symbols may be used depending on the discipline using the drawing for example lighting and power symbols used as part of architectural drawings may be different from symbols for devices used in electronics Different electronic components have different characteristics it is necessary to distinguish between them in any circuit diagram Of course we could use the block diagram approach and just identify each component with words Unfortunately this takes up a lot of space and makes the overall diagram harder to recognize or understand quickly We need a way to understand electrical diagrams far more quickly and easily
Foundation Computing
Basic Schematic Diagrams 5957docx Page 45
The answer is to use schematic symbols to represent electronic components as shown in the diagram below In this diagram we show the schematic symbol of a battery as the electrical source and the symbol of a resistor as the load Even without the words and arrows the symbols define exactly what this circuit is and how it behaves
Some good procedures to follow with symbols include
Using templates for frequently used symbols
Use symbols consistently
Use a library of symbols such as from IEC 60617-DB
Foundation Computing
Basic Schematic Diagrams 5957docx Page 46
TOPIC 2 Diagram is clear readable and consistent with specifications Creating a simple diagram using MSPaint To start with letrsquos create a simple flow chart representing the stages in designing a schematic diagram There are four stages in this process
1) Gather your information 2) Organise your information 3) Make connections 4) Test your diagram
Our flow chart will consist of four rectangles arranged vertically with downward pointing arrows as connectors A rounded rectangle at the top and at the bottom of the flowchart will indicate START and FINISH respectively Step by step
Open Microsoft Paint
Click on the Rectangle tool then click and drag in the drawing area to draw a rectangle
Repeat this step to draw four boxes in the drawing area OR click on the Select tool and click and drag to select the first rectangle then right-click to copy and paste three more rectangles the same size in the drawing area
Foundation Computing
Basic Schematic Diagrams 5957docx Page 47
Using the Rounded Rectangle tool draw a rounded rectangle at the top and bottom of your flow chart
Foundation Computing
Basic Schematic Diagrams 5957docx Page 48
Use the Line tool to draw arrows between each box In the Options area under the Tool bar you can choose the thickness of line that you want to use Remember too that if you hold down the Shift key on the keyboard while you are drawing a line you can create a 45 degree angle
Use the Text tool to add text to the shapes by clicking on the Text tool clicking and dragging to create a textbox inside your shape then typing your text Check your spelling carefully letter by letter as you go
Foundation Computing
Basic Schematic Diagrams 5957docx Page 49
The basic flowchart created in Microsoft Paint could look something like this
Foundation Computing
Basic Schematic Diagrams 5957docx Page 50
Common problems with diagrams Even well-designed schematic diagrams will be difficult for the target audience to read and understand if symbols are used inconsistently or the layout of the diagram is unfamiliar For example if a flowchart has different shapes used for each element and different types of arrows used randomly it will be more difficult for readers to see the overall direction and meaning of the diagram If the shapes on an organisation chart are different sizes and randomly positioned with no clear levels or hierarchy the diagram will not provide a clear overview of the organisationrsquos structure If an electrical circuit diagram has unfamiliar symbols used for elements such as switches resistors and batteries then it will not make sense to its intended audience
Tips for improving the readability of your schematic diagrams
Use symbols and shapes consistently ie elements that are similar should have the same symbol or shape
Avoid having connectors crossing over each other
Avoid having symbols or shapes overlapping
Use arrows on connectors or flow lines to indicate direction
Use colours text size and font consistently
Diagrams that can be read top-to-bottom and left-to-right are easier to read
In a process diagram have only one connector leading into a symbol but have more coming out where necessary to indicate different directions or decisions
Diagrams for a technical audience such as electrical or computer programming schematics should follow accepted conventions for symbols and layout
Diagrams indicating a hierarchy of positions ideas or stages are clearer if elements belonging to the same level are a similar shape size and position on the page
Keep labels as clear and as brief as possible Carefully check the spelling of all names and labels letter by letter ndash errors in the spelling of names or scientific and technical terms look unprofessional and can be confusing for readers
Foundation Computing
Basic Schematic Diagrams 5957docx Page 51
Self Test Look at the schematic diagrams that follow Make notes under each example of what is wrong with the diagram what is right about the diagram and what could be changed to make it clear and meaningful to its intended audience 1) This flow chart is supposed to show police officers how to get a suspect to confess to a crime
START
Confidently accuse
suspect of crime
Describe a
scenario that
enables suspect
to admit guiltAllow suspect to
voice objections
Invade suspectrsquos
personal space
Suspect becomes
uncomfortable
Suspect
doesnrsquot
deny guilt
Suspect
denies guilt
No reaction
Elicit confession
Rephrase objections as
confessions
FINISH
Foundation Computing
Basic Schematic Diagrams 5957docx Page 52
2) The following diagram is an organisation chart for Widget Enterprises
John Smith
MANAGER
Seth Drew
IT MANAGER
May Furur
SECRETARY
Judith Holland
CUSTOMER SERVICES manager
Jad Ling
HELPDESK
Harry Petal
FINANCIAL MANAGER
Wanda Springer
MARKETING
MANAGER
Bob Smithells
CLEANER
Kelly Inlerl
MARKETING ASSISTANT
Beryl Thin
CUSTOMER SERVICES ASSISTANTValda Rigley
CUSTOMER
SERVICES
ASSISTANT
Levi Quayle
COMPUTER
TECHNICIAN
3) Which of the following computer applications can be used to create schematic diagrams
a) Microsoft Visio
b) Microsoft Paint
c) Microsoft Word
d) All of the above
4) Which frequently used shapes does the Microsoft Paint Tool bar contain templates for
5) Where in the Microsoft Paint window would you be able to select the thickness of line that you wanted for a brushstroke 6) Identify the purpose and intended audience for a diagram showing a businessrsquos marketing plan 7) Name two characteristics of well-designed schematic diagrams 8) Identify four steps involved in designing schematic diagrams 9) Why is it important to use conventionally accepted and familiar shapes and symbols in your schematic diagrams
Foundation Computing
Basic Schematic Diagrams 5957docx Page 53
Self Test Answers 1) This flow chart is supposed to show police officers how to get a suspect to confess to a crime
START
Confidently accuse
suspect of crime
Describe a
scenario that
enables suspect
to admit guiltAllow suspect to
voice objections
Invade suspectrsquos
personal space
Suspect becomes
uncomfortable
Suspect
doesnrsquot
deny guilt
Suspect
denies guilt
No reaction
Elicit confession
Rephrase objections as
confessions
FINISH
Random shapes are meaningless and confusing ndash use conventional flow chart symbols
Stages of process are not clear ndash arrange shapes top to bottom with options at each stage branching off to side at same level
Connectors that are either straight or curved would be more consistent
Labels are clear
Text uses consistent font and size
Foundation Computing
Basic Schematic Diagrams 5957docx Page 54
2) The following diagram is an organisation chart for Widget Enterprises
John Smith
MANAGER
Seth Drew
IT MANAGER
May Furur
SECRETARY
Judith Holland
CUSTOMER SERVICES manager
Jad Ling
HELPDESK
Harry Petal
FINANCIAL MANAGER
Wanda Springer
MARKETING
MANAGER
Bob Smithells
CLEANER
Kelly Inlerl
MARKETING ASSISTANT
Beryl Thin
CUSTOMER SERVICES ASSISTANTValda Rigley
CUSTOMER
SERVICES
ASSISTANT
Levi Quayle
COMPUTER
TECHNICIAN
No clear levels to hierarchy ndash organise so that diagram reads top to bottom and positions at similar level are in same horizontal space
Different sized boxes and borders on some boxes are meaningless ndash need consistent style for similar elements
Connectors cross over each other and boxes overlap ndash arrange space to avoid this
Text size and font is mostly consistent but one typo needs correcting
3) Which of the following computer applications can be used to create schematic diagrams
a) Microsoft Visio
b) Microsoft Paint
c) Microsoft Word
d) All of the above correct
4) Which frequently used shapes does the Microsoft Paint Tool bar contain templates for
Polygon rectangle ovalellipse
Foundation Computing
Basic Schematic Diagrams 5957docx Page 55
5) Where in the Microsoft Paint window would you be able to select the thickness of line that you wanted for a brushstroke
Options area below the Toolbar
6) Identify the purpose and intended audience for a diagram showing a businessrsquos marketing plan
The purpose would be to provide an overview of the businessrsquos marketing strategy Audience could include management and employees of the business especially the Marketing department potential investors shareholders and directors of the business
7) Name two characteristics of well-designed schematic diagrams Any of simple easy for the target audience to understand include all relevant elements or parts of the process clear and logical connections between elements accurate 8) Identify four steps involved in designing schematic diagrams Gather information organise information make connections between elements test your diagram 9) Why is it important to use conventionally accepted and familiar shapes and
symbols in your schematic diagrams So that the diagram will be easily understood by the target audience
Foundation Computing
Basic Schematic Diagrams 5957docx Page 56
References httpwindowsmicrosoftcomen-NZwindows7Getting-started-with-Paint accessed Sat 5th December in Timaru New Zealand httpenwikipediaorgwikiSchematic_diagrams accessed Sat 5th December in Timaru New Zealand httpenwikipediaorgwikiSymbol accessed Sat 5th December in Timaru New Zealand
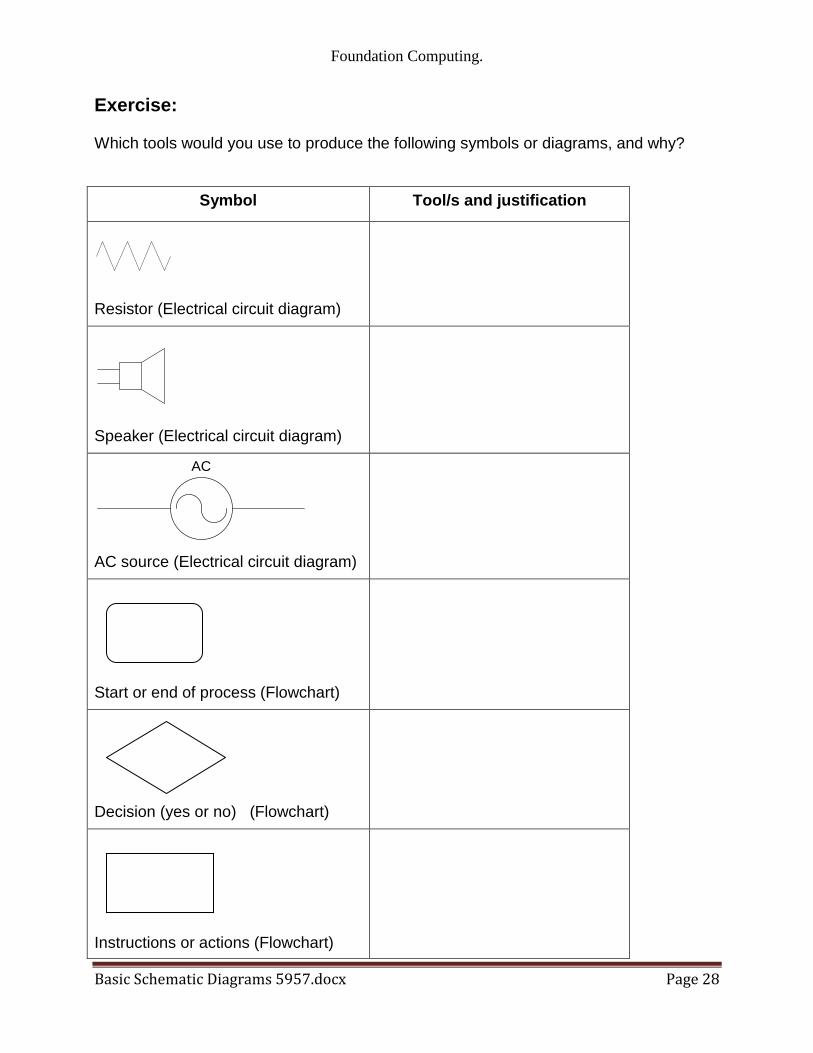
Foundation Computing
Basic Schematic Diagrams 5957docx Page 28
Exercise Which tools would you use to produce the following symbols or diagrams and why
Symbol Tools and justification
Resistor (Electrical circuit diagram)
Speaker (Electrical circuit diagram)
AC
AC source (Electrical circuit diagram)
Start or end of process (Flowchart)
Decision (yes or no) (Flowchart)
Instructions or actions (Flowchart)
Foundation Computing
Basic Schematic Diagrams 5957docx Page 29
Symbol Tools and justification
Document produced (Flowchart)
Data entered or received (Flowchart)
Foundation Computing
Basic Schematic Diagrams 5957docx Page 30
Suggested Answers Which tools would you use to produce the following symbols or diagrams and why
Symbol Tools and justification
Resistor (Electrical circuit diagram)
Straight line tool (hold down shift key)It creates regular 45 degree angled lines that are perfectly straight
Speaker (Electrical circuit diagram)
Polygon tool (hold down shift key) Rectangle tool and Straight line tool These are used in order to create a symbol with uniform angles and straight edges
AC
AC source (Electrical circuit diagram)
Oval tool (hold down shift key) to draw circle Curve tool to draw wavy line Straight line tool and Text tool These tools produce cleaner shapes than drawing freeform
Start or end of process (Flowchart)
Rounded rectangle tool This provides a template for creating this symbol
Decision (yes or no) (Flowchart)
Polygon tool This creates more accurate joins between sides than the Straight line tool
Instructions or actions (Flowchart)
Rectangle tool It provides a template for drawing this shape
Foundation Computing
Basic Schematic Diagrams 5957docx Page 31
Symbol Tools and justification
Document produced (Flowchart)
Line tool and Curve tool ndash need two tools in MSPaint other applications may have a template for this shape
Data entered or received (Flowchart)
Polygon tool ndash better than Straight line tool because can produce more regular shape
Foundation Computing
Basic Schematic Diagrams 5957docx Page 32
TOPIC 3 Getting started with MS Paint Sourced from httpwindowsmicrosoftcomen-NZwindows7Getting-started-with-Paint MS Paint is a feature in Windows that you can use to draw colour and edit pictures You can use Paint like a digital sketchpad to make simple pictures creative projects or to add text and designs to other pictures such as those taken with your digital camera The parts of Paint Open Paint by clicking the Start button clicking All Programs clicking Accessories and then clicking Paint When you start Paint youll see an empty window drawing and painting tools are located in the ribbon at the top of the window The following illustration shows the different parts of the Paint window
The Paint window
Foundation Computing
Basic Schematic Diagrams 5957docx Page 33
Working with tools The ribbon in Paint includes a handy collection of drawing tools You can use these tools to create freehand drawings and add a variety of shapes to your pictures This section describes some common tasks For more detailed information on how to use the different tools in Paint see Using Paint Draw a line Some tools and shapes such as the Pencil Brush Line and Curve let you make a variety of straight curved and squiggly lines What you draw is determined by how you move the mouse as you draw You can use the Line to draw a straight line for example
1) On the Home tab in the Shapes group click the Line 2) In the Colors group click Color 1 and then click the color you want to use 3) To draw drag the pointer across the drawing area
Draw a squiggly line Your drawings dont have to be composed of only straight lines The Pencil and Brushes can be used to make completely random free-form shapes
1) On the Home tab in the Tools group click the Pencil tool 2) In the Colors group click Color 1 and then click the color you want to use 3) To draw drag the pointer across the drawing area and make a squiggly line
Note If you want to make a line that has a different appearance use one of the Brushes instead Draw a shape Paint lets you draw many different shapes For example you can draw ready-made defined shapes such as rectangles circles squares triangles and arrows (to name a
few) You can also make your own custom shape by using the Polygon shape to draw a polygon which is a shape that can have any number of sides
1) On the Home tab in the Shapes group click a ready-made shape such as the
Rectangle 2) To add a ready-made shape drag the pointer across the drawing area to make
the shape 3) To change the outline style in the Shapes group click Outline and then click an
outline style 4) If you dont want your shape to have an outline click No outline 5) In the Colors group click Color 1 and then click a color for the outline 6) In the Colors group click Color 2 and then click a color to use to fill the shape 7) To change the fill style in the Shapes group click Fill and then click a fill style 8) If you dont want your shape to be filled click No fill
Foundation Computing
Basic Schematic Diagrams 5957docx Page 34
Add text You can also add text to your picture The Text tool lets you add a simple message or title
1) On the Home tab in the Tools group click the Text tool 2) Drag the pointer in the drawing area where you want to add text 3) Under Text Tools on the Text tab click the font face size and style in the Font
group The Font group
4) In the Colors group click Color 1 and then click a color This is the text color 5) Type the text that you want to add
Erase part of your picture If you make a mistake or need to change part of a picture use the eraser By default the eraser changes any area you erase to white but you can change the eraser color For example if you set the background color to yellow anything you erase turns to yellow
1) On the Home tab in the Tools group click the Eraser tool 2) In the Colors group click Color 2 and then click the color that you want to erase
with If you want to erase with white you dont have to select a color 3) Drag the pointer over the area you want to erase
Saving a picture Save your picture frequently so you dont accidentally lose your work To save click the
Paint button and then click Save This saves all of the changes made to the picture since the last time you saved The very first time that you save a new picture you will need to give your picture a file name Follow these steps
1) Click the Paint button and then click Save 2) In the Save as type box select the file format you want 3) In the File name box type a name and then click Save
Foundation Computing
Basic Schematic Diagrams 5957docx Page 35
Topic 4 Designing your diagram Although there are many different types of schematic diagrams the basic process and principles involved in designing a clear and coherent diagram are similar The principles apply to designing an electrical circuit diagram an organisation chart a mind map a flow chart and many other diagrams Some of these principles are also worth applying to other disciplines such as designing a Web page Letrsquos work step-by-step through the process of creating a flow chart to help people make money selling things on an on-line auction site such as wwwtrademeconz or wwwebaycom
Step 1 Gather your information Start by brainstorming all the information you need to include in your diagram Write down everything you think might be important or should be included
trademe
choose things that
sell
good photograph
feedback
keep track
prompt answers
postage
auction length
similar listings
postal system
setting reserve
describing item
correct category
re-listing
fixed offers
Look at the information you have gathered and think about your target audience Highlight the information that is most important to your target audience Cross out any irrelevant information Put question marks next to information that you are unsure about or may be able to leave out
Foundation Computing
Basic Schematic Diagrams 5957docx Page 36
Step 2 Organise your information Take the information that you have left and sort through it How you organise your information will depend on the type of diagram you are designing For example an organisationrsquos chart usually has different levels and shows who its members report to so you might group people by department and by level A flow chart like the example wersquore creating usually shows a process Information is grouped in the order we would use it If any other steps or information occurs to you as you are organising your information add them in Herersquos an example of how the key steps involved in selling on trademe could be ordered
Choose items that sell
Look at similar listings
Decide on a reserve price
Take a clear photograph
Identify your target audience
Write a clear description
Upload your item
Choose the correct category
Monitor watchers bids and views
Lower your reserve
Fixed price offers
Relist
Step 3 Make connections Once the elements are grouped or arranged in a logical order a clearer picture of the process or system you are representing in your diagram should start to emerge However unlike a list which usually reads from top to bottom only a diagram can show connections in many different directions and working out the links between elements is an essential part of designing a coherent diagram At this stage of the design process it is helpful to sketch out a basic plan of the elements you want to include and the flow-lines or connections between them In order to work out the connections between the elements ask questions such as What happens ifhellip What do I do beforeafter this What decisions need to be made now What actions need to be taken Use arrows to show connections between elements group elements that are part of the same stage or level of the process next to or near to each other and use shapes to show which elements are similar to each other eg diamonds for decisions rectangles for instructions or actions Make up your own meanings for shapes if necessary but be sure to use them consistently
Foundation Computing
Basic Schematic Diagrams 5957docx Page 37
The flow chart below shows how our list of elements above changes and gets re-ordered as we ask these questions and organise the information into a logical and coherent diagram
Decide on your
reserve price
START
Relist
Take a photo that is
clear and item looks
good
Decide on your
ideal buyer
Write a description
of your item
highlighting its
benefits for your
buyer
Upload your item in
a category your
buyer is likely to be
looking in
Monitor how many
views watchers and
bids your item gets
Lower your reserve
Item meets reserve
and sellsItem doesnrsquot sell
Offer to watchers for
your reserve
Decide what you
want to sell
Check what similar
items are currently
selling for
Lots of views but
no watchers
No interestFINISH
Foundation Computing
Basic Schematic Diagrams 5957docx Page 38
Step 4 Test your diagram The final step in designing your diagram is checking that it is as effective as possible To do this you should work through each stage step by step challenging it as you go Picture the process in your mind as you follow the links checking that you have included all the actions and decisions required that they are in the correct order and that no steps are duplicated Once yoursquore confident that the diagram is correct look at it again critically to see if you can improve it or clarify it Is there anywhere you can simplify it by removing unnecessary steps Is there anywhere that seems vague and would be easier to understand if you added a step or a connector Now imagine that you are a member of your target audience For a moment try to forget everything you know about the system or process you have designed a diagram for except for what your target audience knows Look at the diagram with fresh eyes does it make sense to you now Does anything seem odd confusing or out of place Finally look at the layout of your diagram Is it easy to read and follow Have you used shapes texts and arrows consistently Are your shapes and texts uniform and lined up properly Are your connectors clearly defined or are they criss-crossing all over each other Check the spelling of labels carefully ndash go through letter by letter to make sure all names and technical or unfamiliar terms are correct
Discussion With a partner look critically at our example diagram above Discuss any parts of it that you think could be better and any changes you would make to improve the readability of the flow chart Make note on the flow chart above of any areas that you think could be improved Share your answers with the rest of the class
Foundation Computing
Basic Schematic Diagrams 5957docx Page 39
Self Test 1) Mr Biggles owns Biggles Air Supplies a company that makes aircraft supplies He asks you to create an organisation chart for his company He gives you the following list of all his employees and who they report to
Mr James Biggles Chief Executive Officer
Jane Doep Personal Assistant to CEO
Mrs Monica Stepworth Financial Manager (reports to CEO)
Judith Zantes Accountant (reports to Financial Manager)
Mary Smallville Accountant (reports to Financial Manager)
Janey Poretuna Admin Assistant (reports to Judith Zantes)
Mickey Laluevu IT technician (reports to Financial Manager)
Mr Hank Johnson Operations Manager (reports to CEO)
Frank Hapil Engineering Manager (reports to Operations Manager)
Joe Smither Engineering Supervisor (reports to Engineering Manager)
Howie Fartherton Engineering Technician (reports to Engineering Supervisor)
Ernie Jusef Engineering Technician (reports to Engineering Supervisor)
Rob Luxemburg Apprentice Technician (reports to Ernie Jusef)
Harry Monahan Interiors Manager (reports to Operations Manager)
Barney Jokka Interiors Technician (reports to Interiors Supervisor) Design an organisation chart for Biggles Air Supplies and draw it in the space below
2) Think of a simple process that has at least five steps and involves some form of feedback or choice For example operating a vending machine topping up your mobile phone using EFTPOS checking messages on an answering machine
Design a flow chart to represent your process
Foundation Computing
Basic Schematic Diagrams 5957docx Page 40
Self Test Answers
1) Mr Biggles owns Biggles Air Supplies a company that makes aircraft supplies He asks you to create an organisation chart for his company He gives you the following list of all his employees and who they report to
Mr James Biggles Chief Executive Officer
Jane Doep Personal Assistant to CEO
Mrs Monica Stepworth Financial Manager (reports to CEO)
Judith Zantes Accountant (reports to Financial Manager)
Mary Smallville Accountant (reports to Financial Manager)
Janey Poretuna Admin Assistant (reports to Judith Zantes)
Mickey Laluevu IT technician (reports to Financial Manager)
Mr Hank Johnson Operations Manager (reports to CEO)
Frank Hapil Engineering Manager (reports to Operations Manager)
Joe Smither Engineering Supervisor (reports to Engineering Manager)
Howie Fartherton Engineering Technician (reports to Engineering Supervisor)
Ernie Jusef Engineering Technician (reports to Engineering Supervisor)
Rob Luxemburg Apprentice Technician (reports to Ernie Jusef)
Harry Monahan Interiors Manager (reports to Operations Manager)
Barney Jokka Interiors Technician (reports to Interiors Supervisor) Design an organisation chart for Biggles Air Supplies and draw it in the space below
Mr James Biggles
CEO
Jane Doep
Personal
Assistant
Mrs Monica Stepworth
Financial Manager
Judith Zantes
Accountant
Janey Poretuna
Admin Assistant
Mary Smallville
Accountant
Mickey Laluevu
IT technician
Mr Hank Johnson
Operations Manager
Frank Hapil
Engineering
Manager
Harry Monahan
Interiors Manager
Joe Smither
Engineering
Supervisor
Howie Fartherton
Engineering
Technician
Ernie Jusef
Engineering
Technician
Rob Luxemburg
Apprentice
Technician
Barney Jokka
Interiors
Technician
Foundation Computing
Basic Schematic Diagrams 5957docx Page 41
2) Think of a simple process that has at least five steps and involves some form of feedback or choice For example operating a vending machine topping up your mobile phone using EFTPOS checking messages on an answering machine
Design a flow chart to represent your process
Dial 06345
Enter your dialing code and
phone number followed by
the key
Dial number for
service you require
Listen to saved messagesListen to new messages
Dial number for
service you require
Save message Delete message
START
FINISH
Dial 2
Dial 1
Dial 1
Dial 2
Dial 1
Dial 2
Foundation Computing
Basic Schematic Diagrams 5957docx Page 42
Foundation Computing
Basic Schematic Diagrams 5957docx Page 43
Part 2
Produce schematic diagrams from a given brief using a computer application
OBJECTIVES
On successful completion of this section you will be able to Produce schematic diagrams from a given brief using a computer application
Performance criteria
21 The symbols used in each diagram are consistent with the type of diagram and the specifications of the brief
22 The final diagram is readable clearly illustrates the object being diagrammed
and is consistent with the specifications of the brief
TOPICS
Topic 1 Symbols used are consistent with diagram type and specifications Topic 2 Diagram is clear readable and consistent with specifications
Self Test
Self Test Answers
Foundation Computing
Basic Schematic Diagrams 5957docx Page 44
TOPIC 1 Symbols used are consistent with diagram type and specifications A symbol is something such as an object picture written word sound or particular mark that represents something else by association resemblance or convention For example a red octagon may be a symbol for STOP On maps crossed sabres may indicate a battlefield Numerals are symbols for numbers All language consists of symbols The word cat is not a cat but is an arbitrary symbol representing the idea of a cat There are many symbols for many things Examples range from Peace Pipe Red Cross to Electrical symbols It is good when doing schematic drawings to use symbols that are clearly recognised and interpreted Symbols that have been internationally standardised are the best Circuit diagram symbols have differed from country to country and have changed over time They are now to a large extent internationally standardized Simple components often had symbols intended to represent some feature of the physical construction of the device There are several national and international standards for graphical symbols in circuit diagrams in particular
IEC 60617 (also known as British Standard BS 3939)
ANSI standard Y32 (also known as IEEE Std 315) IEC 60617 originally consisted of 13 parts from resistors and capacitors to logic symbols and even a generalised drawing standard of connections and bus line widths It is now published as a subscription online database IEC 60617-DB Different symbols may be used depending on the discipline using the drawing for example lighting and power symbols used as part of architectural drawings may be different from symbols for devices used in electronics Different electronic components have different characteristics it is necessary to distinguish between them in any circuit diagram Of course we could use the block diagram approach and just identify each component with words Unfortunately this takes up a lot of space and makes the overall diagram harder to recognize or understand quickly We need a way to understand electrical diagrams far more quickly and easily
Foundation Computing
Basic Schematic Diagrams 5957docx Page 45
The answer is to use schematic symbols to represent electronic components as shown in the diagram below In this diagram we show the schematic symbol of a battery as the electrical source and the symbol of a resistor as the load Even without the words and arrows the symbols define exactly what this circuit is and how it behaves
Some good procedures to follow with symbols include
Using templates for frequently used symbols
Use symbols consistently
Use a library of symbols such as from IEC 60617-DB
Foundation Computing
Basic Schematic Diagrams 5957docx Page 46
TOPIC 2 Diagram is clear readable and consistent with specifications Creating a simple diagram using MSPaint To start with letrsquos create a simple flow chart representing the stages in designing a schematic diagram There are four stages in this process
1) Gather your information 2) Organise your information 3) Make connections 4) Test your diagram
Our flow chart will consist of four rectangles arranged vertically with downward pointing arrows as connectors A rounded rectangle at the top and at the bottom of the flowchart will indicate START and FINISH respectively Step by step
Open Microsoft Paint
Click on the Rectangle tool then click and drag in the drawing area to draw a rectangle
Repeat this step to draw four boxes in the drawing area OR click on the Select tool and click and drag to select the first rectangle then right-click to copy and paste three more rectangles the same size in the drawing area
Foundation Computing
Basic Schematic Diagrams 5957docx Page 47
Using the Rounded Rectangle tool draw a rounded rectangle at the top and bottom of your flow chart
Foundation Computing
Basic Schematic Diagrams 5957docx Page 48
Use the Line tool to draw arrows between each box In the Options area under the Tool bar you can choose the thickness of line that you want to use Remember too that if you hold down the Shift key on the keyboard while you are drawing a line you can create a 45 degree angle
Use the Text tool to add text to the shapes by clicking on the Text tool clicking and dragging to create a textbox inside your shape then typing your text Check your spelling carefully letter by letter as you go
Foundation Computing
Basic Schematic Diagrams 5957docx Page 49
The basic flowchart created in Microsoft Paint could look something like this
Foundation Computing
Basic Schematic Diagrams 5957docx Page 50
Common problems with diagrams Even well-designed schematic diagrams will be difficult for the target audience to read and understand if symbols are used inconsistently or the layout of the diagram is unfamiliar For example if a flowchart has different shapes used for each element and different types of arrows used randomly it will be more difficult for readers to see the overall direction and meaning of the diagram If the shapes on an organisation chart are different sizes and randomly positioned with no clear levels or hierarchy the diagram will not provide a clear overview of the organisationrsquos structure If an electrical circuit diagram has unfamiliar symbols used for elements such as switches resistors and batteries then it will not make sense to its intended audience
Tips for improving the readability of your schematic diagrams
Use symbols and shapes consistently ie elements that are similar should have the same symbol or shape
Avoid having connectors crossing over each other
Avoid having symbols or shapes overlapping
Use arrows on connectors or flow lines to indicate direction
Use colours text size and font consistently
Diagrams that can be read top-to-bottom and left-to-right are easier to read
In a process diagram have only one connector leading into a symbol but have more coming out where necessary to indicate different directions or decisions
Diagrams for a technical audience such as electrical or computer programming schematics should follow accepted conventions for symbols and layout
Diagrams indicating a hierarchy of positions ideas or stages are clearer if elements belonging to the same level are a similar shape size and position on the page
Keep labels as clear and as brief as possible Carefully check the spelling of all names and labels letter by letter ndash errors in the spelling of names or scientific and technical terms look unprofessional and can be confusing for readers
Foundation Computing
Basic Schematic Diagrams 5957docx Page 51
Self Test Look at the schematic diagrams that follow Make notes under each example of what is wrong with the diagram what is right about the diagram and what could be changed to make it clear and meaningful to its intended audience 1) This flow chart is supposed to show police officers how to get a suspect to confess to a crime
START
Confidently accuse
suspect of crime
Describe a
scenario that
enables suspect
to admit guiltAllow suspect to
voice objections
Invade suspectrsquos
personal space
Suspect becomes
uncomfortable
Suspect
doesnrsquot
deny guilt
Suspect
denies guilt
No reaction
Elicit confession
Rephrase objections as
confessions
FINISH
Foundation Computing
Basic Schematic Diagrams 5957docx Page 52
2) The following diagram is an organisation chart for Widget Enterprises
John Smith
MANAGER
Seth Drew
IT MANAGER
May Furur
SECRETARY
Judith Holland
CUSTOMER SERVICES manager
Jad Ling
HELPDESK
Harry Petal
FINANCIAL MANAGER
Wanda Springer
MARKETING
MANAGER
Bob Smithells
CLEANER
Kelly Inlerl
MARKETING ASSISTANT
Beryl Thin
CUSTOMER SERVICES ASSISTANTValda Rigley
CUSTOMER
SERVICES
ASSISTANT
Levi Quayle
COMPUTER
TECHNICIAN
3) Which of the following computer applications can be used to create schematic diagrams
a) Microsoft Visio
b) Microsoft Paint
c) Microsoft Word
d) All of the above
4) Which frequently used shapes does the Microsoft Paint Tool bar contain templates for
5) Where in the Microsoft Paint window would you be able to select the thickness of line that you wanted for a brushstroke 6) Identify the purpose and intended audience for a diagram showing a businessrsquos marketing plan 7) Name two characteristics of well-designed schematic diagrams 8) Identify four steps involved in designing schematic diagrams 9) Why is it important to use conventionally accepted and familiar shapes and symbols in your schematic diagrams
Foundation Computing
Basic Schematic Diagrams 5957docx Page 53
Self Test Answers 1) This flow chart is supposed to show police officers how to get a suspect to confess to a crime
START
Confidently accuse
suspect of crime
Describe a
scenario that
enables suspect
to admit guiltAllow suspect to
voice objections
Invade suspectrsquos
personal space
Suspect becomes
uncomfortable
Suspect
doesnrsquot
deny guilt
Suspect
denies guilt
No reaction
Elicit confession
Rephrase objections as
confessions
FINISH
Random shapes are meaningless and confusing ndash use conventional flow chart symbols
Stages of process are not clear ndash arrange shapes top to bottom with options at each stage branching off to side at same level
Connectors that are either straight or curved would be more consistent
Labels are clear
Text uses consistent font and size
Foundation Computing
Basic Schematic Diagrams 5957docx Page 54
2) The following diagram is an organisation chart for Widget Enterprises
John Smith
MANAGER
Seth Drew
IT MANAGER
May Furur
SECRETARY
Judith Holland
CUSTOMER SERVICES manager
Jad Ling
HELPDESK
Harry Petal
FINANCIAL MANAGER
Wanda Springer
MARKETING
MANAGER
Bob Smithells
CLEANER
Kelly Inlerl
MARKETING ASSISTANT
Beryl Thin
CUSTOMER SERVICES ASSISTANTValda Rigley
CUSTOMER
SERVICES
ASSISTANT
Levi Quayle
COMPUTER
TECHNICIAN
No clear levels to hierarchy ndash organise so that diagram reads top to bottom and positions at similar level are in same horizontal space
Different sized boxes and borders on some boxes are meaningless ndash need consistent style for similar elements
Connectors cross over each other and boxes overlap ndash arrange space to avoid this
Text size and font is mostly consistent but one typo needs correcting
3) Which of the following computer applications can be used to create schematic diagrams
a) Microsoft Visio
b) Microsoft Paint
c) Microsoft Word
d) All of the above correct
4) Which frequently used shapes does the Microsoft Paint Tool bar contain templates for
Polygon rectangle ovalellipse
Foundation Computing
Basic Schematic Diagrams 5957docx Page 55
5) Where in the Microsoft Paint window would you be able to select the thickness of line that you wanted for a brushstroke
Options area below the Toolbar
6) Identify the purpose and intended audience for a diagram showing a businessrsquos marketing plan
The purpose would be to provide an overview of the businessrsquos marketing strategy Audience could include management and employees of the business especially the Marketing department potential investors shareholders and directors of the business
7) Name two characteristics of well-designed schematic diagrams Any of simple easy for the target audience to understand include all relevant elements or parts of the process clear and logical connections between elements accurate 8) Identify four steps involved in designing schematic diagrams Gather information organise information make connections between elements test your diagram 9) Why is it important to use conventionally accepted and familiar shapes and
symbols in your schematic diagrams So that the diagram will be easily understood by the target audience
Foundation Computing
Basic Schematic Diagrams 5957docx Page 56
References httpwindowsmicrosoftcomen-NZwindows7Getting-started-with-Paint accessed Sat 5th December in Timaru New Zealand httpenwikipediaorgwikiSchematic_diagrams accessed Sat 5th December in Timaru New Zealand httpenwikipediaorgwikiSymbol accessed Sat 5th December in Timaru New Zealand
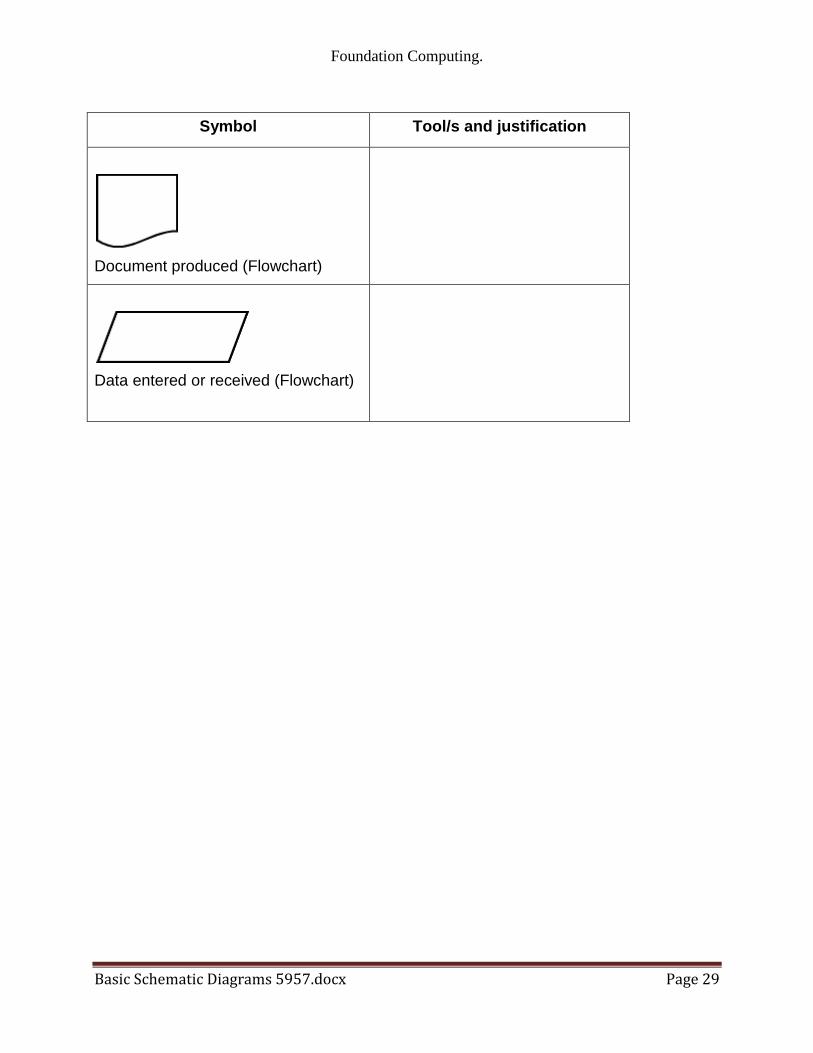
Foundation Computing
Basic Schematic Diagrams 5957docx Page 29
Symbol Tools and justification
Document produced (Flowchart)
Data entered or received (Flowchart)
Foundation Computing
Basic Schematic Diagrams 5957docx Page 30
Suggested Answers Which tools would you use to produce the following symbols or diagrams and why
Symbol Tools and justification
Resistor (Electrical circuit diagram)
Straight line tool (hold down shift key)It creates regular 45 degree angled lines that are perfectly straight
Speaker (Electrical circuit diagram)
Polygon tool (hold down shift key) Rectangle tool and Straight line tool These are used in order to create a symbol with uniform angles and straight edges
AC
AC source (Electrical circuit diagram)
Oval tool (hold down shift key) to draw circle Curve tool to draw wavy line Straight line tool and Text tool These tools produce cleaner shapes than drawing freeform
Start or end of process (Flowchart)
Rounded rectangle tool This provides a template for creating this symbol
Decision (yes or no) (Flowchart)
Polygon tool This creates more accurate joins between sides than the Straight line tool
Instructions or actions (Flowchart)
Rectangle tool It provides a template for drawing this shape
Foundation Computing
Basic Schematic Diagrams 5957docx Page 31
Symbol Tools and justification
Document produced (Flowchart)
Line tool and Curve tool ndash need two tools in MSPaint other applications may have a template for this shape
Data entered or received (Flowchart)
Polygon tool ndash better than Straight line tool because can produce more regular shape
Foundation Computing
Basic Schematic Diagrams 5957docx Page 32
TOPIC 3 Getting started with MS Paint Sourced from httpwindowsmicrosoftcomen-NZwindows7Getting-started-with-Paint MS Paint is a feature in Windows that you can use to draw colour and edit pictures You can use Paint like a digital sketchpad to make simple pictures creative projects or to add text and designs to other pictures such as those taken with your digital camera The parts of Paint Open Paint by clicking the Start button clicking All Programs clicking Accessories and then clicking Paint When you start Paint youll see an empty window drawing and painting tools are located in the ribbon at the top of the window The following illustration shows the different parts of the Paint window
The Paint window
Foundation Computing
Basic Schematic Diagrams 5957docx Page 33
Working with tools The ribbon in Paint includes a handy collection of drawing tools You can use these tools to create freehand drawings and add a variety of shapes to your pictures This section describes some common tasks For more detailed information on how to use the different tools in Paint see Using Paint Draw a line Some tools and shapes such as the Pencil Brush Line and Curve let you make a variety of straight curved and squiggly lines What you draw is determined by how you move the mouse as you draw You can use the Line to draw a straight line for example
1) On the Home tab in the Shapes group click the Line 2) In the Colors group click Color 1 and then click the color you want to use 3) To draw drag the pointer across the drawing area
Draw a squiggly line Your drawings dont have to be composed of only straight lines The Pencil and Brushes can be used to make completely random free-form shapes
1) On the Home tab in the Tools group click the Pencil tool 2) In the Colors group click Color 1 and then click the color you want to use 3) To draw drag the pointer across the drawing area and make a squiggly line
Note If you want to make a line that has a different appearance use one of the Brushes instead Draw a shape Paint lets you draw many different shapes For example you can draw ready-made defined shapes such as rectangles circles squares triangles and arrows (to name a
few) You can also make your own custom shape by using the Polygon shape to draw a polygon which is a shape that can have any number of sides
1) On the Home tab in the Shapes group click a ready-made shape such as the
Rectangle 2) To add a ready-made shape drag the pointer across the drawing area to make
the shape 3) To change the outline style in the Shapes group click Outline and then click an
outline style 4) If you dont want your shape to have an outline click No outline 5) In the Colors group click Color 1 and then click a color for the outline 6) In the Colors group click Color 2 and then click a color to use to fill the shape 7) To change the fill style in the Shapes group click Fill and then click a fill style 8) If you dont want your shape to be filled click No fill
Foundation Computing
Basic Schematic Diagrams 5957docx Page 34
Add text You can also add text to your picture The Text tool lets you add a simple message or title
1) On the Home tab in the Tools group click the Text tool 2) Drag the pointer in the drawing area where you want to add text 3) Under Text Tools on the Text tab click the font face size and style in the Font
group The Font group
4) In the Colors group click Color 1 and then click a color This is the text color 5) Type the text that you want to add
Erase part of your picture If you make a mistake or need to change part of a picture use the eraser By default the eraser changes any area you erase to white but you can change the eraser color For example if you set the background color to yellow anything you erase turns to yellow
1) On the Home tab in the Tools group click the Eraser tool 2) In the Colors group click Color 2 and then click the color that you want to erase
with If you want to erase with white you dont have to select a color 3) Drag the pointer over the area you want to erase
Saving a picture Save your picture frequently so you dont accidentally lose your work To save click the
Paint button and then click Save This saves all of the changes made to the picture since the last time you saved The very first time that you save a new picture you will need to give your picture a file name Follow these steps
1) Click the Paint button and then click Save 2) In the Save as type box select the file format you want 3) In the File name box type a name and then click Save
Foundation Computing
Basic Schematic Diagrams 5957docx Page 35
Topic 4 Designing your diagram Although there are many different types of schematic diagrams the basic process and principles involved in designing a clear and coherent diagram are similar The principles apply to designing an electrical circuit diagram an organisation chart a mind map a flow chart and many other diagrams Some of these principles are also worth applying to other disciplines such as designing a Web page Letrsquos work step-by-step through the process of creating a flow chart to help people make money selling things on an on-line auction site such as wwwtrademeconz or wwwebaycom
Step 1 Gather your information Start by brainstorming all the information you need to include in your diagram Write down everything you think might be important or should be included
trademe
choose things that
sell
good photograph
feedback
keep track
prompt answers
postage
auction length
similar listings
postal system
setting reserve
describing item
correct category
re-listing
fixed offers
Look at the information you have gathered and think about your target audience Highlight the information that is most important to your target audience Cross out any irrelevant information Put question marks next to information that you are unsure about or may be able to leave out
Foundation Computing
Basic Schematic Diagrams 5957docx Page 36
Step 2 Organise your information Take the information that you have left and sort through it How you organise your information will depend on the type of diagram you are designing For example an organisationrsquos chart usually has different levels and shows who its members report to so you might group people by department and by level A flow chart like the example wersquore creating usually shows a process Information is grouped in the order we would use it If any other steps or information occurs to you as you are organising your information add them in Herersquos an example of how the key steps involved in selling on trademe could be ordered
Choose items that sell
Look at similar listings
Decide on a reserve price
Take a clear photograph
Identify your target audience
Write a clear description
Upload your item
Choose the correct category
Monitor watchers bids and views
Lower your reserve
Fixed price offers
Relist
Step 3 Make connections Once the elements are grouped or arranged in a logical order a clearer picture of the process or system you are representing in your diagram should start to emerge However unlike a list which usually reads from top to bottom only a diagram can show connections in many different directions and working out the links between elements is an essential part of designing a coherent diagram At this stage of the design process it is helpful to sketch out a basic plan of the elements you want to include and the flow-lines or connections between them In order to work out the connections between the elements ask questions such as What happens ifhellip What do I do beforeafter this What decisions need to be made now What actions need to be taken Use arrows to show connections between elements group elements that are part of the same stage or level of the process next to or near to each other and use shapes to show which elements are similar to each other eg diamonds for decisions rectangles for instructions or actions Make up your own meanings for shapes if necessary but be sure to use them consistently
Foundation Computing
Basic Schematic Diagrams 5957docx Page 37
The flow chart below shows how our list of elements above changes and gets re-ordered as we ask these questions and organise the information into a logical and coherent diagram
Decide on your
reserve price
START
Relist
Take a photo that is
clear and item looks
good
Decide on your
ideal buyer
Write a description
of your item
highlighting its
benefits for your
buyer
Upload your item in
a category your
buyer is likely to be
looking in
Monitor how many
views watchers and
bids your item gets
Lower your reserve
Item meets reserve
and sellsItem doesnrsquot sell
Offer to watchers for
your reserve
Decide what you
want to sell
Check what similar
items are currently
selling for
Lots of views but
no watchers
No interestFINISH
Foundation Computing
Basic Schematic Diagrams 5957docx Page 38
Step 4 Test your diagram The final step in designing your diagram is checking that it is as effective as possible To do this you should work through each stage step by step challenging it as you go Picture the process in your mind as you follow the links checking that you have included all the actions and decisions required that they are in the correct order and that no steps are duplicated Once yoursquore confident that the diagram is correct look at it again critically to see if you can improve it or clarify it Is there anywhere you can simplify it by removing unnecessary steps Is there anywhere that seems vague and would be easier to understand if you added a step or a connector Now imagine that you are a member of your target audience For a moment try to forget everything you know about the system or process you have designed a diagram for except for what your target audience knows Look at the diagram with fresh eyes does it make sense to you now Does anything seem odd confusing or out of place Finally look at the layout of your diagram Is it easy to read and follow Have you used shapes texts and arrows consistently Are your shapes and texts uniform and lined up properly Are your connectors clearly defined or are they criss-crossing all over each other Check the spelling of labels carefully ndash go through letter by letter to make sure all names and technical or unfamiliar terms are correct
Discussion With a partner look critically at our example diagram above Discuss any parts of it that you think could be better and any changes you would make to improve the readability of the flow chart Make note on the flow chart above of any areas that you think could be improved Share your answers with the rest of the class
Foundation Computing
Basic Schematic Diagrams 5957docx Page 39
Self Test 1) Mr Biggles owns Biggles Air Supplies a company that makes aircraft supplies He asks you to create an organisation chart for his company He gives you the following list of all his employees and who they report to
Mr James Biggles Chief Executive Officer
Jane Doep Personal Assistant to CEO
Mrs Monica Stepworth Financial Manager (reports to CEO)
Judith Zantes Accountant (reports to Financial Manager)
Mary Smallville Accountant (reports to Financial Manager)
Janey Poretuna Admin Assistant (reports to Judith Zantes)
Mickey Laluevu IT technician (reports to Financial Manager)
Mr Hank Johnson Operations Manager (reports to CEO)
Frank Hapil Engineering Manager (reports to Operations Manager)
Joe Smither Engineering Supervisor (reports to Engineering Manager)
Howie Fartherton Engineering Technician (reports to Engineering Supervisor)
Ernie Jusef Engineering Technician (reports to Engineering Supervisor)
Rob Luxemburg Apprentice Technician (reports to Ernie Jusef)
Harry Monahan Interiors Manager (reports to Operations Manager)
Barney Jokka Interiors Technician (reports to Interiors Supervisor) Design an organisation chart for Biggles Air Supplies and draw it in the space below
2) Think of a simple process that has at least five steps and involves some form of feedback or choice For example operating a vending machine topping up your mobile phone using EFTPOS checking messages on an answering machine
Design a flow chart to represent your process
Foundation Computing
Basic Schematic Diagrams 5957docx Page 40
Self Test Answers
1) Mr Biggles owns Biggles Air Supplies a company that makes aircraft supplies He asks you to create an organisation chart for his company He gives you the following list of all his employees and who they report to
Mr James Biggles Chief Executive Officer
Jane Doep Personal Assistant to CEO
Mrs Monica Stepworth Financial Manager (reports to CEO)
Judith Zantes Accountant (reports to Financial Manager)
Mary Smallville Accountant (reports to Financial Manager)
Janey Poretuna Admin Assistant (reports to Judith Zantes)
Mickey Laluevu IT technician (reports to Financial Manager)
Mr Hank Johnson Operations Manager (reports to CEO)
Frank Hapil Engineering Manager (reports to Operations Manager)
Joe Smither Engineering Supervisor (reports to Engineering Manager)
Howie Fartherton Engineering Technician (reports to Engineering Supervisor)
Ernie Jusef Engineering Technician (reports to Engineering Supervisor)
Rob Luxemburg Apprentice Technician (reports to Ernie Jusef)
Harry Monahan Interiors Manager (reports to Operations Manager)
Barney Jokka Interiors Technician (reports to Interiors Supervisor) Design an organisation chart for Biggles Air Supplies and draw it in the space below
Mr James Biggles
CEO
Jane Doep
Personal
Assistant
Mrs Monica Stepworth
Financial Manager
Judith Zantes
Accountant
Janey Poretuna
Admin Assistant
Mary Smallville
Accountant
Mickey Laluevu
IT technician
Mr Hank Johnson
Operations Manager
Frank Hapil
Engineering
Manager
Harry Monahan
Interiors Manager
Joe Smither
Engineering
Supervisor
Howie Fartherton
Engineering
Technician
Ernie Jusef
Engineering
Technician
Rob Luxemburg
Apprentice
Technician
Barney Jokka
Interiors
Technician
Foundation Computing
Basic Schematic Diagrams 5957docx Page 41
2) Think of a simple process that has at least five steps and involves some form of feedback or choice For example operating a vending machine topping up your mobile phone using EFTPOS checking messages on an answering machine
Design a flow chart to represent your process
Dial 06345
Enter your dialing code and
phone number followed by
the key
Dial number for
service you require
Listen to saved messagesListen to new messages
Dial number for
service you require
Save message Delete message
START
FINISH
Dial 2
Dial 1
Dial 1
Dial 2
Dial 1
Dial 2
Foundation Computing
Basic Schematic Diagrams 5957docx Page 42
Foundation Computing
Basic Schematic Diagrams 5957docx Page 43
Part 2
Produce schematic diagrams from a given brief using a computer application
OBJECTIVES
On successful completion of this section you will be able to Produce schematic diagrams from a given brief using a computer application
Performance criteria
21 The symbols used in each diagram are consistent with the type of diagram and the specifications of the brief
22 The final diagram is readable clearly illustrates the object being diagrammed
and is consistent with the specifications of the brief
TOPICS
Topic 1 Symbols used are consistent with diagram type and specifications Topic 2 Diagram is clear readable and consistent with specifications
Self Test
Self Test Answers
Foundation Computing
Basic Schematic Diagrams 5957docx Page 44
TOPIC 1 Symbols used are consistent with diagram type and specifications A symbol is something such as an object picture written word sound or particular mark that represents something else by association resemblance or convention For example a red octagon may be a symbol for STOP On maps crossed sabres may indicate a battlefield Numerals are symbols for numbers All language consists of symbols The word cat is not a cat but is an arbitrary symbol representing the idea of a cat There are many symbols for many things Examples range from Peace Pipe Red Cross to Electrical symbols It is good when doing schematic drawings to use symbols that are clearly recognised and interpreted Symbols that have been internationally standardised are the best Circuit diagram symbols have differed from country to country and have changed over time They are now to a large extent internationally standardized Simple components often had symbols intended to represent some feature of the physical construction of the device There are several national and international standards for graphical symbols in circuit diagrams in particular
IEC 60617 (also known as British Standard BS 3939)
ANSI standard Y32 (also known as IEEE Std 315) IEC 60617 originally consisted of 13 parts from resistors and capacitors to logic symbols and even a generalised drawing standard of connections and bus line widths It is now published as a subscription online database IEC 60617-DB Different symbols may be used depending on the discipline using the drawing for example lighting and power symbols used as part of architectural drawings may be different from symbols for devices used in electronics Different electronic components have different characteristics it is necessary to distinguish between them in any circuit diagram Of course we could use the block diagram approach and just identify each component with words Unfortunately this takes up a lot of space and makes the overall diagram harder to recognize or understand quickly We need a way to understand electrical diagrams far more quickly and easily
Foundation Computing
Basic Schematic Diagrams 5957docx Page 45
The answer is to use schematic symbols to represent electronic components as shown in the diagram below In this diagram we show the schematic symbol of a battery as the electrical source and the symbol of a resistor as the load Even without the words and arrows the symbols define exactly what this circuit is and how it behaves
Some good procedures to follow with symbols include
Using templates for frequently used symbols
Use symbols consistently
Use a library of symbols such as from IEC 60617-DB
Foundation Computing
Basic Schematic Diagrams 5957docx Page 46
TOPIC 2 Diagram is clear readable and consistent with specifications Creating a simple diagram using MSPaint To start with letrsquos create a simple flow chart representing the stages in designing a schematic diagram There are four stages in this process
1) Gather your information 2) Organise your information 3) Make connections 4) Test your diagram
Our flow chart will consist of four rectangles arranged vertically with downward pointing arrows as connectors A rounded rectangle at the top and at the bottom of the flowchart will indicate START and FINISH respectively Step by step
Open Microsoft Paint
Click on the Rectangle tool then click and drag in the drawing area to draw a rectangle
Repeat this step to draw four boxes in the drawing area OR click on the Select tool and click and drag to select the first rectangle then right-click to copy and paste three more rectangles the same size in the drawing area
Foundation Computing
Basic Schematic Diagrams 5957docx Page 47
Using the Rounded Rectangle tool draw a rounded rectangle at the top and bottom of your flow chart
Foundation Computing
Basic Schematic Diagrams 5957docx Page 48
Use the Line tool to draw arrows between each box In the Options area under the Tool bar you can choose the thickness of line that you want to use Remember too that if you hold down the Shift key on the keyboard while you are drawing a line you can create a 45 degree angle
Use the Text tool to add text to the shapes by clicking on the Text tool clicking and dragging to create a textbox inside your shape then typing your text Check your spelling carefully letter by letter as you go
Foundation Computing
Basic Schematic Diagrams 5957docx Page 49
The basic flowchart created in Microsoft Paint could look something like this
Foundation Computing
Basic Schematic Diagrams 5957docx Page 50
Common problems with diagrams Even well-designed schematic diagrams will be difficult for the target audience to read and understand if symbols are used inconsistently or the layout of the diagram is unfamiliar For example if a flowchart has different shapes used for each element and different types of arrows used randomly it will be more difficult for readers to see the overall direction and meaning of the diagram If the shapes on an organisation chart are different sizes and randomly positioned with no clear levels or hierarchy the diagram will not provide a clear overview of the organisationrsquos structure If an electrical circuit diagram has unfamiliar symbols used for elements such as switches resistors and batteries then it will not make sense to its intended audience
Tips for improving the readability of your schematic diagrams
Use symbols and shapes consistently ie elements that are similar should have the same symbol or shape
Avoid having connectors crossing over each other
Avoid having symbols or shapes overlapping
Use arrows on connectors or flow lines to indicate direction
Use colours text size and font consistently
Diagrams that can be read top-to-bottom and left-to-right are easier to read
In a process diagram have only one connector leading into a symbol but have more coming out where necessary to indicate different directions or decisions
Diagrams for a technical audience such as electrical or computer programming schematics should follow accepted conventions for symbols and layout
Diagrams indicating a hierarchy of positions ideas or stages are clearer if elements belonging to the same level are a similar shape size and position on the page
Keep labels as clear and as brief as possible Carefully check the spelling of all names and labels letter by letter ndash errors in the spelling of names or scientific and technical terms look unprofessional and can be confusing for readers
Foundation Computing
Basic Schematic Diagrams 5957docx Page 51
Self Test Look at the schematic diagrams that follow Make notes under each example of what is wrong with the diagram what is right about the diagram and what could be changed to make it clear and meaningful to its intended audience 1) This flow chart is supposed to show police officers how to get a suspect to confess to a crime
START
Confidently accuse
suspect of crime
Describe a
scenario that
enables suspect
to admit guiltAllow suspect to
voice objections
Invade suspectrsquos
personal space
Suspect becomes
uncomfortable
Suspect
doesnrsquot
deny guilt
Suspect
denies guilt
No reaction
Elicit confession
Rephrase objections as
confessions
FINISH
Foundation Computing
Basic Schematic Diagrams 5957docx Page 52
2) The following diagram is an organisation chart for Widget Enterprises
John Smith
MANAGER
Seth Drew
IT MANAGER
May Furur
SECRETARY
Judith Holland
CUSTOMER SERVICES manager
Jad Ling
HELPDESK
Harry Petal
FINANCIAL MANAGER
Wanda Springer
MARKETING
MANAGER
Bob Smithells
CLEANER
Kelly Inlerl
MARKETING ASSISTANT
Beryl Thin
CUSTOMER SERVICES ASSISTANTValda Rigley
CUSTOMER
SERVICES
ASSISTANT
Levi Quayle
COMPUTER
TECHNICIAN
3) Which of the following computer applications can be used to create schematic diagrams
a) Microsoft Visio
b) Microsoft Paint
c) Microsoft Word
d) All of the above
4) Which frequently used shapes does the Microsoft Paint Tool bar contain templates for
5) Where in the Microsoft Paint window would you be able to select the thickness of line that you wanted for a brushstroke 6) Identify the purpose and intended audience for a diagram showing a businessrsquos marketing plan 7) Name two characteristics of well-designed schematic diagrams 8) Identify four steps involved in designing schematic diagrams 9) Why is it important to use conventionally accepted and familiar shapes and symbols in your schematic diagrams
Foundation Computing
Basic Schematic Diagrams 5957docx Page 53
Self Test Answers 1) This flow chart is supposed to show police officers how to get a suspect to confess to a crime
START
Confidently accuse
suspect of crime
Describe a
scenario that
enables suspect
to admit guiltAllow suspect to
voice objections
Invade suspectrsquos
personal space
Suspect becomes
uncomfortable
Suspect
doesnrsquot
deny guilt
Suspect
denies guilt
No reaction
Elicit confession
Rephrase objections as
confessions
FINISH
Random shapes are meaningless and confusing ndash use conventional flow chart symbols
Stages of process are not clear ndash arrange shapes top to bottom with options at each stage branching off to side at same level
Connectors that are either straight or curved would be more consistent
Labels are clear
Text uses consistent font and size
Foundation Computing
Basic Schematic Diagrams 5957docx Page 54
2) The following diagram is an organisation chart for Widget Enterprises
John Smith
MANAGER
Seth Drew
IT MANAGER
May Furur
SECRETARY
Judith Holland
CUSTOMER SERVICES manager
Jad Ling
HELPDESK
Harry Petal
FINANCIAL MANAGER
Wanda Springer
MARKETING
MANAGER
Bob Smithells
CLEANER
Kelly Inlerl
MARKETING ASSISTANT
Beryl Thin
CUSTOMER SERVICES ASSISTANTValda Rigley
CUSTOMER
SERVICES
ASSISTANT
Levi Quayle
COMPUTER
TECHNICIAN
No clear levels to hierarchy ndash organise so that diagram reads top to bottom and positions at similar level are in same horizontal space
Different sized boxes and borders on some boxes are meaningless ndash need consistent style for similar elements
Connectors cross over each other and boxes overlap ndash arrange space to avoid this
Text size and font is mostly consistent but one typo needs correcting
3) Which of the following computer applications can be used to create schematic diagrams
a) Microsoft Visio
b) Microsoft Paint
c) Microsoft Word
d) All of the above correct
4) Which frequently used shapes does the Microsoft Paint Tool bar contain templates for
Polygon rectangle ovalellipse
Foundation Computing
Basic Schematic Diagrams 5957docx Page 55
5) Where in the Microsoft Paint window would you be able to select the thickness of line that you wanted for a brushstroke
Options area below the Toolbar
6) Identify the purpose and intended audience for a diagram showing a businessrsquos marketing plan
The purpose would be to provide an overview of the businessrsquos marketing strategy Audience could include management and employees of the business especially the Marketing department potential investors shareholders and directors of the business
7) Name two characteristics of well-designed schematic diagrams Any of simple easy for the target audience to understand include all relevant elements or parts of the process clear and logical connections between elements accurate 8) Identify four steps involved in designing schematic diagrams Gather information organise information make connections between elements test your diagram 9) Why is it important to use conventionally accepted and familiar shapes and
symbols in your schematic diagrams So that the diagram will be easily understood by the target audience
Foundation Computing
Basic Schematic Diagrams 5957docx Page 56
References httpwindowsmicrosoftcomen-NZwindows7Getting-started-with-Paint accessed Sat 5th December in Timaru New Zealand httpenwikipediaorgwikiSchematic_diagrams accessed Sat 5th December in Timaru New Zealand httpenwikipediaorgwikiSymbol accessed Sat 5th December in Timaru New Zealand
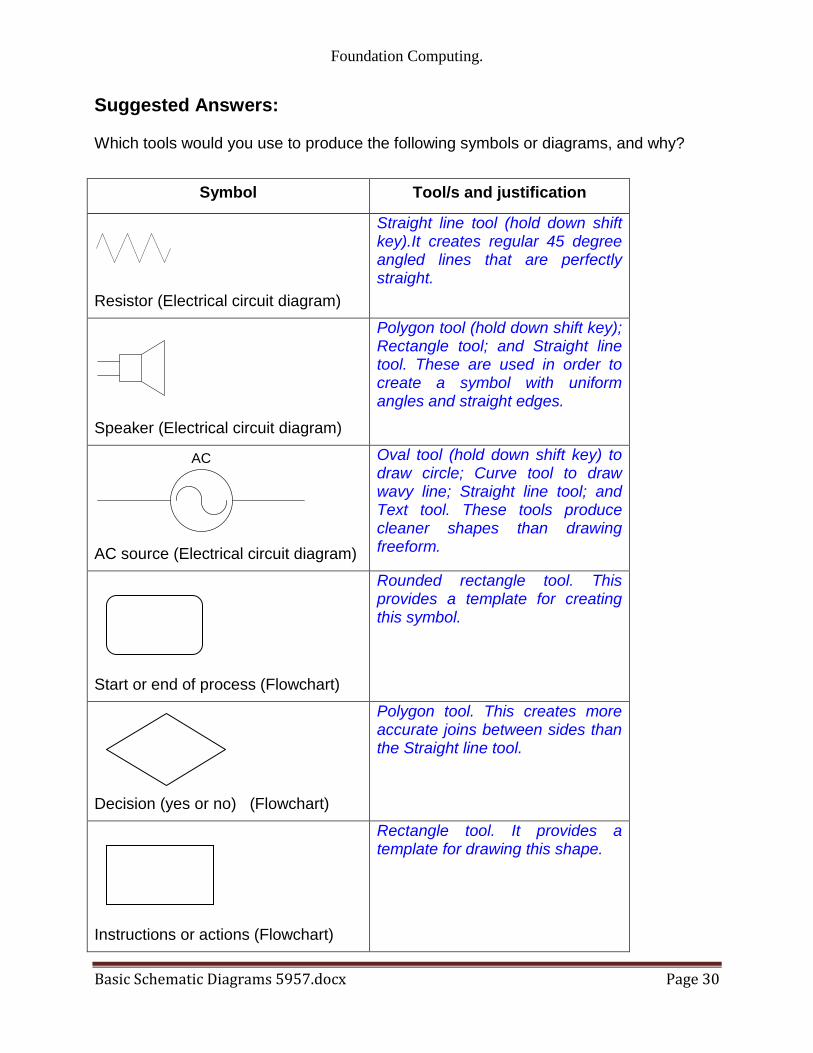
Foundation Computing
Basic Schematic Diagrams 5957docx Page 30
Suggested Answers Which tools would you use to produce the following symbols or diagrams and why
Symbol Tools and justification
Resistor (Electrical circuit diagram)
Straight line tool (hold down shift key)It creates regular 45 degree angled lines that are perfectly straight
Speaker (Electrical circuit diagram)
Polygon tool (hold down shift key) Rectangle tool and Straight line tool These are used in order to create a symbol with uniform angles and straight edges
AC
AC source (Electrical circuit diagram)
Oval tool (hold down shift key) to draw circle Curve tool to draw wavy line Straight line tool and Text tool These tools produce cleaner shapes than drawing freeform
Start or end of process (Flowchart)
Rounded rectangle tool This provides a template for creating this symbol
Decision (yes or no) (Flowchart)
Polygon tool This creates more accurate joins between sides than the Straight line tool
Instructions or actions (Flowchart)
Rectangle tool It provides a template for drawing this shape
Foundation Computing
Basic Schematic Diagrams 5957docx Page 31
Symbol Tools and justification
Document produced (Flowchart)
Line tool and Curve tool ndash need two tools in MSPaint other applications may have a template for this shape
Data entered or received (Flowchart)
Polygon tool ndash better than Straight line tool because can produce more regular shape
Foundation Computing
Basic Schematic Diagrams 5957docx Page 32
TOPIC 3 Getting started with MS Paint Sourced from httpwindowsmicrosoftcomen-NZwindows7Getting-started-with-Paint MS Paint is a feature in Windows that you can use to draw colour and edit pictures You can use Paint like a digital sketchpad to make simple pictures creative projects or to add text and designs to other pictures such as those taken with your digital camera The parts of Paint Open Paint by clicking the Start button clicking All Programs clicking Accessories and then clicking Paint When you start Paint youll see an empty window drawing and painting tools are located in the ribbon at the top of the window The following illustration shows the different parts of the Paint window
The Paint window
Foundation Computing
Basic Schematic Diagrams 5957docx Page 33
Working with tools The ribbon in Paint includes a handy collection of drawing tools You can use these tools to create freehand drawings and add a variety of shapes to your pictures This section describes some common tasks For more detailed information on how to use the different tools in Paint see Using Paint Draw a line Some tools and shapes such as the Pencil Brush Line and Curve let you make a variety of straight curved and squiggly lines What you draw is determined by how you move the mouse as you draw You can use the Line to draw a straight line for example
1) On the Home tab in the Shapes group click the Line 2) In the Colors group click Color 1 and then click the color you want to use 3) To draw drag the pointer across the drawing area
Draw a squiggly line Your drawings dont have to be composed of only straight lines The Pencil and Brushes can be used to make completely random free-form shapes
1) On the Home tab in the Tools group click the Pencil tool 2) In the Colors group click Color 1 and then click the color you want to use 3) To draw drag the pointer across the drawing area and make a squiggly line
Note If you want to make a line that has a different appearance use one of the Brushes instead Draw a shape Paint lets you draw many different shapes For example you can draw ready-made defined shapes such as rectangles circles squares triangles and arrows (to name a
few) You can also make your own custom shape by using the Polygon shape to draw a polygon which is a shape that can have any number of sides
1) On the Home tab in the Shapes group click a ready-made shape such as the
Rectangle 2) To add a ready-made shape drag the pointer across the drawing area to make
the shape 3) To change the outline style in the Shapes group click Outline and then click an
outline style 4) If you dont want your shape to have an outline click No outline 5) In the Colors group click Color 1 and then click a color for the outline 6) In the Colors group click Color 2 and then click a color to use to fill the shape 7) To change the fill style in the Shapes group click Fill and then click a fill style 8) If you dont want your shape to be filled click No fill
Foundation Computing
Basic Schematic Diagrams 5957docx Page 34
Add text You can also add text to your picture The Text tool lets you add a simple message or title
1) On the Home tab in the Tools group click the Text tool 2) Drag the pointer in the drawing area where you want to add text 3) Under Text Tools on the Text tab click the font face size and style in the Font
group The Font group
4) In the Colors group click Color 1 and then click a color This is the text color 5) Type the text that you want to add
Erase part of your picture If you make a mistake or need to change part of a picture use the eraser By default the eraser changes any area you erase to white but you can change the eraser color For example if you set the background color to yellow anything you erase turns to yellow
1) On the Home tab in the Tools group click the Eraser tool 2) In the Colors group click Color 2 and then click the color that you want to erase
with If you want to erase with white you dont have to select a color 3) Drag the pointer over the area you want to erase
Saving a picture Save your picture frequently so you dont accidentally lose your work To save click the
Paint button and then click Save This saves all of the changes made to the picture since the last time you saved The very first time that you save a new picture you will need to give your picture a file name Follow these steps
1) Click the Paint button and then click Save 2) In the Save as type box select the file format you want 3) In the File name box type a name and then click Save
Foundation Computing
Basic Schematic Diagrams 5957docx Page 35
Topic 4 Designing your diagram Although there are many different types of schematic diagrams the basic process and principles involved in designing a clear and coherent diagram are similar The principles apply to designing an electrical circuit diagram an organisation chart a mind map a flow chart and many other diagrams Some of these principles are also worth applying to other disciplines such as designing a Web page Letrsquos work step-by-step through the process of creating a flow chart to help people make money selling things on an on-line auction site such as wwwtrademeconz or wwwebaycom
Step 1 Gather your information Start by brainstorming all the information you need to include in your diagram Write down everything you think might be important or should be included
trademe
choose things that
sell
good photograph
feedback
keep track
prompt answers
postage
auction length
similar listings
postal system
setting reserve
describing item
correct category
re-listing
fixed offers
Look at the information you have gathered and think about your target audience Highlight the information that is most important to your target audience Cross out any irrelevant information Put question marks next to information that you are unsure about or may be able to leave out
Foundation Computing
Basic Schematic Diagrams 5957docx Page 36
Step 2 Organise your information Take the information that you have left and sort through it How you organise your information will depend on the type of diagram you are designing For example an organisationrsquos chart usually has different levels and shows who its members report to so you might group people by department and by level A flow chart like the example wersquore creating usually shows a process Information is grouped in the order we would use it If any other steps or information occurs to you as you are organising your information add them in Herersquos an example of how the key steps involved in selling on trademe could be ordered
Choose items that sell
Look at similar listings
Decide on a reserve price
Take a clear photograph
Identify your target audience
Write a clear description
Upload your item
Choose the correct category
Monitor watchers bids and views
Lower your reserve
Fixed price offers
Relist
Step 3 Make connections Once the elements are grouped or arranged in a logical order a clearer picture of the process or system you are representing in your diagram should start to emerge However unlike a list which usually reads from top to bottom only a diagram can show connections in many different directions and working out the links between elements is an essential part of designing a coherent diagram At this stage of the design process it is helpful to sketch out a basic plan of the elements you want to include and the flow-lines or connections between them In order to work out the connections between the elements ask questions such as What happens ifhellip What do I do beforeafter this What decisions need to be made now What actions need to be taken Use arrows to show connections between elements group elements that are part of the same stage or level of the process next to or near to each other and use shapes to show which elements are similar to each other eg diamonds for decisions rectangles for instructions or actions Make up your own meanings for shapes if necessary but be sure to use them consistently
Foundation Computing
Basic Schematic Diagrams 5957docx Page 37
The flow chart below shows how our list of elements above changes and gets re-ordered as we ask these questions and organise the information into a logical and coherent diagram
Decide on your
reserve price
START
Relist
Take a photo that is
clear and item looks
good
Decide on your
ideal buyer
Write a description
of your item
highlighting its
benefits for your
buyer
Upload your item in
a category your
buyer is likely to be
looking in
Monitor how many
views watchers and
bids your item gets
Lower your reserve
Item meets reserve
and sellsItem doesnrsquot sell
Offer to watchers for
your reserve
Decide what you
want to sell
Check what similar
items are currently
selling for
Lots of views but
no watchers
No interestFINISH
Foundation Computing
Basic Schematic Diagrams 5957docx Page 38
Step 4 Test your diagram The final step in designing your diagram is checking that it is as effective as possible To do this you should work through each stage step by step challenging it as you go Picture the process in your mind as you follow the links checking that you have included all the actions and decisions required that they are in the correct order and that no steps are duplicated Once yoursquore confident that the diagram is correct look at it again critically to see if you can improve it or clarify it Is there anywhere you can simplify it by removing unnecessary steps Is there anywhere that seems vague and would be easier to understand if you added a step or a connector Now imagine that you are a member of your target audience For a moment try to forget everything you know about the system or process you have designed a diagram for except for what your target audience knows Look at the diagram with fresh eyes does it make sense to you now Does anything seem odd confusing or out of place Finally look at the layout of your diagram Is it easy to read and follow Have you used shapes texts and arrows consistently Are your shapes and texts uniform and lined up properly Are your connectors clearly defined or are they criss-crossing all over each other Check the spelling of labels carefully ndash go through letter by letter to make sure all names and technical or unfamiliar terms are correct
Discussion With a partner look critically at our example diagram above Discuss any parts of it that you think could be better and any changes you would make to improve the readability of the flow chart Make note on the flow chart above of any areas that you think could be improved Share your answers with the rest of the class
Foundation Computing
Basic Schematic Diagrams 5957docx Page 39
Self Test 1) Mr Biggles owns Biggles Air Supplies a company that makes aircraft supplies He asks you to create an organisation chart for his company He gives you the following list of all his employees and who they report to
Mr James Biggles Chief Executive Officer
Jane Doep Personal Assistant to CEO
Mrs Monica Stepworth Financial Manager (reports to CEO)
Judith Zantes Accountant (reports to Financial Manager)
Mary Smallville Accountant (reports to Financial Manager)
Janey Poretuna Admin Assistant (reports to Judith Zantes)
Mickey Laluevu IT technician (reports to Financial Manager)
Mr Hank Johnson Operations Manager (reports to CEO)
Frank Hapil Engineering Manager (reports to Operations Manager)
Joe Smither Engineering Supervisor (reports to Engineering Manager)
Howie Fartherton Engineering Technician (reports to Engineering Supervisor)
Ernie Jusef Engineering Technician (reports to Engineering Supervisor)
Rob Luxemburg Apprentice Technician (reports to Ernie Jusef)
Harry Monahan Interiors Manager (reports to Operations Manager)
Barney Jokka Interiors Technician (reports to Interiors Supervisor) Design an organisation chart for Biggles Air Supplies and draw it in the space below
2) Think of a simple process that has at least five steps and involves some form of feedback or choice For example operating a vending machine topping up your mobile phone using EFTPOS checking messages on an answering machine
Design a flow chart to represent your process
Foundation Computing
Basic Schematic Diagrams 5957docx Page 40
Self Test Answers
1) Mr Biggles owns Biggles Air Supplies a company that makes aircraft supplies He asks you to create an organisation chart for his company He gives you the following list of all his employees and who they report to
Mr James Biggles Chief Executive Officer
Jane Doep Personal Assistant to CEO
Mrs Monica Stepworth Financial Manager (reports to CEO)
Judith Zantes Accountant (reports to Financial Manager)
Mary Smallville Accountant (reports to Financial Manager)
Janey Poretuna Admin Assistant (reports to Judith Zantes)
Mickey Laluevu IT technician (reports to Financial Manager)
Mr Hank Johnson Operations Manager (reports to CEO)
Frank Hapil Engineering Manager (reports to Operations Manager)
Joe Smither Engineering Supervisor (reports to Engineering Manager)
Howie Fartherton Engineering Technician (reports to Engineering Supervisor)
Ernie Jusef Engineering Technician (reports to Engineering Supervisor)
Rob Luxemburg Apprentice Technician (reports to Ernie Jusef)
Harry Monahan Interiors Manager (reports to Operations Manager)
Barney Jokka Interiors Technician (reports to Interiors Supervisor) Design an organisation chart for Biggles Air Supplies and draw it in the space below
Mr James Biggles
CEO
Jane Doep
Personal
Assistant
Mrs Monica Stepworth
Financial Manager
Judith Zantes
Accountant
Janey Poretuna
Admin Assistant
Mary Smallville
Accountant
Mickey Laluevu
IT technician
Mr Hank Johnson
Operations Manager
Frank Hapil
Engineering
Manager
Harry Monahan
Interiors Manager
Joe Smither
Engineering
Supervisor
Howie Fartherton
Engineering
Technician
Ernie Jusef
Engineering
Technician
Rob Luxemburg
Apprentice
Technician
Barney Jokka
Interiors
Technician
Foundation Computing
Basic Schematic Diagrams 5957docx Page 41
2) Think of a simple process that has at least five steps and involves some form of feedback or choice For example operating a vending machine topping up your mobile phone using EFTPOS checking messages on an answering machine
Design a flow chart to represent your process
Dial 06345
Enter your dialing code and
phone number followed by
the key
Dial number for
service you require
Listen to saved messagesListen to new messages
Dial number for
service you require
Save message Delete message
START
FINISH
Dial 2
Dial 1
Dial 1
Dial 2
Dial 1
Dial 2
Foundation Computing
Basic Schematic Diagrams 5957docx Page 42
Foundation Computing
Basic Schematic Diagrams 5957docx Page 43
Part 2
Produce schematic diagrams from a given brief using a computer application
OBJECTIVES
On successful completion of this section you will be able to Produce schematic diagrams from a given brief using a computer application
Performance criteria
21 The symbols used in each diagram are consistent with the type of diagram and the specifications of the brief
22 The final diagram is readable clearly illustrates the object being diagrammed
and is consistent with the specifications of the brief
TOPICS
Topic 1 Symbols used are consistent with diagram type and specifications Topic 2 Diagram is clear readable and consistent with specifications
Self Test
Self Test Answers
Foundation Computing
Basic Schematic Diagrams 5957docx Page 44
TOPIC 1 Symbols used are consistent with diagram type and specifications A symbol is something such as an object picture written word sound or particular mark that represents something else by association resemblance or convention For example a red octagon may be a symbol for STOP On maps crossed sabres may indicate a battlefield Numerals are symbols for numbers All language consists of symbols The word cat is not a cat but is an arbitrary symbol representing the idea of a cat There are many symbols for many things Examples range from Peace Pipe Red Cross to Electrical symbols It is good when doing schematic drawings to use symbols that are clearly recognised and interpreted Symbols that have been internationally standardised are the best Circuit diagram symbols have differed from country to country and have changed over time They are now to a large extent internationally standardized Simple components often had symbols intended to represent some feature of the physical construction of the device There are several national and international standards for graphical symbols in circuit diagrams in particular
IEC 60617 (also known as British Standard BS 3939)
ANSI standard Y32 (also known as IEEE Std 315) IEC 60617 originally consisted of 13 parts from resistors and capacitors to logic symbols and even a generalised drawing standard of connections and bus line widths It is now published as a subscription online database IEC 60617-DB Different symbols may be used depending on the discipline using the drawing for example lighting and power symbols used as part of architectural drawings may be different from symbols for devices used in electronics Different electronic components have different characteristics it is necessary to distinguish between them in any circuit diagram Of course we could use the block diagram approach and just identify each component with words Unfortunately this takes up a lot of space and makes the overall diagram harder to recognize or understand quickly We need a way to understand electrical diagrams far more quickly and easily
Foundation Computing
Basic Schematic Diagrams 5957docx Page 45
The answer is to use schematic symbols to represent electronic components as shown in the diagram below In this diagram we show the schematic symbol of a battery as the electrical source and the symbol of a resistor as the load Even without the words and arrows the symbols define exactly what this circuit is and how it behaves
Some good procedures to follow with symbols include
Using templates for frequently used symbols
Use symbols consistently
Use a library of symbols such as from IEC 60617-DB
Foundation Computing
Basic Schematic Diagrams 5957docx Page 46
TOPIC 2 Diagram is clear readable and consistent with specifications Creating a simple diagram using MSPaint To start with letrsquos create a simple flow chart representing the stages in designing a schematic diagram There are four stages in this process
1) Gather your information 2) Organise your information 3) Make connections 4) Test your diagram
Our flow chart will consist of four rectangles arranged vertically with downward pointing arrows as connectors A rounded rectangle at the top and at the bottom of the flowchart will indicate START and FINISH respectively Step by step
Open Microsoft Paint
Click on the Rectangle tool then click and drag in the drawing area to draw a rectangle
Repeat this step to draw four boxes in the drawing area OR click on the Select tool and click and drag to select the first rectangle then right-click to copy and paste three more rectangles the same size in the drawing area
Foundation Computing
Basic Schematic Diagrams 5957docx Page 47
Using the Rounded Rectangle tool draw a rounded rectangle at the top and bottom of your flow chart
Foundation Computing
Basic Schematic Diagrams 5957docx Page 48
Use the Line tool to draw arrows between each box In the Options area under the Tool bar you can choose the thickness of line that you want to use Remember too that if you hold down the Shift key on the keyboard while you are drawing a line you can create a 45 degree angle
Use the Text tool to add text to the shapes by clicking on the Text tool clicking and dragging to create a textbox inside your shape then typing your text Check your spelling carefully letter by letter as you go
Foundation Computing
Basic Schematic Diagrams 5957docx Page 49
The basic flowchart created in Microsoft Paint could look something like this
Foundation Computing
Basic Schematic Diagrams 5957docx Page 50
Common problems with diagrams Even well-designed schematic diagrams will be difficult for the target audience to read and understand if symbols are used inconsistently or the layout of the diagram is unfamiliar For example if a flowchart has different shapes used for each element and different types of arrows used randomly it will be more difficult for readers to see the overall direction and meaning of the diagram If the shapes on an organisation chart are different sizes and randomly positioned with no clear levels or hierarchy the diagram will not provide a clear overview of the organisationrsquos structure If an electrical circuit diagram has unfamiliar symbols used for elements such as switches resistors and batteries then it will not make sense to its intended audience
Tips for improving the readability of your schematic diagrams
Use symbols and shapes consistently ie elements that are similar should have the same symbol or shape
Avoid having connectors crossing over each other
Avoid having symbols or shapes overlapping
Use arrows on connectors or flow lines to indicate direction
Use colours text size and font consistently
Diagrams that can be read top-to-bottom and left-to-right are easier to read
In a process diagram have only one connector leading into a symbol but have more coming out where necessary to indicate different directions or decisions
Diagrams for a technical audience such as electrical or computer programming schematics should follow accepted conventions for symbols and layout
Diagrams indicating a hierarchy of positions ideas or stages are clearer if elements belonging to the same level are a similar shape size and position on the page
Keep labels as clear and as brief as possible Carefully check the spelling of all names and labels letter by letter ndash errors in the spelling of names or scientific and technical terms look unprofessional and can be confusing for readers
Foundation Computing
Basic Schematic Diagrams 5957docx Page 51
Self Test Look at the schematic diagrams that follow Make notes under each example of what is wrong with the diagram what is right about the diagram and what could be changed to make it clear and meaningful to its intended audience 1) This flow chart is supposed to show police officers how to get a suspect to confess to a crime
START
Confidently accuse
suspect of crime
Describe a
scenario that
enables suspect
to admit guiltAllow suspect to
voice objections
Invade suspectrsquos
personal space
Suspect becomes
uncomfortable
Suspect
doesnrsquot
deny guilt
Suspect
denies guilt
No reaction
Elicit confession
Rephrase objections as
confessions
FINISH
Foundation Computing
Basic Schematic Diagrams 5957docx Page 52
2) The following diagram is an organisation chart for Widget Enterprises
John Smith
MANAGER
Seth Drew
IT MANAGER
May Furur
SECRETARY
Judith Holland
CUSTOMER SERVICES manager
Jad Ling
HELPDESK
Harry Petal
FINANCIAL MANAGER
Wanda Springer
MARKETING
MANAGER
Bob Smithells
CLEANER
Kelly Inlerl
MARKETING ASSISTANT
Beryl Thin
CUSTOMER SERVICES ASSISTANTValda Rigley
CUSTOMER
SERVICES
ASSISTANT
Levi Quayle
COMPUTER
TECHNICIAN
3) Which of the following computer applications can be used to create schematic diagrams
a) Microsoft Visio
b) Microsoft Paint
c) Microsoft Word
d) All of the above
4) Which frequently used shapes does the Microsoft Paint Tool bar contain templates for
5) Where in the Microsoft Paint window would you be able to select the thickness of line that you wanted for a brushstroke 6) Identify the purpose and intended audience for a diagram showing a businessrsquos marketing plan 7) Name two characteristics of well-designed schematic diagrams 8) Identify four steps involved in designing schematic diagrams 9) Why is it important to use conventionally accepted and familiar shapes and symbols in your schematic diagrams
Foundation Computing
Basic Schematic Diagrams 5957docx Page 53
Self Test Answers 1) This flow chart is supposed to show police officers how to get a suspect to confess to a crime
START
Confidently accuse
suspect of crime
Describe a
scenario that
enables suspect
to admit guiltAllow suspect to
voice objections
Invade suspectrsquos
personal space
Suspect becomes
uncomfortable
Suspect
doesnrsquot
deny guilt
Suspect
denies guilt
No reaction
Elicit confession
Rephrase objections as
confessions
FINISH
Random shapes are meaningless and confusing ndash use conventional flow chart symbols
Stages of process are not clear ndash arrange shapes top to bottom with options at each stage branching off to side at same level
Connectors that are either straight or curved would be more consistent
Labels are clear
Text uses consistent font and size
Foundation Computing
Basic Schematic Diagrams 5957docx Page 54
2) The following diagram is an organisation chart for Widget Enterprises
John Smith
MANAGER
Seth Drew
IT MANAGER
May Furur
SECRETARY
Judith Holland
CUSTOMER SERVICES manager
Jad Ling
HELPDESK
Harry Petal
FINANCIAL MANAGER
Wanda Springer
MARKETING
MANAGER
Bob Smithells
CLEANER
Kelly Inlerl
MARKETING ASSISTANT
Beryl Thin
CUSTOMER SERVICES ASSISTANTValda Rigley
CUSTOMER
SERVICES
ASSISTANT
Levi Quayle
COMPUTER
TECHNICIAN
No clear levels to hierarchy ndash organise so that diagram reads top to bottom and positions at similar level are in same horizontal space
Different sized boxes and borders on some boxes are meaningless ndash need consistent style for similar elements
Connectors cross over each other and boxes overlap ndash arrange space to avoid this
Text size and font is mostly consistent but one typo needs correcting
3) Which of the following computer applications can be used to create schematic diagrams
a) Microsoft Visio
b) Microsoft Paint
c) Microsoft Word
d) All of the above correct
4) Which frequently used shapes does the Microsoft Paint Tool bar contain templates for
Polygon rectangle ovalellipse
Foundation Computing
Basic Schematic Diagrams 5957docx Page 55
5) Where in the Microsoft Paint window would you be able to select the thickness of line that you wanted for a brushstroke
Options area below the Toolbar
6) Identify the purpose and intended audience for a diagram showing a businessrsquos marketing plan
The purpose would be to provide an overview of the businessrsquos marketing strategy Audience could include management and employees of the business especially the Marketing department potential investors shareholders and directors of the business
7) Name two characteristics of well-designed schematic diagrams Any of simple easy for the target audience to understand include all relevant elements or parts of the process clear and logical connections between elements accurate 8) Identify four steps involved in designing schematic diagrams Gather information organise information make connections between elements test your diagram 9) Why is it important to use conventionally accepted and familiar shapes and
symbols in your schematic diagrams So that the diagram will be easily understood by the target audience
Foundation Computing
Basic Schematic Diagrams 5957docx Page 56
References httpwindowsmicrosoftcomen-NZwindows7Getting-started-with-Paint accessed Sat 5th December in Timaru New Zealand httpenwikipediaorgwikiSchematic_diagrams accessed Sat 5th December in Timaru New Zealand httpenwikipediaorgwikiSymbol accessed Sat 5th December in Timaru New Zealand
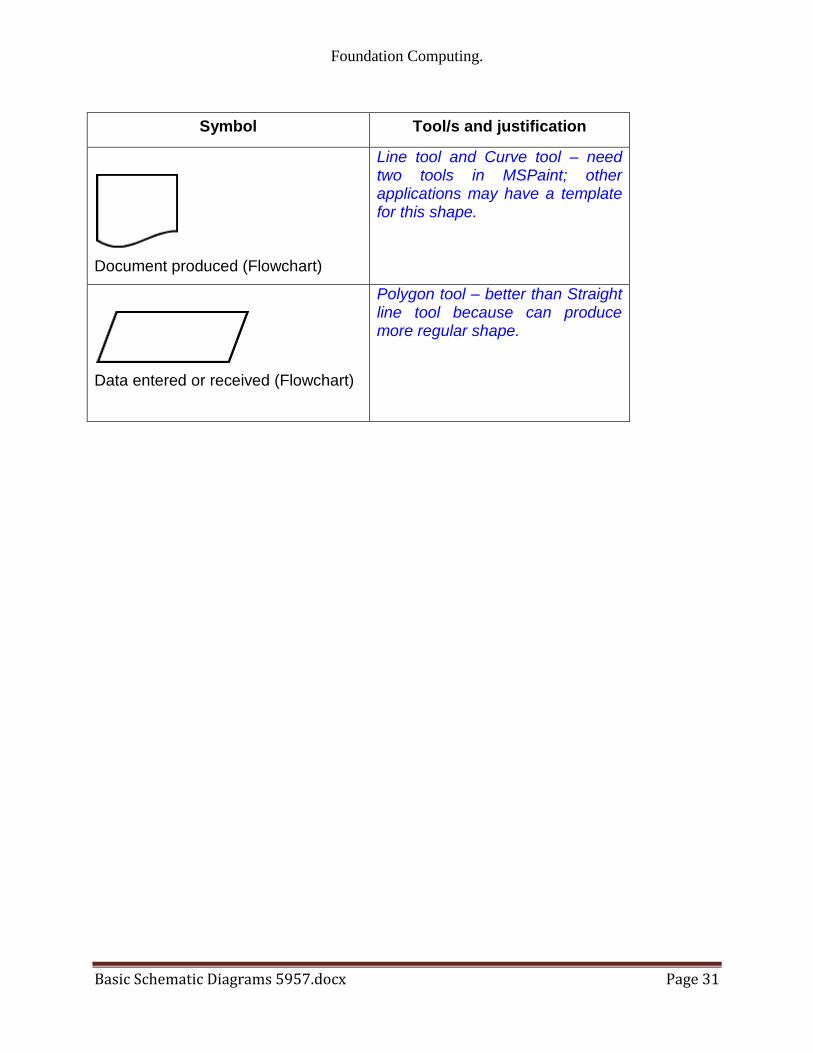
Foundation Computing
Basic Schematic Diagrams 5957docx Page 31
Symbol Tools and justification
Document produced (Flowchart)
Line tool and Curve tool ndash need two tools in MSPaint other applications may have a template for this shape
Data entered or received (Flowchart)
Polygon tool ndash better than Straight line tool because can produce more regular shape
Foundation Computing
Basic Schematic Diagrams 5957docx Page 32
TOPIC 3 Getting started with MS Paint Sourced from httpwindowsmicrosoftcomen-NZwindows7Getting-started-with-Paint MS Paint is a feature in Windows that you can use to draw colour and edit pictures You can use Paint like a digital sketchpad to make simple pictures creative projects or to add text and designs to other pictures such as those taken with your digital camera The parts of Paint Open Paint by clicking the Start button clicking All Programs clicking Accessories and then clicking Paint When you start Paint youll see an empty window drawing and painting tools are located in the ribbon at the top of the window The following illustration shows the different parts of the Paint window
The Paint window
Foundation Computing
Basic Schematic Diagrams 5957docx Page 33
Working with tools The ribbon in Paint includes a handy collection of drawing tools You can use these tools to create freehand drawings and add a variety of shapes to your pictures This section describes some common tasks For more detailed information on how to use the different tools in Paint see Using Paint Draw a line Some tools and shapes such as the Pencil Brush Line and Curve let you make a variety of straight curved and squiggly lines What you draw is determined by how you move the mouse as you draw You can use the Line to draw a straight line for example
1) On the Home tab in the Shapes group click the Line 2) In the Colors group click Color 1 and then click the color you want to use 3) To draw drag the pointer across the drawing area
Draw a squiggly line Your drawings dont have to be composed of only straight lines The Pencil and Brushes can be used to make completely random free-form shapes
1) On the Home tab in the Tools group click the Pencil tool 2) In the Colors group click Color 1 and then click the color you want to use 3) To draw drag the pointer across the drawing area and make a squiggly line
Note If you want to make a line that has a different appearance use one of the Brushes instead Draw a shape Paint lets you draw many different shapes For example you can draw ready-made defined shapes such as rectangles circles squares triangles and arrows (to name a
few) You can also make your own custom shape by using the Polygon shape to draw a polygon which is a shape that can have any number of sides
1) On the Home tab in the Shapes group click a ready-made shape such as the
Rectangle 2) To add a ready-made shape drag the pointer across the drawing area to make
the shape 3) To change the outline style in the Shapes group click Outline and then click an
outline style 4) If you dont want your shape to have an outline click No outline 5) In the Colors group click Color 1 and then click a color for the outline 6) In the Colors group click Color 2 and then click a color to use to fill the shape 7) To change the fill style in the Shapes group click Fill and then click a fill style 8) If you dont want your shape to be filled click No fill
Foundation Computing
Basic Schematic Diagrams 5957docx Page 34
Add text You can also add text to your picture The Text tool lets you add a simple message or title
1) On the Home tab in the Tools group click the Text tool 2) Drag the pointer in the drawing area where you want to add text 3) Under Text Tools on the Text tab click the font face size and style in the Font
group The Font group
4) In the Colors group click Color 1 and then click a color This is the text color 5) Type the text that you want to add
Erase part of your picture If you make a mistake or need to change part of a picture use the eraser By default the eraser changes any area you erase to white but you can change the eraser color For example if you set the background color to yellow anything you erase turns to yellow
1) On the Home tab in the Tools group click the Eraser tool 2) In the Colors group click Color 2 and then click the color that you want to erase
with If you want to erase with white you dont have to select a color 3) Drag the pointer over the area you want to erase
Saving a picture Save your picture frequently so you dont accidentally lose your work To save click the
Paint button and then click Save This saves all of the changes made to the picture since the last time you saved The very first time that you save a new picture you will need to give your picture a file name Follow these steps
1) Click the Paint button and then click Save 2) In the Save as type box select the file format you want 3) In the File name box type a name and then click Save
Foundation Computing
Basic Schematic Diagrams 5957docx Page 35
Topic 4 Designing your diagram Although there are many different types of schematic diagrams the basic process and principles involved in designing a clear and coherent diagram are similar The principles apply to designing an electrical circuit diagram an organisation chart a mind map a flow chart and many other diagrams Some of these principles are also worth applying to other disciplines such as designing a Web page Letrsquos work step-by-step through the process of creating a flow chart to help people make money selling things on an on-line auction site such as wwwtrademeconz or wwwebaycom
Step 1 Gather your information Start by brainstorming all the information you need to include in your diagram Write down everything you think might be important or should be included
trademe
choose things that
sell
good photograph
feedback
keep track
prompt answers
postage
auction length
similar listings
postal system
setting reserve
describing item
correct category
re-listing
fixed offers
Look at the information you have gathered and think about your target audience Highlight the information that is most important to your target audience Cross out any irrelevant information Put question marks next to information that you are unsure about or may be able to leave out
Foundation Computing
Basic Schematic Diagrams 5957docx Page 36
Step 2 Organise your information Take the information that you have left and sort through it How you organise your information will depend on the type of diagram you are designing For example an organisationrsquos chart usually has different levels and shows who its members report to so you might group people by department and by level A flow chart like the example wersquore creating usually shows a process Information is grouped in the order we would use it If any other steps or information occurs to you as you are organising your information add them in Herersquos an example of how the key steps involved in selling on trademe could be ordered
Choose items that sell
Look at similar listings
Decide on a reserve price
Take a clear photograph
Identify your target audience
Write a clear description
Upload your item
Choose the correct category
Monitor watchers bids and views
Lower your reserve
Fixed price offers
Relist
Step 3 Make connections Once the elements are grouped or arranged in a logical order a clearer picture of the process or system you are representing in your diagram should start to emerge However unlike a list which usually reads from top to bottom only a diagram can show connections in many different directions and working out the links between elements is an essential part of designing a coherent diagram At this stage of the design process it is helpful to sketch out a basic plan of the elements you want to include and the flow-lines or connections between them In order to work out the connections between the elements ask questions such as What happens ifhellip What do I do beforeafter this What decisions need to be made now What actions need to be taken Use arrows to show connections between elements group elements that are part of the same stage or level of the process next to or near to each other and use shapes to show which elements are similar to each other eg diamonds for decisions rectangles for instructions or actions Make up your own meanings for shapes if necessary but be sure to use them consistently
Foundation Computing
Basic Schematic Diagrams 5957docx Page 37
The flow chart below shows how our list of elements above changes and gets re-ordered as we ask these questions and organise the information into a logical and coherent diagram
Decide on your
reserve price
START
Relist
Take a photo that is
clear and item looks
good
Decide on your
ideal buyer
Write a description
of your item
highlighting its
benefits for your
buyer
Upload your item in
a category your
buyer is likely to be
looking in
Monitor how many
views watchers and
bids your item gets
Lower your reserve
Item meets reserve
and sellsItem doesnrsquot sell
Offer to watchers for
your reserve
Decide what you
want to sell
Check what similar
items are currently
selling for
Lots of views but
no watchers
No interestFINISH
Foundation Computing
Basic Schematic Diagrams 5957docx Page 38
Step 4 Test your diagram The final step in designing your diagram is checking that it is as effective as possible To do this you should work through each stage step by step challenging it as you go Picture the process in your mind as you follow the links checking that you have included all the actions and decisions required that they are in the correct order and that no steps are duplicated Once yoursquore confident that the diagram is correct look at it again critically to see if you can improve it or clarify it Is there anywhere you can simplify it by removing unnecessary steps Is there anywhere that seems vague and would be easier to understand if you added a step or a connector Now imagine that you are a member of your target audience For a moment try to forget everything you know about the system or process you have designed a diagram for except for what your target audience knows Look at the diagram with fresh eyes does it make sense to you now Does anything seem odd confusing or out of place Finally look at the layout of your diagram Is it easy to read and follow Have you used shapes texts and arrows consistently Are your shapes and texts uniform and lined up properly Are your connectors clearly defined or are they criss-crossing all over each other Check the spelling of labels carefully ndash go through letter by letter to make sure all names and technical or unfamiliar terms are correct
Discussion With a partner look critically at our example diagram above Discuss any parts of it that you think could be better and any changes you would make to improve the readability of the flow chart Make note on the flow chart above of any areas that you think could be improved Share your answers with the rest of the class
Foundation Computing
Basic Schematic Diagrams 5957docx Page 39
Self Test 1) Mr Biggles owns Biggles Air Supplies a company that makes aircraft supplies He asks you to create an organisation chart for his company He gives you the following list of all his employees and who they report to
Mr James Biggles Chief Executive Officer
Jane Doep Personal Assistant to CEO
Mrs Monica Stepworth Financial Manager (reports to CEO)
Judith Zantes Accountant (reports to Financial Manager)
Mary Smallville Accountant (reports to Financial Manager)
Janey Poretuna Admin Assistant (reports to Judith Zantes)
Mickey Laluevu IT technician (reports to Financial Manager)
Mr Hank Johnson Operations Manager (reports to CEO)
Frank Hapil Engineering Manager (reports to Operations Manager)
Joe Smither Engineering Supervisor (reports to Engineering Manager)
Howie Fartherton Engineering Technician (reports to Engineering Supervisor)
Ernie Jusef Engineering Technician (reports to Engineering Supervisor)
Rob Luxemburg Apprentice Technician (reports to Ernie Jusef)
Harry Monahan Interiors Manager (reports to Operations Manager)
Barney Jokka Interiors Technician (reports to Interiors Supervisor) Design an organisation chart for Biggles Air Supplies and draw it in the space below
2) Think of a simple process that has at least five steps and involves some form of feedback or choice For example operating a vending machine topping up your mobile phone using EFTPOS checking messages on an answering machine
Design a flow chart to represent your process
Foundation Computing
Basic Schematic Diagrams 5957docx Page 40
Self Test Answers
1) Mr Biggles owns Biggles Air Supplies a company that makes aircraft supplies He asks you to create an organisation chart for his company He gives you the following list of all his employees and who they report to
Mr James Biggles Chief Executive Officer
Jane Doep Personal Assistant to CEO
Mrs Monica Stepworth Financial Manager (reports to CEO)
Judith Zantes Accountant (reports to Financial Manager)
Mary Smallville Accountant (reports to Financial Manager)
Janey Poretuna Admin Assistant (reports to Judith Zantes)
Mickey Laluevu IT technician (reports to Financial Manager)
Mr Hank Johnson Operations Manager (reports to CEO)
Frank Hapil Engineering Manager (reports to Operations Manager)
Joe Smither Engineering Supervisor (reports to Engineering Manager)
Howie Fartherton Engineering Technician (reports to Engineering Supervisor)
Ernie Jusef Engineering Technician (reports to Engineering Supervisor)
Rob Luxemburg Apprentice Technician (reports to Ernie Jusef)
Harry Monahan Interiors Manager (reports to Operations Manager)
Barney Jokka Interiors Technician (reports to Interiors Supervisor) Design an organisation chart for Biggles Air Supplies and draw it in the space below
Mr James Biggles
CEO
Jane Doep
Personal
Assistant
Mrs Monica Stepworth
Financial Manager
Judith Zantes
Accountant
Janey Poretuna
Admin Assistant
Mary Smallville
Accountant
Mickey Laluevu
IT technician
Mr Hank Johnson
Operations Manager
Frank Hapil
Engineering
Manager
Harry Monahan
Interiors Manager
Joe Smither
Engineering
Supervisor
Howie Fartherton
Engineering
Technician
Ernie Jusef
Engineering
Technician
Rob Luxemburg
Apprentice
Technician
Barney Jokka
Interiors
Technician
Foundation Computing
Basic Schematic Diagrams 5957docx Page 41
2) Think of a simple process that has at least five steps and involves some form of feedback or choice For example operating a vending machine topping up your mobile phone using EFTPOS checking messages on an answering machine
Design a flow chart to represent your process
Dial 06345
Enter your dialing code and
phone number followed by
the key
Dial number for
service you require
Listen to saved messagesListen to new messages
Dial number for
service you require
Save message Delete message
START
FINISH
Dial 2
Dial 1
Dial 1
Dial 2
Dial 1
Dial 2
Foundation Computing
Basic Schematic Diagrams 5957docx Page 42
Foundation Computing
Basic Schematic Diagrams 5957docx Page 43
Part 2
Produce schematic diagrams from a given brief using a computer application
OBJECTIVES
On successful completion of this section you will be able to Produce schematic diagrams from a given brief using a computer application
Performance criteria
21 The symbols used in each diagram are consistent with the type of diagram and the specifications of the brief
22 The final diagram is readable clearly illustrates the object being diagrammed
and is consistent with the specifications of the brief
TOPICS
Topic 1 Symbols used are consistent with diagram type and specifications Topic 2 Diagram is clear readable and consistent with specifications
Self Test
Self Test Answers
Foundation Computing
Basic Schematic Diagrams 5957docx Page 44
TOPIC 1 Symbols used are consistent with diagram type and specifications A symbol is something such as an object picture written word sound or particular mark that represents something else by association resemblance or convention For example a red octagon may be a symbol for STOP On maps crossed sabres may indicate a battlefield Numerals are symbols for numbers All language consists of symbols The word cat is not a cat but is an arbitrary symbol representing the idea of a cat There are many symbols for many things Examples range from Peace Pipe Red Cross to Electrical symbols It is good when doing schematic drawings to use symbols that are clearly recognised and interpreted Symbols that have been internationally standardised are the best Circuit diagram symbols have differed from country to country and have changed over time They are now to a large extent internationally standardized Simple components often had symbols intended to represent some feature of the physical construction of the device There are several national and international standards for graphical symbols in circuit diagrams in particular
IEC 60617 (also known as British Standard BS 3939)
ANSI standard Y32 (also known as IEEE Std 315) IEC 60617 originally consisted of 13 parts from resistors and capacitors to logic symbols and even a generalised drawing standard of connections and bus line widths It is now published as a subscription online database IEC 60617-DB Different symbols may be used depending on the discipline using the drawing for example lighting and power symbols used as part of architectural drawings may be different from symbols for devices used in electronics Different electronic components have different characteristics it is necessary to distinguish between them in any circuit diagram Of course we could use the block diagram approach and just identify each component with words Unfortunately this takes up a lot of space and makes the overall diagram harder to recognize or understand quickly We need a way to understand electrical diagrams far more quickly and easily
Foundation Computing
Basic Schematic Diagrams 5957docx Page 45
The answer is to use schematic symbols to represent electronic components as shown in the diagram below In this diagram we show the schematic symbol of a battery as the electrical source and the symbol of a resistor as the load Even without the words and arrows the symbols define exactly what this circuit is and how it behaves
Some good procedures to follow with symbols include
Using templates for frequently used symbols
Use symbols consistently
Use a library of symbols such as from IEC 60617-DB
Foundation Computing
Basic Schematic Diagrams 5957docx Page 46
TOPIC 2 Diagram is clear readable and consistent with specifications Creating a simple diagram using MSPaint To start with letrsquos create a simple flow chart representing the stages in designing a schematic diagram There are four stages in this process
1) Gather your information 2) Organise your information 3) Make connections 4) Test your diagram
Our flow chart will consist of four rectangles arranged vertically with downward pointing arrows as connectors A rounded rectangle at the top and at the bottom of the flowchart will indicate START and FINISH respectively Step by step
Open Microsoft Paint
Click on the Rectangle tool then click and drag in the drawing area to draw a rectangle
Repeat this step to draw four boxes in the drawing area OR click on the Select tool and click and drag to select the first rectangle then right-click to copy and paste three more rectangles the same size in the drawing area
Foundation Computing
Basic Schematic Diagrams 5957docx Page 47
Using the Rounded Rectangle tool draw a rounded rectangle at the top and bottom of your flow chart
Foundation Computing
Basic Schematic Diagrams 5957docx Page 48
Use the Line tool to draw arrows between each box In the Options area under the Tool bar you can choose the thickness of line that you want to use Remember too that if you hold down the Shift key on the keyboard while you are drawing a line you can create a 45 degree angle
Use the Text tool to add text to the shapes by clicking on the Text tool clicking and dragging to create a textbox inside your shape then typing your text Check your spelling carefully letter by letter as you go
Foundation Computing
Basic Schematic Diagrams 5957docx Page 49
The basic flowchart created in Microsoft Paint could look something like this
Foundation Computing
Basic Schematic Diagrams 5957docx Page 50
Common problems with diagrams Even well-designed schematic diagrams will be difficult for the target audience to read and understand if symbols are used inconsistently or the layout of the diagram is unfamiliar For example if a flowchart has different shapes used for each element and different types of arrows used randomly it will be more difficult for readers to see the overall direction and meaning of the diagram If the shapes on an organisation chart are different sizes and randomly positioned with no clear levels or hierarchy the diagram will not provide a clear overview of the organisationrsquos structure If an electrical circuit diagram has unfamiliar symbols used for elements such as switches resistors and batteries then it will not make sense to its intended audience
Tips for improving the readability of your schematic diagrams
Use symbols and shapes consistently ie elements that are similar should have the same symbol or shape
Avoid having connectors crossing over each other
Avoid having symbols or shapes overlapping
Use arrows on connectors or flow lines to indicate direction
Use colours text size and font consistently
Diagrams that can be read top-to-bottom and left-to-right are easier to read
In a process diagram have only one connector leading into a symbol but have more coming out where necessary to indicate different directions or decisions
Diagrams for a technical audience such as electrical or computer programming schematics should follow accepted conventions for symbols and layout
Diagrams indicating a hierarchy of positions ideas or stages are clearer if elements belonging to the same level are a similar shape size and position on the page
Keep labels as clear and as brief as possible Carefully check the spelling of all names and labels letter by letter ndash errors in the spelling of names or scientific and technical terms look unprofessional and can be confusing for readers
Foundation Computing
Basic Schematic Diagrams 5957docx Page 51
Self Test Look at the schematic diagrams that follow Make notes under each example of what is wrong with the diagram what is right about the diagram and what could be changed to make it clear and meaningful to its intended audience 1) This flow chart is supposed to show police officers how to get a suspect to confess to a crime
START
Confidently accuse
suspect of crime
Describe a
scenario that
enables suspect
to admit guiltAllow suspect to
voice objections
Invade suspectrsquos
personal space
Suspect becomes
uncomfortable
Suspect
doesnrsquot
deny guilt
Suspect
denies guilt
No reaction
Elicit confession
Rephrase objections as
confessions
FINISH
Foundation Computing
Basic Schematic Diagrams 5957docx Page 52
2) The following diagram is an organisation chart for Widget Enterprises
John Smith
MANAGER
Seth Drew
IT MANAGER
May Furur
SECRETARY
Judith Holland
CUSTOMER SERVICES manager
Jad Ling
HELPDESK
Harry Petal
FINANCIAL MANAGER
Wanda Springer
MARKETING
MANAGER
Bob Smithells
CLEANER
Kelly Inlerl
MARKETING ASSISTANT
Beryl Thin
CUSTOMER SERVICES ASSISTANTValda Rigley
CUSTOMER
SERVICES
ASSISTANT
Levi Quayle
COMPUTER
TECHNICIAN
3) Which of the following computer applications can be used to create schematic diagrams
a) Microsoft Visio
b) Microsoft Paint
c) Microsoft Word
d) All of the above
4) Which frequently used shapes does the Microsoft Paint Tool bar contain templates for
5) Where in the Microsoft Paint window would you be able to select the thickness of line that you wanted for a brushstroke 6) Identify the purpose and intended audience for a diagram showing a businessrsquos marketing plan 7) Name two characteristics of well-designed schematic diagrams 8) Identify four steps involved in designing schematic diagrams 9) Why is it important to use conventionally accepted and familiar shapes and symbols in your schematic diagrams
Foundation Computing
Basic Schematic Diagrams 5957docx Page 53
Self Test Answers 1) This flow chart is supposed to show police officers how to get a suspect to confess to a crime
START
Confidently accuse
suspect of crime
Describe a
scenario that
enables suspect
to admit guiltAllow suspect to
voice objections
Invade suspectrsquos
personal space
Suspect becomes
uncomfortable
Suspect
doesnrsquot
deny guilt
Suspect
denies guilt
No reaction
Elicit confession
Rephrase objections as
confessions
FINISH
Random shapes are meaningless and confusing ndash use conventional flow chart symbols
Stages of process are not clear ndash arrange shapes top to bottom with options at each stage branching off to side at same level
Connectors that are either straight or curved would be more consistent
Labels are clear
Text uses consistent font and size
Foundation Computing
Basic Schematic Diagrams 5957docx Page 54
2) The following diagram is an organisation chart for Widget Enterprises
John Smith
MANAGER
Seth Drew
IT MANAGER
May Furur
SECRETARY
Judith Holland
CUSTOMER SERVICES manager
Jad Ling
HELPDESK
Harry Petal
FINANCIAL MANAGER
Wanda Springer
MARKETING
MANAGER
Bob Smithells
CLEANER
Kelly Inlerl
MARKETING ASSISTANT
Beryl Thin
CUSTOMER SERVICES ASSISTANTValda Rigley
CUSTOMER
SERVICES
ASSISTANT
Levi Quayle
COMPUTER
TECHNICIAN
No clear levels to hierarchy ndash organise so that diagram reads top to bottom and positions at similar level are in same horizontal space
Different sized boxes and borders on some boxes are meaningless ndash need consistent style for similar elements
Connectors cross over each other and boxes overlap ndash arrange space to avoid this
Text size and font is mostly consistent but one typo needs correcting
3) Which of the following computer applications can be used to create schematic diagrams
a) Microsoft Visio
b) Microsoft Paint
c) Microsoft Word
d) All of the above correct
4) Which frequently used shapes does the Microsoft Paint Tool bar contain templates for
Polygon rectangle ovalellipse
Foundation Computing
Basic Schematic Diagrams 5957docx Page 55
5) Where in the Microsoft Paint window would you be able to select the thickness of line that you wanted for a brushstroke
Options area below the Toolbar
6) Identify the purpose and intended audience for a diagram showing a businessrsquos marketing plan
The purpose would be to provide an overview of the businessrsquos marketing strategy Audience could include management and employees of the business especially the Marketing department potential investors shareholders and directors of the business
7) Name two characteristics of well-designed schematic diagrams Any of simple easy for the target audience to understand include all relevant elements or parts of the process clear and logical connections between elements accurate 8) Identify four steps involved in designing schematic diagrams Gather information organise information make connections between elements test your diagram 9) Why is it important to use conventionally accepted and familiar shapes and
symbols in your schematic diagrams So that the diagram will be easily understood by the target audience
Foundation Computing
Basic Schematic Diagrams 5957docx Page 56
References httpwindowsmicrosoftcomen-NZwindows7Getting-started-with-Paint accessed Sat 5th December in Timaru New Zealand httpenwikipediaorgwikiSchematic_diagrams accessed Sat 5th December in Timaru New Zealand httpenwikipediaorgwikiSymbol accessed Sat 5th December in Timaru New Zealand
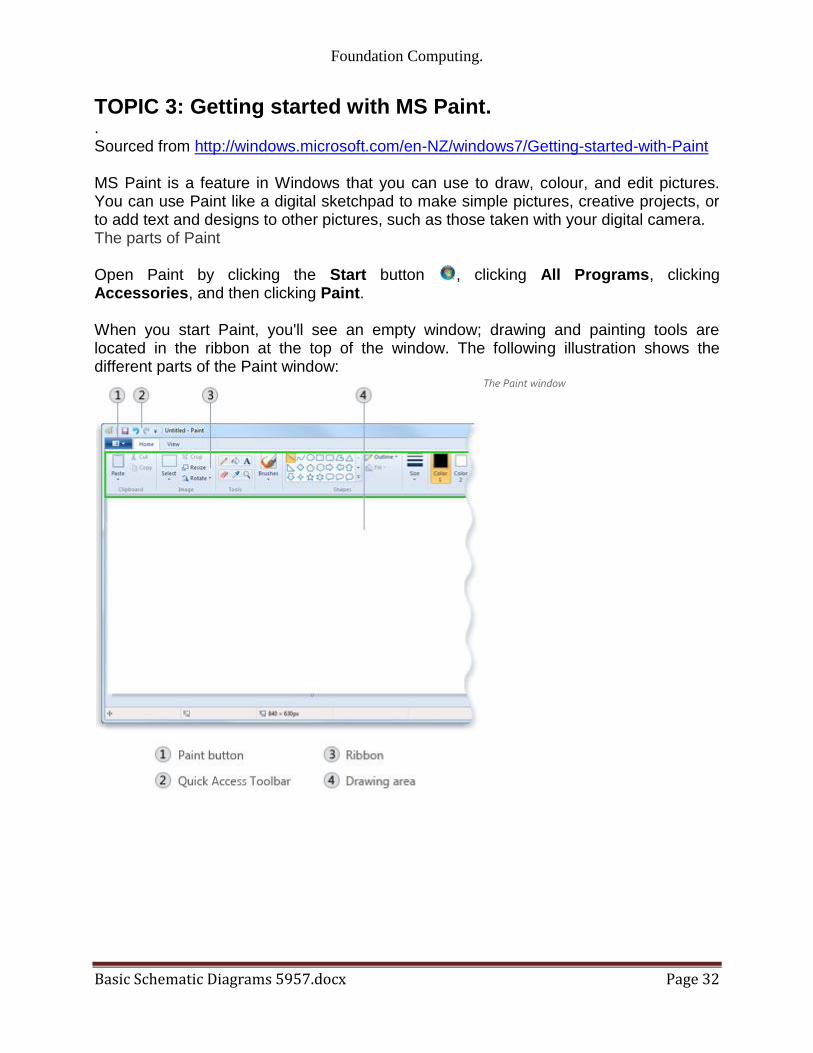
Foundation Computing
Basic Schematic Diagrams 5957docx Page 32
TOPIC 3 Getting started with MS Paint Sourced from httpwindowsmicrosoftcomen-NZwindows7Getting-started-with-Paint MS Paint is a feature in Windows that you can use to draw colour and edit pictures You can use Paint like a digital sketchpad to make simple pictures creative projects or to add text and designs to other pictures such as those taken with your digital camera The parts of Paint Open Paint by clicking the Start button clicking All Programs clicking Accessories and then clicking Paint When you start Paint youll see an empty window drawing and painting tools are located in the ribbon at the top of the window The following illustration shows the different parts of the Paint window
The Paint window
Foundation Computing
Basic Schematic Diagrams 5957docx Page 33
Working with tools The ribbon in Paint includes a handy collection of drawing tools You can use these tools to create freehand drawings and add a variety of shapes to your pictures This section describes some common tasks For more detailed information on how to use the different tools in Paint see Using Paint Draw a line Some tools and shapes such as the Pencil Brush Line and Curve let you make a variety of straight curved and squiggly lines What you draw is determined by how you move the mouse as you draw You can use the Line to draw a straight line for example
1) On the Home tab in the Shapes group click the Line 2) In the Colors group click Color 1 and then click the color you want to use 3) To draw drag the pointer across the drawing area
Draw a squiggly line Your drawings dont have to be composed of only straight lines The Pencil and Brushes can be used to make completely random free-form shapes
1) On the Home tab in the Tools group click the Pencil tool 2) In the Colors group click Color 1 and then click the color you want to use 3) To draw drag the pointer across the drawing area and make a squiggly line
Note If you want to make a line that has a different appearance use one of the Brushes instead Draw a shape Paint lets you draw many different shapes For example you can draw ready-made defined shapes such as rectangles circles squares triangles and arrows (to name a
few) You can also make your own custom shape by using the Polygon shape to draw a polygon which is a shape that can have any number of sides
1) On the Home tab in the Shapes group click a ready-made shape such as the
Rectangle 2) To add a ready-made shape drag the pointer across the drawing area to make
the shape 3) To change the outline style in the Shapes group click Outline and then click an
outline style 4) If you dont want your shape to have an outline click No outline 5) In the Colors group click Color 1 and then click a color for the outline 6) In the Colors group click Color 2 and then click a color to use to fill the shape 7) To change the fill style in the Shapes group click Fill and then click a fill style 8) If you dont want your shape to be filled click No fill
Foundation Computing
Basic Schematic Diagrams 5957docx Page 34
Add text You can also add text to your picture The Text tool lets you add a simple message or title
1) On the Home tab in the Tools group click the Text tool 2) Drag the pointer in the drawing area where you want to add text 3) Under Text Tools on the Text tab click the font face size and style in the Font
group The Font group
4) In the Colors group click Color 1 and then click a color This is the text color 5) Type the text that you want to add
Erase part of your picture If you make a mistake or need to change part of a picture use the eraser By default the eraser changes any area you erase to white but you can change the eraser color For example if you set the background color to yellow anything you erase turns to yellow
1) On the Home tab in the Tools group click the Eraser tool 2) In the Colors group click Color 2 and then click the color that you want to erase
with If you want to erase with white you dont have to select a color 3) Drag the pointer over the area you want to erase
Saving a picture Save your picture frequently so you dont accidentally lose your work To save click the
Paint button and then click Save This saves all of the changes made to the picture since the last time you saved The very first time that you save a new picture you will need to give your picture a file name Follow these steps
1) Click the Paint button and then click Save 2) In the Save as type box select the file format you want 3) In the File name box type a name and then click Save
Foundation Computing
Basic Schematic Diagrams 5957docx Page 35
Topic 4 Designing your diagram Although there are many different types of schematic diagrams the basic process and principles involved in designing a clear and coherent diagram are similar The principles apply to designing an electrical circuit diagram an organisation chart a mind map a flow chart and many other diagrams Some of these principles are also worth applying to other disciplines such as designing a Web page Letrsquos work step-by-step through the process of creating a flow chart to help people make money selling things on an on-line auction site such as wwwtrademeconz or wwwebaycom
Step 1 Gather your information Start by brainstorming all the information you need to include in your diagram Write down everything you think might be important or should be included
trademe
choose things that
sell
good photograph
feedback
keep track
prompt answers
postage
auction length
similar listings
postal system
setting reserve
describing item
correct category
re-listing
fixed offers
Look at the information you have gathered and think about your target audience Highlight the information that is most important to your target audience Cross out any irrelevant information Put question marks next to information that you are unsure about or may be able to leave out
Foundation Computing
Basic Schematic Diagrams 5957docx Page 36
Step 2 Organise your information Take the information that you have left and sort through it How you organise your information will depend on the type of diagram you are designing For example an organisationrsquos chart usually has different levels and shows who its members report to so you might group people by department and by level A flow chart like the example wersquore creating usually shows a process Information is grouped in the order we would use it If any other steps or information occurs to you as you are organising your information add them in Herersquos an example of how the key steps involved in selling on trademe could be ordered
Choose items that sell
Look at similar listings
Decide on a reserve price
Take a clear photograph
Identify your target audience
Write a clear description
Upload your item
Choose the correct category
Monitor watchers bids and views
Lower your reserve
Fixed price offers
Relist
Step 3 Make connections Once the elements are grouped or arranged in a logical order a clearer picture of the process or system you are representing in your diagram should start to emerge However unlike a list which usually reads from top to bottom only a diagram can show connections in many different directions and working out the links between elements is an essential part of designing a coherent diagram At this stage of the design process it is helpful to sketch out a basic plan of the elements you want to include and the flow-lines or connections between them In order to work out the connections between the elements ask questions such as What happens ifhellip What do I do beforeafter this What decisions need to be made now What actions need to be taken Use arrows to show connections between elements group elements that are part of the same stage or level of the process next to or near to each other and use shapes to show which elements are similar to each other eg diamonds for decisions rectangles for instructions or actions Make up your own meanings for shapes if necessary but be sure to use them consistently
Foundation Computing
Basic Schematic Diagrams 5957docx Page 37
The flow chart below shows how our list of elements above changes and gets re-ordered as we ask these questions and organise the information into a logical and coherent diagram
Decide on your
reserve price
START
Relist
Take a photo that is
clear and item looks
good
Decide on your
ideal buyer
Write a description
of your item
highlighting its
benefits for your
buyer
Upload your item in
a category your
buyer is likely to be
looking in
Monitor how many
views watchers and
bids your item gets
Lower your reserve
Item meets reserve
and sellsItem doesnrsquot sell
Offer to watchers for
your reserve
Decide what you
want to sell
Check what similar
items are currently
selling for
Lots of views but
no watchers
No interestFINISH
Foundation Computing
Basic Schematic Diagrams 5957docx Page 38
Step 4 Test your diagram The final step in designing your diagram is checking that it is as effective as possible To do this you should work through each stage step by step challenging it as you go Picture the process in your mind as you follow the links checking that you have included all the actions and decisions required that they are in the correct order and that no steps are duplicated Once yoursquore confident that the diagram is correct look at it again critically to see if you can improve it or clarify it Is there anywhere you can simplify it by removing unnecessary steps Is there anywhere that seems vague and would be easier to understand if you added a step or a connector Now imagine that you are a member of your target audience For a moment try to forget everything you know about the system or process you have designed a diagram for except for what your target audience knows Look at the diagram with fresh eyes does it make sense to you now Does anything seem odd confusing or out of place Finally look at the layout of your diagram Is it easy to read and follow Have you used shapes texts and arrows consistently Are your shapes and texts uniform and lined up properly Are your connectors clearly defined or are they criss-crossing all over each other Check the spelling of labels carefully ndash go through letter by letter to make sure all names and technical or unfamiliar terms are correct
Discussion With a partner look critically at our example diagram above Discuss any parts of it that you think could be better and any changes you would make to improve the readability of the flow chart Make note on the flow chart above of any areas that you think could be improved Share your answers with the rest of the class
Foundation Computing
Basic Schematic Diagrams 5957docx Page 39
Self Test 1) Mr Biggles owns Biggles Air Supplies a company that makes aircraft supplies He asks you to create an organisation chart for his company He gives you the following list of all his employees and who they report to
Mr James Biggles Chief Executive Officer
Jane Doep Personal Assistant to CEO
Mrs Monica Stepworth Financial Manager (reports to CEO)
Judith Zantes Accountant (reports to Financial Manager)
Mary Smallville Accountant (reports to Financial Manager)
Janey Poretuna Admin Assistant (reports to Judith Zantes)
Mickey Laluevu IT technician (reports to Financial Manager)
Mr Hank Johnson Operations Manager (reports to CEO)
Frank Hapil Engineering Manager (reports to Operations Manager)
Joe Smither Engineering Supervisor (reports to Engineering Manager)
Howie Fartherton Engineering Technician (reports to Engineering Supervisor)
Ernie Jusef Engineering Technician (reports to Engineering Supervisor)
Rob Luxemburg Apprentice Technician (reports to Ernie Jusef)
Harry Monahan Interiors Manager (reports to Operations Manager)
Barney Jokka Interiors Technician (reports to Interiors Supervisor) Design an organisation chart for Biggles Air Supplies and draw it in the space below
2) Think of a simple process that has at least five steps and involves some form of feedback or choice For example operating a vending machine topping up your mobile phone using EFTPOS checking messages on an answering machine
Design a flow chart to represent your process
Foundation Computing
Basic Schematic Diagrams 5957docx Page 40
Self Test Answers
1) Mr Biggles owns Biggles Air Supplies a company that makes aircraft supplies He asks you to create an organisation chart for his company He gives you the following list of all his employees and who they report to
Mr James Biggles Chief Executive Officer
Jane Doep Personal Assistant to CEO
Mrs Monica Stepworth Financial Manager (reports to CEO)
Judith Zantes Accountant (reports to Financial Manager)
Mary Smallville Accountant (reports to Financial Manager)
Janey Poretuna Admin Assistant (reports to Judith Zantes)
Mickey Laluevu IT technician (reports to Financial Manager)
Mr Hank Johnson Operations Manager (reports to CEO)
Frank Hapil Engineering Manager (reports to Operations Manager)
Joe Smither Engineering Supervisor (reports to Engineering Manager)
Howie Fartherton Engineering Technician (reports to Engineering Supervisor)
Ernie Jusef Engineering Technician (reports to Engineering Supervisor)
Rob Luxemburg Apprentice Technician (reports to Ernie Jusef)
Harry Monahan Interiors Manager (reports to Operations Manager)
Barney Jokka Interiors Technician (reports to Interiors Supervisor) Design an organisation chart for Biggles Air Supplies and draw it in the space below
Mr James Biggles
CEO
Jane Doep
Personal
Assistant
Mrs Monica Stepworth
Financial Manager
Judith Zantes
Accountant
Janey Poretuna
Admin Assistant
Mary Smallville
Accountant
Mickey Laluevu
IT technician
Mr Hank Johnson
Operations Manager
Frank Hapil
Engineering
Manager
Harry Monahan
Interiors Manager
Joe Smither
Engineering
Supervisor
Howie Fartherton
Engineering
Technician
Ernie Jusef
Engineering
Technician
Rob Luxemburg
Apprentice
Technician
Barney Jokka
Interiors
Technician
Foundation Computing
Basic Schematic Diagrams 5957docx Page 41
2) Think of a simple process that has at least five steps and involves some form of feedback or choice For example operating a vending machine topping up your mobile phone using EFTPOS checking messages on an answering machine
Design a flow chart to represent your process
Dial 06345
Enter your dialing code and
phone number followed by
the key
Dial number for
service you require
Listen to saved messagesListen to new messages
Dial number for
service you require
Save message Delete message
START
FINISH
Dial 2
Dial 1
Dial 1
Dial 2
Dial 1
Dial 2
Foundation Computing
Basic Schematic Diagrams 5957docx Page 42
Foundation Computing
Basic Schematic Diagrams 5957docx Page 43
Part 2
Produce schematic diagrams from a given brief using a computer application
OBJECTIVES
On successful completion of this section you will be able to Produce schematic diagrams from a given brief using a computer application
Performance criteria
21 The symbols used in each diagram are consistent with the type of diagram and the specifications of the brief
22 The final diagram is readable clearly illustrates the object being diagrammed
and is consistent with the specifications of the brief
TOPICS
Topic 1 Symbols used are consistent with diagram type and specifications Topic 2 Diagram is clear readable and consistent with specifications
Self Test
Self Test Answers
Foundation Computing
Basic Schematic Diagrams 5957docx Page 44
TOPIC 1 Symbols used are consistent with diagram type and specifications A symbol is something such as an object picture written word sound or particular mark that represents something else by association resemblance or convention For example a red octagon may be a symbol for STOP On maps crossed sabres may indicate a battlefield Numerals are symbols for numbers All language consists of symbols The word cat is not a cat but is an arbitrary symbol representing the idea of a cat There are many symbols for many things Examples range from Peace Pipe Red Cross to Electrical symbols It is good when doing schematic drawings to use symbols that are clearly recognised and interpreted Symbols that have been internationally standardised are the best Circuit diagram symbols have differed from country to country and have changed over time They are now to a large extent internationally standardized Simple components often had symbols intended to represent some feature of the physical construction of the device There are several national and international standards for graphical symbols in circuit diagrams in particular
IEC 60617 (also known as British Standard BS 3939)
ANSI standard Y32 (also known as IEEE Std 315) IEC 60617 originally consisted of 13 parts from resistors and capacitors to logic symbols and even a generalised drawing standard of connections and bus line widths It is now published as a subscription online database IEC 60617-DB Different symbols may be used depending on the discipline using the drawing for example lighting and power symbols used as part of architectural drawings may be different from symbols for devices used in electronics Different electronic components have different characteristics it is necessary to distinguish between them in any circuit diagram Of course we could use the block diagram approach and just identify each component with words Unfortunately this takes up a lot of space and makes the overall diagram harder to recognize or understand quickly We need a way to understand electrical diagrams far more quickly and easily
Foundation Computing
Basic Schematic Diagrams 5957docx Page 45
The answer is to use schematic symbols to represent electronic components as shown in the diagram below In this diagram we show the schematic symbol of a battery as the electrical source and the symbol of a resistor as the load Even without the words and arrows the symbols define exactly what this circuit is and how it behaves
Some good procedures to follow with symbols include
Using templates for frequently used symbols
Use symbols consistently
Use a library of symbols such as from IEC 60617-DB
Foundation Computing
Basic Schematic Diagrams 5957docx Page 46
TOPIC 2 Diagram is clear readable and consistent with specifications Creating a simple diagram using MSPaint To start with letrsquos create a simple flow chart representing the stages in designing a schematic diagram There are four stages in this process
1) Gather your information 2) Organise your information 3) Make connections 4) Test your diagram
Our flow chart will consist of four rectangles arranged vertically with downward pointing arrows as connectors A rounded rectangle at the top and at the bottom of the flowchart will indicate START and FINISH respectively Step by step
Open Microsoft Paint
Click on the Rectangle tool then click and drag in the drawing area to draw a rectangle
Repeat this step to draw four boxes in the drawing area OR click on the Select tool and click and drag to select the first rectangle then right-click to copy and paste three more rectangles the same size in the drawing area
Foundation Computing
Basic Schematic Diagrams 5957docx Page 47
Using the Rounded Rectangle tool draw a rounded rectangle at the top and bottom of your flow chart
Foundation Computing
Basic Schematic Diagrams 5957docx Page 48
Use the Line tool to draw arrows between each box In the Options area under the Tool bar you can choose the thickness of line that you want to use Remember too that if you hold down the Shift key on the keyboard while you are drawing a line you can create a 45 degree angle
Use the Text tool to add text to the shapes by clicking on the Text tool clicking and dragging to create a textbox inside your shape then typing your text Check your spelling carefully letter by letter as you go
Foundation Computing
Basic Schematic Diagrams 5957docx Page 49
The basic flowchart created in Microsoft Paint could look something like this
Foundation Computing
Basic Schematic Diagrams 5957docx Page 50
Common problems with diagrams Even well-designed schematic diagrams will be difficult for the target audience to read and understand if symbols are used inconsistently or the layout of the diagram is unfamiliar For example if a flowchart has different shapes used for each element and different types of arrows used randomly it will be more difficult for readers to see the overall direction and meaning of the diagram If the shapes on an organisation chart are different sizes and randomly positioned with no clear levels or hierarchy the diagram will not provide a clear overview of the organisationrsquos structure If an electrical circuit diagram has unfamiliar symbols used for elements such as switches resistors and batteries then it will not make sense to its intended audience
Tips for improving the readability of your schematic diagrams
Use symbols and shapes consistently ie elements that are similar should have the same symbol or shape
Avoid having connectors crossing over each other
Avoid having symbols or shapes overlapping
Use arrows on connectors or flow lines to indicate direction
Use colours text size and font consistently
Diagrams that can be read top-to-bottom and left-to-right are easier to read
In a process diagram have only one connector leading into a symbol but have more coming out where necessary to indicate different directions or decisions
Diagrams for a technical audience such as electrical or computer programming schematics should follow accepted conventions for symbols and layout
Diagrams indicating a hierarchy of positions ideas or stages are clearer if elements belonging to the same level are a similar shape size and position on the page
Keep labels as clear and as brief as possible Carefully check the spelling of all names and labels letter by letter ndash errors in the spelling of names or scientific and technical terms look unprofessional and can be confusing for readers
Foundation Computing
Basic Schematic Diagrams 5957docx Page 51
Self Test Look at the schematic diagrams that follow Make notes under each example of what is wrong with the diagram what is right about the diagram and what could be changed to make it clear and meaningful to its intended audience 1) This flow chart is supposed to show police officers how to get a suspect to confess to a crime
START
Confidently accuse
suspect of crime
Describe a
scenario that
enables suspect
to admit guiltAllow suspect to
voice objections
Invade suspectrsquos
personal space
Suspect becomes
uncomfortable
Suspect
doesnrsquot
deny guilt
Suspect
denies guilt
No reaction
Elicit confession
Rephrase objections as
confessions
FINISH
Foundation Computing
Basic Schematic Diagrams 5957docx Page 52
2) The following diagram is an organisation chart for Widget Enterprises
John Smith
MANAGER
Seth Drew
IT MANAGER
May Furur
SECRETARY
Judith Holland
CUSTOMER SERVICES manager
Jad Ling
HELPDESK
Harry Petal
FINANCIAL MANAGER
Wanda Springer
MARKETING
MANAGER
Bob Smithells
CLEANER
Kelly Inlerl
MARKETING ASSISTANT
Beryl Thin
CUSTOMER SERVICES ASSISTANTValda Rigley
CUSTOMER
SERVICES
ASSISTANT
Levi Quayle
COMPUTER
TECHNICIAN
3) Which of the following computer applications can be used to create schematic diagrams
a) Microsoft Visio
b) Microsoft Paint
c) Microsoft Word
d) All of the above
4) Which frequently used shapes does the Microsoft Paint Tool bar contain templates for
5) Where in the Microsoft Paint window would you be able to select the thickness of line that you wanted for a brushstroke 6) Identify the purpose and intended audience for a diagram showing a businessrsquos marketing plan 7) Name two characteristics of well-designed schematic diagrams 8) Identify four steps involved in designing schematic diagrams 9) Why is it important to use conventionally accepted and familiar shapes and symbols in your schematic diagrams
Foundation Computing
Basic Schematic Diagrams 5957docx Page 53
Self Test Answers 1) This flow chart is supposed to show police officers how to get a suspect to confess to a crime
START
Confidently accuse
suspect of crime
Describe a
scenario that
enables suspect
to admit guiltAllow suspect to
voice objections
Invade suspectrsquos
personal space
Suspect becomes
uncomfortable
Suspect
doesnrsquot
deny guilt
Suspect
denies guilt
No reaction
Elicit confession
Rephrase objections as
confessions
FINISH
Random shapes are meaningless and confusing ndash use conventional flow chart symbols
Stages of process are not clear ndash arrange shapes top to bottom with options at each stage branching off to side at same level
Connectors that are either straight or curved would be more consistent
Labels are clear
Text uses consistent font and size
Foundation Computing
Basic Schematic Diagrams 5957docx Page 54
2) The following diagram is an organisation chart for Widget Enterprises
John Smith
MANAGER
Seth Drew
IT MANAGER
May Furur
SECRETARY
Judith Holland
CUSTOMER SERVICES manager
Jad Ling
HELPDESK
Harry Petal
FINANCIAL MANAGER
Wanda Springer
MARKETING
MANAGER
Bob Smithells
CLEANER
Kelly Inlerl
MARKETING ASSISTANT
Beryl Thin
CUSTOMER SERVICES ASSISTANTValda Rigley
CUSTOMER
SERVICES
ASSISTANT
Levi Quayle
COMPUTER
TECHNICIAN
No clear levels to hierarchy ndash organise so that diagram reads top to bottom and positions at similar level are in same horizontal space
Different sized boxes and borders on some boxes are meaningless ndash need consistent style for similar elements
Connectors cross over each other and boxes overlap ndash arrange space to avoid this
Text size and font is mostly consistent but one typo needs correcting
3) Which of the following computer applications can be used to create schematic diagrams
a) Microsoft Visio
b) Microsoft Paint
c) Microsoft Word
d) All of the above correct
4) Which frequently used shapes does the Microsoft Paint Tool bar contain templates for
Polygon rectangle ovalellipse
Foundation Computing
Basic Schematic Diagrams 5957docx Page 55
5) Where in the Microsoft Paint window would you be able to select the thickness of line that you wanted for a brushstroke
Options area below the Toolbar
6) Identify the purpose and intended audience for a diagram showing a businessrsquos marketing plan
The purpose would be to provide an overview of the businessrsquos marketing strategy Audience could include management and employees of the business especially the Marketing department potential investors shareholders and directors of the business
7) Name two characteristics of well-designed schematic diagrams Any of simple easy for the target audience to understand include all relevant elements or parts of the process clear and logical connections between elements accurate 8) Identify four steps involved in designing schematic diagrams Gather information organise information make connections between elements test your diagram 9) Why is it important to use conventionally accepted and familiar shapes and
symbols in your schematic diagrams So that the diagram will be easily understood by the target audience
Foundation Computing
Basic Schematic Diagrams 5957docx Page 56
References httpwindowsmicrosoftcomen-NZwindows7Getting-started-with-Paint accessed Sat 5th December in Timaru New Zealand httpenwikipediaorgwikiSchematic_diagrams accessed Sat 5th December in Timaru New Zealand httpenwikipediaorgwikiSymbol accessed Sat 5th December in Timaru New Zealand
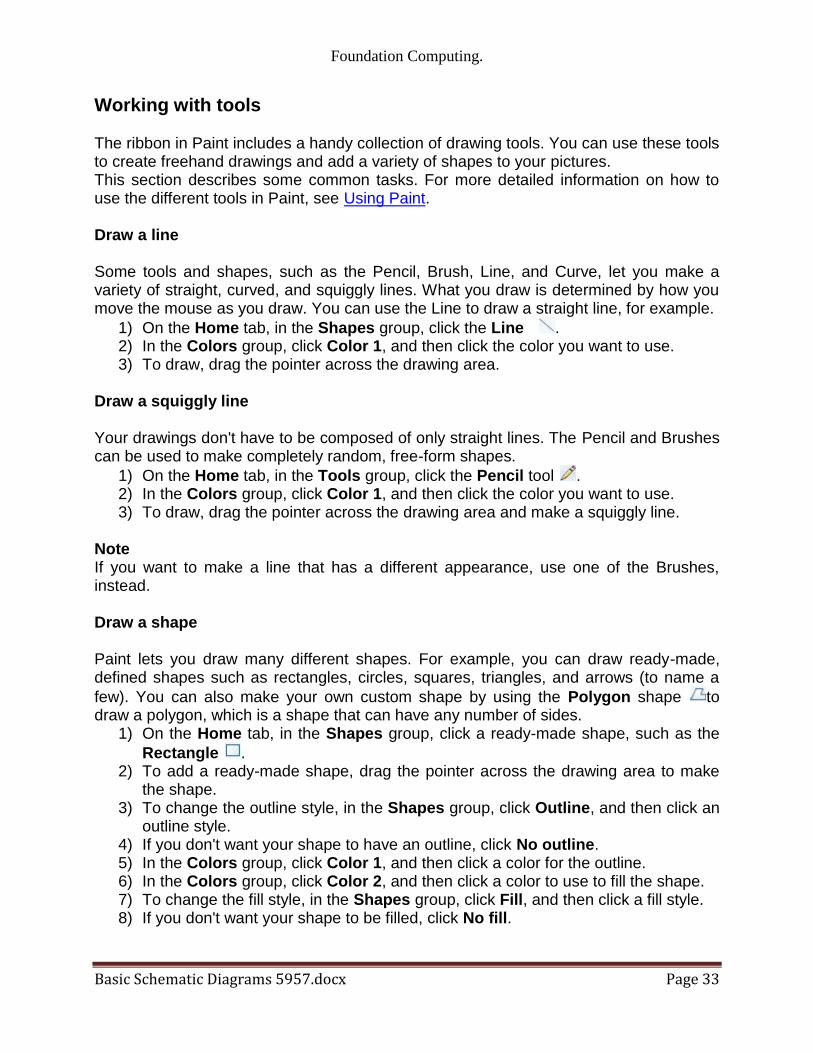
Foundation Computing
Basic Schematic Diagrams 5957docx Page 33
Working with tools The ribbon in Paint includes a handy collection of drawing tools You can use these tools to create freehand drawings and add a variety of shapes to your pictures This section describes some common tasks For more detailed information on how to use the different tools in Paint see Using Paint Draw a line Some tools and shapes such as the Pencil Brush Line and Curve let you make a variety of straight curved and squiggly lines What you draw is determined by how you move the mouse as you draw You can use the Line to draw a straight line for example
1) On the Home tab in the Shapes group click the Line 2) In the Colors group click Color 1 and then click the color you want to use 3) To draw drag the pointer across the drawing area
Draw a squiggly line Your drawings dont have to be composed of only straight lines The Pencil and Brushes can be used to make completely random free-form shapes
1) On the Home tab in the Tools group click the Pencil tool 2) In the Colors group click Color 1 and then click the color you want to use 3) To draw drag the pointer across the drawing area and make a squiggly line
Note If you want to make a line that has a different appearance use one of the Brushes instead Draw a shape Paint lets you draw many different shapes For example you can draw ready-made defined shapes such as rectangles circles squares triangles and arrows (to name a
few) You can also make your own custom shape by using the Polygon shape to draw a polygon which is a shape that can have any number of sides
1) On the Home tab in the Shapes group click a ready-made shape such as the
Rectangle 2) To add a ready-made shape drag the pointer across the drawing area to make
the shape 3) To change the outline style in the Shapes group click Outline and then click an
outline style 4) If you dont want your shape to have an outline click No outline 5) In the Colors group click Color 1 and then click a color for the outline 6) In the Colors group click Color 2 and then click a color to use to fill the shape 7) To change the fill style in the Shapes group click Fill and then click a fill style 8) If you dont want your shape to be filled click No fill
Foundation Computing
Basic Schematic Diagrams 5957docx Page 34
Add text You can also add text to your picture The Text tool lets you add a simple message or title
1) On the Home tab in the Tools group click the Text tool 2) Drag the pointer in the drawing area where you want to add text 3) Under Text Tools on the Text tab click the font face size and style in the Font
group The Font group
4) In the Colors group click Color 1 and then click a color This is the text color 5) Type the text that you want to add
Erase part of your picture If you make a mistake or need to change part of a picture use the eraser By default the eraser changes any area you erase to white but you can change the eraser color For example if you set the background color to yellow anything you erase turns to yellow
1) On the Home tab in the Tools group click the Eraser tool 2) In the Colors group click Color 2 and then click the color that you want to erase
with If you want to erase with white you dont have to select a color 3) Drag the pointer over the area you want to erase
Saving a picture Save your picture frequently so you dont accidentally lose your work To save click the
Paint button and then click Save This saves all of the changes made to the picture since the last time you saved The very first time that you save a new picture you will need to give your picture a file name Follow these steps
1) Click the Paint button and then click Save 2) In the Save as type box select the file format you want 3) In the File name box type a name and then click Save
Foundation Computing
Basic Schematic Diagrams 5957docx Page 35
Topic 4 Designing your diagram Although there are many different types of schematic diagrams the basic process and principles involved in designing a clear and coherent diagram are similar The principles apply to designing an electrical circuit diagram an organisation chart a mind map a flow chart and many other diagrams Some of these principles are also worth applying to other disciplines such as designing a Web page Letrsquos work step-by-step through the process of creating a flow chart to help people make money selling things on an on-line auction site such as wwwtrademeconz or wwwebaycom
Step 1 Gather your information Start by brainstorming all the information you need to include in your diagram Write down everything you think might be important or should be included
trademe
choose things that
sell
good photograph
feedback
keep track
prompt answers
postage
auction length
similar listings
postal system
setting reserve
describing item
correct category
re-listing
fixed offers
Look at the information you have gathered and think about your target audience Highlight the information that is most important to your target audience Cross out any irrelevant information Put question marks next to information that you are unsure about or may be able to leave out
Foundation Computing
Basic Schematic Diagrams 5957docx Page 36
Step 2 Organise your information Take the information that you have left and sort through it How you organise your information will depend on the type of diagram you are designing For example an organisationrsquos chart usually has different levels and shows who its members report to so you might group people by department and by level A flow chart like the example wersquore creating usually shows a process Information is grouped in the order we would use it If any other steps or information occurs to you as you are organising your information add them in Herersquos an example of how the key steps involved in selling on trademe could be ordered
Choose items that sell
Look at similar listings
Decide on a reserve price
Take a clear photograph
Identify your target audience
Write a clear description
Upload your item
Choose the correct category
Monitor watchers bids and views
Lower your reserve
Fixed price offers
Relist
Step 3 Make connections Once the elements are grouped or arranged in a logical order a clearer picture of the process or system you are representing in your diagram should start to emerge However unlike a list which usually reads from top to bottom only a diagram can show connections in many different directions and working out the links between elements is an essential part of designing a coherent diagram At this stage of the design process it is helpful to sketch out a basic plan of the elements you want to include and the flow-lines or connections between them In order to work out the connections between the elements ask questions such as What happens ifhellip What do I do beforeafter this What decisions need to be made now What actions need to be taken Use arrows to show connections between elements group elements that are part of the same stage or level of the process next to or near to each other and use shapes to show which elements are similar to each other eg diamonds for decisions rectangles for instructions or actions Make up your own meanings for shapes if necessary but be sure to use them consistently
Foundation Computing
Basic Schematic Diagrams 5957docx Page 37
The flow chart below shows how our list of elements above changes and gets re-ordered as we ask these questions and organise the information into a logical and coherent diagram
Decide on your
reserve price
START
Relist
Take a photo that is
clear and item looks
good
Decide on your
ideal buyer
Write a description
of your item
highlighting its
benefits for your
buyer
Upload your item in
a category your
buyer is likely to be
looking in
Monitor how many
views watchers and
bids your item gets
Lower your reserve
Item meets reserve
and sellsItem doesnrsquot sell
Offer to watchers for
your reserve
Decide what you
want to sell
Check what similar
items are currently
selling for
Lots of views but
no watchers
No interestFINISH
Foundation Computing
Basic Schematic Diagrams 5957docx Page 38
Step 4 Test your diagram The final step in designing your diagram is checking that it is as effective as possible To do this you should work through each stage step by step challenging it as you go Picture the process in your mind as you follow the links checking that you have included all the actions and decisions required that they are in the correct order and that no steps are duplicated Once yoursquore confident that the diagram is correct look at it again critically to see if you can improve it or clarify it Is there anywhere you can simplify it by removing unnecessary steps Is there anywhere that seems vague and would be easier to understand if you added a step or a connector Now imagine that you are a member of your target audience For a moment try to forget everything you know about the system or process you have designed a diagram for except for what your target audience knows Look at the diagram with fresh eyes does it make sense to you now Does anything seem odd confusing or out of place Finally look at the layout of your diagram Is it easy to read and follow Have you used shapes texts and arrows consistently Are your shapes and texts uniform and lined up properly Are your connectors clearly defined or are they criss-crossing all over each other Check the spelling of labels carefully ndash go through letter by letter to make sure all names and technical or unfamiliar terms are correct
Discussion With a partner look critically at our example diagram above Discuss any parts of it that you think could be better and any changes you would make to improve the readability of the flow chart Make note on the flow chart above of any areas that you think could be improved Share your answers with the rest of the class
Foundation Computing
Basic Schematic Diagrams 5957docx Page 39
Self Test 1) Mr Biggles owns Biggles Air Supplies a company that makes aircraft supplies He asks you to create an organisation chart for his company He gives you the following list of all his employees and who they report to
Mr James Biggles Chief Executive Officer
Jane Doep Personal Assistant to CEO
Mrs Monica Stepworth Financial Manager (reports to CEO)
Judith Zantes Accountant (reports to Financial Manager)
Mary Smallville Accountant (reports to Financial Manager)
Janey Poretuna Admin Assistant (reports to Judith Zantes)
Mickey Laluevu IT technician (reports to Financial Manager)
Mr Hank Johnson Operations Manager (reports to CEO)
Frank Hapil Engineering Manager (reports to Operations Manager)
Joe Smither Engineering Supervisor (reports to Engineering Manager)
Howie Fartherton Engineering Technician (reports to Engineering Supervisor)
Ernie Jusef Engineering Technician (reports to Engineering Supervisor)
Rob Luxemburg Apprentice Technician (reports to Ernie Jusef)
Harry Monahan Interiors Manager (reports to Operations Manager)
Barney Jokka Interiors Technician (reports to Interiors Supervisor) Design an organisation chart for Biggles Air Supplies and draw it in the space below
2) Think of a simple process that has at least five steps and involves some form of feedback or choice For example operating a vending machine topping up your mobile phone using EFTPOS checking messages on an answering machine
Design a flow chart to represent your process
Foundation Computing
Basic Schematic Diagrams 5957docx Page 40
Self Test Answers
1) Mr Biggles owns Biggles Air Supplies a company that makes aircraft supplies He asks you to create an organisation chart for his company He gives you the following list of all his employees and who they report to
Mr James Biggles Chief Executive Officer
Jane Doep Personal Assistant to CEO
Mrs Monica Stepworth Financial Manager (reports to CEO)
Judith Zantes Accountant (reports to Financial Manager)
Mary Smallville Accountant (reports to Financial Manager)
Janey Poretuna Admin Assistant (reports to Judith Zantes)
Mickey Laluevu IT technician (reports to Financial Manager)
Mr Hank Johnson Operations Manager (reports to CEO)
Frank Hapil Engineering Manager (reports to Operations Manager)
Joe Smither Engineering Supervisor (reports to Engineering Manager)
Howie Fartherton Engineering Technician (reports to Engineering Supervisor)
Ernie Jusef Engineering Technician (reports to Engineering Supervisor)
Rob Luxemburg Apprentice Technician (reports to Ernie Jusef)
Harry Monahan Interiors Manager (reports to Operations Manager)
Barney Jokka Interiors Technician (reports to Interiors Supervisor) Design an organisation chart for Biggles Air Supplies and draw it in the space below
Mr James Biggles
CEO
Jane Doep
Personal
Assistant
Mrs Monica Stepworth
Financial Manager
Judith Zantes
Accountant
Janey Poretuna
Admin Assistant
Mary Smallville
Accountant
Mickey Laluevu
IT technician
Mr Hank Johnson
Operations Manager
Frank Hapil
Engineering
Manager
Harry Monahan
Interiors Manager
Joe Smither
Engineering
Supervisor
Howie Fartherton
Engineering
Technician
Ernie Jusef
Engineering
Technician
Rob Luxemburg
Apprentice
Technician
Barney Jokka
Interiors
Technician
Foundation Computing
Basic Schematic Diagrams 5957docx Page 41
2) Think of a simple process that has at least five steps and involves some form of feedback or choice For example operating a vending machine topping up your mobile phone using EFTPOS checking messages on an answering machine
Design a flow chart to represent your process
Dial 06345
Enter your dialing code and
phone number followed by
the key
Dial number for
service you require
Listen to saved messagesListen to new messages
Dial number for
service you require
Save message Delete message
START
FINISH
Dial 2
Dial 1
Dial 1
Dial 2
Dial 1
Dial 2
Foundation Computing
Basic Schematic Diagrams 5957docx Page 42
Foundation Computing
Basic Schematic Diagrams 5957docx Page 43
Part 2
Produce schematic diagrams from a given brief using a computer application
OBJECTIVES
On successful completion of this section you will be able to Produce schematic diagrams from a given brief using a computer application
Performance criteria
21 The symbols used in each diagram are consistent with the type of diagram and the specifications of the brief
22 The final diagram is readable clearly illustrates the object being diagrammed
and is consistent with the specifications of the brief
TOPICS
Topic 1 Symbols used are consistent with diagram type and specifications Topic 2 Diagram is clear readable and consistent with specifications
Self Test
Self Test Answers
Foundation Computing
Basic Schematic Diagrams 5957docx Page 44
TOPIC 1 Symbols used are consistent with diagram type and specifications A symbol is something such as an object picture written word sound or particular mark that represents something else by association resemblance or convention For example a red octagon may be a symbol for STOP On maps crossed sabres may indicate a battlefield Numerals are symbols for numbers All language consists of symbols The word cat is not a cat but is an arbitrary symbol representing the idea of a cat There are many symbols for many things Examples range from Peace Pipe Red Cross to Electrical symbols It is good when doing schematic drawings to use symbols that are clearly recognised and interpreted Symbols that have been internationally standardised are the best Circuit diagram symbols have differed from country to country and have changed over time They are now to a large extent internationally standardized Simple components often had symbols intended to represent some feature of the physical construction of the device There are several national and international standards for graphical symbols in circuit diagrams in particular
IEC 60617 (also known as British Standard BS 3939)
ANSI standard Y32 (also known as IEEE Std 315) IEC 60617 originally consisted of 13 parts from resistors and capacitors to logic symbols and even a generalised drawing standard of connections and bus line widths It is now published as a subscription online database IEC 60617-DB Different symbols may be used depending on the discipline using the drawing for example lighting and power symbols used as part of architectural drawings may be different from symbols for devices used in electronics Different electronic components have different characteristics it is necessary to distinguish between them in any circuit diagram Of course we could use the block diagram approach and just identify each component with words Unfortunately this takes up a lot of space and makes the overall diagram harder to recognize or understand quickly We need a way to understand electrical diagrams far more quickly and easily
Foundation Computing
Basic Schematic Diagrams 5957docx Page 45
The answer is to use schematic symbols to represent electronic components as shown in the diagram below In this diagram we show the schematic symbol of a battery as the electrical source and the symbol of a resistor as the load Even without the words and arrows the symbols define exactly what this circuit is and how it behaves
Some good procedures to follow with symbols include
Using templates for frequently used symbols
Use symbols consistently
Use a library of symbols such as from IEC 60617-DB
Foundation Computing
Basic Schematic Diagrams 5957docx Page 46
TOPIC 2 Diagram is clear readable and consistent with specifications Creating a simple diagram using MSPaint To start with letrsquos create a simple flow chart representing the stages in designing a schematic diagram There are four stages in this process
1) Gather your information 2) Organise your information 3) Make connections 4) Test your diagram
Our flow chart will consist of four rectangles arranged vertically with downward pointing arrows as connectors A rounded rectangle at the top and at the bottom of the flowchart will indicate START and FINISH respectively Step by step
Open Microsoft Paint
Click on the Rectangle tool then click and drag in the drawing area to draw a rectangle
Repeat this step to draw four boxes in the drawing area OR click on the Select tool and click and drag to select the first rectangle then right-click to copy and paste three more rectangles the same size in the drawing area
Foundation Computing
Basic Schematic Diagrams 5957docx Page 47
Using the Rounded Rectangle tool draw a rounded rectangle at the top and bottom of your flow chart
Foundation Computing
Basic Schematic Diagrams 5957docx Page 48
Use the Line tool to draw arrows between each box In the Options area under the Tool bar you can choose the thickness of line that you want to use Remember too that if you hold down the Shift key on the keyboard while you are drawing a line you can create a 45 degree angle
Use the Text tool to add text to the shapes by clicking on the Text tool clicking and dragging to create a textbox inside your shape then typing your text Check your spelling carefully letter by letter as you go
Foundation Computing
Basic Schematic Diagrams 5957docx Page 49
The basic flowchart created in Microsoft Paint could look something like this
Foundation Computing
Basic Schematic Diagrams 5957docx Page 50
Common problems with diagrams Even well-designed schematic diagrams will be difficult for the target audience to read and understand if symbols are used inconsistently or the layout of the diagram is unfamiliar For example if a flowchart has different shapes used for each element and different types of arrows used randomly it will be more difficult for readers to see the overall direction and meaning of the diagram If the shapes on an organisation chart are different sizes and randomly positioned with no clear levels or hierarchy the diagram will not provide a clear overview of the organisationrsquos structure If an electrical circuit diagram has unfamiliar symbols used for elements such as switches resistors and batteries then it will not make sense to its intended audience
Tips for improving the readability of your schematic diagrams
Use symbols and shapes consistently ie elements that are similar should have the same symbol or shape
Avoid having connectors crossing over each other
Avoid having symbols or shapes overlapping
Use arrows on connectors or flow lines to indicate direction
Use colours text size and font consistently
Diagrams that can be read top-to-bottom and left-to-right are easier to read
In a process diagram have only one connector leading into a symbol but have more coming out where necessary to indicate different directions or decisions
Diagrams for a technical audience such as electrical or computer programming schematics should follow accepted conventions for symbols and layout
Diagrams indicating a hierarchy of positions ideas or stages are clearer if elements belonging to the same level are a similar shape size and position on the page
Keep labels as clear and as brief as possible Carefully check the spelling of all names and labels letter by letter ndash errors in the spelling of names or scientific and technical terms look unprofessional and can be confusing for readers
Foundation Computing
Basic Schematic Diagrams 5957docx Page 51
Self Test Look at the schematic diagrams that follow Make notes under each example of what is wrong with the diagram what is right about the diagram and what could be changed to make it clear and meaningful to its intended audience 1) This flow chart is supposed to show police officers how to get a suspect to confess to a crime
START
Confidently accuse
suspect of crime
Describe a
scenario that
enables suspect
to admit guiltAllow suspect to
voice objections
Invade suspectrsquos
personal space
Suspect becomes
uncomfortable
Suspect
doesnrsquot
deny guilt
Suspect
denies guilt
No reaction
Elicit confession
Rephrase objections as
confessions
FINISH
Foundation Computing
Basic Schematic Diagrams 5957docx Page 52
2) The following diagram is an organisation chart for Widget Enterprises
John Smith
MANAGER
Seth Drew
IT MANAGER
May Furur
SECRETARY
Judith Holland
CUSTOMER SERVICES manager
Jad Ling
HELPDESK
Harry Petal
FINANCIAL MANAGER
Wanda Springer
MARKETING
MANAGER
Bob Smithells
CLEANER
Kelly Inlerl
MARKETING ASSISTANT
Beryl Thin
CUSTOMER SERVICES ASSISTANTValda Rigley
CUSTOMER
SERVICES
ASSISTANT
Levi Quayle
COMPUTER
TECHNICIAN
3) Which of the following computer applications can be used to create schematic diagrams
a) Microsoft Visio
b) Microsoft Paint
c) Microsoft Word
d) All of the above
4) Which frequently used shapes does the Microsoft Paint Tool bar contain templates for
5) Where in the Microsoft Paint window would you be able to select the thickness of line that you wanted for a brushstroke 6) Identify the purpose and intended audience for a diagram showing a businessrsquos marketing plan 7) Name two characteristics of well-designed schematic diagrams 8) Identify four steps involved in designing schematic diagrams 9) Why is it important to use conventionally accepted and familiar shapes and symbols in your schematic diagrams
Foundation Computing
Basic Schematic Diagrams 5957docx Page 53
Self Test Answers 1) This flow chart is supposed to show police officers how to get a suspect to confess to a crime
START
Confidently accuse
suspect of crime
Describe a
scenario that
enables suspect
to admit guiltAllow suspect to
voice objections
Invade suspectrsquos
personal space
Suspect becomes
uncomfortable
Suspect
doesnrsquot
deny guilt
Suspect
denies guilt
No reaction
Elicit confession
Rephrase objections as
confessions
FINISH
Random shapes are meaningless and confusing ndash use conventional flow chart symbols
Stages of process are not clear ndash arrange shapes top to bottom with options at each stage branching off to side at same level
Connectors that are either straight or curved would be more consistent
Labels are clear
Text uses consistent font and size
Foundation Computing
Basic Schematic Diagrams 5957docx Page 54
2) The following diagram is an organisation chart for Widget Enterprises
John Smith
MANAGER
Seth Drew
IT MANAGER
May Furur
SECRETARY
Judith Holland
CUSTOMER SERVICES manager
Jad Ling
HELPDESK
Harry Petal
FINANCIAL MANAGER
Wanda Springer
MARKETING
MANAGER
Bob Smithells
CLEANER
Kelly Inlerl
MARKETING ASSISTANT
Beryl Thin
CUSTOMER SERVICES ASSISTANTValda Rigley
CUSTOMER
SERVICES
ASSISTANT
Levi Quayle
COMPUTER
TECHNICIAN
No clear levels to hierarchy ndash organise so that diagram reads top to bottom and positions at similar level are in same horizontal space
Different sized boxes and borders on some boxes are meaningless ndash need consistent style for similar elements
Connectors cross over each other and boxes overlap ndash arrange space to avoid this
Text size and font is mostly consistent but one typo needs correcting
3) Which of the following computer applications can be used to create schematic diagrams
a) Microsoft Visio
b) Microsoft Paint
c) Microsoft Word
d) All of the above correct
4) Which frequently used shapes does the Microsoft Paint Tool bar contain templates for
Polygon rectangle ovalellipse
Foundation Computing
Basic Schematic Diagrams 5957docx Page 55
5) Where in the Microsoft Paint window would you be able to select the thickness of line that you wanted for a brushstroke
Options area below the Toolbar
6) Identify the purpose and intended audience for a diagram showing a businessrsquos marketing plan
The purpose would be to provide an overview of the businessrsquos marketing strategy Audience could include management and employees of the business especially the Marketing department potential investors shareholders and directors of the business
7) Name two characteristics of well-designed schematic diagrams Any of simple easy for the target audience to understand include all relevant elements or parts of the process clear and logical connections between elements accurate 8) Identify four steps involved in designing schematic diagrams Gather information organise information make connections between elements test your diagram 9) Why is it important to use conventionally accepted and familiar shapes and
symbols in your schematic diagrams So that the diagram will be easily understood by the target audience
Foundation Computing
Basic Schematic Diagrams 5957docx Page 56
References httpwindowsmicrosoftcomen-NZwindows7Getting-started-with-Paint accessed Sat 5th December in Timaru New Zealand httpenwikipediaorgwikiSchematic_diagrams accessed Sat 5th December in Timaru New Zealand httpenwikipediaorgwikiSymbol accessed Sat 5th December in Timaru New Zealand
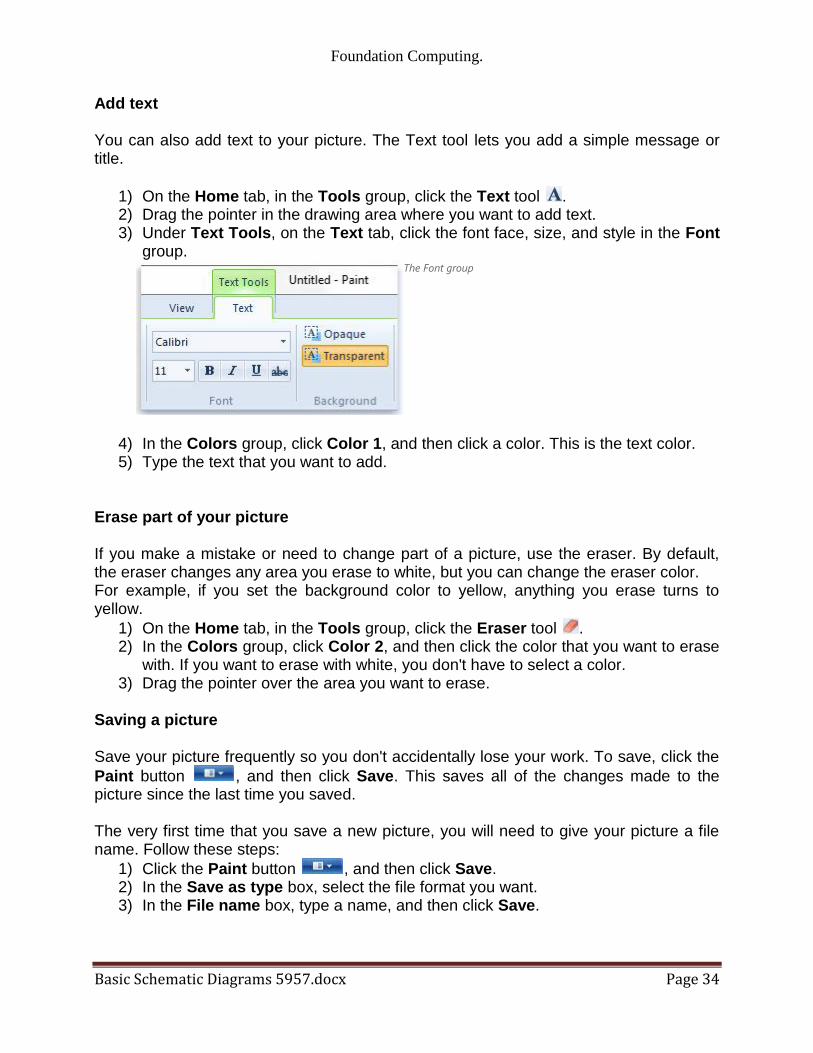
Foundation Computing
Basic Schematic Diagrams 5957docx Page 34
Add text You can also add text to your picture The Text tool lets you add a simple message or title
1) On the Home tab in the Tools group click the Text tool 2) Drag the pointer in the drawing area where you want to add text 3) Under Text Tools on the Text tab click the font face size and style in the Font
group The Font group
4) In the Colors group click Color 1 and then click a color This is the text color 5) Type the text that you want to add
Erase part of your picture If you make a mistake or need to change part of a picture use the eraser By default the eraser changes any area you erase to white but you can change the eraser color For example if you set the background color to yellow anything you erase turns to yellow
1) On the Home tab in the Tools group click the Eraser tool 2) In the Colors group click Color 2 and then click the color that you want to erase
with If you want to erase with white you dont have to select a color 3) Drag the pointer over the area you want to erase
Saving a picture Save your picture frequently so you dont accidentally lose your work To save click the
Paint button and then click Save This saves all of the changes made to the picture since the last time you saved The very first time that you save a new picture you will need to give your picture a file name Follow these steps
1) Click the Paint button and then click Save 2) In the Save as type box select the file format you want 3) In the File name box type a name and then click Save
Foundation Computing
Basic Schematic Diagrams 5957docx Page 35
Topic 4 Designing your diagram Although there are many different types of schematic diagrams the basic process and principles involved in designing a clear and coherent diagram are similar The principles apply to designing an electrical circuit diagram an organisation chart a mind map a flow chart and many other diagrams Some of these principles are also worth applying to other disciplines such as designing a Web page Letrsquos work step-by-step through the process of creating a flow chart to help people make money selling things on an on-line auction site such as wwwtrademeconz or wwwebaycom
Step 1 Gather your information Start by brainstorming all the information you need to include in your diagram Write down everything you think might be important or should be included
trademe
choose things that
sell
good photograph
feedback
keep track
prompt answers
postage
auction length
similar listings
postal system
setting reserve
describing item
correct category
re-listing
fixed offers
Look at the information you have gathered and think about your target audience Highlight the information that is most important to your target audience Cross out any irrelevant information Put question marks next to information that you are unsure about or may be able to leave out
Foundation Computing
Basic Schematic Diagrams 5957docx Page 36
Step 2 Organise your information Take the information that you have left and sort through it How you organise your information will depend on the type of diagram you are designing For example an organisationrsquos chart usually has different levels and shows who its members report to so you might group people by department and by level A flow chart like the example wersquore creating usually shows a process Information is grouped in the order we would use it If any other steps or information occurs to you as you are organising your information add them in Herersquos an example of how the key steps involved in selling on trademe could be ordered
Choose items that sell
Look at similar listings
Decide on a reserve price
Take a clear photograph
Identify your target audience
Write a clear description
Upload your item
Choose the correct category
Monitor watchers bids and views
Lower your reserve
Fixed price offers
Relist
Step 3 Make connections Once the elements are grouped or arranged in a logical order a clearer picture of the process or system you are representing in your diagram should start to emerge However unlike a list which usually reads from top to bottom only a diagram can show connections in many different directions and working out the links between elements is an essential part of designing a coherent diagram At this stage of the design process it is helpful to sketch out a basic plan of the elements you want to include and the flow-lines or connections between them In order to work out the connections between the elements ask questions such as What happens ifhellip What do I do beforeafter this What decisions need to be made now What actions need to be taken Use arrows to show connections between elements group elements that are part of the same stage or level of the process next to or near to each other and use shapes to show which elements are similar to each other eg diamonds for decisions rectangles for instructions or actions Make up your own meanings for shapes if necessary but be sure to use them consistently
Foundation Computing
Basic Schematic Diagrams 5957docx Page 37
The flow chart below shows how our list of elements above changes and gets re-ordered as we ask these questions and organise the information into a logical and coherent diagram
Decide on your
reserve price
START
Relist
Take a photo that is
clear and item looks
good
Decide on your
ideal buyer
Write a description
of your item
highlighting its
benefits for your
buyer
Upload your item in
a category your
buyer is likely to be
looking in
Monitor how many
views watchers and
bids your item gets
Lower your reserve
Item meets reserve
and sellsItem doesnrsquot sell
Offer to watchers for
your reserve
Decide what you
want to sell
Check what similar
items are currently
selling for
Lots of views but
no watchers
No interestFINISH
Foundation Computing
Basic Schematic Diagrams 5957docx Page 38
Step 4 Test your diagram The final step in designing your diagram is checking that it is as effective as possible To do this you should work through each stage step by step challenging it as you go Picture the process in your mind as you follow the links checking that you have included all the actions and decisions required that they are in the correct order and that no steps are duplicated Once yoursquore confident that the diagram is correct look at it again critically to see if you can improve it or clarify it Is there anywhere you can simplify it by removing unnecessary steps Is there anywhere that seems vague and would be easier to understand if you added a step or a connector Now imagine that you are a member of your target audience For a moment try to forget everything you know about the system or process you have designed a diagram for except for what your target audience knows Look at the diagram with fresh eyes does it make sense to you now Does anything seem odd confusing or out of place Finally look at the layout of your diagram Is it easy to read and follow Have you used shapes texts and arrows consistently Are your shapes and texts uniform and lined up properly Are your connectors clearly defined or are they criss-crossing all over each other Check the spelling of labels carefully ndash go through letter by letter to make sure all names and technical or unfamiliar terms are correct
Discussion With a partner look critically at our example diagram above Discuss any parts of it that you think could be better and any changes you would make to improve the readability of the flow chart Make note on the flow chart above of any areas that you think could be improved Share your answers with the rest of the class
Foundation Computing
Basic Schematic Diagrams 5957docx Page 39
Self Test 1) Mr Biggles owns Biggles Air Supplies a company that makes aircraft supplies He asks you to create an organisation chart for his company He gives you the following list of all his employees and who they report to
Mr James Biggles Chief Executive Officer
Jane Doep Personal Assistant to CEO
Mrs Monica Stepworth Financial Manager (reports to CEO)
Judith Zantes Accountant (reports to Financial Manager)
Mary Smallville Accountant (reports to Financial Manager)
Janey Poretuna Admin Assistant (reports to Judith Zantes)
Mickey Laluevu IT technician (reports to Financial Manager)
Mr Hank Johnson Operations Manager (reports to CEO)
Frank Hapil Engineering Manager (reports to Operations Manager)
Joe Smither Engineering Supervisor (reports to Engineering Manager)
Howie Fartherton Engineering Technician (reports to Engineering Supervisor)
Ernie Jusef Engineering Technician (reports to Engineering Supervisor)
Rob Luxemburg Apprentice Technician (reports to Ernie Jusef)
Harry Monahan Interiors Manager (reports to Operations Manager)
Barney Jokka Interiors Technician (reports to Interiors Supervisor) Design an organisation chart for Biggles Air Supplies and draw it in the space below
2) Think of a simple process that has at least five steps and involves some form of feedback or choice For example operating a vending machine topping up your mobile phone using EFTPOS checking messages on an answering machine
Design a flow chart to represent your process
Foundation Computing
Basic Schematic Diagrams 5957docx Page 40
Self Test Answers
1) Mr Biggles owns Biggles Air Supplies a company that makes aircraft supplies He asks you to create an organisation chart for his company He gives you the following list of all his employees and who they report to
Mr James Biggles Chief Executive Officer
Jane Doep Personal Assistant to CEO
Mrs Monica Stepworth Financial Manager (reports to CEO)
Judith Zantes Accountant (reports to Financial Manager)
Mary Smallville Accountant (reports to Financial Manager)
Janey Poretuna Admin Assistant (reports to Judith Zantes)
Mickey Laluevu IT technician (reports to Financial Manager)
Mr Hank Johnson Operations Manager (reports to CEO)
Frank Hapil Engineering Manager (reports to Operations Manager)
Joe Smither Engineering Supervisor (reports to Engineering Manager)
Howie Fartherton Engineering Technician (reports to Engineering Supervisor)
Ernie Jusef Engineering Technician (reports to Engineering Supervisor)
Rob Luxemburg Apprentice Technician (reports to Ernie Jusef)
Harry Monahan Interiors Manager (reports to Operations Manager)
Barney Jokka Interiors Technician (reports to Interiors Supervisor) Design an organisation chart for Biggles Air Supplies and draw it in the space below
Mr James Biggles
CEO
Jane Doep
Personal
Assistant
Mrs Monica Stepworth
Financial Manager
Judith Zantes
Accountant
Janey Poretuna
Admin Assistant
Mary Smallville
Accountant
Mickey Laluevu
IT technician
Mr Hank Johnson
Operations Manager
Frank Hapil
Engineering
Manager
Harry Monahan
Interiors Manager
Joe Smither
Engineering
Supervisor
Howie Fartherton
Engineering
Technician
Ernie Jusef
Engineering
Technician
Rob Luxemburg
Apprentice
Technician
Barney Jokka
Interiors
Technician
Foundation Computing
Basic Schematic Diagrams 5957docx Page 41
2) Think of a simple process that has at least five steps and involves some form of feedback or choice For example operating a vending machine topping up your mobile phone using EFTPOS checking messages on an answering machine
Design a flow chart to represent your process
Dial 06345
Enter your dialing code and
phone number followed by
the key
Dial number for
service you require
Listen to saved messagesListen to new messages
Dial number for
service you require
Save message Delete message
START
FINISH
Dial 2
Dial 1
Dial 1
Dial 2
Dial 1
Dial 2
Foundation Computing
Basic Schematic Diagrams 5957docx Page 42
Foundation Computing
Basic Schematic Diagrams 5957docx Page 43
Part 2
Produce schematic diagrams from a given brief using a computer application
OBJECTIVES
On successful completion of this section you will be able to Produce schematic diagrams from a given brief using a computer application
Performance criteria
21 The symbols used in each diagram are consistent with the type of diagram and the specifications of the brief
22 The final diagram is readable clearly illustrates the object being diagrammed
and is consistent with the specifications of the brief
TOPICS
Topic 1 Symbols used are consistent with diagram type and specifications Topic 2 Diagram is clear readable and consistent with specifications
Self Test
Self Test Answers
Foundation Computing
Basic Schematic Diagrams 5957docx Page 44
TOPIC 1 Symbols used are consistent with diagram type and specifications A symbol is something such as an object picture written word sound or particular mark that represents something else by association resemblance or convention For example a red octagon may be a symbol for STOP On maps crossed sabres may indicate a battlefield Numerals are symbols for numbers All language consists of symbols The word cat is not a cat but is an arbitrary symbol representing the idea of a cat There are many symbols for many things Examples range from Peace Pipe Red Cross to Electrical symbols It is good when doing schematic drawings to use symbols that are clearly recognised and interpreted Symbols that have been internationally standardised are the best Circuit diagram symbols have differed from country to country and have changed over time They are now to a large extent internationally standardized Simple components often had symbols intended to represent some feature of the physical construction of the device There are several national and international standards for graphical symbols in circuit diagrams in particular
IEC 60617 (also known as British Standard BS 3939)
ANSI standard Y32 (also known as IEEE Std 315) IEC 60617 originally consisted of 13 parts from resistors and capacitors to logic symbols and even a generalised drawing standard of connections and bus line widths It is now published as a subscription online database IEC 60617-DB Different symbols may be used depending on the discipline using the drawing for example lighting and power symbols used as part of architectural drawings may be different from symbols for devices used in electronics Different electronic components have different characteristics it is necessary to distinguish between them in any circuit diagram Of course we could use the block diagram approach and just identify each component with words Unfortunately this takes up a lot of space and makes the overall diagram harder to recognize or understand quickly We need a way to understand electrical diagrams far more quickly and easily
Foundation Computing
Basic Schematic Diagrams 5957docx Page 45
The answer is to use schematic symbols to represent electronic components as shown in the diagram below In this diagram we show the schematic symbol of a battery as the electrical source and the symbol of a resistor as the load Even without the words and arrows the symbols define exactly what this circuit is and how it behaves
Some good procedures to follow with symbols include
Using templates for frequently used symbols
Use symbols consistently
Use a library of symbols such as from IEC 60617-DB
Foundation Computing
Basic Schematic Diagrams 5957docx Page 46
TOPIC 2 Diagram is clear readable and consistent with specifications Creating a simple diagram using MSPaint To start with letrsquos create a simple flow chart representing the stages in designing a schematic diagram There are four stages in this process
1) Gather your information 2) Organise your information 3) Make connections 4) Test your diagram
Our flow chart will consist of four rectangles arranged vertically with downward pointing arrows as connectors A rounded rectangle at the top and at the bottom of the flowchart will indicate START and FINISH respectively Step by step
Open Microsoft Paint
Click on the Rectangle tool then click and drag in the drawing area to draw a rectangle
Repeat this step to draw four boxes in the drawing area OR click on the Select tool and click and drag to select the first rectangle then right-click to copy and paste three more rectangles the same size in the drawing area
Foundation Computing
Basic Schematic Diagrams 5957docx Page 47
Using the Rounded Rectangle tool draw a rounded rectangle at the top and bottom of your flow chart
Foundation Computing
Basic Schematic Diagrams 5957docx Page 48
Use the Line tool to draw arrows between each box In the Options area under the Tool bar you can choose the thickness of line that you want to use Remember too that if you hold down the Shift key on the keyboard while you are drawing a line you can create a 45 degree angle
Use the Text tool to add text to the shapes by clicking on the Text tool clicking and dragging to create a textbox inside your shape then typing your text Check your spelling carefully letter by letter as you go
Foundation Computing
Basic Schematic Diagrams 5957docx Page 49
The basic flowchart created in Microsoft Paint could look something like this
Foundation Computing
Basic Schematic Diagrams 5957docx Page 50
Common problems with diagrams Even well-designed schematic diagrams will be difficult for the target audience to read and understand if symbols are used inconsistently or the layout of the diagram is unfamiliar For example if a flowchart has different shapes used for each element and different types of arrows used randomly it will be more difficult for readers to see the overall direction and meaning of the diagram If the shapes on an organisation chart are different sizes and randomly positioned with no clear levels or hierarchy the diagram will not provide a clear overview of the organisationrsquos structure If an electrical circuit diagram has unfamiliar symbols used for elements such as switches resistors and batteries then it will not make sense to its intended audience
Tips for improving the readability of your schematic diagrams
Use symbols and shapes consistently ie elements that are similar should have the same symbol or shape
Avoid having connectors crossing over each other
Avoid having symbols or shapes overlapping
Use arrows on connectors or flow lines to indicate direction
Use colours text size and font consistently
Diagrams that can be read top-to-bottom and left-to-right are easier to read
In a process diagram have only one connector leading into a symbol but have more coming out where necessary to indicate different directions or decisions
Diagrams for a technical audience such as electrical or computer programming schematics should follow accepted conventions for symbols and layout
Diagrams indicating a hierarchy of positions ideas or stages are clearer if elements belonging to the same level are a similar shape size and position on the page
Keep labels as clear and as brief as possible Carefully check the spelling of all names and labels letter by letter ndash errors in the spelling of names or scientific and technical terms look unprofessional and can be confusing for readers
Foundation Computing
Basic Schematic Diagrams 5957docx Page 51
Self Test Look at the schematic diagrams that follow Make notes under each example of what is wrong with the diagram what is right about the diagram and what could be changed to make it clear and meaningful to its intended audience 1) This flow chart is supposed to show police officers how to get a suspect to confess to a crime
START
Confidently accuse
suspect of crime
Describe a
scenario that
enables suspect
to admit guiltAllow suspect to
voice objections
Invade suspectrsquos
personal space
Suspect becomes
uncomfortable
Suspect
doesnrsquot
deny guilt
Suspect
denies guilt
No reaction
Elicit confession
Rephrase objections as
confessions
FINISH
Foundation Computing
Basic Schematic Diagrams 5957docx Page 52
2) The following diagram is an organisation chart for Widget Enterprises
John Smith
MANAGER
Seth Drew
IT MANAGER
May Furur
SECRETARY
Judith Holland
CUSTOMER SERVICES manager
Jad Ling
HELPDESK
Harry Petal
FINANCIAL MANAGER
Wanda Springer
MARKETING
MANAGER
Bob Smithells
CLEANER
Kelly Inlerl
MARKETING ASSISTANT
Beryl Thin
CUSTOMER SERVICES ASSISTANTValda Rigley
CUSTOMER
SERVICES
ASSISTANT
Levi Quayle
COMPUTER
TECHNICIAN
3) Which of the following computer applications can be used to create schematic diagrams
a) Microsoft Visio
b) Microsoft Paint
c) Microsoft Word
d) All of the above
4) Which frequently used shapes does the Microsoft Paint Tool bar contain templates for
5) Where in the Microsoft Paint window would you be able to select the thickness of line that you wanted for a brushstroke 6) Identify the purpose and intended audience for a diagram showing a businessrsquos marketing plan 7) Name two characteristics of well-designed schematic diagrams 8) Identify four steps involved in designing schematic diagrams 9) Why is it important to use conventionally accepted and familiar shapes and symbols in your schematic diagrams
Foundation Computing
Basic Schematic Diagrams 5957docx Page 53
Self Test Answers 1) This flow chart is supposed to show police officers how to get a suspect to confess to a crime
START
Confidently accuse
suspect of crime
Describe a
scenario that
enables suspect
to admit guiltAllow suspect to
voice objections
Invade suspectrsquos
personal space
Suspect becomes
uncomfortable
Suspect
doesnrsquot
deny guilt
Suspect
denies guilt
No reaction
Elicit confession
Rephrase objections as
confessions
FINISH
Random shapes are meaningless and confusing ndash use conventional flow chart symbols
Stages of process are not clear ndash arrange shapes top to bottom with options at each stage branching off to side at same level
Connectors that are either straight or curved would be more consistent
Labels are clear
Text uses consistent font and size
Foundation Computing
Basic Schematic Diagrams 5957docx Page 54
2) The following diagram is an organisation chart for Widget Enterprises
John Smith
MANAGER
Seth Drew
IT MANAGER
May Furur
SECRETARY
Judith Holland
CUSTOMER SERVICES manager
Jad Ling
HELPDESK
Harry Petal
FINANCIAL MANAGER
Wanda Springer
MARKETING
MANAGER
Bob Smithells
CLEANER
Kelly Inlerl
MARKETING ASSISTANT
Beryl Thin
CUSTOMER SERVICES ASSISTANTValda Rigley
CUSTOMER
SERVICES
ASSISTANT
Levi Quayle
COMPUTER
TECHNICIAN
No clear levels to hierarchy ndash organise so that diagram reads top to bottom and positions at similar level are in same horizontal space
Different sized boxes and borders on some boxes are meaningless ndash need consistent style for similar elements
Connectors cross over each other and boxes overlap ndash arrange space to avoid this
Text size and font is mostly consistent but one typo needs correcting
3) Which of the following computer applications can be used to create schematic diagrams
a) Microsoft Visio
b) Microsoft Paint
c) Microsoft Word
d) All of the above correct
4) Which frequently used shapes does the Microsoft Paint Tool bar contain templates for
Polygon rectangle ovalellipse
Foundation Computing
Basic Schematic Diagrams 5957docx Page 55
5) Where in the Microsoft Paint window would you be able to select the thickness of line that you wanted for a brushstroke
Options area below the Toolbar
6) Identify the purpose and intended audience for a diagram showing a businessrsquos marketing plan
The purpose would be to provide an overview of the businessrsquos marketing strategy Audience could include management and employees of the business especially the Marketing department potential investors shareholders and directors of the business
7) Name two characteristics of well-designed schematic diagrams Any of simple easy for the target audience to understand include all relevant elements or parts of the process clear and logical connections between elements accurate 8) Identify four steps involved in designing schematic diagrams Gather information organise information make connections between elements test your diagram 9) Why is it important to use conventionally accepted and familiar shapes and
symbols in your schematic diagrams So that the diagram will be easily understood by the target audience
Foundation Computing
Basic Schematic Diagrams 5957docx Page 56
References httpwindowsmicrosoftcomen-NZwindows7Getting-started-with-Paint accessed Sat 5th December in Timaru New Zealand httpenwikipediaorgwikiSchematic_diagrams accessed Sat 5th December in Timaru New Zealand httpenwikipediaorgwikiSymbol accessed Sat 5th December in Timaru New Zealand
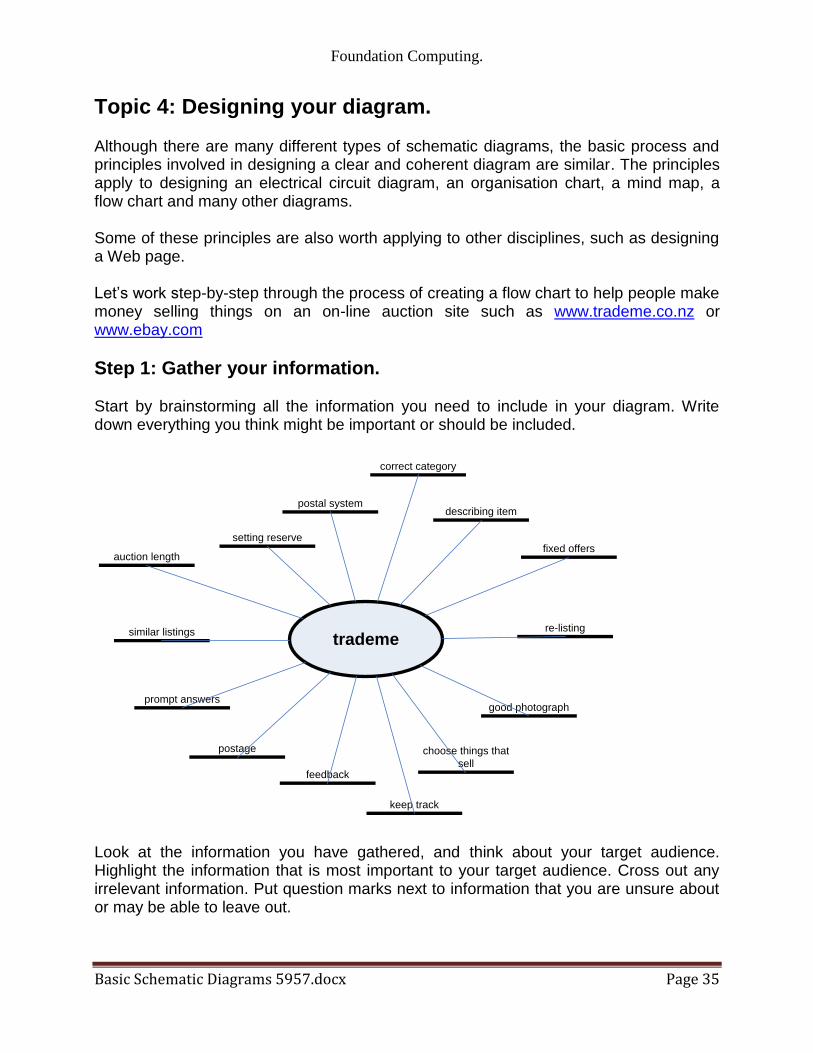
Foundation Computing
Basic Schematic Diagrams 5957docx Page 35
Topic 4 Designing your diagram Although there are many different types of schematic diagrams the basic process and principles involved in designing a clear and coherent diagram are similar The principles apply to designing an electrical circuit diagram an organisation chart a mind map a flow chart and many other diagrams Some of these principles are also worth applying to other disciplines such as designing a Web page Letrsquos work step-by-step through the process of creating a flow chart to help people make money selling things on an on-line auction site such as wwwtrademeconz or wwwebaycom
Step 1 Gather your information Start by brainstorming all the information you need to include in your diagram Write down everything you think might be important or should be included
trademe
choose things that
sell
good photograph
feedback
keep track
prompt answers
postage
auction length
similar listings
postal system
setting reserve
describing item
correct category
re-listing
fixed offers
Look at the information you have gathered and think about your target audience Highlight the information that is most important to your target audience Cross out any irrelevant information Put question marks next to information that you are unsure about or may be able to leave out
Foundation Computing
Basic Schematic Diagrams 5957docx Page 36
Step 2 Organise your information Take the information that you have left and sort through it How you organise your information will depend on the type of diagram you are designing For example an organisationrsquos chart usually has different levels and shows who its members report to so you might group people by department and by level A flow chart like the example wersquore creating usually shows a process Information is grouped in the order we would use it If any other steps or information occurs to you as you are organising your information add them in Herersquos an example of how the key steps involved in selling on trademe could be ordered
Choose items that sell
Look at similar listings
Decide on a reserve price
Take a clear photograph
Identify your target audience
Write a clear description
Upload your item
Choose the correct category
Monitor watchers bids and views
Lower your reserve
Fixed price offers
Relist
Step 3 Make connections Once the elements are grouped or arranged in a logical order a clearer picture of the process or system you are representing in your diagram should start to emerge However unlike a list which usually reads from top to bottom only a diagram can show connections in many different directions and working out the links between elements is an essential part of designing a coherent diagram At this stage of the design process it is helpful to sketch out a basic plan of the elements you want to include and the flow-lines or connections between them In order to work out the connections between the elements ask questions such as What happens ifhellip What do I do beforeafter this What decisions need to be made now What actions need to be taken Use arrows to show connections between elements group elements that are part of the same stage or level of the process next to or near to each other and use shapes to show which elements are similar to each other eg diamonds for decisions rectangles for instructions or actions Make up your own meanings for shapes if necessary but be sure to use them consistently
Foundation Computing
Basic Schematic Diagrams 5957docx Page 37
The flow chart below shows how our list of elements above changes and gets re-ordered as we ask these questions and organise the information into a logical and coherent diagram
Decide on your
reserve price
START
Relist
Take a photo that is
clear and item looks
good
Decide on your
ideal buyer
Write a description
of your item
highlighting its
benefits for your
buyer
Upload your item in
a category your
buyer is likely to be
looking in
Monitor how many
views watchers and
bids your item gets
Lower your reserve
Item meets reserve
and sellsItem doesnrsquot sell
Offer to watchers for
your reserve
Decide what you
want to sell
Check what similar
items are currently
selling for
Lots of views but
no watchers
No interestFINISH
Foundation Computing
Basic Schematic Diagrams 5957docx Page 38
Step 4 Test your diagram The final step in designing your diagram is checking that it is as effective as possible To do this you should work through each stage step by step challenging it as you go Picture the process in your mind as you follow the links checking that you have included all the actions and decisions required that they are in the correct order and that no steps are duplicated Once yoursquore confident that the diagram is correct look at it again critically to see if you can improve it or clarify it Is there anywhere you can simplify it by removing unnecessary steps Is there anywhere that seems vague and would be easier to understand if you added a step or a connector Now imagine that you are a member of your target audience For a moment try to forget everything you know about the system or process you have designed a diagram for except for what your target audience knows Look at the diagram with fresh eyes does it make sense to you now Does anything seem odd confusing or out of place Finally look at the layout of your diagram Is it easy to read and follow Have you used shapes texts and arrows consistently Are your shapes and texts uniform and lined up properly Are your connectors clearly defined or are they criss-crossing all over each other Check the spelling of labels carefully ndash go through letter by letter to make sure all names and technical or unfamiliar terms are correct
Discussion With a partner look critically at our example diagram above Discuss any parts of it that you think could be better and any changes you would make to improve the readability of the flow chart Make note on the flow chart above of any areas that you think could be improved Share your answers with the rest of the class
Foundation Computing
Basic Schematic Diagrams 5957docx Page 39
Self Test 1) Mr Biggles owns Biggles Air Supplies a company that makes aircraft supplies He asks you to create an organisation chart for his company He gives you the following list of all his employees and who they report to
Mr James Biggles Chief Executive Officer
Jane Doep Personal Assistant to CEO
Mrs Monica Stepworth Financial Manager (reports to CEO)
Judith Zantes Accountant (reports to Financial Manager)
Mary Smallville Accountant (reports to Financial Manager)
Janey Poretuna Admin Assistant (reports to Judith Zantes)
Mickey Laluevu IT technician (reports to Financial Manager)
Mr Hank Johnson Operations Manager (reports to CEO)
Frank Hapil Engineering Manager (reports to Operations Manager)
Joe Smither Engineering Supervisor (reports to Engineering Manager)
Howie Fartherton Engineering Technician (reports to Engineering Supervisor)
Ernie Jusef Engineering Technician (reports to Engineering Supervisor)
Rob Luxemburg Apprentice Technician (reports to Ernie Jusef)
Harry Monahan Interiors Manager (reports to Operations Manager)
Barney Jokka Interiors Technician (reports to Interiors Supervisor) Design an organisation chart for Biggles Air Supplies and draw it in the space below
2) Think of a simple process that has at least five steps and involves some form of feedback or choice For example operating a vending machine topping up your mobile phone using EFTPOS checking messages on an answering machine
Design a flow chart to represent your process
Foundation Computing
Basic Schematic Diagrams 5957docx Page 40
Self Test Answers
1) Mr Biggles owns Biggles Air Supplies a company that makes aircraft supplies He asks you to create an organisation chart for his company He gives you the following list of all his employees and who they report to
Mr James Biggles Chief Executive Officer
Jane Doep Personal Assistant to CEO
Mrs Monica Stepworth Financial Manager (reports to CEO)
Judith Zantes Accountant (reports to Financial Manager)
Mary Smallville Accountant (reports to Financial Manager)
Janey Poretuna Admin Assistant (reports to Judith Zantes)
Mickey Laluevu IT technician (reports to Financial Manager)
Mr Hank Johnson Operations Manager (reports to CEO)
Frank Hapil Engineering Manager (reports to Operations Manager)
Joe Smither Engineering Supervisor (reports to Engineering Manager)
Howie Fartherton Engineering Technician (reports to Engineering Supervisor)
Ernie Jusef Engineering Technician (reports to Engineering Supervisor)
Rob Luxemburg Apprentice Technician (reports to Ernie Jusef)
Harry Monahan Interiors Manager (reports to Operations Manager)
Barney Jokka Interiors Technician (reports to Interiors Supervisor) Design an organisation chart for Biggles Air Supplies and draw it in the space below
Mr James Biggles
CEO
Jane Doep
Personal
Assistant
Mrs Monica Stepworth
Financial Manager
Judith Zantes
Accountant
Janey Poretuna
Admin Assistant
Mary Smallville
Accountant
Mickey Laluevu
IT technician
Mr Hank Johnson
Operations Manager
Frank Hapil
Engineering
Manager
Harry Monahan
Interiors Manager
Joe Smither
Engineering
Supervisor
Howie Fartherton
Engineering
Technician
Ernie Jusef
Engineering
Technician
Rob Luxemburg
Apprentice
Technician
Barney Jokka
Interiors
Technician
Foundation Computing
Basic Schematic Diagrams 5957docx Page 41
2) Think of a simple process that has at least five steps and involves some form of feedback or choice For example operating a vending machine topping up your mobile phone using EFTPOS checking messages on an answering machine
Design a flow chart to represent your process
Dial 06345
Enter your dialing code and
phone number followed by
the key
Dial number for
service you require
Listen to saved messagesListen to new messages
Dial number for
service you require
Save message Delete message
START
FINISH
Dial 2
Dial 1
Dial 1
Dial 2
Dial 1
Dial 2
Foundation Computing
Basic Schematic Diagrams 5957docx Page 42
Foundation Computing
Basic Schematic Diagrams 5957docx Page 43
Part 2
Produce schematic diagrams from a given brief using a computer application
OBJECTIVES
On successful completion of this section you will be able to Produce schematic diagrams from a given brief using a computer application
Performance criteria
21 The symbols used in each diagram are consistent with the type of diagram and the specifications of the brief
22 The final diagram is readable clearly illustrates the object being diagrammed
and is consistent with the specifications of the brief
TOPICS
Topic 1 Symbols used are consistent with diagram type and specifications Topic 2 Diagram is clear readable and consistent with specifications
Self Test
Self Test Answers
Foundation Computing
Basic Schematic Diagrams 5957docx Page 44
TOPIC 1 Symbols used are consistent with diagram type and specifications A symbol is something such as an object picture written word sound or particular mark that represents something else by association resemblance or convention For example a red octagon may be a symbol for STOP On maps crossed sabres may indicate a battlefield Numerals are symbols for numbers All language consists of symbols The word cat is not a cat but is an arbitrary symbol representing the idea of a cat There are many symbols for many things Examples range from Peace Pipe Red Cross to Electrical symbols It is good when doing schematic drawings to use symbols that are clearly recognised and interpreted Symbols that have been internationally standardised are the best Circuit diagram symbols have differed from country to country and have changed over time They are now to a large extent internationally standardized Simple components often had symbols intended to represent some feature of the physical construction of the device There are several national and international standards for graphical symbols in circuit diagrams in particular
IEC 60617 (also known as British Standard BS 3939)
ANSI standard Y32 (also known as IEEE Std 315) IEC 60617 originally consisted of 13 parts from resistors and capacitors to logic symbols and even a generalised drawing standard of connections and bus line widths It is now published as a subscription online database IEC 60617-DB Different symbols may be used depending on the discipline using the drawing for example lighting and power symbols used as part of architectural drawings may be different from symbols for devices used in electronics Different electronic components have different characteristics it is necessary to distinguish between them in any circuit diagram Of course we could use the block diagram approach and just identify each component with words Unfortunately this takes up a lot of space and makes the overall diagram harder to recognize or understand quickly We need a way to understand electrical diagrams far more quickly and easily
Foundation Computing
Basic Schematic Diagrams 5957docx Page 45
The answer is to use schematic symbols to represent electronic components as shown in the diagram below In this diagram we show the schematic symbol of a battery as the electrical source and the symbol of a resistor as the load Even without the words and arrows the symbols define exactly what this circuit is and how it behaves
Some good procedures to follow with symbols include
Using templates for frequently used symbols
Use symbols consistently
Use a library of symbols such as from IEC 60617-DB
Foundation Computing
Basic Schematic Diagrams 5957docx Page 46
TOPIC 2 Diagram is clear readable and consistent with specifications Creating a simple diagram using MSPaint To start with letrsquos create a simple flow chart representing the stages in designing a schematic diagram There are four stages in this process
1) Gather your information 2) Organise your information 3) Make connections 4) Test your diagram
Our flow chart will consist of four rectangles arranged vertically with downward pointing arrows as connectors A rounded rectangle at the top and at the bottom of the flowchart will indicate START and FINISH respectively Step by step
Open Microsoft Paint
Click on the Rectangle tool then click and drag in the drawing area to draw a rectangle
Repeat this step to draw four boxes in the drawing area OR click on the Select tool and click and drag to select the first rectangle then right-click to copy and paste three more rectangles the same size in the drawing area
Foundation Computing
Basic Schematic Diagrams 5957docx Page 47
Using the Rounded Rectangle tool draw a rounded rectangle at the top and bottom of your flow chart
Foundation Computing
Basic Schematic Diagrams 5957docx Page 48
Use the Line tool to draw arrows between each box In the Options area under the Tool bar you can choose the thickness of line that you want to use Remember too that if you hold down the Shift key on the keyboard while you are drawing a line you can create a 45 degree angle
Use the Text tool to add text to the shapes by clicking on the Text tool clicking and dragging to create a textbox inside your shape then typing your text Check your spelling carefully letter by letter as you go
Foundation Computing
Basic Schematic Diagrams 5957docx Page 49
The basic flowchart created in Microsoft Paint could look something like this
Foundation Computing
Basic Schematic Diagrams 5957docx Page 50
Common problems with diagrams Even well-designed schematic diagrams will be difficult for the target audience to read and understand if symbols are used inconsistently or the layout of the diagram is unfamiliar For example if a flowchart has different shapes used for each element and different types of arrows used randomly it will be more difficult for readers to see the overall direction and meaning of the diagram If the shapes on an organisation chart are different sizes and randomly positioned with no clear levels or hierarchy the diagram will not provide a clear overview of the organisationrsquos structure If an electrical circuit diagram has unfamiliar symbols used for elements such as switches resistors and batteries then it will not make sense to its intended audience
Tips for improving the readability of your schematic diagrams
Use symbols and shapes consistently ie elements that are similar should have the same symbol or shape
Avoid having connectors crossing over each other
Avoid having symbols or shapes overlapping
Use arrows on connectors or flow lines to indicate direction
Use colours text size and font consistently
Diagrams that can be read top-to-bottom and left-to-right are easier to read
In a process diagram have only one connector leading into a symbol but have more coming out where necessary to indicate different directions or decisions
Diagrams for a technical audience such as electrical or computer programming schematics should follow accepted conventions for symbols and layout
Diagrams indicating a hierarchy of positions ideas or stages are clearer if elements belonging to the same level are a similar shape size and position on the page
Keep labels as clear and as brief as possible Carefully check the spelling of all names and labels letter by letter ndash errors in the spelling of names or scientific and technical terms look unprofessional and can be confusing for readers
Foundation Computing
Basic Schematic Diagrams 5957docx Page 51
Self Test Look at the schematic diagrams that follow Make notes under each example of what is wrong with the diagram what is right about the diagram and what could be changed to make it clear and meaningful to its intended audience 1) This flow chart is supposed to show police officers how to get a suspect to confess to a crime
START
Confidently accuse
suspect of crime
Describe a
scenario that
enables suspect
to admit guiltAllow suspect to
voice objections
Invade suspectrsquos
personal space
Suspect becomes
uncomfortable
Suspect
doesnrsquot
deny guilt
Suspect
denies guilt
No reaction
Elicit confession
Rephrase objections as
confessions
FINISH
Foundation Computing
Basic Schematic Diagrams 5957docx Page 52
2) The following diagram is an organisation chart for Widget Enterprises
John Smith
MANAGER
Seth Drew
IT MANAGER
May Furur
SECRETARY
Judith Holland
CUSTOMER SERVICES manager
Jad Ling
HELPDESK
Harry Petal
FINANCIAL MANAGER
Wanda Springer
MARKETING
MANAGER
Bob Smithells
CLEANER
Kelly Inlerl
MARKETING ASSISTANT
Beryl Thin
CUSTOMER SERVICES ASSISTANTValda Rigley
CUSTOMER
SERVICES
ASSISTANT
Levi Quayle
COMPUTER
TECHNICIAN
3) Which of the following computer applications can be used to create schematic diagrams
a) Microsoft Visio
b) Microsoft Paint
c) Microsoft Word
d) All of the above
4) Which frequently used shapes does the Microsoft Paint Tool bar contain templates for
5) Where in the Microsoft Paint window would you be able to select the thickness of line that you wanted for a brushstroke 6) Identify the purpose and intended audience for a diagram showing a businessrsquos marketing plan 7) Name two characteristics of well-designed schematic diagrams 8) Identify four steps involved in designing schematic diagrams 9) Why is it important to use conventionally accepted and familiar shapes and symbols in your schematic diagrams
Foundation Computing
Basic Schematic Diagrams 5957docx Page 53
Self Test Answers 1) This flow chart is supposed to show police officers how to get a suspect to confess to a crime
START
Confidently accuse
suspect of crime
Describe a
scenario that
enables suspect
to admit guiltAllow suspect to
voice objections
Invade suspectrsquos
personal space
Suspect becomes
uncomfortable
Suspect
doesnrsquot
deny guilt
Suspect
denies guilt
No reaction
Elicit confession
Rephrase objections as
confessions
FINISH
Random shapes are meaningless and confusing ndash use conventional flow chart symbols
Stages of process are not clear ndash arrange shapes top to bottom with options at each stage branching off to side at same level
Connectors that are either straight or curved would be more consistent
Labels are clear
Text uses consistent font and size
Foundation Computing
Basic Schematic Diagrams 5957docx Page 54
2) The following diagram is an organisation chart for Widget Enterprises
John Smith
MANAGER
Seth Drew
IT MANAGER
May Furur
SECRETARY
Judith Holland
CUSTOMER SERVICES manager
Jad Ling
HELPDESK
Harry Petal
FINANCIAL MANAGER
Wanda Springer
MARKETING
MANAGER
Bob Smithells
CLEANER
Kelly Inlerl
MARKETING ASSISTANT
Beryl Thin
CUSTOMER SERVICES ASSISTANTValda Rigley
CUSTOMER
SERVICES
ASSISTANT
Levi Quayle
COMPUTER
TECHNICIAN
No clear levels to hierarchy ndash organise so that diagram reads top to bottom and positions at similar level are in same horizontal space
Different sized boxes and borders on some boxes are meaningless ndash need consistent style for similar elements
Connectors cross over each other and boxes overlap ndash arrange space to avoid this
Text size and font is mostly consistent but one typo needs correcting
3) Which of the following computer applications can be used to create schematic diagrams
a) Microsoft Visio
b) Microsoft Paint
c) Microsoft Word
d) All of the above correct
4) Which frequently used shapes does the Microsoft Paint Tool bar contain templates for
Polygon rectangle ovalellipse
Foundation Computing
Basic Schematic Diagrams 5957docx Page 55
5) Where in the Microsoft Paint window would you be able to select the thickness of line that you wanted for a brushstroke
Options area below the Toolbar
6) Identify the purpose and intended audience for a diagram showing a businessrsquos marketing plan
The purpose would be to provide an overview of the businessrsquos marketing strategy Audience could include management and employees of the business especially the Marketing department potential investors shareholders and directors of the business
7) Name two characteristics of well-designed schematic diagrams Any of simple easy for the target audience to understand include all relevant elements or parts of the process clear and logical connections between elements accurate 8) Identify four steps involved in designing schematic diagrams Gather information organise information make connections between elements test your diagram 9) Why is it important to use conventionally accepted and familiar shapes and
symbols in your schematic diagrams So that the diagram will be easily understood by the target audience
Foundation Computing
Basic Schematic Diagrams 5957docx Page 56
References httpwindowsmicrosoftcomen-NZwindows7Getting-started-with-Paint accessed Sat 5th December in Timaru New Zealand httpenwikipediaorgwikiSchematic_diagrams accessed Sat 5th December in Timaru New Zealand httpenwikipediaorgwikiSymbol accessed Sat 5th December in Timaru New Zealand
Foundation Computing
Basic Schematic Diagrams 5957docx Page 36
Step 2 Organise your information Take the information that you have left and sort through it How you organise your information will depend on the type of diagram you are designing For example an organisationrsquos chart usually has different levels and shows who its members report to so you might group people by department and by level A flow chart like the example wersquore creating usually shows a process Information is grouped in the order we would use it If any other steps or information occurs to you as you are organising your information add them in Herersquos an example of how the key steps involved in selling on trademe could be ordered
Choose items that sell
Look at similar listings
Decide on a reserve price
Take a clear photograph
Identify your target audience
Write a clear description
Upload your item
Choose the correct category
Monitor watchers bids and views
Lower your reserve
Fixed price offers
Relist
Step 3 Make connections Once the elements are grouped or arranged in a logical order a clearer picture of the process or system you are representing in your diagram should start to emerge However unlike a list which usually reads from top to bottom only a diagram can show connections in many different directions and working out the links between elements is an essential part of designing a coherent diagram At this stage of the design process it is helpful to sketch out a basic plan of the elements you want to include and the flow-lines or connections between them In order to work out the connections between the elements ask questions such as What happens ifhellip What do I do beforeafter this What decisions need to be made now What actions need to be taken Use arrows to show connections between elements group elements that are part of the same stage or level of the process next to or near to each other and use shapes to show which elements are similar to each other eg diamonds for decisions rectangles for instructions or actions Make up your own meanings for shapes if necessary but be sure to use them consistently
Foundation Computing
Basic Schematic Diagrams 5957docx Page 37
The flow chart below shows how our list of elements above changes and gets re-ordered as we ask these questions and organise the information into a logical and coherent diagram
Decide on your
reserve price
START
Relist
Take a photo that is
clear and item looks
good
Decide on your
ideal buyer
Write a description
of your item
highlighting its
benefits for your
buyer
Upload your item in
a category your
buyer is likely to be
looking in
Monitor how many
views watchers and
bids your item gets
Lower your reserve
Item meets reserve
and sellsItem doesnrsquot sell
Offer to watchers for
your reserve
Decide what you
want to sell
Check what similar
items are currently
selling for
Lots of views but
no watchers
No interestFINISH
Foundation Computing
Basic Schematic Diagrams 5957docx Page 38
Step 4 Test your diagram The final step in designing your diagram is checking that it is as effective as possible To do this you should work through each stage step by step challenging it as you go Picture the process in your mind as you follow the links checking that you have included all the actions and decisions required that they are in the correct order and that no steps are duplicated Once yoursquore confident that the diagram is correct look at it again critically to see if you can improve it or clarify it Is there anywhere you can simplify it by removing unnecessary steps Is there anywhere that seems vague and would be easier to understand if you added a step or a connector Now imagine that you are a member of your target audience For a moment try to forget everything you know about the system or process you have designed a diagram for except for what your target audience knows Look at the diagram with fresh eyes does it make sense to you now Does anything seem odd confusing or out of place Finally look at the layout of your diagram Is it easy to read and follow Have you used shapes texts and arrows consistently Are your shapes and texts uniform and lined up properly Are your connectors clearly defined or are they criss-crossing all over each other Check the spelling of labels carefully ndash go through letter by letter to make sure all names and technical or unfamiliar terms are correct
Discussion With a partner look critically at our example diagram above Discuss any parts of it that you think could be better and any changes you would make to improve the readability of the flow chart Make note on the flow chart above of any areas that you think could be improved Share your answers with the rest of the class
Foundation Computing
Basic Schematic Diagrams 5957docx Page 39
Self Test 1) Mr Biggles owns Biggles Air Supplies a company that makes aircraft supplies He asks you to create an organisation chart for his company He gives you the following list of all his employees and who they report to
Mr James Biggles Chief Executive Officer
Jane Doep Personal Assistant to CEO
Mrs Monica Stepworth Financial Manager (reports to CEO)
Judith Zantes Accountant (reports to Financial Manager)
Mary Smallville Accountant (reports to Financial Manager)
Janey Poretuna Admin Assistant (reports to Judith Zantes)
Mickey Laluevu IT technician (reports to Financial Manager)
Mr Hank Johnson Operations Manager (reports to CEO)
Frank Hapil Engineering Manager (reports to Operations Manager)
Joe Smither Engineering Supervisor (reports to Engineering Manager)
Howie Fartherton Engineering Technician (reports to Engineering Supervisor)
Ernie Jusef Engineering Technician (reports to Engineering Supervisor)
Rob Luxemburg Apprentice Technician (reports to Ernie Jusef)
Harry Monahan Interiors Manager (reports to Operations Manager)
Barney Jokka Interiors Technician (reports to Interiors Supervisor) Design an organisation chart for Biggles Air Supplies and draw it in the space below
2) Think of a simple process that has at least five steps and involves some form of feedback or choice For example operating a vending machine topping up your mobile phone using EFTPOS checking messages on an answering machine
Design a flow chart to represent your process
Foundation Computing
Basic Schematic Diagrams 5957docx Page 40
Self Test Answers
1) Mr Biggles owns Biggles Air Supplies a company that makes aircraft supplies He asks you to create an organisation chart for his company He gives you the following list of all his employees and who they report to
Mr James Biggles Chief Executive Officer
Jane Doep Personal Assistant to CEO
Mrs Monica Stepworth Financial Manager (reports to CEO)
Judith Zantes Accountant (reports to Financial Manager)
Mary Smallville Accountant (reports to Financial Manager)
Janey Poretuna Admin Assistant (reports to Judith Zantes)
Mickey Laluevu IT technician (reports to Financial Manager)
Mr Hank Johnson Operations Manager (reports to CEO)
Frank Hapil Engineering Manager (reports to Operations Manager)
Joe Smither Engineering Supervisor (reports to Engineering Manager)
Howie Fartherton Engineering Technician (reports to Engineering Supervisor)
Ernie Jusef Engineering Technician (reports to Engineering Supervisor)
Rob Luxemburg Apprentice Technician (reports to Ernie Jusef)
Harry Monahan Interiors Manager (reports to Operations Manager)
Barney Jokka Interiors Technician (reports to Interiors Supervisor) Design an organisation chart for Biggles Air Supplies and draw it in the space below
Mr James Biggles
CEO
Jane Doep
Personal
Assistant
Mrs Monica Stepworth
Financial Manager
Judith Zantes
Accountant
Janey Poretuna
Admin Assistant
Mary Smallville
Accountant
Mickey Laluevu
IT technician
Mr Hank Johnson
Operations Manager
Frank Hapil
Engineering
Manager
Harry Monahan
Interiors Manager
Joe Smither
Engineering
Supervisor
Howie Fartherton
Engineering
Technician
Ernie Jusef
Engineering
Technician
Rob Luxemburg
Apprentice
Technician
Barney Jokka
Interiors
Technician
Foundation Computing
Basic Schematic Diagrams 5957docx Page 41
2) Think of a simple process that has at least five steps and involves some form of feedback or choice For example operating a vending machine topping up your mobile phone using EFTPOS checking messages on an answering machine
Design a flow chart to represent your process
Dial 06345
Enter your dialing code and
phone number followed by
the key
Dial number for
service you require
Listen to saved messagesListen to new messages
Dial number for
service you require
Save message Delete message
START
FINISH
Dial 2
Dial 1
Dial 1
Dial 2
Dial 1
Dial 2
Foundation Computing
Basic Schematic Diagrams 5957docx Page 42
Foundation Computing
Basic Schematic Diagrams 5957docx Page 43
Part 2
Produce schematic diagrams from a given brief using a computer application
OBJECTIVES
On successful completion of this section you will be able to Produce schematic diagrams from a given brief using a computer application
Performance criteria
21 The symbols used in each diagram are consistent with the type of diagram and the specifications of the brief
22 The final diagram is readable clearly illustrates the object being diagrammed
and is consistent with the specifications of the brief
TOPICS
Topic 1 Symbols used are consistent with diagram type and specifications Topic 2 Diagram is clear readable and consistent with specifications
Self Test
Self Test Answers
Foundation Computing
Basic Schematic Diagrams 5957docx Page 44
TOPIC 1 Symbols used are consistent with diagram type and specifications A symbol is something such as an object picture written word sound or particular mark that represents something else by association resemblance or convention For example a red octagon may be a symbol for STOP On maps crossed sabres may indicate a battlefield Numerals are symbols for numbers All language consists of symbols The word cat is not a cat but is an arbitrary symbol representing the idea of a cat There are many symbols for many things Examples range from Peace Pipe Red Cross to Electrical symbols It is good when doing schematic drawings to use symbols that are clearly recognised and interpreted Symbols that have been internationally standardised are the best Circuit diagram symbols have differed from country to country and have changed over time They are now to a large extent internationally standardized Simple components often had symbols intended to represent some feature of the physical construction of the device There are several national and international standards for graphical symbols in circuit diagrams in particular
IEC 60617 (also known as British Standard BS 3939)
ANSI standard Y32 (also known as IEEE Std 315) IEC 60617 originally consisted of 13 parts from resistors and capacitors to logic symbols and even a generalised drawing standard of connections and bus line widths It is now published as a subscription online database IEC 60617-DB Different symbols may be used depending on the discipline using the drawing for example lighting and power symbols used as part of architectural drawings may be different from symbols for devices used in electronics Different electronic components have different characteristics it is necessary to distinguish between them in any circuit diagram Of course we could use the block diagram approach and just identify each component with words Unfortunately this takes up a lot of space and makes the overall diagram harder to recognize or understand quickly We need a way to understand electrical diagrams far more quickly and easily
Foundation Computing
Basic Schematic Diagrams 5957docx Page 45
The answer is to use schematic symbols to represent electronic components as shown in the diagram below In this diagram we show the schematic symbol of a battery as the electrical source and the symbol of a resistor as the load Even without the words and arrows the symbols define exactly what this circuit is and how it behaves
Some good procedures to follow with symbols include
Using templates for frequently used symbols
Use symbols consistently
Use a library of symbols such as from IEC 60617-DB
Foundation Computing
Basic Schematic Diagrams 5957docx Page 46
TOPIC 2 Diagram is clear readable and consistent with specifications Creating a simple diagram using MSPaint To start with letrsquos create a simple flow chart representing the stages in designing a schematic diagram There are four stages in this process
1) Gather your information 2) Organise your information 3) Make connections 4) Test your diagram
Our flow chart will consist of four rectangles arranged vertically with downward pointing arrows as connectors A rounded rectangle at the top and at the bottom of the flowchart will indicate START and FINISH respectively Step by step
Open Microsoft Paint
Click on the Rectangle tool then click and drag in the drawing area to draw a rectangle
Repeat this step to draw four boxes in the drawing area OR click on the Select tool and click and drag to select the first rectangle then right-click to copy and paste three more rectangles the same size in the drawing area
Foundation Computing
Basic Schematic Diagrams 5957docx Page 47
Using the Rounded Rectangle tool draw a rounded rectangle at the top and bottom of your flow chart
Foundation Computing
Basic Schematic Diagrams 5957docx Page 48
Use the Line tool to draw arrows between each box In the Options area under the Tool bar you can choose the thickness of line that you want to use Remember too that if you hold down the Shift key on the keyboard while you are drawing a line you can create a 45 degree angle
Use the Text tool to add text to the shapes by clicking on the Text tool clicking and dragging to create a textbox inside your shape then typing your text Check your spelling carefully letter by letter as you go
Foundation Computing
Basic Schematic Diagrams 5957docx Page 49
The basic flowchart created in Microsoft Paint could look something like this
Foundation Computing
Basic Schematic Diagrams 5957docx Page 50
Common problems with diagrams Even well-designed schematic diagrams will be difficult for the target audience to read and understand if symbols are used inconsistently or the layout of the diagram is unfamiliar For example if a flowchart has different shapes used for each element and different types of arrows used randomly it will be more difficult for readers to see the overall direction and meaning of the diagram If the shapes on an organisation chart are different sizes and randomly positioned with no clear levels or hierarchy the diagram will not provide a clear overview of the organisationrsquos structure If an electrical circuit diagram has unfamiliar symbols used for elements such as switches resistors and batteries then it will not make sense to its intended audience
Tips for improving the readability of your schematic diagrams
Use symbols and shapes consistently ie elements that are similar should have the same symbol or shape
Avoid having connectors crossing over each other
Avoid having symbols or shapes overlapping
Use arrows on connectors or flow lines to indicate direction
Use colours text size and font consistently
Diagrams that can be read top-to-bottom and left-to-right are easier to read
In a process diagram have only one connector leading into a symbol but have more coming out where necessary to indicate different directions or decisions
Diagrams for a technical audience such as electrical or computer programming schematics should follow accepted conventions for symbols and layout
Diagrams indicating a hierarchy of positions ideas or stages are clearer if elements belonging to the same level are a similar shape size and position on the page
Keep labels as clear and as brief as possible Carefully check the spelling of all names and labels letter by letter ndash errors in the spelling of names or scientific and technical terms look unprofessional and can be confusing for readers
Foundation Computing
Basic Schematic Diagrams 5957docx Page 51
Self Test Look at the schematic diagrams that follow Make notes under each example of what is wrong with the diagram what is right about the diagram and what could be changed to make it clear and meaningful to its intended audience 1) This flow chart is supposed to show police officers how to get a suspect to confess to a crime
START
Confidently accuse
suspect of crime
Describe a
scenario that
enables suspect
to admit guiltAllow suspect to
voice objections
Invade suspectrsquos
personal space
Suspect becomes
uncomfortable
Suspect
doesnrsquot
deny guilt
Suspect
denies guilt
No reaction
Elicit confession
Rephrase objections as
confessions
FINISH
Foundation Computing
Basic Schematic Diagrams 5957docx Page 52
2) The following diagram is an organisation chart for Widget Enterprises
John Smith
MANAGER
Seth Drew
IT MANAGER
May Furur
SECRETARY
Judith Holland
CUSTOMER SERVICES manager
Jad Ling
HELPDESK
Harry Petal
FINANCIAL MANAGER
Wanda Springer
MARKETING
MANAGER
Bob Smithells
CLEANER
Kelly Inlerl
MARKETING ASSISTANT
Beryl Thin
CUSTOMER SERVICES ASSISTANTValda Rigley
CUSTOMER
SERVICES
ASSISTANT
Levi Quayle
COMPUTER
TECHNICIAN
3) Which of the following computer applications can be used to create schematic diagrams
a) Microsoft Visio
b) Microsoft Paint
c) Microsoft Word
d) All of the above
4) Which frequently used shapes does the Microsoft Paint Tool bar contain templates for
5) Where in the Microsoft Paint window would you be able to select the thickness of line that you wanted for a brushstroke 6) Identify the purpose and intended audience for a diagram showing a businessrsquos marketing plan 7) Name two characteristics of well-designed schematic diagrams 8) Identify four steps involved in designing schematic diagrams 9) Why is it important to use conventionally accepted and familiar shapes and symbols in your schematic diagrams
Foundation Computing
Basic Schematic Diagrams 5957docx Page 53
Self Test Answers 1) This flow chart is supposed to show police officers how to get a suspect to confess to a crime
START
Confidently accuse
suspect of crime
Describe a
scenario that
enables suspect
to admit guiltAllow suspect to
voice objections
Invade suspectrsquos
personal space
Suspect becomes
uncomfortable
Suspect
doesnrsquot
deny guilt
Suspect
denies guilt
No reaction
Elicit confession
Rephrase objections as
confessions
FINISH
Random shapes are meaningless and confusing ndash use conventional flow chart symbols
Stages of process are not clear ndash arrange shapes top to bottom with options at each stage branching off to side at same level
Connectors that are either straight or curved would be more consistent
Labels are clear
Text uses consistent font and size
Foundation Computing
Basic Schematic Diagrams 5957docx Page 54
2) The following diagram is an organisation chart for Widget Enterprises
John Smith
MANAGER
Seth Drew
IT MANAGER
May Furur
SECRETARY
Judith Holland
CUSTOMER SERVICES manager
Jad Ling
HELPDESK
Harry Petal
FINANCIAL MANAGER
Wanda Springer
MARKETING
MANAGER
Bob Smithells
CLEANER
Kelly Inlerl
MARKETING ASSISTANT
Beryl Thin
CUSTOMER SERVICES ASSISTANTValda Rigley
CUSTOMER
SERVICES
ASSISTANT
Levi Quayle
COMPUTER
TECHNICIAN
No clear levels to hierarchy ndash organise so that diagram reads top to bottom and positions at similar level are in same horizontal space
Different sized boxes and borders on some boxes are meaningless ndash need consistent style for similar elements
Connectors cross over each other and boxes overlap ndash arrange space to avoid this
Text size and font is mostly consistent but one typo needs correcting
3) Which of the following computer applications can be used to create schematic diagrams
a) Microsoft Visio
b) Microsoft Paint
c) Microsoft Word
d) All of the above correct
4) Which frequently used shapes does the Microsoft Paint Tool bar contain templates for
Polygon rectangle ovalellipse
Foundation Computing
Basic Schematic Diagrams 5957docx Page 55
5) Where in the Microsoft Paint window would you be able to select the thickness of line that you wanted for a brushstroke
Options area below the Toolbar
6) Identify the purpose and intended audience for a diagram showing a businessrsquos marketing plan
The purpose would be to provide an overview of the businessrsquos marketing strategy Audience could include management and employees of the business especially the Marketing department potential investors shareholders and directors of the business
7) Name two characteristics of well-designed schematic diagrams Any of simple easy for the target audience to understand include all relevant elements or parts of the process clear and logical connections between elements accurate 8) Identify four steps involved in designing schematic diagrams Gather information organise information make connections between elements test your diagram 9) Why is it important to use conventionally accepted and familiar shapes and
symbols in your schematic diagrams So that the diagram will be easily understood by the target audience
Foundation Computing
Basic Schematic Diagrams 5957docx Page 56
References httpwindowsmicrosoftcomen-NZwindows7Getting-started-with-Paint accessed Sat 5th December in Timaru New Zealand httpenwikipediaorgwikiSchematic_diagrams accessed Sat 5th December in Timaru New Zealand httpenwikipediaorgwikiSymbol accessed Sat 5th December in Timaru New Zealand
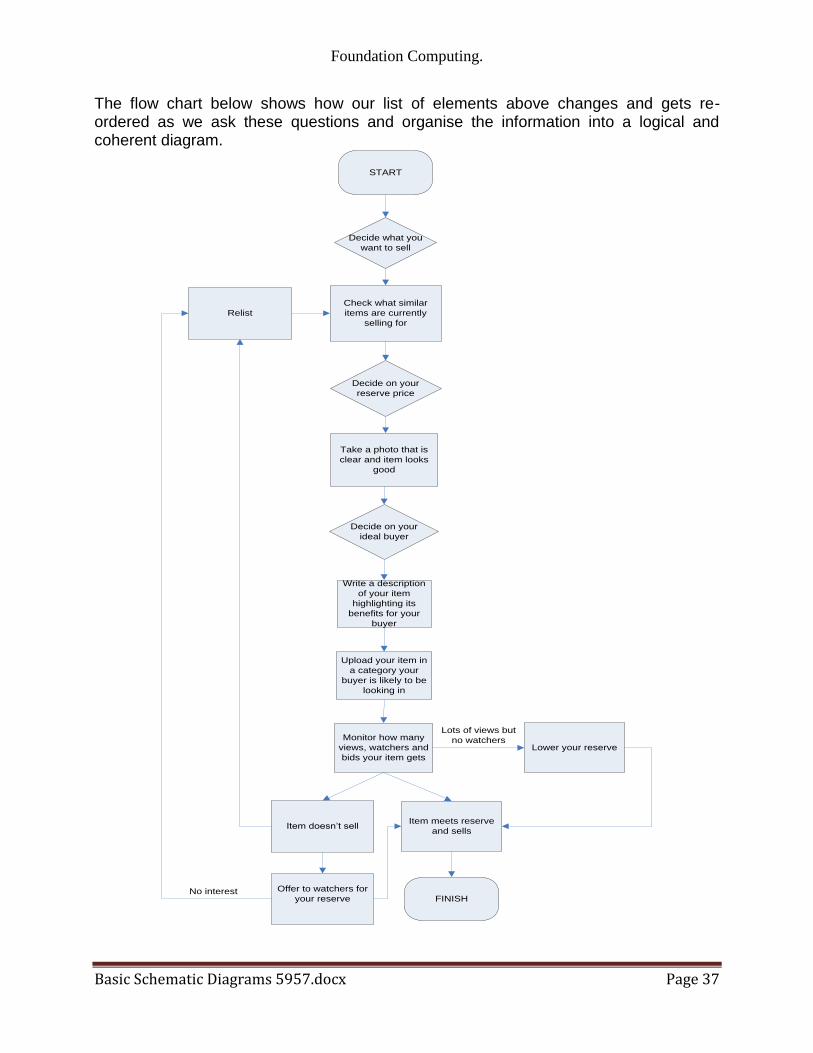
Foundation Computing
Basic Schematic Diagrams 5957docx Page 40
Self Test Answers
1) Mr Biggles owns Biggles Air Supplies a company that makes aircraft supplies He asks you to create an organisation chart for his company He gives you the following list of all his employees and who they report to
Mr James Biggles Chief Executive Officer
Jane Doep Personal Assistant to CEO
Mrs Monica Stepworth Financial Manager (reports to CEO)
Judith Zantes Accountant (reports to Financial Manager)
Mary Smallville Accountant (reports to Financial Manager)
Janey Poretuna Admin Assistant (reports to Judith Zantes)
Mickey Laluevu IT technician (reports to Financial Manager)
Mr Hank Johnson Operations Manager (reports to CEO)
Frank Hapil Engineering Manager (reports to Operations Manager)
Joe Smither Engineering Supervisor (reports to Engineering Manager)
Howie Fartherton Engineering Technician (reports to Engineering Supervisor)
Ernie Jusef Engineering Technician (reports to Engineering Supervisor)
Rob Luxemburg Apprentice Technician (reports to Ernie Jusef)
Harry Monahan Interiors Manager (reports to Operations Manager)
Barney Jokka Interiors Technician (reports to Interiors Supervisor) Design an organisation chart for Biggles Air Supplies and draw it in the space below
Mr James Biggles
CEO
Jane Doep
Personal
Assistant
Mrs Monica Stepworth
Financial Manager
Judith Zantes
Accountant
Janey Poretuna
Admin Assistant
Mary Smallville
Accountant
Mickey Laluevu
IT technician
Mr Hank Johnson
Operations Manager
Frank Hapil
Engineering
Manager
Harry Monahan
Interiors Manager
Joe Smither
Engineering
Supervisor
Howie Fartherton
Engineering
Technician
Ernie Jusef
Engineering
Technician
Rob Luxemburg
Apprentice
Technician
Barney Jokka
Interiors
Technician
Foundation Computing
Basic Schematic Diagrams 5957docx Page 41
2) Think of a simple process that has at least five steps and involves some form of feedback or choice For example operating a vending machine topping up your mobile phone using EFTPOS checking messages on an answering machine
Design a flow chart to represent your process
Dial 06345
Enter your dialing code and
phone number followed by
the key
Dial number for
service you require
Listen to saved messagesListen to new messages
Dial number for
service you require
Save message Delete message
START
FINISH
Dial 2
Dial 1
Dial 1
Dial 2
Dial 1
Dial 2
Foundation Computing
Basic Schematic Diagrams 5957docx Page 42
Foundation Computing
Basic Schematic Diagrams 5957docx Page 43
Part 2
Produce schematic diagrams from a given brief using a computer application
OBJECTIVES
On successful completion of this section you will be able to Produce schematic diagrams from a given brief using a computer application
Performance criteria
21 The symbols used in each diagram are consistent with the type of diagram and the specifications of the brief
22 The final diagram is readable clearly illustrates the object being diagrammed
and is consistent with the specifications of the brief
TOPICS
Topic 1 Symbols used are consistent with diagram type and specifications Topic 2 Diagram is clear readable and consistent with specifications
Self Test
Self Test Answers
Foundation Computing
Basic Schematic Diagrams 5957docx Page 44
TOPIC 1 Symbols used are consistent with diagram type and specifications A symbol is something such as an object picture written word sound or particular mark that represents something else by association resemblance or convention For example a red octagon may be a symbol for STOP On maps crossed sabres may indicate a battlefield Numerals are symbols for numbers All language consists of symbols The word cat is not a cat but is an arbitrary symbol representing the idea of a cat There are many symbols for many things Examples range from Peace Pipe Red Cross to Electrical symbols It is good when doing schematic drawings to use symbols that are clearly recognised and interpreted Symbols that have been internationally standardised are the best Circuit diagram symbols have differed from country to country and have changed over time They are now to a large extent internationally standardized Simple components often had symbols intended to represent some feature of the physical construction of the device There are several national and international standards for graphical symbols in circuit diagrams in particular
IEC 60617 (also known as British Standard BS 3939)
ANSI standard Y32 (also known as IEEE Std 315) IEC 60617 originally consisted of 13 parts from resistors and capacitors to logic symbols and even a generalised drawing standard of connections and bus line widths It is now published as a subscription online database IEC 60617-DB Different symbols may be used depending on the discipline using the drawing for example lighting and power symbols used as part of architectural drawings may be different from symbols for devices used in electronics Different electronic components have different characteristics it is necessary to distinguish between them in any circuit diagram Of course we could use the block diagram approach and just identify each component with words Unfortunately this takes up a lot of space and makes the overall diagram harder to recognize or understand quickly We need a way to understand electrical diagrams far more quickly and easily
Foundation Computing
Basic Schematic Diagrams 5957docx Page 45
The answer is to use schematic symbols to represent electronic components as shown in the diagram below In this diagram we show the schematic symbol of a battery as the electrical source and the symbol of a resistor as the load Even without the words and arrows the symbols define exactly what this circuit is and how it behaves
Some good procedures to follow with symbols include
Using templates for frequently used symbols
Use symbols consistently
Use a library of symbols such as from IEC 60617-DB
Foundation Computing
Basic Schematic Diagrams 5957docx Page 46
TOPIC 2 Diagram is clear readable and consistent with specifications Creating a simple diagram using MSPaint To start with letrsquos create a simple flow chart representing the stages in designing a schematic diagram There are four stages in this process
1) Gather your information 2) Organise your information 3) Make connections 4) Test your diagram
Our flow chart will consist of four rectangles arranged vertically with downward pointing arrows as connectors A rounded rectangle at the top and at the bottom of the flowchart will indicate START and FINISH respectively Step by step
Open Microsoft Paint
Click on the Rectangle tool then click and drag in the drawing area to draw a rectangle
Repeat this step to draw four boxes in the drawing area OR click on the Select tool and click and drag to select the first rectangle then right-click to copy and paste three more rectangles the same size in the drawing area
Foundation Computing
Basic Schematic Diagrams 5957docx Page 47
Using the Rounded Rectangle tool draw a rounded rectangle at the top and bottom of your flow chart
Foundation Computing
Basic Schematic Diagrams 5957docx Page 48
Use the Line tool to draw arrows between each box In the Options area under the Tool bar you can choose the thickness of line that you want to use Remember too that if you hold down the Shift key on the keyboard while you are drawing a line you can create a 45 degree angle
Use the Text tool to add text to the shapes by clicking on the Text tool clicking and dragging to create a textbox inside your shape then typing your text Check your spelling carefully letter by letter as you go
Foundation Computing
Basic Schematic Diagrams 5957docx Page 49
The basic flowchart created in Microsoft Paint could look something like this
Foundation Computing
Basic Schematic Diagrams 5957docx Page 50
Common problems with diagrams Even well-designed schematic diagrams will be difficult for the target audience to read and understand if symbols are used inconsistently or the layout of the diagram is unfamiliar For example if a flowchart has different shapes used for each element and different types of arrows used randomly it will be more difficult for readers to see the overall direction and meaning of the diagram If the shapes on an organisation chart are different sizes and randomly positioned with no clear levels or hierarchy the diagram will not provide a clear overview of the organisationrsquos structure If an electrical circuit diagram has unfamiliar symbols used for elements such as switches resistors and batteries then it will not make sense to its intended audience
Tips for improving the readability of your schematic diagrams
Use symbols and shapes consistently ie elements that are similar should have the same symbol or shape
Avoid having connectors crossing over each other
Avoid having symbols or shapes overlapping
Use arrows on connectors or flow lines to indicate direction
Use colours text size and font consistently
Diagrams that can be read top-to-bottom and left-to-right are easier to read
In a process diagram have only one connector leading into a symbol but have more coming out where necessary to indicate different directions or decisions
Diagrams for a technical audience such as electrical or computer programming schematics should follow accepted conventions for symbols and layout
Diagrams indicating a hierarchy of positions ideas or stages are clearer if elements belonging to the same level are a similar shape size and position on the page
Keep labels as clear and as brief as possible Carefully check the spelling of all names and labels letter by letter ndash errors in the spelling of names or scientific and technical terms look unprofessional and can be confusing for readers
Foundation Computing
Basic Schematic Diagrams 5957docx Page 51
Self Test Look at the schematic diagrams that follow Make notes under each example of what is wrong with the diagram what is right about the diagram and what could be changed to make it clear and meaningful to its intended audience 1) This flow chart is supposed to show police officers how to get a suspect to confess to a crime
START
Confidently accuse
suspect of crime
Describe a
scenario that
enables suspect
to admit guiltAllow suspect to
voice objections
Invade suspectrsquos
personal space
Suspect becomes
uncomfortable
Suspect
doesnrsquot
deny guilt
Suspect
denies guilt
No reaction
Elicit confession
Rephrase objections as
confessions
FINISH
Foundation Computing
Basic Schematic Diagrams 5957docx Page 52
2) The following diagram is an organisation chart for Widget Enterprises
John Smith
MANAGER
Seth Drew
IT MANAGER
May Furur
SECRETARY
Judith Holland
CUSTOMER SERVICES manager
Jad Ling
HELPDESK
Harry Petal
FINANCIAL MANAGER
Wanda Springer
MARKETING
MANAGER
Bob Smithells
CLEANER
Kelly Inlerl
MARKETING ASSISTANT
Beryl Thin
CUSTOMER SERVICES ASSISTANTValda Rigley
CUSTOMER
SERVICES
ASSISTANT
Levi Quayle
COMPUTER
TECHNICIAN
3) Which of the following computer applications can be used to create schematic diagrams
a) Microsoft Visio
b) Microsoft Paint
c) Microsoft Word
d) All of the above
4) Which frequently used shapes does the Microsoft Paint Tool bar contain templates for
5) Where in the Microsoft Paint window would you be able to select the thickness of line that you wanted for a brushstroke 6) Identify the purpose and intended audience for a diagram showing a businessrsquos marketing plan 7) Name two characteristics of well-designed schematic diagrams 8) Identify four steps involved in designing schematic diagrams 9) Why is it important to use conventionally accepted and familiar shapes and symbols in your schematic diagrams
Foundation Computing
Basic Schematic Diagrams 5957docx Page 53
Self Test Answers 1) This flow chart is supposed to show police officers how to get a suspect to confess to a crime
START
Confidently accuse
suspect of crime
Describe a
scenario that
enables suspect
to admit guiltAllow suspect to
voice objections
Invade suspectrsquos
personal space
Suspect becomes
uncomfortable
Suspect
doesnrsquot
deny guilt
Suspect
denies guilt
No reaction
Elicit confession
Rephrase objections as
confessions
FINISH
Random shapes are meaningless and confusing ndash use conventional flow chart symbols
Stages of process are not clear ndash arrange shapes top to bottom with options at each stage branching off to side at same level
Connectors that are either straight or curved would be more consistent
Labels are clear
Text uses consistent font and size
Foundation Computing
Basic Schematic Diagrams 5957docx Page 54
2) The following diagram is an organisation chart for Widget Enterprises
John Smith
MANAGER
Seth Drew
IT MANAGER
May Furur
SECRETARY
Judith Holland
CUSTOMER SERVICES manager
Jad Ling
HELPDESK
Harry Petal
FINANCIAL MANAGER
Wanda Springer
MARKETING
MANAGER
Bob Smithells
CLEANER
Kelly Inlerl
MARKETING ASSISTANT
Beryl Thin
CUSTOMER SERVICES ASSISTANTValda Rigley
CUSTOMER
SERVICES
ASSISTANT
Levi Quayle
COMPUTER
TECHNICIAN
No clear levels to hierarchy ndash organise so that diagram reads top to bottom and positions at similar level are in same horizontal space
Different sized boxes and borders on some boxes are meaningless ndash need consistent style for similar elements
Connectors cross over each other and boxes overlap ndash arrange space to avoid this
Text size and font is mostly consistent but one typo needs correcting
3) Which of the following computer applications can be used to create schematic diagrams
a) Microsoft Visio
b) Microsoft Paint
c) Microsoft Word
d) All of the above correct
4) Which frequently used shapes does the Microsoft Paint Tool bar contain templates for
Polygon rectangle ovalellipse
Foundation Computing
Basic Schematic Diagrams 5957docx Page 55
5) Where in the Microsoft Paint window would you be able to select the thickness of line that you wanted for a brushstroke
Options area below the Toolbar
6) Identify the purpose and intended audience for a diagram showing a businessrsquos marketing plan
The purpose would be to provide an overview of the businessrsquos marketing strategy Audience could include management and employees of the business especially the Marketing department potential investors shareholders and directors of the business
7) Name two characteristics of well-designed schematic diagrams Any of simple easy for the target audience to understand include all relevant elements or parts of the process clear and logical connections between elements accurate 8) Identify four steps involved in designing schematic diagrams Gather information organise information make connections between elements test your diagram 9) Why is it important to use conventionally accepted and familiar shapes and
symbols in your schematic diagrams So that the diagram will be easily understood by the target audience
Foundation Computing
Basic Schematic Diagrams 5957docx Page 56
References httpwindowsmicrosoftcomen-NZwindows7Getting-started-with-Paint accessed Sat 5th December in Timaru New Zealand httpenwikipediaorgwikiSchematic_diagrams accessed Sat 5th December in Timaru New Zealand httpenwikipediaorgwikiSymbol accessed Sat 5th December in Timaru New Zealand
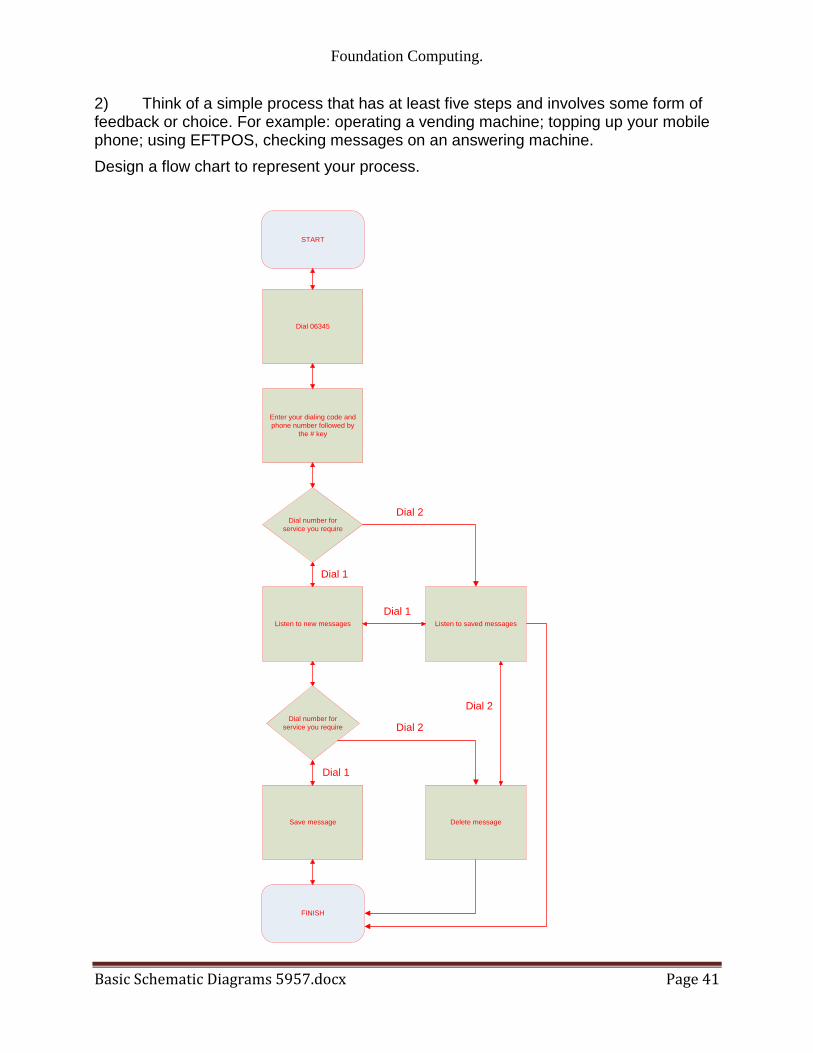
Foundation Computing
Basic Schematic Diagrams 5957docx Page 45
The answer is to use schematic symbols to represent electronic components as shown in the diagram below In this diagram we show the schematic symbol of a battery as the electrical source and the symbol of a resistor as the load Even without the words and arrows the symbols define exactly what this circuit is and how it behaves
Some good procedures to follow with symbols include
Using templates for frequently used symbols
Use symbols consistently
Use a library of symbols such as from IEC 60617-DB
Foundation Computing
Basic Schematic Diagrams 5957docx Page 46
TOPIC 2 Diagram is clear readable and consistent with specifications Creating a simple diagram using MSPaint To start with letrsquos create a simple flow chart representing the stages in designing a schematic diagram There are four stages in this process
1) Gather your information 2) Organise your information 3) Make connections 4) Test your diagram
Our flow chart will consist of four rectangles arranged vertically with downward pointing arrows as connectors A rounded rectangle at the top and at the bottom of the flowchart will indicate START and FINISH respectively Step by step
Open Microsoft Paint
Click on the Rectangle tool then click and drag in the drawing area to draw a rectangle
Repeat this step to draw four boxes in the drawing area OR click on the Select tool and click and drag to select the first rectangle then right-click to copy and paste three more rectangles the same size in the drawing area
Foundation Computing
Basic Schematic Diagrams 5957docx Page 47
Using the Rounded Rectangle tool draw a rounded rectangle at the top and bottom of your flow chart
Foundation Computing
Basic Schematic Diagrams 5957docx Page 48
Use the Line tool to draw arrows between each box In the Options area under the Tool bar you can choose the thickness of line that you want to use Remember too that if you hold down the Shift key on the keyboard while you are drawing a line you can create a 45 degree angle
Use the Text tool to add text to the shapes by clicking on the Text tool clicking and dragging to create a textbox inside your shape then typing your text Check your spelling carefully letter by letter as you go
Foundation Computing
Basic Schematic Diagrams 5957docx Page 49
The basic flowchart created in Microsoft Paint could look something like this
Foundation Computing
Basic Schematic Diagrams 5957docx Page 50
Common problems with diagrams Even well-designed schematic diagrams will be difficult for the target audience to read and understand if symbols are used inconsistently or the layout of the diagram is unfamiliar For example if a flowchart has different shapes used for each element and different types of arrows used randomly it will be more difficult for readers to see the overall direction and meaning of the diagram If the shapes on an organisation chart are different sizes and randomly positioned with no clear levels or hierarchy the diagram will not provide a clear overview of the organisationrsquos structure If an electrical circuit diagram has unfamiliar symbols used for elements such as switches resistors and batteries then it will not make sense to its intended audience
Tips for improving the readability of your schematic diagrams
Use symbols and shapes consistently ie elements that are similar should have the same symbol or shape
Avoid having connectors crossing over each other
Avoid having symbols or shapes overlapping
Use arrows on connectors or flow lines to indicate direction
Use colours text size and font consistently
Diagrams that can be read top-to-bottom and left-to-right are easier to read
In a process diagram have only one connector leading into a symbol but have more coming out where necessary to indicate different directions or decisions
Diagrams for a technical audience such as electrical or computer programming schematics should follow accepted conventions for symbols and layout
Diagrams indicating a hierarchy of positions ideas or stages are clearer if elements belonging to the same level are a similar shape size and position on the page
Keep labels as clear and as brief as possible Carefully check the spelling of all names and labels letter by letter ndash errors in the spelling of names or scientific and technical terms look unprofessional and can be confusing for readers
Foundation Computing
Basic Schematic Diagrams 5957docx Page 51
Self Test Look at the schematic diagrams that follow Make notes under each example of what is wrong with the diagram what is right about the diagram and what could be changed to make it clear and meaningful to its intended audience 1) This flow chart is supposed to show police officers how to get a suspect to confess to a crime
START
Confidently accuse
suspect of crime
Describe a
scenario that
enables suspect
to admit guiltAllow suspect to
voice objections
Invade suspectrsquos
personal space
Suspect becomes
uncomfortable
Suspect
doesnrsquot
deny guilt
Suspect
denies guilt
No reaction
Elicit confession
Rephrase objections as
confessions
FINISH
Foundation Computing
Basic Schematic Diagrams 5957docx Page 52
2) The following diagram is an organisation chart for Widget Enterprises
John Smith
MANAGER
Seth Drew
IT MANAGER
May Furur
SECRETARY
Judith Holland
CUSTOMER SERVICES manager
Jad Ling
HELPDESK
Harry Petal
FINANCIAL MANAGER
Wanda Springer
MARKETING
MANAGER
Bob Smithells
CLEANER
Kelly Inlerl
MARKETING ASSISTANT
Beryl Thin
CUSTOMER SERVICES ASSISTANTValda Rigley
CUSTOMER
SERVICES
ASSISTANT
Levi Quayle
COMPUTER
TECHNICIAN
3) Which of the following computer applications can be used to create schematic diagrams
a) Microsoft Visio
b) Microsoft Paint
c) Microsoft Word
d) All of the above
4) Which frequently used shapes does the Microsoft Paint Tool bar contain templates for
5) Where in the Microsoft Paint window would you be able to select the thickness of line that you wanted for a brushstroke 6) Identify the purpose and intended audience for a diagram showing a businessrsquos marketing plan 7) Name two characteristics of well-designed schematic diagrams 8) Identify four steps involved in designing schematic diagrams 9) Why is it important to use conventionally accepted and familiar shapes and symbols in your schematic diagrams
Foundation Computing
Basic Schematic Diagrams 5957docx Page 53
Self Test Answers 1) This flow chart is supposed to show police officers how to get a suspect to confess to a crime
START
Confidently accuse
suspect of crime
Describe a
scenario that
enables suspect
to admit guiltAllow suspect to
voice objections
Invade suspectrsquos
personal space
Suspect becomes
uncomfortable
Suspect
doesnrsquot
deny guilt
Suspect
denies guilt
No reaction
Elicit confession
Rephrase objections as
confessions
FINISH
Random shapes are meaningless and confusing ndash use conventional flow chart symbols
Stages of process are not clear ndash arrange shapes top to bottom with options at each stage branching off to side at same level
Connectors that are either straight or curved would be more consistent
Labels are clear
Text uses consistent font and size
Foundation Computing
Basic Schematic Diagrams 5957docx Page 54
2) The following diagram is an organisation chart for Widget Enterprises
John Smith
MANAGER
Seth Drew
IT MANAGER
May Furur
SECRETARY
Judith Holland
CUSTOMER SERVICES manager
Jad Ling
HELPDESK
Harry Petal
FINANCIAL MANAGER
Wanda Springer
MARKETING
MANAGER
Bob Smithells
CLEANER
Kelly Inlerl
MARKETING ASSISTANT
Beryl Thin
CUSTOMER SERVICES ASSISTANTValda Rigley
CUSTOMER
SERVICES
ASSISTANT
Levi Quayle
COMPUTER
TECHNICIAN
No clear levels to hierarchy ndash organise so that diagram reads top to bottom and positions at similar level are in same horizontal space
Different sized boxes and borders on some boxes are meaningless ndash need consistent style for similar elements
Connectors cross over each other and boxes overlap ndash arrange space to avoid this
Text size and font is mostly consistent but one typo needs correcting
3) Which of the following computer applications can be used to create schematic diagrams
a) Microsoft Visio
b) Microsoft Paint
c) Microsoft Word
d) All of the above correct
4) Which frequently used shapes does the Microsoft Paint Tool bar contain templates for
Polygon rectangle ovalellipse
Foundation Computing
Basic Schematic Diagrams 5957docx Page 55
5) Where in the Microsoft Paint window would you be able to select the thickness of line that you wanted for a brushstroke
Options area below the Toolbar
6) Identify the purpose and intended audience for a diagram showing a businessrsquos marketing plan
The purpose would be to provide an overview of the businessrsquos marketing strategy Audience could include management and employees of the business especially the Marketing department potential investors shareholders and directors of the business
7) Name two characteristics of well-designed schematic diagrams Any of simple easy for the target audience to understand include all relevant elements or parts of the process clear and logical connections between elements accurate 8) Identify four steps involved in designing schematic diagrams Gather information organise information make connections between elements test your diagram 9) Why is it important to use conventionally accepted and familiar shapes and
symbols in your schematic diagrams So that the diagram will be easily understood by the target audience
Foundation Computing
Basic Schematic Diagrams 5957docx Page 56
References httpwindowsmicrosoftcomen-NZwindows7Getting-started-with-Paint accessed Sat 5th December in Timaru New Zealand httpenwikipediaorgwikiSchematic_diagrams accessed Sat 5th December in Timaru New Zealand httpenwikipediaorgwikiSymbol accessed Sat 5th December in Timaru New Zealand
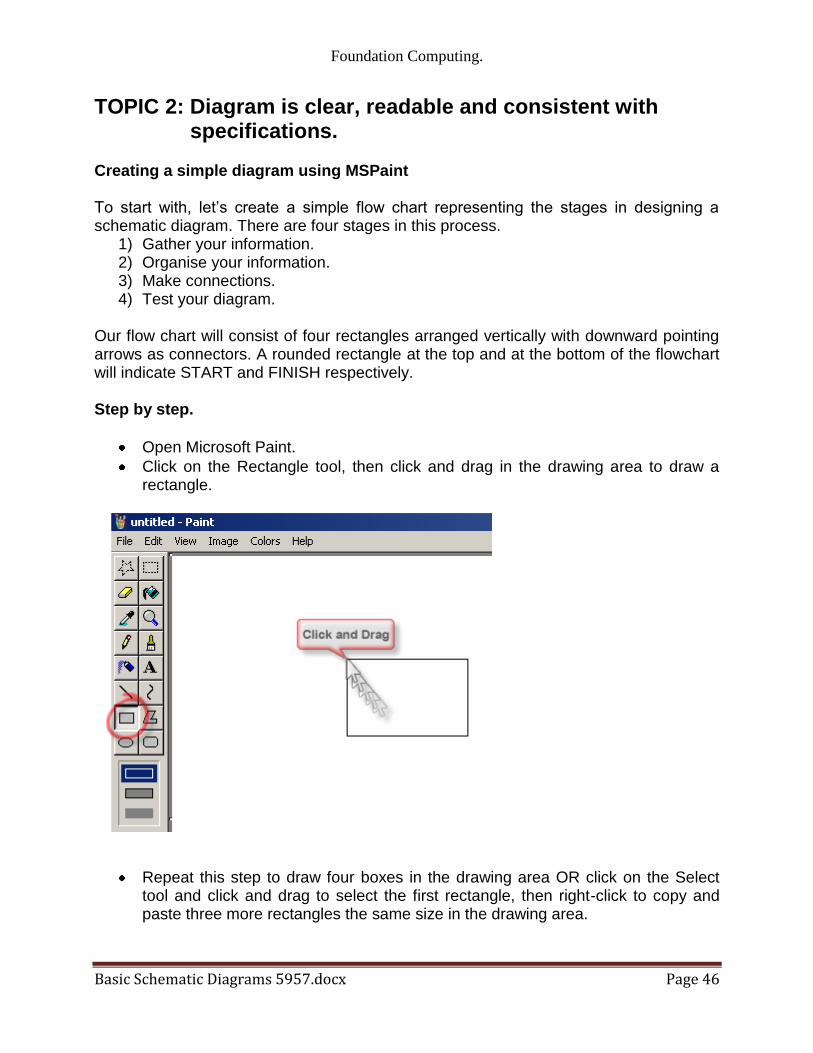
Foundation Computing
Basic Schematic Diagrams 5957docx Page 46
TOPIC 2 Diagram is clear readable and consistent with specifications Creating a simple diagram using MSPaint To start with letrsquos create a simple flow chart representing the stages in designing a schematic diagram There are four stages in this process
1) Gather your information 2) Organise your information 3) Make connections 4) Test your diagram
Our flow chart will consist of four rectangles arranged vertically with downward pointing arrows as connectors A rounded rectangle at the top and at the bottom of the flowchart will indicate START and FINISH respectively Step by step
Open Microsoft Paint
Click on the Rectangle tool then click and drag in the drawing area to draw a rectangle
Repeat this step to draw four boxes in the drawing area OR click on the Select tool and click and drag to select the first rectangle then right-click to copy and paste three more rectangles the same size in the drawing area
Foundation Computing
Basic Schematic Diagrams 5957docx Page 47
Using the Rounded Rectangle tool draw a rounded rectangle at the top and bottom of your flow chart
Foundation Computing
Basic Schematic Diagrams 5957docx Page 48
Use the Line tool to draw arrows between each box In the Options area under the Tool bar you can choose the thickness of line that you want to use Remember too that if you hold down the Shift key on the keyboard while you are drawing a line you can create a 45 degree angle
Use the Text tool to add text to the shapes by clicking on the Text tool clicking and dragging to create a textbox inside your shape then typing your text Check your spelling carefully letter by letter as you go
Foundation Computing
Basic Schematic Diagrams 5957docx Page 49
The basic flowchart created in Microsoft Paint could look something like this
Foundation Computing
Basic Schematic Diagrams 5957docx Page 50
Common problems with diagrams Even well-designed schematic diagrams will be difficult for the target audience to read and understand if symbols are used inconsistently or the layout of the diagram is unfamiliar For example if a flowchart has different shapes used for each element and different types of arrows used randomly it will be more difficult for readers to see the overall direction and meaning of the diagram If the shapes on an organisation chart are different sizes and randomly positioned with no clear levels or hierarchy the diagram will not provide a clear overview of the organisationrsquos structure If an electrical circuit diagram has unfamiliar symbols used for elements such as switches resistors and batteries then it will not make sense to its intended audience
Tips for improving the readability of your schematic diagrams
Use symbols and shapes consistently ie elements that are similar should have the same symbol or shape
Avoid having connectors crossing over each other
Avoid having symbols or shapes overlapping
Use arrows on connectors or flow lines to indicate direction
Use colours text size and font consistently
Diagrams that can be read top-to-bottom and left-to-right are easier to read
In a process diagram have only one connector leading into a symbol but have more coming out where necessary to indicate different directions or decisions
Diagrams for a technical audience such as electrical or computer programming schematics should follow accepted conventions for symbols and layout
Diagrams indicating a hierarchy of positions ideas or stages are clearer if elements belonging to the same level are a similar shape size and position on the page
Keep labels as clear and as brief as possible Carefully check the spelling of all names and labels letter by letter ndash errors in the spelling of names or scientific and technical terms look unprofessional and can be confusing for readers
Foundation Computing
Basic Schematic Diagrams 5957docx Page 51
Self Test Look at the schematic diagrams that follow Make notes under each example of what is wrong with the diagram what is right about the diagram and what could be changed to make it clear and meaningful to its intended audience 1) This flow chart is supposed to show police officers how to get a suspect to confess to a crime
START
Confidently accuse
suspect of crime
Describe a
scenario that
enables suspect
to admit guiltAllow suspect to
voice objections
Invade suspectrsquos
personal space
Suspect becomes
uncomfortable
Suspect
doesnrsquot
deny guilt
Suspect
denies guilt
No reaction
Elicit confession
Rephrase objections as
confessions
FINISH
Foundation Computing
Basic Schematic Diagrams 5957docx Page 52
2) The following diagram is an organisation chart for Widget Enterprises
John Smith
MANAGER
Seth Drew
IT MANAGER
May Furur
SECRETARY
Judith Holland
CUSTOMER SERVICES manager
Jad Ling
HELPDESK
Harry Petal
FINANCIAL MANAGER
Wanda Springer
MARKETING
MANAGER
Bob Smithells
CLEANER
Kelly Inlerl
MARKETING ASSISTANT
Beryl Thin
CUSTOMER SERVICES ASSISTANTValda Rigley
CUSTOMER
SERVICES
ASSISTANT
Levi Quayle
COMPUTER
TECHNICIAN
3) Which of the following computer applications can be used to create schematic diagrams
a) Microsoft Visio
b) Microsoft Paint
c) Microsoft Word
d) All of the above
4) Which frequently used shapes does the Microsoft Paint Tool bar contain templates for
5) Where in the Microsoft Paint window would you be able to select the thickness of line that you wanted for a brushstroke 6) Identify the purpose and intended audience for a diagram showing a businessrsquos marketing plan 7) Name two characteristics of well-designed schematic diagrams 8) Identify four steps involved in designing schematic diagrams 9) Why is it important to use conventionally accepted and familiar shapes and symbols in your schematic diagrams
Foundation Computing
Basic Schematic Diagrams 5957docx Page 53
Self Test Answers 1) This flow chart is supposed to show police officers how to get a suspect to confess to a crime
START
Confidently accuse
suspect of crime
Describe a
scenario that
enables suspect
to admit guiltAllow suspect to
voice objections
Invade suspectrsquos
personal space
Suspect becomes
uncomfortable
Suspect
doesnrsquot
deny guilt
Suspect
denies guilt
No reaction
Elicit confession
Rephrase objections as
confessions
FINISH
Random shapes are meaningless and confusing ndash use conventional flow chart symbols
Stages of process are not clear ndash arrange shapes top to bottom with options at each stage branching off to side at same level
Connectors that are either straight or curved would be more consistent
Labels are clear
Text uses consistent font and size
Foundation Computing
Basic Schematic Diagrams 5957docx Page 54
2) The following diagram is an organisation chart for Widget Enterprises
John Smith
MANAGER
Seth Drew
IT MANAGER
May Furur
SECRETARY
Judith Holland
CUSTOMER SERVICES manager
Jad Ling
HELPDESK
Harry Petal
FINANCIAL MANAGER
Wanda Springer
MARKETING
MANAGER
Bob Smithells
CLEANER
Kelly Inlerl
MARKETING ASSISTANT
Beryl Thin
CUSTOMER SERVICES ASSISTANTValda Rigley
CUSTOMER
SERVICES
ASSISTANT
Levi Quayle
COMPUTER
TECHNICIAN
No clear levels to hierarchy ndash organise so that diagram reads top to bottom and positions at similar level are in same horizontal space
Different sized boxes and borders on some boxes are meaningless ndash need consistent style for similar elements
Connectors cross over each other and boxes overlap ndash arrange space to avoid this
Text size and font is mostly consistent but one typo needs correcting
3) Which of the following computer applications can be used to create schematic diagrams
a) Microsoft Visio
b) Microsoft Paint
c) Microsoft Word
d) All of the above correct
4) Which frequently used shapes does the Microsoft Paint Tool bar contain templates for
Polygon rectangle ovalellipse
Foundation Computing
Basic Schematic Diagrams 5957docx Page 55
5) Where in the Microsoft Paint window would you be able to select the thickness of line that you wanted for a brushstroke
Options area below the Toolbar
6) Identify the purpose and intended audience for a diagram showing a businessrsquos marketing plan
The purpose would be to provide an overview of the businessrsquos marketing strategy Audience could include management and employees of the business especially the Marketing department potential investors shareholders and directors of the business
7) Name two characteristics of well-designed schematic diagrams Any of simple easy for the target audience to understand include all relevant elements or parts of the process clear and logical connections between elements accurate 8) Identify four steps involved in designing schematic diagrams Gather information organise information make connections between elements test your diagram 9) Why is it important to use conventionally accepted and familiar shapes and
symbols in your schematic diagrams So that the diagram will be easily understood by the target audience
Foundation Computing
Basic Schematic Diagrams 5957docx Page 56
References httpwindowsmicrosoftcomen-NZwindows7Getting-started-with-Paint accessed Sat 5th December in Timaru New Zealand httpenwikipediaorgwikiSchematic_diagrams accessed Sat 5th December in Timaru New Zealand httpenwikipediaorgwikiSymbol accessed Sat 5th December in Timaru New Zealand
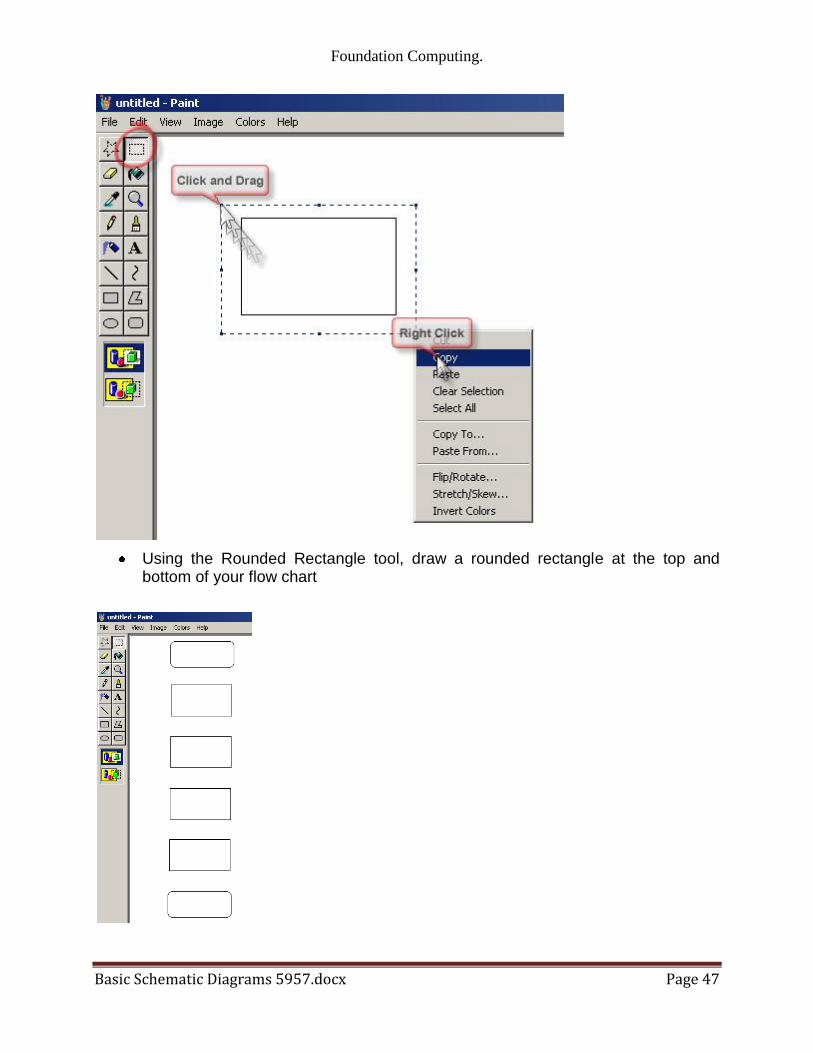
Foundation Computing
Basic Schematic Diagrams 5957docx Page 47
Using the Rounded Rectangle tool draw a rounded rectangle at the top and bottom of your flow chart
Foundation Computing
Basic Schematic Diagrams 5957docx Page 48
Use the Line tool to draw arrows between each box In the Options area under the Tool bar you can choose the thickness of line that you want to use Remember too that if you hold down the Shift key on the keyboard while you are drawing a line you can create a 45 degree angle
Use the Text tool to add text to the shapes by clicking on the Text tool clicking and dragging to create a textbox inside your shape then typing your text Check your spelling carefully letter by letter as you go
Foundation Computing
Basic Schematic Diagrams 5957docx Page 49
The basic flowchart created in Microsoft Paint could look something like this
Foundation Computing
Basic Schematic Diagrams 5957docx Page 50
Common problems with diagrams Even well-designed schematic diagrams will be difficult for the target audience to read and understand if symbols are used inconsistently or the layout of the diagram is unfamiliar For example if a flowchart has different shapes used for each element and different types of arrows used randomly it will be more difficult for readers to see the overall direction and meaning of the diagram If the shapes on an organisation chart are different sizes and randomly positioned with no clear levels or hierarchy the diagram will not provide a clear overview of the organisationrsquos structure If an electrical circuit diagram has unfamiliar symbols used for elements such as switches resistors and batteries then it will not make sense to its intended audience
Tips for improving the readability of your schematic diagrams
Use symbols and shapes consistently ie elements that are similar should have the same symbol or shape
Avoid having connectors crossing over each other
Avoid having symbols or shapes overlapping
Use arrows on connectors or flow lines to indicate direction
Use colours text size and font consistently
Diagrams that can be read top-to-bottom and left-to-right are easier to read
In a process diagram have only one connector leading into a symbol but have more coming out where necessary to indicate different directions or decisions
Diagrams for a technical audience such as electrical or computer programming schematics should follow accepted conventions for symbols and layout
Diagrams indicating a hierarchy of positions ideas or stages are clearer if elements belonging to the same level are a similar shape size and position on the page
Keep labels as clear and as brief as possible Carefully check the spelling of all names and labels letter by letter ndash errors in the spelling of names or scientific and technical terms look unprofessional and can be confusing for readers
Foundation Computing
Basic Schematic Diagrams 5957docx Page 51
Self Test Look at the schematic diagrams that follow Make notes under each example of what is wrong with the diagram what is right about the diagram and what could be changed to make it clear and meaningful to its intended audience 1) This flow chart is supposed to show police officers how to get a suspect to confess to a crime
START
Confidently accuse
suspect of crime
Describe a
scenario that
enables suspect
to admit guiltAllow suspect to
voice objections
Invade suspectrsquos
personal space
Suspect becomes
uncomfortable
Suspect
doesnrsquot
deny guilt
Suspect
denies guilt
No reaction
Elicit confession
Rephrase objections as
confessions
FINISH
Foundation Computing
Basic Schematic Diagrams 5957docx Page 52
2) The following diagram is an organisation chart for Widget Enterprises
John Smith
MANAGER
Seth Drew
IT MANAGER
May Furur
SECRETARY
Judith Holland
CUSTOMER SERVICES manager
Jad Ling
HELPDESK
Harry Petal
FINANCIAL MANAGER
Wanda Springer
MARKETING
MANAGER
Bob Smithells
CLEANER
Kelly Inlerl
MARKETING ASSISTANT
Beryl Thin
CUSTOMER SERVICES ASSISTANTValda Rigley
CUSTOMER
SERVICES
ASSISTANT
Levi Quayle
COMPUTER
TECHNICIAN
3) Which of the following computer applications can be used to create schematic diagrams
a) Microsoft Visio
b) Microsoft Paint
c) Microsoft Word
d) All of the above
4) Which frequently used shapes does the Microsoft Paint Tool bar contain templates for
5) Where in the Microsoft Paint window would you be able to select the thickness of line that you wanted for a brushstroke 6) Identify the purpose and intended audience for a diagram showing a businessrsquos marketing plan 7) Name two characteristics of well-designed schematic diagrams 8) Identify four steps involved in designing schematic diagrams 9) Why is it important to use conventionally accepted and familiar shapes and symbols in your schematic diagrams
Foundation Computing
Basic Schematic Diagrams 5957docx Page 53
Self Test Answers 1) This flow chart is supposed to show police officers how to get a suspect to confess to a crime
START
Confidently accuse
suspect of crime
Describe a
scenario that
enables suspect
to admit guiltAllow suspect to
voice objections
Invade suspectrsquos
personal space
Suspect becomes
uncomfortable
Suspect
doesnrsquot
deny guilt
Suspect
denies guilt
No reaction
Elicit confession
Rephrase objections as
confessions
FINISH
Random shapes are meaningless and confusing ndash use conventional flow chart symbols
Stages of process are not clear ndash arrange shapes top to bottom with options at each stage branching off to side at same level
Connectors that are either straight or curved would be more consistent
Labels are clear
Text uses consistent font and size
Foundation Computing
Basic Schematic Diagrams 5957docx Page 54
2) The following diagram is an organisation chart for Widget Enterprises
John Smith
MANAGER
Seth Drew
IT MANAGER
May Furur
SECRETARY
Judith Holland
CUSTOMER SERVICES manager
Jad Ling
HELPDESK
Harry Petal
FINANCIAL MANAGER
Wanda Springer
MARKETING
MANAGER
Bob Smithells
CLEANER
Kelly Inlerl
MARKETING ASSISTANT
Beryl Thin
CUSTOMER SERVICES ASSISTANTValda Rigley
CUSTOMER
SERVICES
ASSISTANT
Levi Quayle
COMPUTER
TECHNICIAN
No clear levels to hierarchy ndash organise so that diagram reads top to bottom and positions at similar level are in same horizontal space
Different sized boxes and borders on some boxes are meaningless ndash need consistent style for similar elements
Connectors cross over each other and boxes overlap ndash arrange space to avoid this
Text size and font is mostly consistent but one typo needs correcting
3) Which of the following computer applications can be used to create schematic diagrams
a) Microsoft Visio
b) Microsoft Paint
c) Microsoft Word
d) All of the above correct
4) Which frequently used shapes does the Microsoft Paint Tool bar contain templates for
Polygon rectangle ovalellipse
Foundation Computing
Basic Schematic Diagrams 5957docx Page 55
5) Where in the Microsoft Paint window would you be able to select the thickness of line that you wanted for a brushstroke
Options area below the Toolbar
6) Identify the purpose and intended audience for a diagram showing a businessrsquos marketing plan
The purpose would be to provide an overview of the businessrsquos marketing strategy Audience could include management and employees of the business especially the Marketing department potential investors shareholders and directors of the business
7) Name two characteristics of well-designed schematic diagrams Any of simple easy for the target audience to understand include all relevant elements or parts of the process clear and logical connections between elements accurate 8) Identify four steps involved in designing schematic diagrams Gather information organise information make connections between elements test your diagram 9) Why is it important to use conventionally accepted and familiar shapes and
symbols in your schematic diagrams So that the diagram will be easily understood by the target audience
Foundation Computing
Basic Schematic Diagrams 5957docx Page 56
References httpwindowsmicrosoftcomen-NZwindows7Getting-started-with-Paint accessed Sat 5th December in Timaru New Zealand httpenwikipediaorgwikiSchematic_diagrams accessed Sat 5th December in Timaru New Zealand httpenwikipediaorgwikiSymbol accessed Sat 5th December in Timaru New Zealand
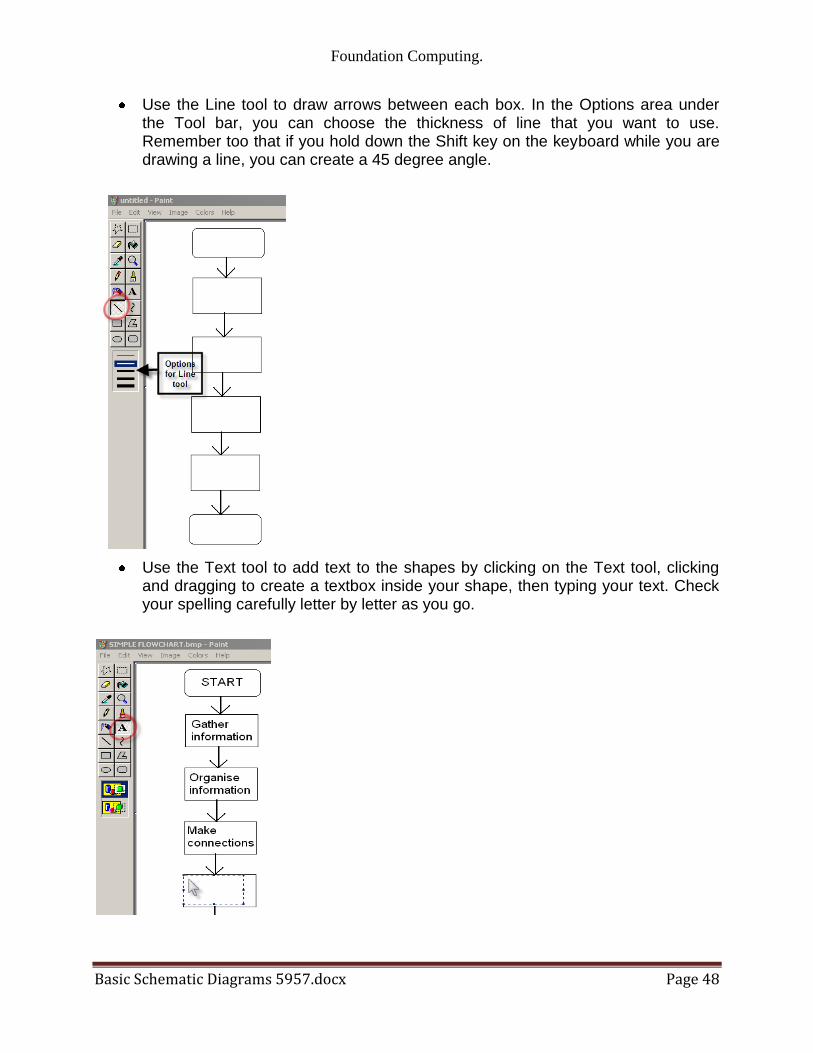
Foundation Computing
Basic Schematic Diagrams 5957docx Page 48
Use the Line tool to draw arrows between each box In the Options area under the Tool bar you can choose the thickness of line that you want to use Remember too that if you hold down the Shift key on the keyboard while you are drawing a line you can create a 45 degree angle
Use the Text tool to add text to the shapes by clicking on the Text tool clicking and dragging to create a textbox inside your shape then typing your text Check your spelling carefully letter by letter as you go
Foundation Computing
Basic Schematic Diagrams 5957docx Page 49
The basic flowchart created in Microsoft Paint could look something like this
Foundation Computing
Basic Schematic Diagrams 5957docx Page 50
Common problems with diagrams Even well-designed schematic diagrams will be difficult for the target audience to read and understand if symbols are used inconsistently or the layout of the diagram is unfamiliar For example if a flowchart has different shapes used for each element and different types of arrows used randomly it will be more difficult for readers to see the overall direction and meaning of the diagram If the shapes on an organisation chart are different sizes and randomly positioned with no clear levels or hierarchy the diagram will not provide a clear overview of the organisationrsquos structure If an electrical circuit diagram has unfamiliar symbols used for elements such as switches resistors and batteries then it will not make sense to its intended audience
Tips for improving the readability of your schematic diagrams
Use symbols and shapes consistently ie elements that are similar should have the same symbol or shape
Avoid having connectors crossing over each other
Avoid having symbols or shapes overlapping
Use arrows on connectors or flow lines to indicate direction
Use colours text size and font consistently
Diagrams that can be read top-to-bottom and left-to-right are easier to read
In a process diagram have only one connector leading into a symbol but have more coming out where necessary to indicate different directions or decisions
Diagrams for a technical audience such as electrical or computer programming schematics should follow accepted conventions for symbols and layout
Diagrams indicating a hierarchy of positions ideas or stages are clearer if elements belonging to the same level are a similar shape size and position on the page
Keep labels as clear and as brief as possible Carefully check the spelling of all names and labels letter by letter ndash errors in the spelling of names or scientific and technical terms look unprofessional and can be confusing for readers
Foundation Computing
Basic Schematic Diagrams 5957docx Page 51
Self Test Look at the schematic diagrams that follow Make notes under each example of what is wrong with the diagram what is right about the diagram and what could be changed to make it clear and meaningful to its intended audience 1) This flow chart is supposed to show police officers how to get a suspect to confess to a crime
START
Confidently accuse
suspect of crime
Describe a
scenario that
enables suspect
to admit guiltAllow suspect to
voice objections
Invade suspectrsquos
personal space
Suspect becomes
uncomfortable
Suspect
doesnrsquot
deny guilt
Suspect
denies guilt
No reaction
Elicit confession
Rephrase objections as
confessions
FINISH
Foundation Computing
Basic Schematic Diagrams 5957docx Page 52
2) The following diagram is an organisation chart for Widget Enterprises
John Smith
MANAGER
Seth Drew
IT MANAGER
May Furur
SECRETARY
Judith Holland
CUSTOMER SERVICES manager
Jad Ling
HELPDESK
Harry Petal
FINANCIAL MANAGER
Wanda Springer
MARKETING
MANAGER
Bob Smithells
CLEANER
Kelly Inlerl
MARKETING ASSISTANT
Beryl Thin
CUSTOMER SERVICES ASSISTANTValda Rigley
CUSTOMER
SERVICES
ASSISTANT
Levi Quayle
COMPUTER
TECHNICIAN
3) Which of the following computer applications can be used to create schematic diagrams
a) Microsoft Visio
b) Microsoft Paint
c) Microsoft Word
d) All of the above
4) Which frequently used shapes does the Microsoft Paint Tool bar contain templates for
5) Where in the Microsoft Paint window would you be able to select the thickness of line that you wanted for a brushstroke 6) Identify the purpose and intended audience for a diagram showing a businessrsquos marketing plan 7) Name two characteristics of well-designed schematic diagrams 8) Identify four steps involved in designing schematic diagrams 9) Why is it important to use conventionally accepted and familiar shapes and symbols in your schematic diagrams
Foundation Computing
Basic Schematic Diagrams 5957docx Page 53
Self Test Answers 1) This flow chart is supposed to show police officers how to get a suspect to confess to a crime
START
Confidently accuse
suspect of crime
Describe a
scenario that
enables suspect
to admit guiltAllow suspect to
voice objections
Invade suspectrsquos
personal space
Suspect becomes
uncomfortable
Suspect
doesnrsquot
deny guilt
Suspect
denies guilt
No reaction
Elicit confession
Rephrase objections as
confessions
FINISH
Random shapes are meaningless and confusing ndash use conventional flow chart symbols
Stages of process are not clear ndash arrange shapes top to bottom with options at each stage branching off to side at same level
Connectors that are either straight or curved would be more consistent
Labels are clear
Text uses consistent font and size
Foundation Computing
Basic Schematic Diagrams 5957docx Page 54
2) The following diagram is an organisation chart for Widget Enterprises
John Smith
MANAGER
Seth Drew
IT MANAGER
May Furur
SECRETARY
Judith Holland
CUSTOMER SERVICES manager
Jad Ling
HELPDESK
Harry Petal
FINANCIAL MANAGER
Wanda Springer
MARKETING
MANAGER
Bob Smithells
CLEANER
Kelly Inlerl
MARKETING ASSISTANT
Beryl Thin
CUSTOMER SERVICES ASSISTANTValda Rigley
CUSTOMER
SERVICES
ASSISTANT
Levi Quayle
COMPUTER
TECHNICIAN
No clear levels to hierarchy ndash organise so that diagram reads top to bottom and positions at similar level are in same horizontal space
Different sized boxes and borders on some boxes are meaningless ndash need consistent style for similar elements
Connectors cross over each other and boxes overlap ndash arrange space to avoid this
Text size and font is mostly consistent but one typo needs correcting
3) Which of the following computer applications can be used to create schematic diagrams
a) Microsoft Visio
b) Microsoft Paint
c) Microsoft Word
d) All of the above correct
4) Which frequently used shapes does the Microsoft Paint Tool bar contain templates for
Polygon rectangle ovalellipse
Foundation Computing
Basic Schematic Diagrams 5957docx Page 55
5) Where in the Microsoft Paint window would you be able to select the thickness of line that you wanted for a brushstroke
Options area below the Toolbar
6) Identify the purpose and intended audience for a diagram showing a businessrsquos marketing plan
The purpose would be to provide an overview of the businessrsquos marketing strategy Audience could include management and employees of the business especially the Marketing department potential investors shareholders and directors of the business
7) Name two characteristics of well-designed schematic diagrams Any of simple easy for the target audience to understand include all relevant elements or parts of the process clear and logical connections between elements accurate 8) Identify four steps involved in designing schematic diagrams Gather information organise information make connections between elements test your diagram 9) Why is it important to use conventionally accepted and familiar shapes and
symbols in your schematic diagrams So that the diagram will be easily understood by the target audience
Foundation Computing
Basic Schematic Diagrams 5957docx Page 56
References httpwindowsmicrosoftcomen-NZwindows7Getting-started-with-Paint accessed Sat 5th December in Timaru New Zealand httpenwikipediaorgwikiSchematic_diagrams accessed Sat 5th December in Timaru New Zealand httpenwikipediaorgwikiSymbol accessed Sat 5th December in Timaru New Zealand
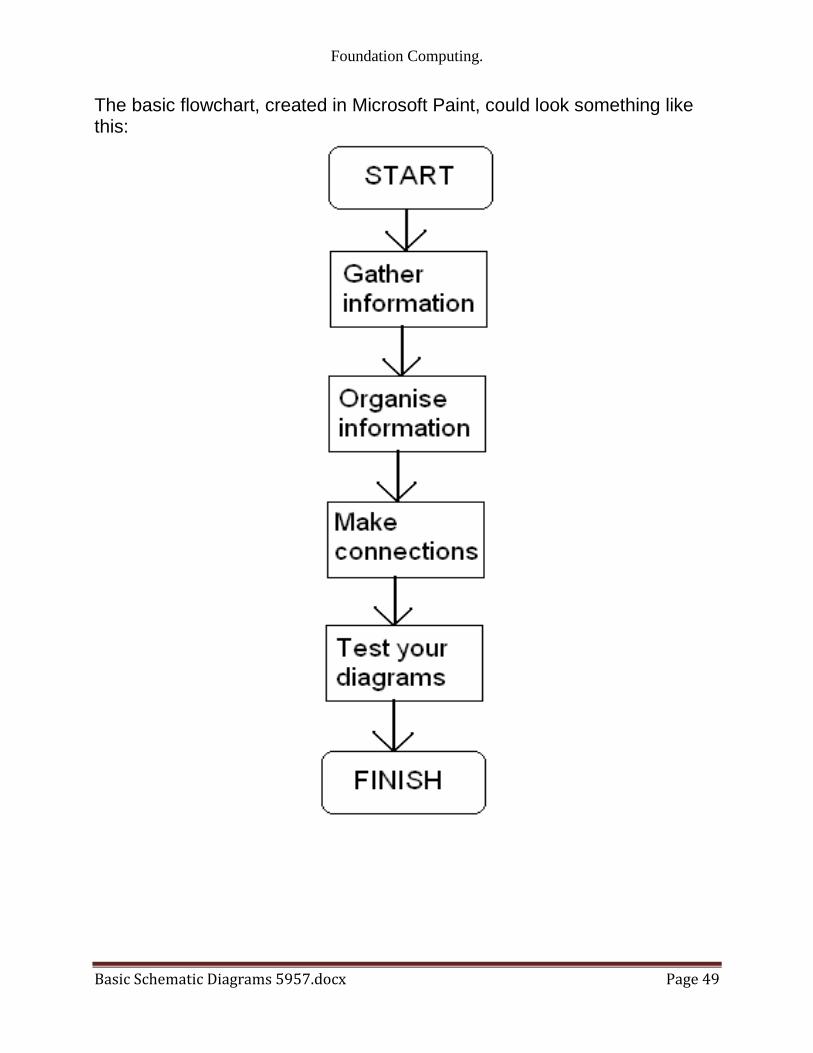
Foundation Computing
Basic Schematic Diagrams 5957docx Page 50
Common problems with diagrams Even well-designed schematic diagrams will be difficult for the target audience to read and understand if symbols are used inconsistently or the layout of the diagram is unfamiliar For example if a flowchart has different shapes used for each element and different types of arrows used randomly it will be more difficult for readers to see the overall direction and meaning of the diagram If the shapes on an organisation chart are different sizes and randomly positioned with no clear levels or hierarchy the diagram will not provide a clear overview of the organisationrsquos structure If an electrical circuit diagram has unfamiliar symbols used for elements such as switches resistors and batteries then it will not make sense to its intended audience
Tips for improving the readability of your schematic diagrams
Use symbols and shapes consistently ie elements that are similar should have the same symbol or shape
Avoid having connectors crossing over each other
Avoid having symbols or shapes overlapping
Use arrows on connectors or flow lines to indicate direction
Use colours text size and font consistently
Diagrams that can be read top-to-bottom and left-to-right are easier to read
In a process diagram have only one connector leading into a symbol but have more coming out where necessary to indicate different directions or decisions
Diagrams for a technical audience such as electrical or computer programming schematics should follow accepted conventions for symbols and layout
Diagrams indicating a hierarchy of positions ideas or stages are clearer if elements belonging to the same level are a similar shape size and position on the page
Keep labels as clear and as brief as possible Carefully check the spelling of all names and labels letter by letter ndash errors in the spelling of names or scientific and technical terms look unprofessional and can be confusing for readers
Foundation Computing
Basic Schematic Diagrams 5957docx Page 51
Self Test Look at the schematic diagrams that follow Make notes under each example of what is wrong with the diagram what is right about the diagram and what could be changed to make it clear and meaningful to its intended audience 1) This flow chart is supposed to show police officers how to get a suspect to confess to a crime
START
Confidently accuse
suspect of crime
Describe a
scenario that
enables suspect
to admit guiltAllow suspect to
voice objections
Invade suspectrsquos
personal space
Suspect becomes
uncomfortable
Suspect
doesnrsquot
deny guilt
Suspect
denies guilt
No reaction
Elicit confession
Rephrase objections as
confessions
FINISH
Foundation Computing
Basic Schematic Diagrams 5957docx Page 52
2) The following diagram is an organisation chart for Widget Enterprises
John Smith
MANAGER
Seth Drew
IT MANAGER
May Furur
SECRETARY
Judith Holland
CUSTOMER SERVICES manager
Jad Ling
HELPDESK
Harry Petal
FINANCIAL MANAGER
Wanda Springer
MARKETING
MANAGER
Bob Smithells
CLEANER
Kelly Inlerl
MARKETING ASSISTANT
Beryl Thin
CUSTOMER SERVICES ASSISTANTValda Rigley
CUSTOMER
SERVICES
ASSISTANT
Levi Quayle
COMPUTER
TECHNICIAN
3) Which of the following computer applications can be used to create schematic diagrams
a) Microsoft Visio
b) Microsoft Paint
c) Microsoft Word
d) All of the above
4) Which frequently used shapes does the Microsoft Paint Tool bar contain templates for
5) Where in the Microsoft Paint window would you be able to select the thickness of line that you wanted for a brushstroke 6) Identify the purpose and intended audience for a diagram showing a businessrsquos marketing plan 7) Name two characteristics of well-designed schematic diagrams 8) Identify four steps involved in designing schematic diagrams 9) Why is it important to use conventionally accepted and familiar shapes and symbols in your schematic diagrams
Foundation Computing
Basic Schematic Diagrams 5957docx Page 53
Self Test Answers 1) This flow chart is supposed to show police officers how to get a suspect to confess to a crime
START
Confidently accuse
suspect of crime
Describe a
scenario that
enables suspect
to admit guiltAllow suspect to
voice objections
Invade suspectrsquos
personal space
Suspect becomes
uncomfortable
Suspect
doesnrsquot
deny guilt
Suspect
denies guilt
No reaction
Elicit confession
Rephrase objections as
confessions
FINISH
Random shapes are meaningless and confusing ndash use conventional flow chart symbols
Stages of process are not clear ndash arrange shapes top to bottom with options at each stage branching off to side at same level
Connectors that are either straight or curved would be more consistent
Labels are clear
Text uses consistent font and size
Foundation Computing
Basic Schematic Diagrams 5957docx Page 54
2) The following diagram is an organisation chart for Widget Enterprises
John Smith
MANAGER
Seth Drew
IT MANAGER
May Furur
SECRETARY
Judith Holland
CUSTOMER SERVICES manager
Jad Ling
HELPDESK
Harry Petal
FINANCIAL MANAGER
Wanda Springer
MARKETING
MANAGER
Bob Smithells
CLEANER
Kelly Inlerl
MARKETING ASSISTANT
Beryl Thin
CUSTOMER SERVICES ASSISTANTValda Rigley
CUSTOMER
SERVICES
ASSISTANT
Levi Quayle
COMPUTER
TECHNICIAN
No clear levels to hierarchy ndash organise so that diagram reads top to bottom and positions at similar level are in same horizontal space
Different sized boxes and borders on some boxes are meaningless ndash need consistent style for similar elements
Connectors cross over each other and boxes overlap ndash arrange space to avoid this
Text size and font is mostly consistent but one typo needs correcting
3) Which of the following computer applications can be used to create schematic diagrams
a) Microsoft Visio
b) Microsoft Paint
c) Microsoft Word
d) All of the above correct
4) Which frequently used shapes does the Microsoft Paint Tool bar contain templates for
Polygon rectangle ovalellipse
Foundation Computing
Basic Schematic Diagrams 5957docx Page 55
5) Where in the Microsoft Paint window would you be able to select the thickness of line that you wanted for a brushstroke
Options area below the Toolbar
6) Identify the purpose and intended audience for a diagram showing a businessrsquos marketing plan
The purpose would be to provide an overview of the businessrsquos marketing strategy Audience could include management and employees of the business especially the Marketing department potential investors shareholders and directors of the business
7) Name two characteristics of well-designed schematic diagrams Any of simple easy for the target audience to understand include all relevant elements or parts of the process clear and logical connections between elements accurate 8) Identify four steps involved in designing schematic diagrams Gather information organise information make connections between elements test your diagram 9) Why is it important to use conventionally accepted and familiar shapes and
symbols in your schematic diagrams So that the diagram will be easily understood by the target audience
Foundation Computing
Basic Schematic Diagrams 5957docx Page 56
References httpwindowsmicrosoftcomen-NZwindows7Getting-started-with-Paint accessed Sat 5th December in Timaru New Zealand httpenwikipediaorgwikiSchematic_diagrams accessed Sat 5th December in Timaru New Zealand httpenwikipediaorgwikiSymbol accessed Sat 5th December in Timaru New Zealand
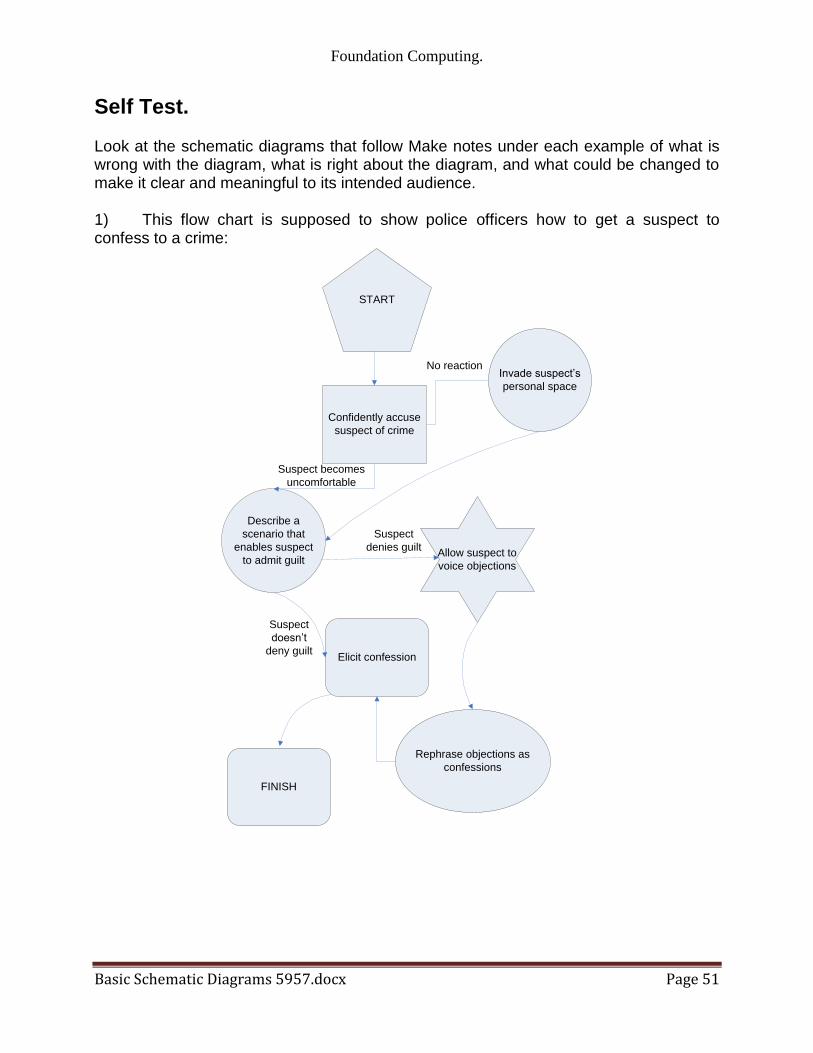
Foundation Computing
Basic Schematic Diagrams 5957docx Page 51
Self Test Look at the schematic diagrams that follow Make notes under each example of what is wrong with the diagram what is right about the diagram and what could be changed to make it clear and meaningful to its intended audience 1) This flow chart is supposed to show police officers how to get a suspect to confess to a crime
START
Confidently accuse
suspect of crime
Describe a
scenario that
enables suspect
to admit guiltAllow suspect to
voice objections
Invade suspectrsquos
personal space
Suspect becomes
uncomfortable
Suspect
doesnrsquot
deny guilt
Suspect
denies guilt
No reaction
Elicit confession
Rephrase objections as
confessions
FINISH
Foundation Computing
Basic Schematic Diagrams 5957docx Page 52
2) The following diagram is an organisation chart for Widget Enterprises
John Smith
MANAGER
Seth Drew
IT MANAGER
May Furur
SECRETARY
Judith Holland
CUSTOMER SERVICES manager
Jad Ling
HELPDESK
Harry Petal
FINANCIAL MANAGER
Wanda Springer
MARKETING
MANAGER
Bob Smithells
CLEANER
Kelly Inlerl
MARKETING ASSISTANT
Beryl Thin
CUSTOMER SERVICES ASSISTANTValda Rigley
CUSTOMER
SERVICES
ASSISTANT
Levi Quayle
COMPUTER
TECHNICIAN
3) Which of the following computer applications can be used to create schematic diagrams
a) Microsoft Visio
b) Microsoft Paint
c) Microsoft Word
d) All of the above
4) Which frequently used shapes does the Microsoft Paint Tool bar contain templates for
5) Where in the Microsoft Paint window would you be able to select the thickness of line that you wanted for a brushstroke 6) Identify the purpose and intended audience for a diagram showing a businessrsquos marketing plan 7) Name two characteristics of well-designed schematic diagrams 8) Identify four steps involved in designing schematic diagrams 9) Why is it important to use conventionally accepted and familiar shapes and symbols in your schematic diagrams
Foundation Computing
Basic Schematic Diagrams 5957docx Page 53
Self Test Answers 1) This flow chart is supposed to show police officers how to get a suspect to confess to a crime
START
Confidently accuse
suspect of crime
Describe a
scenario that
enables suspect
to admit guiltAllow suspect to
voice objections
Invade suspectrsquos
personal space
Suspect becomes
uncomfortable
Suspect
doesnrsquot
deny guilt
Suspect
denies guilt
No reaction
Elicit confession
Rephrase objections as
confessions
FINISH
Random shapes are meaningless and confusing ndash use conventional flow chart symbols
Stages of process are not clear ndash arrange shapes top to bottom with options at each stage branching off to side at same level
Connectors that are either straight or curved would be more consistent
Labels are clear
Text uses consistent font and size
Foundation Computing
Basic Schematic Diagrams 5957docx Page 54
2) The following diagram is an organisation chart for Widget Enterprises
John Smith
MANAGER
Seth Drew
IT MANAGER
May Furur
SECRETARY
Judith Holland
CUSTOMER SERVICES manager
Jad Ling
HELPDESK
Harry Petal
FINANCIAL MANAGER
Wanda Springer
MARKETING
MANAGER
Bob Smithells
CLEANER
Kelly Inlerl
MARKETING ASSISTANT
Beryl Thin
CUSTOMER SERVICES ASSISTANTValda Rigley
CUSTOMER
SERVICES
ASSISTANT
Levi Quayle
COMPUTER
TECHNICIAN
No clear levels to hierarchy ndash organise so that diagram reads top to bottom and positions at similar level are in same horizontal space
Different sized boxes and borders on some boxes are meaningless ndash need consistent style for similar elements
Connectors cross over each other and boxes overlap ndash arrange space to avoid this
Text size and font is mostly consistent but one typo needs correcting
3) Which of the following computer applications can be used to create schematic diagrams
a) Microsoft Visio
b) Microsoft Paint
c) Microsoft Word
d) All of the above correct
4) Which frequently used shapes does the Microsoft Paint Tool bar contain templates for
Polygon rectangle ovalellipse
Foundation Computing
Basic Schematic Diagrams 5957docx Page 55
5) Where in the Microsoft Paint window would you be able to select the thickness of line that you wanted for a brushstroke
Options area below the Toolbar
6) Identify the purpose and intended audience for a diagram showing a businessrsquos marketing plan
The purpose would be to provide an overview of the businessrsquos marketing strategy Audience could include management and employees of the business especially the Marketing department potential investors shareholders and directors of the business
7) Name two characteristics of well-designed schematic diagrams Any of simple easy for the target audience to understand include all relevant elements or parts of the process clear and logical connections between elements accurate 8) Identify four steps involved in designing schematic diagrams Gather information organise information make connections between elements test your diagram 9) Why is it important to use conventionally accepted and familiar shapes and
symbols in your schematic diagrams So that the diagram will be easily understood by the target audience
Foundation Computing
Basic Schematic Diagrams 5957docx Page 56
References httpwindowsmicrosoftcomen-NZwindows7Getting-started-with-Paint accessed Sat 5th December in Timaru New Zealand httpenwikipediaorgwikiSchematic_diagrams accessed Sat 5th December in Timaru New Zealand httpenwikipediaorgwikiSymbol accessed Sat 5th December in Timaru New Zealand
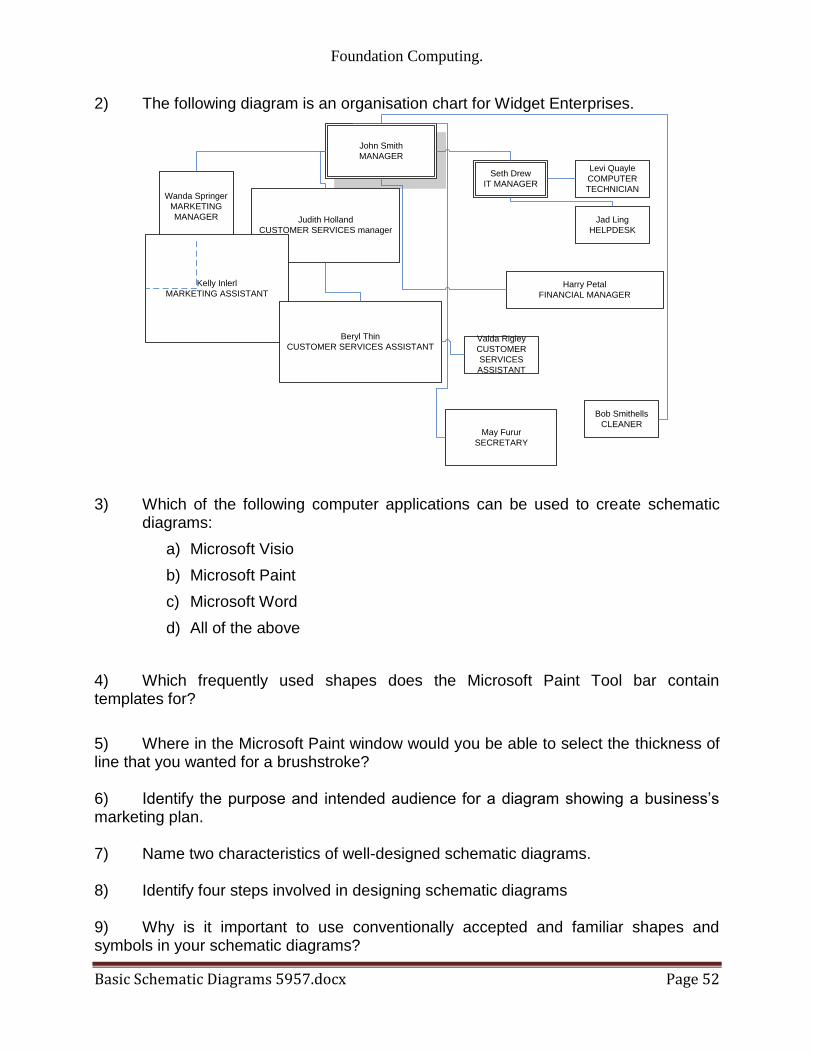
Foundation Computing
Basic Schematic Diagrams 5957docx Page 52
2) The following diagram is an organisation chart for Widget Enterprises
John Smith
MANAGER
Seth Drew
IT MANAGER
May Furur
SECRETARY
Judith Holland
CUSTOMER SERVICES manager
Jad Ling
HELPDESK
Harry Petal
FINANCIAL MANAGER
Wanda Springer
MARKETING
MANAGER
Bob Smithells
CLEANER
Kelly Inlerl
MARKETING ASSISTANT
Beryl Thin
CUSTOMER SERVICES ASSISTANTValda Rigley
CUSTOMER
SERVICES
ASSISTANT
Levi Quayle
COMPUTER
TECHNICIAN
3) Which of the following computer applications can be used to create schematic diagrams
a) Microsoft Visio
b) Microsoft Paint
c) Microsoft Word
d) All of the above
4) Which frequently used shapes does the Microsoft Paint Tool bar contain templates for
5) Where in the Microsoft Paint window would you be able to select the thickness of line that you wanted for a brushstroke 6) Identify the purpose and intended audience for a diagram showing a businessrsquos marketing plan 7) Name two characteristics of well-designed schematic diagrams 8) Identify four steps involved in designing schematic diagrams 9) Why is it important to use conventionally accepted and familiar shapes and symbols in your schematic diagrams
Foundation Computing
Basic Schematic Diagrams 5957docx Page 53
Self Test Answers 1) This flow chart is supposed to show police officers how to get a suspect to confess to a crime
START
Confidently accuse
suspect of crime
Describe a
scenario that
enables suspect
to admit guiltAllow suspect to
voice objections
Invade suspectrsquos
personal space
Suspect becomes
uncomfortable
Suspect
doesnrsquot
deny guilt
Suspect
denies guilt
No reaction
Elicit confession
Rephrase objections as
confessions
FINISH
Random shapes are meaningless and confusing ndash use conventional flow chart symbols
Stages of process are not clear ndash arrange shapes top to bottom with options at each stage branching off to side at same level
Connectors that are either straight or curved would be more consistent
Labels are clear
Text uses consistent font and size
Foundation Computing
Basic Schematic Diagrams 5957docx Page 54
2) The following diagram is an organisation chart for Widget Enterprises
John Smith
MANAGER
Seth Drew
IT MANAGER
May Furur
SECRETARY
Judith Holland
CUSTOMER SERVICES manager
Jad Ling
HELPDESK
Harry Petal
FINANCIAL MANAGER
Wanda Springer
MARKETING
MANAGER
Bob Smithells
CLEANER
Kelly Inlerl
MARKETING ASSISTANT
Beryl Thin
CUSTOMER SERVICES ASSISTANTValda Rigley
CUSTOMER
SERVICES
ASSISTANT
Levi Quayle
COMPUTER
TECHNICIAN
No clear levels to hierarchy ndash organise so that diagram reads top to bottom and positions at similar level are in same horizontal space
Different sized boxes and borders on some boxes are meaningless ndash need consistent style for similar elements
Connectors cross over each other and boxes overlap ndash arrange space to avoid this
Text size and font is mostly consistent but one typo needs correcting
3) Which of the following computer applications can be used to create schematic diagrams
a) Microsoft Visio
b) Microsoft Paint
c) Microsoft Word
d) All of the above correct
4) Which frequently used shapes does the Microsoft Paint Tool bar contain templates for
Polygon rectangle ovalellipse
Foundation Computing
Basic Schematic Diagrams 5957docx Page 55
5) Where in the Microsoft Paint window would you be able to select the thickness of line that you wanted for a brushstroke
Options area below the Toolbar
6) Identify the purpose and intended audience for a diagram showing a businessrsquos marketing plan
The purpose would be to provide an overview of the businessrsquos marketing strategy Audience could include management and employees of the business especially the Marketing department potential investors shareholders and directors of the business
7) Name two characteristics of well-designed schematic diagrams Any of simple easy for the target audience to understand include all relevant elements or parts of the process clear and logical connections between elements accurate 8) Identify four steps involved in designing schematic diagrams Gather information organise information make connections between elements test your diagram 9) Why is it important to use conventionally accepted and familiar shapes and
symbols in your schematic diagrams So that the diagram will be easily understood by the target audience
Foundation Computing
Basic Schematic Diagrams 5957docx Page 56
References httpwindowsmicrosoftcomen-NZwindows7Getting-started-with-Paint accessed Sat 5th December in Timaru New Zealand httpenwikipediaorgwikiSchematic_diagrams accessed Sat 5th December in Timaru New Zealand httpenwikipediaorgwikiSymbol accessed Sat 5th December in Timaru New Zealand
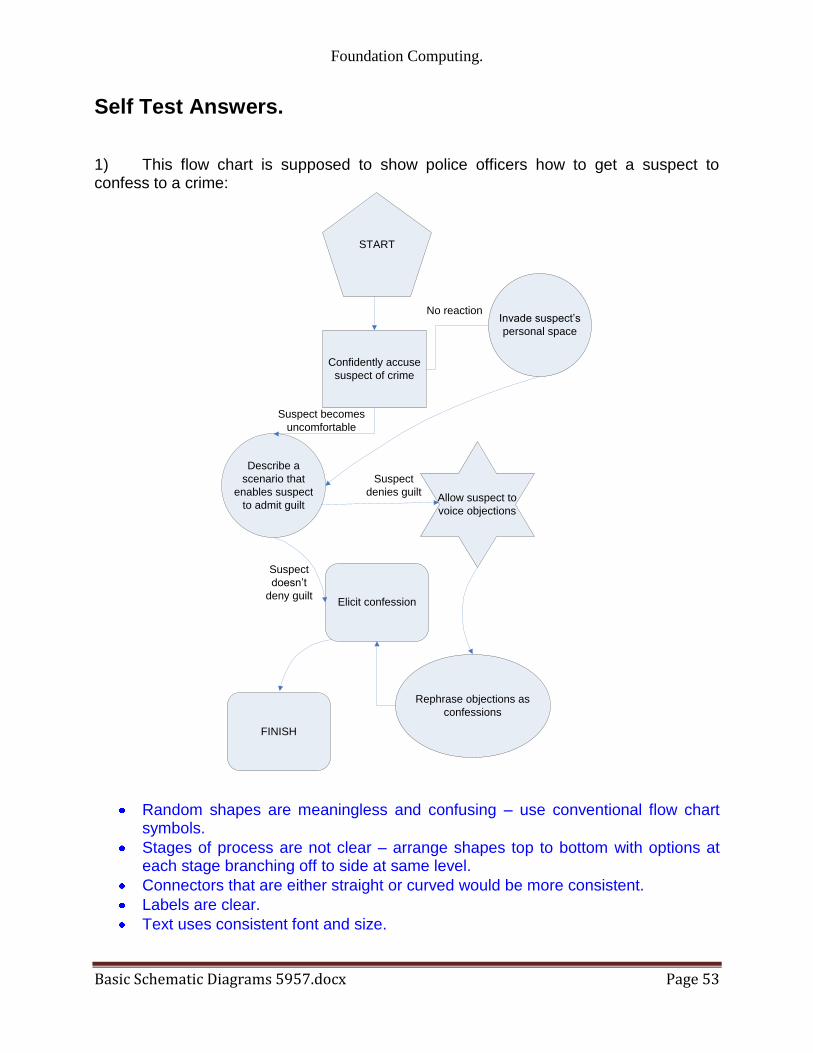
Foundation Computing
Basic Schematic Diagrams 5957docx Page 53
Self Test Answers 1) This flow chart is supposed to show police officers how to get a suspect to confess to a crime
START
Confidently accuse
suspect of crime
Describe a
scenario that
enables suspect
to admit guiltAllow suspect to
voice objections
Invade suspectrsquos
personal space
Suspect becomes
uncomfortable
Suspect
doesnrsquot
deny guilt
Suspect
denies guilt
No reaction
Elicit confession
Rephrase objections as
confessions
FINISH
Random shapes are meaningless and confusing ndash use conventional flow chart symbols
Stages of process are not clear ndash arrange shapes top to bottom with options at each stage branching off to side at same level
Connectors that are either straight or curved would be more consistent
Labels are clear
Text uses consistent font and size
Foundation Computing
Basic Schematic Diagrams 5957docx Page 54
2) The following diagram is an organisation chart for Widget Enterprises
John Smith
MANAGER
Seth Drew
IT MANAGER
May Furur
SECRETARY
Judith Holland
CUSTOMER SERVICES manager
Jad Ling
HELPDESK
Harry Petal
FINANCIAL MANAGER
Wanda Springer
MARKETING
MANAGER
Bob Smithells
CLEANER
Kelly Inlerl
MARKETING ASSISTANT
Beryl Thin
CUSTOMER SERVICES ASSISTANTValda Rigley
CUSTOMER
SERVICES
ASSISTANT
Levi Quayle
COMPUTER
TECHNICIAN
No clear levels to hierarchy ndash organise so that diagram reads top to bottom and positions at similar level are in same horizontal space
Different sized boxes and borders on some boxes are meaningless ndash need consistent style for similar elements
Connectors cross over each other and boxes overlap ndash arrange space to avoid this
Text size and font is mostly consistent but one typo needs correcting
3) Which of the following computer applications can be used to create schematic diagrams
a) Microsoft Visio
b) Microsoft Paint
c) Microsoft Word
d) All of the above correct
4) Which frequently used shapes does the Microsoft Paint Tool bar contain templates for
Polygon rectangle ovalellipse
Foundation Computing
Basic Schematic Diagrams 5957docx Page 55
5) Where in the Microsoft Paint window would you be able to select the thickness of line that you wanted for a brushstroke
Options area below the Toolbar
6) Identify the purpose and intended audience for a diagram showing a businessrsquos marketing plan
The purpose would be to provide an overview of the businessrsquos marketing strategy Audience could include management and employees of the business especially the Marketing department potential investors shareholders and directors of the business
7) Name two characteristics of well-designed schematic diagrams Any of simple easy for the target audience to understand include all relevant elements or parts of the process clear and logical connections between elements accurate 8) Identify four steps involved in designing schematic diagrams Gather information organise information make connections between elements test your diagram 9) Why is it important to use conventionally accepted and familiar shapes and
symbols in your schematic diagrams So that the diagram will be easily understood by the target audience
Foundation Computing
Basic Schematic Diagrams 5957docx Page 56
References httpwindowsmicrosoftcomen-NZwindows7Getting-started-with-Paint accessed Sat 5th December in Timaru New Zealand httpenwikipediaorgwikiSchematic_diagrams accessed Sat 5th December in Timaru New Zealand httpenwikipediaorgwikiSymbol accessed Sat 5th December in Timaru New Zealand
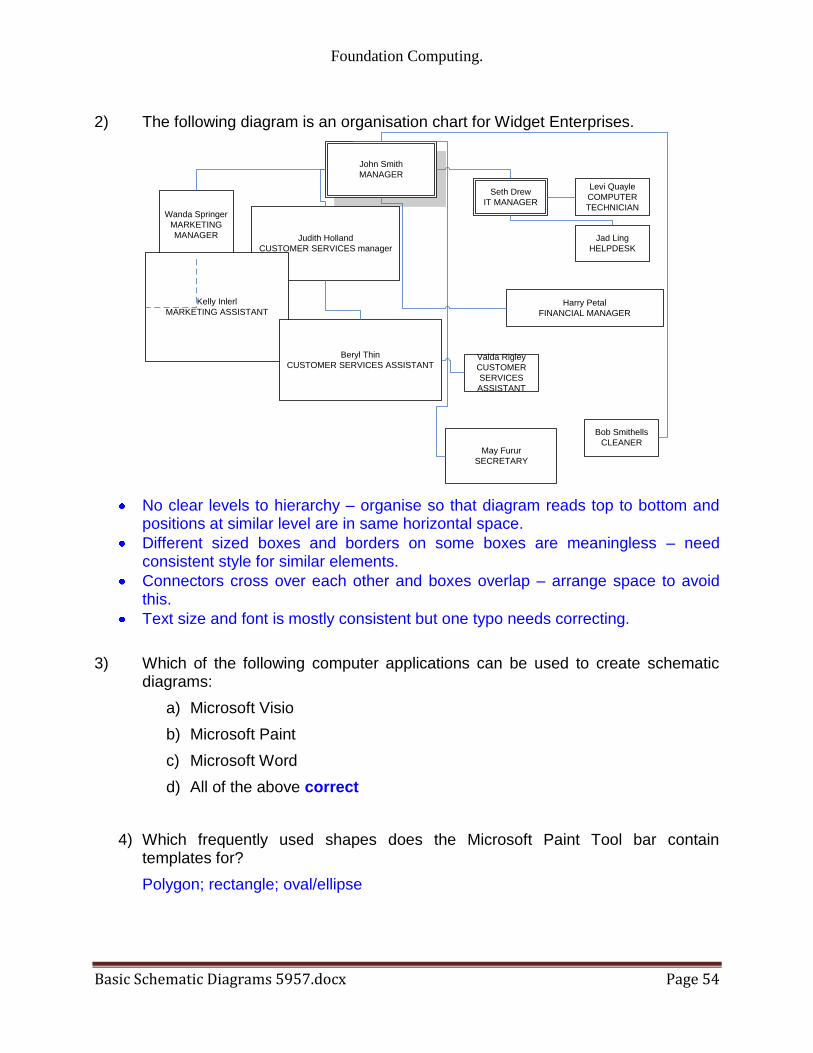
Foundation Computing
Basic Schematic Diagrams 5957docx Page 54
2) The following diagram is an organisation chart for Widget Enterprises
John Smith
MANAGER
Seth Drew
IT MANAGER
May Furur
SECRETARY
Judith Holland
CUSTOMER SERVICES manager
Jad Ling
HELPDESK
Harry Petal
FINANCIAL MANAGER
Wanda Springer
MARKETING
MANAGER
Bob Smithells
CLEANER
Kelly Inlerl
MARKETING ASSISTANT
Beryl Thin
CUSTOMER SERVICES ASSISTANTValda Rigley
CUSTOMER
SERVICES
ASSISTANT
Levi Quayle
COMPUTER
TECHNICIAN
No clear levels to hierarchy ndash organise so that diagram reads top to bottom and positions at similar level are in same horizontal space
Different sized boxes and borders on some boxes are meaningless ndash need consistent style for similar elements
Connectors cross over each other and boxes overlap ndash arrange space to avoid this
Text size and font is mostly consistent but one typo needs correcting
3) Which of the following computer applications can be used to create schematic diagrams
a) Microsoft Visio
b) Microsoft Paint
c) Microsoft Word
d) All of the above correct
4) Which frequently used shapes does the Microsoft Paint Tool bar contain templates for
Polygon rectangle ovalellipse
Foundation Computing
Basic Schematic Diagrams 5957docx Page 55
5) Where in the Microsoft Paint window would you be able to select the thickness of line that you wanted for a brushstroke
Options area below the Toolbar
6) Identify the purpose and intended audience for a diagram showing a businessrsquos marketing plan
The purpose would be to provide an overview of the businessrsquos marketing strategy Audience could include management and employees of the business especially the Marketing department potential investors shareholders and directors of the business
7) Name two characteristics of well-designed schematic diagrams Any of simple easy for the target audience to understand include all relevant elements or parts of the process clear and logical connections between elements accurate 8) Identify four steps involved in designing schematic diagrams Gather information organise information make connections between elements test your diagram 9) Why is it important to use conventionally accepted and familiar shapes and
symbols in your schematic diagrams So that the diagram will be easily understood by the target audience
Foundation Computing
Basic Schematic Diagrams 5957docx Page 56
References httpwindowsmicrosoftcomen-NZwindows7Getting-started-with-Paint accessed Sat 5th December in Timaru New Zealand httpenwikipediaorgwikiSchematic_diagrams accessed Sat 5th December in Timaru New Zealand httpenwikipediaorgwikiSymbol accessed Sat 5th December in Timaru New Zealand
Foundation Computing
Basic Schematic Diagrams 5957docx Page 55
5) Where in the Microsoft Paint window would you be able to select the thickness of line that you wanted for a brushstroke
Options area below the Toolbar
6) Identify the purpose and intended audience for a diagram showing a businessrsquos marketing plan
The purpose would be to provide an overview of the businessrsquos marketing strategy Audience could include management and employees of the business especially the Marketing department potential investors shareholders and directors of the business
7) Name two characteristics of well-designed schematic diagrams Any of simple easy for the target audience to understand include all relevant elements or parts of the process clear and logical connections between elements accurate 8) Identify four steps involved in designing schematic diagrams Gather information organise information make connections between elements test your diagram 9) Why is it important to use conventionally accepted and familiar shapes and
symbols in your schematic diagrams So that the diagram will be easily understood by the target audience
Foundation Computing
Basic Schematic Diagrams 5957docx Page 56
References httpwindowsmicrosoftcomen-NZwindows7Getting-started-with-Paint accessed Sat 5th December in Timaru New Zealand httpenwikipediaorgwikiSchematic_diagrams accessed Sat 5th December in Timaru New Zealand httpenwikipediaorgwikiSymbol accessed Sat 5th December in Timaru New Zealand


