Genetic analysis and genotype 3 environment (G 3 E)for grey leaf spot disease resistance in elite African maize(Zea mays L.) germplasm
Julia Sibiya • Pangirayi Tongoona •
John Derera • Neil van Rij
Received: 2 November 2010 / Accepted: 20 May 2011 / Published online: 1 June 2011
� Springer Science+Business Media B.V. 2011
Abstract Maize grey leaf spot (GLS) disease
remains an important foliar disease in sub-Saharan
Africa accounting for more than 25% yield losses in
maize. Information on inheritance of GLS resistance
of germplasm adapted to African environments is
required in new sources being identified. Therefore,
hybrids generated from a 10 9 10 half-diallel mating
of tropical advanced maize inbred lines were evalu-
ated in six environments to determine combining
ability, genotype 9 environment interaction (G 9 E)
and the impact of GLS disease on grain yield.
General combining ability effects were highly sig-
nificant and accounted for 72 and 68% of the
variation for GLS resistance and grain yield, respec-
tively. Significant specific combining ability effects
associated with reduced disease levels were observed
in some hybrids when one parent was resistant, and
these may be exploited in developing single cross
maize hybrids. Regression analysis showed a
260–320 kg ha-1 decrease in maize grain yield per
each increase in GLS disease severity score, and
significant associations (r = -0.31 to -0.60) were
observed between grain yield and GLS severity
scores. This showed the potential of GLS disease to
reduce yield in susceptible varieties grown under
favourable disease conditions, without control mea-
sures. Genotype and genotype 9 environment biplots
and correlation analysis indicated that the significant
G 9 E observed was not due to changes in hybrid
ranking, implying absence of a significant crossover
interaction. Therefore, predominance of additive gene
effects imply that breeding progress for GLS disease
resistance would be made through selection and this
could be achieved at a few hot-spot sites, such as
Baynesfield and Cedara locations in South Africa,
and still deploy the resistant germplasm to other
environments in which they are adapted.
Keywords Combining ability � Gene action �Genotype 9 environment interaction � Grey leaf spot
disease � Maize (Zea mays L.) � Yield loss
Introduction
Maize grey leaf spot (GLS) disease caused by
Cercospora spp. is currently one of the most impor-
tant foliar diseases in sub-Saharan Africa (SSA) and
is now endemic to the region (Menkir and Ayodele
J. Sibiya (&) � P. Tongoona � J. Derera
African Centre for Crop Improvement, School
of Agricultural Sciences and Agribusiness, University
of KwaZulu-Natal, P. Bag X01, Scottsville,
Pietermaritzburg 3209, South Africa
e-mail: [email protected]; [email protected]
N. van Rij
Crop Protection, Cedara, KwaZulu-Natal Department
of Agriculture, Environmental Affairs and Rural
Development, P. Bag X9059, Pietermaritzburg 3200,
South Africa
123
Euphytica (2012) 185:349–362
DOI 10.1007/s10681-011-0466-2
2005; Vivek et al. 2010). More than one species of
Cercospora spp. has been associated with GLS
disease of maize (Zea mays L), namely C. zeae-
maydis Group I and II. Group I was reported to be
dominant in the USA but also occurs elsewhere in the
world, while Group II occurs in the USA, Africa and
possibly elsewhere (Dunkle and Levy 2000).
Recently, Group II, which is genetically and pheno-
typically distinct from Group I, has been demon-
strated to be a distinct species and renamed
Cercospora zeina (Crous et al. 2006). Analysis of
samples from South Africa, Zimbabwe and Zambia,
further confirmed the presence of C. zeina and
absence of C. zeae-maydis in commercial maize
plantations in southern Africa (Crous et al. 2006;
Meisel et al. 2009).
GLS disease of maize results in yield losses of
around 10–25% annually, but losses as much as 90%
due to severe deterioration of the leaves and stalk
lodging have also been recorded (Latterell and Rossi
1983; Ward et al. 1997a, b). This has serious
consequences on food security because maize is the
predominant staple crop for millions of people in the
SSA. Management of GLS disease has focused
mostly on the use of fungicides and genetic resistance
(Gordon et al. 2006), but most smallholder farmers in
the SSA have limited access to chemicals because of
their prohibitive cost (Ward et al. 1999). Conse-
quently, control of GLS disease in the smallholder
sector in Africa is difficult when susceptible varieties
are grown. Therefore, it would be prudent to breed
new maize varieties with acceptable levels of GLS
disease resistance to minimize grain yield losses.
Diverse sources and the genetic basis of the
resistance to GLS have been identified and reported
by different researchers (Thompson et al. 1987; Huff
et al. 1988; Donahue et al. 1991; Gevers et al. 1994;
Coates and White 1998; Menkir and Ayodele 2005;
Derera et al. 2008; Vivek et al. 2010). However, the
majority of them have been conducted in temperate
environments with temperate germplasm that cannot
be used directly in African’s tropical environments.
Only a few sources of resistance have been identified
from some tropical and subtropical African germ-
plasm up to now (Gevers et al. 1994; Menkir and
Ayodele 2005; Derera et al. 2008; Vivek et al. 2010).
Gevers et al. (1994) observed high resistance in the
South African maize cultivars (KO54W and SO507),
which contain the white modified opaque-2 gene and
belong to the (F) and (M) heterotic groups, respec-
tively. However, these subtropical quality protein
maize inbreds are low yielding, and may not be
adapted to tropical conditions in SSA. Although some
resistant sources have been reported for heterotic
groups used in southern African breeding pro-
grammes and other maize lines adapted to African
tropical conditions, the nature and magnitude of GLS
disease resistance requires further analysis in some of
these elite inbreds (Menkir and Ayodele 2005; Derera
et al. 2008; Vivek et al. 2010). In addition, given the
potential that GLS disease has to threaten food
security, more sources of GLS disease resistance
would be useful, especially those that can contribute
resistance to inbred lines that are susceptible to GLS;
but are high yielding and are widely used in the
hybrid maize production in Africa. The new sources
of GLS resistance should be well characterised and
the gene action and combining ability (CA) of the
lines established. Moreover, information is still
limited on the mode of inheritance of GLS disease
resistance for most of the germplasm that are adapted
to African environments (Derera et al. 2008). Such
information is required to optimise their breeding
strategies.
GLS disease resistance has been shown to be
controlled mainly by additive gene effects (Thomp-
son et al. 1987; Huff et al. 1988; Ulrich et al. 1990;
Gevers et al. 1994; Derera et al. 2008; Vivek et al.
2010). However, some studies have also indicated
dominant gene action to have a significant role in
conferring resistance in some maize hybrids (Elwin-
ger et al. 1990; Coates and White 1998; Derera et al.
2008; Vivek et al. 2010). On the other hand, Hohls
et al. (1995) reported that resistance was conditioned
by additive and complete dominance with minor
epistasis in a diallel comprising maize lines from
three divergent backgrounds in South Africa.
In addition, production environments in the SSA
are highly variable and stress-prone resulting in
complicated genotype 9 environment (G 9 E) inter-
actions (FAO and CIMMYT 1997). Therefore, dis-
eases including GLS disease are often difficult to
control, as their occurrence year after year is less
predictable because of their high dependence on
prevailing weather conditions (Vivek et al. 2010).
The severity of most diseases thus tends to vary with
locations or environments resulting in significant
G 9 E (Levy and Pataky 1992; Egesi et al. 2009).
350 Euphytica (2012) 185:349–362
123
This G 9 E complicates breeding and selection for
GLS disease resistance as the phenotypic expression
of the host may vary across the different environ-
ments (location and season), because of pathogen-
sensitivity to environmental changes (Carson et al.
2002). Vivek et al. (2010) reported significant G 9 E
for a number of important maize foliar diseases,
which included GLS disease, northern corn leaf
blight (NCLB) disease, common rust disease, and
Phaeosphaeria leaf spot (PLS) disease, which was
due to differences in disease pressure influenced by
the prevailing weather conditions in the different
environments.
This study was therefore conducted to (i) determine
the CA and types and magnitude of gene action for
resistance to the GLS disease among selected inbred
maize lines using a diallel analysis, (ii) investigate
G 9 E for the GLS disease resistance in different
environments as location and season and, finally (iii)
determine the impact of GLS disease on yield of the
hybrids developed from a diallel analysis of selected
elite germplasm.
Materials and methods
Germplasm
Maize inbred lines from heterotic groups adapted
mostly to sub-tropical and tropical, mid-altitude
environments were sourced from the International
Maize and Wheat Improvement Center (CIMMYT)
programme in Harare, Zimbabwe and the Crop
Breeding Institute in Zimbabwe (Table 1). The impor-
tant heterotic groups included the broad CIMMYT
(A), (B) and (AB) classification (CIMMYT 2001), the
SC (Southern Cross), N (Northern cross) and the
(P) heterotic group (Potchefstroom Pearl), and these
are widely used in eastern and southern Africa (Gevers
and Whythe 1987; Mickelson et al. 2001). The
CIMMYT heterotic group (A) is mainly derived from
populations and lines which include Tuxpeno, Kitale,
BSSS (Iowa Stiff Stalk Synthetic), Salisbury white and
B73, whereas the CIMMYT heterotic group (B) com-
prises derivatives from populations and lines related to
ETO, Ecuador 573, Lancaster, Southern cross and
Mo17 (CIMMYT 2001). Maize lines with white grain
colour only were used and selected based on their
reactions to the GLS disease.
Experimental design and management
Ten advanced maize inbred lines (Table 1) were
crossed in a half diallel-mating scheme in 2006/2007
season at the University of KwaZulu-Natal (UKZN),
Pietermaritzburg, South Africa. The resulting 45
single cross, F1 hybrids plus 9 control varieties were
evaluated in 2007/2008 and 2008/2009 seasons
across six environments. The locations included two
subtropical environments; Cedara (CED), South
Africa (30�160 E, 29�320 S, 1076 m asl) and Baynes-
field (BF) Estate, South Africa (30�210 E, 29�460 S,
758 m asl); and two tropical environments; Rattray
Arnold Research Station (RARS), Zimbabwe
(31�140 E, 17�400 S, 1300 m asl), and Mpongwe,
Zambia (ZAMB) (28�80 E, 13�310 S, 1219 m asl).
Plantings at Cedara, were done in November 2007
(CED108), January 2008 (CED208) and November
2008 (CED09), while at RARS plantings were in
December 2007 (RARS08), Mpongwe, January 2008
(ZAMB08), and Baynesfield Estate in December
2008 (BF09) giving a total of six environments. The
parents plus four inbred controls were evaluated in
trials adjacent to the hybrid trials, but only in three
environments (CED108, CED09 and BF09).
The F1 hybrids and control hybrid varieties were
laid out in the field in two replications using a 9 9 6
alpha lattice design in each locality. The inbred parents
and their controls were planted in a randomized
complete block design with two replications. Plot sizes
for the hybrids and inbred parental lines in each
locality were two rows, 3–5 m long, with 0.75 m inter-
row spacing and 0.3 m intra-row spacing. Two seeds
per hill were planted and later thinned to one resulting
in plant population densities of approximately 44,000
per hectare in all the six environments. Two to four
rows each of a susceptible maize hybrid and inbred
line were used as borders to enhance disease infection
and give an indication of the disease severity.
Standard agronomic practices were followed
according to the recommendations. The rates of
fertilizer (kg ha-1) applied at the sites were as follows:
Cedara and Baynesfield, 120 kg N, 33 kg P, 44 kg K;
RARS, 176 kg N, 70 kg P, 35 kg K; and Mpongwe
208 kg N, 35 kg P, 21 kg K. Fields were left to natural
incidence of the disease without artificial inoculations.
The total rainfall amounts received at each of the
environments during the growing season were;
729 mm at CED108, 301 mm at CED 208 and
Euphytica (2012) 185:349–362 351
123
603 mm at CED09 (Agricultural Research Council-
ISCW AgroMet Potchefstroom 2009), 844 mm at
BF09 (Baynesfield Estate 2009), 806 mm at RARS
and 950 mm at ZAMB08 (Seed Co. Zimbabwe and
Zambia 2009, respectively).
GLS disease severity was assessed twice at mid-
silking (GLS1) and at hard dough stages (GLS2), based
on visual assessment of the whole plot using a slight
modification of the 1–9 rating scale of Munkvold et al.
(2001) as follows; 1 = 0%, 2 = \1%, 3 = 1–3%,
4 = 4–6%, 5 = 7–12%, 6 = 13–25%, 7 = 26–50%,
8 = 51–75% and 9 = 75–100% leaf area showing
disease symptoms. The scores were further classified
into the following disease reaction types; 1.0 = symp-
tomless, 2.0–4.0 = resistant, 4.1–5.0 = moderately
resistant, 5.1–6.0 = moderately susceptible, 6.1–9.0 =
susceptible (Derera 2005). A Pearson correlation anal-
ysis was performed using PROC CORR module in the
SAS statistical software between GLS1 and GLS2 scores
and there was a strong positive correlation between the
two scores (r = 0.94, P B 0.001). However, the score
recorded at the hard-dough stage was used for the
statistical analysis as it reflected the total amount of
disease at the end of the season.
Other records were taken following the standard
practice used at CIMMYT (CIMMYT 1985) and these
included; the number of days to anthesis (number of
days to 50% pollen shed), and grain yield (kg). For grain
yield, ears were harvested on a whole plot basis and the
fresh ear weight (kg) determined. Five ears from each
plot were shelled to determine moisture content (%) at
harvest and shelling percentages. The field weight was
then used to estimate the grain yield (t ha-1) adjusted to
12.5% grain moisture content (CIMMYT 1985).
Statistical analysis
Analyses of variance were performed for GLS
disease severity and grain yield (t ha-1) data of the
hybrids and the hybrid controls using PROC GLM
procedure in SAS 9.1 (SAS Institute Inc 2002). Data
for disease severity (score 1–9) and grain yield
(t ha-1) were also analysed for the CA (Griffing’s
Method IV) using the Diallel SAS05 module in the
SAS statistical software (Zhang et al. 2005). The F1
hybrids and the inbred parents were treated as fixed
effects in the statistical analysis and environments
(both spatial and temporal environments) as random
effects. Only the 45 F1 experimental hybrids were
used in the analysis for CA effects. To estimate the
general combining ability (GCA) and specific com-
bining ability (SCA) effects; Griffing’s diallel anal-
yses, Model 1 (fixed genotype effects), Method 4
(crosses only) were used according to the linear
model for analysis of variance across environments:
Yijkl ¼ lþ vij þ rk þ rvð Þijkþeijkl
where Yijkl is the observed measurement for the ijth
cross in the kth replication, and lth environment; l is
the overall mean, vij is the genotype effect which is
Table 1 Pedigrees and heterotic groups for the parent inbred lines used to generate hybrids in the diallel mating scheme
Designation Pedigree or population (OPVs) Heterotic groupinga
A1220-4 [(CML395/CML444)-B-4-1-3-1-B/CML395//SC/
ZM605#b-19-2-X]-1-2-X-1-1-BBBBBB]-7-1-3-2-BBB
B/SC
A16 S89500F2-2-2-1-1-B*5-BBB A
CML445 [[TUXPSEQ]C1F2/P49-SR]F2-45-7-5-1-BBB AB
CML488 DTPWC8F31-4-2-1-5-BBB AB
CZL00001 INTA-191-2-1-2-BBBB A
CZL00009 INTA-F2-192-2-1-1-1-BBBBB A
MP18 [[[NAW5867/P30SR]-111-2/[NAW5867/P30SR]-25-1]-9-2-3-
B-2-B/CML388]-B- 35-2-B-1-#-1-BB
A/P
MP59 [AC8342/IKENNE{1}8149SR//PL9A]C1F1-500-4-X-1-1-BB-1-BB AB
MP82 [EMSR]#B#bF101sr-2-1-sr-3-2-4-b-b B
N3-2-3-3 Salisbury White N
a SC, N and P are principal heterotic groups for the national programme in Zimbabwe and lines in these groups were derived from
landraces Southern cross, Salisbury white (Northern cross) and Natal Potchefstroom Pearl (Mickelson et al. 2001)
352 Euphytica (2012) 185:349–362
123
equal to gi ? gj ? sij, where gi and gj, are GCA effects
for the ith and jth parents, respectively; sij is the SCA
effect for the ijth cross; rk the replication effect; (rv)ijk
the interaction between the ijth cross within the kth
replication and eijkl is the error term for the Yijkl
observation. The assumption was that the eijkl was
normally and independently distributed with
mean = 0 and variance = re2. The G 9 E interaction
terms were used to test for the significance of the
corresponding genetic effects (Zhang and Kang 1997).
The environments and replications within environ-
ments were considered random and therefore tested
against the residual error term. The relative importance
of GCA and SCA in predicting progeny performance
was determined by the proportion that each contributed
to the total sum of squares of the hybrids (Cisar et al.
1982) and by calculating the GCA/SCA ratio of the
mean squares (Kasuga and Inoue 2001).
Pearson correlation coefficients for the GLS disease
severity scores with grain yield were computed using
the PROC CORR SAS 9.1 (SAS Institute Inc 2002). In
addition, a simple linear regression analysis was also
used to determine the impact of GLS disease severity
scores on grain yield of the experimental hybrids for all
the environments using PROC REG SAS 9.1(SAS
Institute Inc 2002). The genotypes in each environment
were also ranked based on their reaction to the GLS
disease using the PROC RANK in SAS 9.1. The
Spearman rank order correlation coefficients were then
calculated on the genotype rank scores module in SAS
9.1 statistical software.
Genotype 9 environment analysis
The variation due to genotypes and G 9 E for the
GLS disease was explained using the genotype and
genotype 9 environment (GGE) biplot based on the
principal component analysis (PCA) of environment-
centred data (Yan et al. 2000). The GGE biplot
provided a visual relation among the hybrids and test
environments and was performed with Genstat 12
software (Payne et al. 2010) using the model based on
singular value decomposition (SVD) of the first two
principal components (Yan 2002) as follows:
Yij � l� bj ¼ k1ni1gj1 þ k2ni2gj2 þ eij
where: Yij is the yield mean of ith hybrid in jth
environment, l is the grand mean, bj is the main
effect of environment j, l ? bj is the mean yield
across all hybrids in environment j, k1 and k2 are the
singular values (SV) for the first and second principal
component (PC1 and PC2), respectively, ni1 and ni2
are the eigen vectors of hybrid i for PC1 and PC2,
respectively, g1j and g2j are the eigen vectors of
environment j for PC1 and PC2, respectively and eij is
the residual associated with hybrid i in environment j.
The ‘ideal’ environment for screening the geno-
types should have a high PC1 value, that is, it
provides better disease discrimination and PC2 values
near zero, which is a closer representative of the
environment mean (Yan et al. 2000). To visualize the
performance of the genotypes in terms of their
reaction to GLS, in each environment and groups of
environments, a polygon view (Yan 2002) was drawn
by connecting hybrids that were furthest from the
biplot origin such that all hybrids were enclosed
within the polygon. Perpendicular lines were then
drawn to each side of the polygon starting from the
biplot origin (Yan 2002).
The biplot was also used to explore the interrela-
tionships among environments by constructing lines
(environment vectors) from the biplot origin to
markers for the environments. An angle of zero
indicated a correlation of ?1, while an angle of 90�or -90�, a correlation of zero, and an angle of 180�, a
correlation of -1 (Yan 2002). The length of the
vectors was also used to determine the discriminating
ability of each of the test environments, with a shorter
vector implying that the environment was not well
represented by PC1 and PC2 (Yan et al. 2007).
Results and discussion
Hybrids and controls presented in Table 2 were
selected based on anthesis days and high yield
(t ha-1, that is, the top one-third high-yielding
hybrids presented for the late maturing group). There
was significant variation (P B 0.05) for the GLS
disease scores amongst the F1 hybrids. Most of the
hybrids exhibited a resistant reaction (scores 2.0–4.0)
across the six environments. Baynesfield location
(BF09) had the highest scores ranging from (1.0–9.0)
for GLS disease severity, whereas RARS08 and
CED208 had the lowest scores ranging from
(1.0–6.0) and (1.0–5.0), respectively (data not
shown). In addition, means for the GLS disease
Euphytica (2012) 185:349–362 353
123
scores of the susceptible hybrid and inbred line used
as border rows at the different environments ranged
from 5.0 to 9.0 depending on the environment (data
not shown). This showed that the disease pressure
was relatively high in all the localities. There is
continuous maize cultivation at all the locations and
high humidity, high temperatures and high summer
rainfall; that is, conditions favourable for the GLS
disease development (Rupe et al. 1982; de Nazareno
et al. 1993; Bhatia and Munkvold 2002).
In addition, most of the fields at Cedara (CED108
and CED09) and Baynesfield (BF09) localities that
had high disease pressure were under reduced tillage
suggesting high initial inoculum levels in the plant
debris and soil, which could have contributed to the
high disease levels. Besides, these two sites are
Table 2 Results of selected F1 hybrids and controls tested across six environments between 2007 and 2009 for the GLS disease
severity scores (1–9) (Munkvold et al. 2001), grain yield (t ha-1) and their rankings and days to 50% anthesis
Entry Cross Yield (t ha-1) Yield ranka Anthesis GLS score (1–9) GLS rankb
Hybrids with anthesis between 67 and 74 days
12 A1220-4 9 CZL00009 8.3 6 74 1.0 51
22 CZL00009 9 N3-2-3-3 8.0 9 73 1.8 33
26 CZL00009 9 MP59 7.7 21 74 1.3 39
21 CZL00009 9 CZL00001 7.3 28 73 1.2 46
27 CZL00009 9 CML488 6.6 42 72 2.1 29
23 CZL00009 9 MP82 6.5 44 72 1.3 39
25 CZL00009 9 MP18 6.2 51 72 1.3 39
Controls
57 PAN6227 6.8 38 74 1.3 39
62 SC513 6.6 41 73 1.5 38
56 PAN6017 6.2 50 72 2.2 28
Hybrids with anthesis between 75 and 82 days
16 A1220-4 9 A16 9.0 1 79 3.5 14
15 A1220-4 9 MP82 8.7 2 77 1.6 36
24 CZL00009 9 A16 8.7 3 75 1.3 39
37 N3-2-3-3 9 A16 8.5 4 79 7.1 1
47 A16 9 MP18 8.3 5 77 3.3 15
13 A1220-4 9 CZL00001 8.1 7 77 1.1 49
48 A16 9 MP59 8.0 10 80 1.7 34
39 N3-2-3-3 9 MP59 7.9 12 77 4.3 10
14 A1220-4 9 N3-2-3-3 7.8 13 78 5.6 5
31 CZL00001 9 A16 7.8 15 76 1.2 46
2 CML445 9 A1220-4 7.7 17 79 2.6 23
5 CML445 9 N3-2-3-3 7.7 18 77 6.2 2
3 CML445 9 CZL00009 7.7 19 75 1.1 49
9 CML445 9 MP59 7.7 20 78 2.6 23
Controls
60 SC633 8.1 7 75 3.8 12
61 SC719 8.0 11 83 2.1 29
63 PAN67 7.8 13 79 5.5 6
Entry mean 7.3 77 2.7
LSD (0.05) 1.0 1.3 0.5
a For grain yield; the lower the yield ranking, the higher the yield for the hybridb For mean disease severity scores; the lower the GLS disease ranking, the more susceptible the hybrid to GLS disease infection
354 Euphytica (2012) 185:349–362
123
located within the KwaZulu-Natal mist belt (Fair-
banks and Benn 2000; Derera et al. 2008) resulting in
conditions of prolonged fog or dew that are condu-
cive for the GLS disease development. However, the
late planting at Cedara (CED208) had a much lower
disease pressure. In this environment, a mid-season
drought was experienced from mid January 2008 to
end of March 2008 resulting in unfavourable condi-
tions for GLS disease development, which could have
contributed to the low disease score. At Rattray
Arnold Research Station, Zimbabwe and Mpongwe,
Zambia, deep ploughing is practiced (Derera et al.
2008), which could lead to a reduction in inoculum at
the beginning of the season, thus contributing to the
relatively lower disease levels observed compared to
Cedara and Baynesfield.
Combining ability (CA) estimates, gene
action(s) and sources of resistance
The combined analysis across environments showed
highly significant (P B 0.001) environment, entry,
GCA and SCA main effects and all the interactions
for both GLS disease severity scores and grain yield
(Table 3). This implied that both additive and non-
additive gene effects were important for the resis-
tance to GLS disease and grain yield in the maize
inbred lines used. The GCA effects accounted for a
greater proportion of the sum of squares than the SCA
effects [GCA for GLS disease severity (72%) and
grain yield (68%), SCA for GLS disease severity
(28%) and for grain yield (t ha-1) (32%)]. The
GCA:SCA ratio based on the mean squares (Table 3)
also indicated the relative importance of additive
effects vs. the non-additive gene effects (Kasuga and
Inoue 2001) for GLS disease severity and grain yield
in this study. Studies by other researchers using
different maize populations have indicated similar
findings where additive gene action was more
important than non-additive gene action (Derera
et al. 2008; Vivek et al. 2010). In contrast, studies
conducted in the USA using temperate germplasm
reported 100% GCA contribution to the variation for
GLS resistance (Thompson et al. 1987; Ulrich et al.
1990), implying that it would be possible to deter-
mine progeny performance for GLS resistance for
those materials based on GCA alone. However, since
the results in each case apply to the specific reference
populations used, the variations observed amongst
different researchers are therefore a result of the
different maize lines, environments used and possibly
GLS isolates.
For disease resistance, negative GCA and SCA
effects are desirable (Bookmyer et al. 2009). The
GCA effects, GLS mean scores and mean grain yield
(t ha-1) for the ten parents are presented in Table 4.
Table 3 Analysis of variance for GLS disease scores of 45 F1 hybrids, tested over six environments between 2007 and 2009 and the
percentage contribution of the different genetic effects to the total entry sum of squares
Source df MS (GLS 1–9) MS (yield t ha-1)
Environment 5 36.73*** 367.78***
Rep. environment 6 0.38 ns 7.17***
Hybrid 44 29.58*** 6.72***
GCA 9 103.39*** 22.35***
SCA 35 10.60*** 2.70*
Environment 9 Hybrid 220 2.05*** 3.41***
GCA 9 Environment 45 4.93*** 6.07***
SCA 9 Environment 175 1.31*** 2.73**
Pooled error 264 0.45 1.87
GCA (%) 71.50 68.04
SCA (%) 28.49 32.01
GCA:SCAa 9.75 8.27
ns non-significant (P [ 0.05)
*, **, *** Significant at P B 0.05, P B 0.01 and P B 0.001, respectivelya GCA:SCA based on the mean squares (MS) (Kasuga and Inoue 2001)
Euphytica (2012) 185:349–362 355
123
Ta
ble
4E
stim
ate
of
gen
eral
com
bin
ing
abil
ity
(GC
A)
effe
cts
for
the
GL
Sd
isea
sesc
ore
san
dg
rain
yie
ld(t
ha-
1)
mea
ns
fro
msi
xen
vir
on
men
tsb
etw
een
20
07
and
20
09
Par
ent
GL
SG
CA
per
env
iro
nm
ent
Acr
oss
env
iro
nm
ents
CE
D1
08
CE
D2
08
RA
RS
08
ZA
MB
08
CE
D0
9B
F0
9G
LS
Mea
nS
core
(1–
9)
Dis
ease
reac
tio
n
GL
S
GC
A
Mea
ng
rain
yie
ld
(th
a-1)
Yie
ld
GC
A
A1
22
0-4
-0
.23
ns
0.0
5n
s-
0.2
8n
s-
0.3
9*
*0
.49
**
*-
0.3
0*
2.0
R-
0.1
1n
s3
.10
.69
**
A1
60
.40
**
0.8
0*
**
0.9
8*
**
1.0
5*
**
0.6
8*
**
1.2
0*
**
6.3
S0
.85
**
*1
.70
.78
**
*
CM
L4
45
1.0
3*
**
-0
.08
ns
0.3
5n
s0
.43
**
0.8
7*
**
0.8
9*
**
5.0
S0
.58
**
*3
.80
.12
ns
CM
L4
88
0.0
9n
s0
.68
**
*0
.10
ns
0.4
6*
*0
.36
*1
.95
**
*4
.8M
S0
.60
**
*2
.7-
0.6
0*
*
CZ
L0
00
01
-1
.79
**
*-
0.8
9*
**
-0
.90
**
*-
1.2
0*
**
-1
.26
**
*-
2.1
8*
**
1.3
R-
1.3
7*
**
2.5
-0
.24
ns
CZ
L0
00
09
-1
.54
**
*-
0.7
6*
**
-0
.59
**
-1
.45
**
*-
1.4
5*
**
-2
.55
**
*1
.0R
-1
.39
**
*4
.40
.13
ns
MP
18
0.2
8n
s0
.11
ns
0.7
3*
**
0.2
4n
s-
0.8
3*
**
-0
.49
**
*5
.0M
S0
.01
ns
2.4
-0
.60
**
MP
59
0.2
8n
s-
0.3
3*
-0
.90
**
*-
0.7
0*
**
-0
.89
**
*-
0.4
3*
**
1.5
R-
0.4
9*
**
2.4
0.0
1n
s
MP
82
-1
.10
**
*-
0.6
4*
**
-0
.46
*-
0.5
1*
**
-0
.26
ns
-0
.80
**
*2
.0R
-0
.63
**
*2
.7-
0.4
4n
s
N3
-2-3
-32
.59
**
*1
.05
**
*0
.98
**
*2
.11
**
*2
.30
**
*2
.70
**
*8
.8S
1.9
5*
**
3.8
0.1
4n
s
SE
(gi-
gj)
0.1
50
.15
0.2
00
.16
0.1
60
.13
0.1
20
.24
LS
D (0.0
5)
1.0
1.1
ns,
no
n-s
ign
ifica
nt
(P[
0.0
5),
Rre
sist
ant,
Ssu
scep
tib
le,
MS
mo
der
atel
ysu
scep
tib
le
*,
**
,*
**
Sig
nifi
can
tat
PB
0.0
5,
PB
0.0
1an
dP
B0
.00
1,
resp
ecti
vel
y
356 Euphytica (2012) 185:349–362
123
The GCA effects were negative and highly significant
(P B 0.001) for CZL00009, CZL00001, MP82 and
MP59 across environments, indicating that they were
good general combiners for GLS disease resistance.
These same inbreds had resistant scores (Table 4) and
contributed to resistant hybrids and are therefore,
potential sources of resistance to GLS in breeding
programmes. Another potential source of resistance
was A1220-4 (Table 4). However, the line had a non-
significant negative GCA effect for GLS resistance,
but a significant positive GCA effect for grain yield.
This suggested that it contributed towards higher
yields in most of the hybrids.
The SCA estimates for the 45 F1 hybrids are
shown in Table 5. Across the environments, ten
hybrids had significant (P B 0.05), negative SCA
effects. Most of these hybrids were crosses between
parents with varying levels of disease resistance,
particularly resistant (R) 9 susceptible (S) lines,
especially those crossed to susceptible lines N3-2-3-
3, A16 and CML445. Some examples of these
hybrids include CZL00001 (R) 9 N3-2-3-3 (S);
CZL00009 (R) 9 N3-2-3-3 (S), MP82 (R) 9 N3-2-
3-3 (S), CZL00001 (R) 9 A16 (S), CZL00009
(R) 9 A16 (S), MP59 (R) 9 A16 (S), MP82
(R) 9 MP18 (S), CML445 (S) 9 CZL00001 (R),
CML445 (S) 9 CZL00009 (R). In general, the good
performance of the hybrids based on the SCA effects
corresponded to at least one of the parental lines
having a good GCA effect for disease resistance.
These results showed that susceptible parents could
be used in combination with resistant parents to
produce resistant hybrids. Therefore, the significant
SCA effects that were observed towards reduced
disease imply that non-additive gene effects can be
utilized in hybrid development. Similar results were
reported by Cromley et al. (2002) on temperate maize
germplasm and Menkir and Ayodele (2005) on some
tropical maize lines adapted to mid-altitude environ-
ments, between crosses of resistant and susceptible
parents. Therefore, breeders would select the other
parent based on some other criterion such as high
grain yield. For example, N3-2-3-3, which was
amongst the most susceptible parents to GLS, is
arguably the most productive inbred in eastern and
southern Africa. Therefore, inbreds with dominant
genes for the GLS disease resistance could be
combined with N3-2-3-3 to obtain highly productive
hybrids with acceptable levels of the GLS disease
resistance.
The positive GCA effects across environments for
the disease scores were observed for inbred lines
A16, CML445, CML488 and N3-2-3-3. These same
lines had high disease scores for the GLS disease
severity. The most susceptible hybrids were crosses
containing one of these parents; N3-2-3-3, A16,
CML445 and CML488. In addition, A16 had a
significant (P B 0.001), positive GCA effect for grain
yield (Table 4), implying that it can contribute to
high yields. This line (A16) was derived from
CML312 which, historically, has been amongst
CIMMYT’s most successful lines (CIMMYT 2001).
Table 5 Mean estimates of specific combining ability (SCA) effects (below diagonal) and mean disease severity scores (above
diagonal) for the GLS disease in six environments for the set of diallel crosses among ten maize inbred lines
A1220-4 A16 CML445 CML488 CZL00001 CZL00009 MP18 MP59 MP82 N3-2-3-3
A1220-4 3.5 2.6 3.2 1.1 1.0 2.3 1.7 1.6 5.6
A16 0.17 4.3 3.1 1.2 1.3 3.3 1.7 4.8 7.1
CML445 -0.47 0.23 3.7 1.0 1.1 3.3 2.6 3.3 6.2
CML488 0.09 -0.95*** -0.10 1.9 2.1 3.0 3.2 2.3 5.7
CZL00001 -0.03 -0.90*** -0.80** 0.10 1.2 1.3 1.0 1.6 2.1
CZL00009 -0.09 -0.80** -0.69* 0.29 1.34*** 1.3 1.3 1.3 1.8
MP18 -0.23 -0.11 0.16 -0.19 0.11 0.05 2.7 1.2 5.0
MP59 -0.32 -1.28*** -0.09 0.47 0.28 0.63* 0. 57 1.0 4.3
MP82 -0.27 1.94*** 0.71* -0.22 0.99*** 0.68* -0.80** -0.46 1.3
N3-2-3-3 1.15*** 1.69*** 1.05*** 0.53 -1.09*** -1.40*** 0.45 0.20 -2.58***
LSD(0.05) for the GLS mean disease severity scores = 0.54
*, **, *** Significant at P B 0.05, P B 0.01 and P B 0.001, respectively
Euphytica (2012) 185:349–362 357
123
The line CML312 is widely used by CIMMYT in
their breeding programmes as a tester. Dhliwayo
et al. (2009) also indicated that CIMMYT line
CML312 could contribute significantly to the breed-
ing programme of the International Institute of
Tropical Agriculture (IITA) based on the multi-
location evaluations of yield and CA they conducted.
Lines such as CML488 are amongst the most
promising CIMMYT lines in terms of their contribu-
tions to yield under drought stress conditions (CI-
MMYT 2001). Although these lines (A16, CML445,
N3-2-3-3 and CML488) can be crossed with resistant
lines to obtain resistant hybrids, it would also be a
good strategy to improve them for the GLS disease
resistance.
Impact of the GLS disease on maize grain yield
Yields of some selected maize hybrids (selected
based on high yield and anthesis days) and their
rankings based on the mean grain yields (t ha-1)
across the six environments are presented in Table 2.
Yields were relatively high in BF09, CED108,
CED09 and ZAMB08 environments, with the envi-
ronment means ranging from about 7.6–9.4 t ha-1
compared with CED208 (3.4 t ha-1) and RARS08
(6.8 t ha-1) (data not shown). Hybrids at the anthesis
stage between 67 and 74 days had the resistant inbred
line CZL00009 in common and yields ranging from
6.1 to 8.3 t ha-1. Some of the susceptible hybrids
(top 10 for the GLS disease severity susceptibility
ranking) such as N3-2-3-3 9 A16, A1220-4 9 N3-2-
3-3, CML445 9 N3-2-3-3, and N3-2-3-3 9 MP59
were apparently amongst the top 20 high yielding
hybrids (Table 2). All these hybrids had N3-2-3-3
inbred parent in common. This finding confirms the
contribution of N3-2-3-3 to high yields and should,
therefore, only be used in crosses with GLS disease
resistant lines in hybrid production or alternatively,
the GLS disease resistance be introduced in the line.
A simple regression analysis of the grain yield on
the GLS disease severity scores, was significant
(P B 0.001) for three environments (CED108,
CED09 and BF09; Table 6), with the exception of
CED208, RARS08 and ZAMB08. The slope of the
regression was negative (-0.26 to -0.32) in all the
three environments, indicating suppression of grain
yields of maize by 260–320 kg ha-1 per each
increase in GLS disease severity score. However,
the R2 values ranged from 22 to 36% implying that
the regression models in all the four environments
accounted for less than 36% of the total variation
through their linear relationship. This indicated that
the GLS disease severity was not the only factor
affecting grain yield in these environments, which
also supports the observation that some susceptible
hybrids were among the highest yielding in all the
environments. Significant and negative correlations
(-0.45 to -0.60, P \ 0.001) between grain yield
(t ha-1) and GLS scores were also observed in the
Table 6 Linear regression and Pearson’s correlation analysis of grain yield (t ha-1) on the GLS disease scores in three environments
that had significant regression models
Environment Regression parameters Regression equation Correlation
coefficient (r)b
Intercept
(a) ± se
Slope
(b) ± seaCoefficient of determination
(R2, %)
CED108 8.62 ± 0.82 -0.26 ± 0.06 25 Yield = 8.62 - 0.26GLS
severity score
-0.50***
CED09 10.60 ± 0.25 -0.32 ± 0.08 22 Yield = 10.60 - 0.32GLS
severity score
-0.45***
BF09 9.74 ± 0.23 -0.31 ± 0.05 36 Yield = 9.74 - 0.31GLS
severity score
-0.60***
CED108 Cedara November 2007 planting, CED09 Cedara November 2008 planting, BF09 Baynesfield December 2008 planting,
se standard error
*** Significant at P B 0.001a Linear regression model is given as y = a - bxb Pearson correlation coefficients for 45 hybrids
358 Euphytica (2012) 185:349–362
123
same environments (Table 6). This showed a moder-
ate to strong negative correlation between the GLS
disease severity scores and grain yield.
These results are in agreement with reports made by
other researchers on grain yield losses especially
during severe GLS disease epidemics. For example,
Ward et al. (1997a, b) in their studies on grain yield
loss potential of GLS on maize in South Africa
observed reductions of 41.7 to 43.3 kg ha-1 for each
1% increase in disease severity. However, in seasons
less conducive to the GLS disease development, Ward
et al. (1996) reported yield losses of around 38% (for
susceptible hybrids) and 20% (for moderately resistant
hybrids). In the current study, only three environments
had significant correlations and linear regression
models between the GLS disease severity scores and
grain yield, confirming the observation that the GLS
disease is less predictable in different seasons and
locations as it is highly dependent on favourable
weather conditions for disease development and
severity (Ward et al. 1999; Vivek et al. 2010). These
results also show the potential that the GLS disease
still has to suppress grain yields especially when
susceptible hybrids are grown under high disease
pressure and favourable weather conditions, stressing
the need for resistant germplasm.
Genotype 9 environment and screening sites
The response of the hybrids to the GLS disease
severity was different in the six environments as
depicted by the highly significant (Hybrid 9 Envi-
ronment) observed (Table 3). Means for the GLS
disease severity scores of the susceptible hybrid and
inbred line used as border rows at the different
environments ranged from 4.0 to 9.0 depending on
the environment.
However, although the environments appeared
different, there were significant (P B 0.001) and
positive Spearman’s rank order correlation coeffi-
cients for the GLS disease severity scores between
pairs of test environments (Table 7). This implied
that the reaction of the hybrids across the environ-
ments was consistently similar suggesting similar
ranking of the hybrids for the GLS disease resistance
in the different environments. Thus any of these
environments would be sufficient for selection of
the GLS disease resistant germplasm. This type of
interaction, which does not involve changes in
ranking, does not create any serious problems as
breeding for specific adaptation is not required. Other
researchers have reported similar interactions where
hybrid ranking remained the same and only the GLS
disease severity at the different locations and years
changed (Lipps 1998; Carson et al. 2002; Menkir and
Ayodele 2005; Derera et al. 2008; Vivek et al. 2010).
This implies that, in order to reduce costs in regional
breeding programmes, selection for GLS resistance
can be done at one reliable site and still deploy
resistant lines or hybrids to other environments in
which they are adapted.
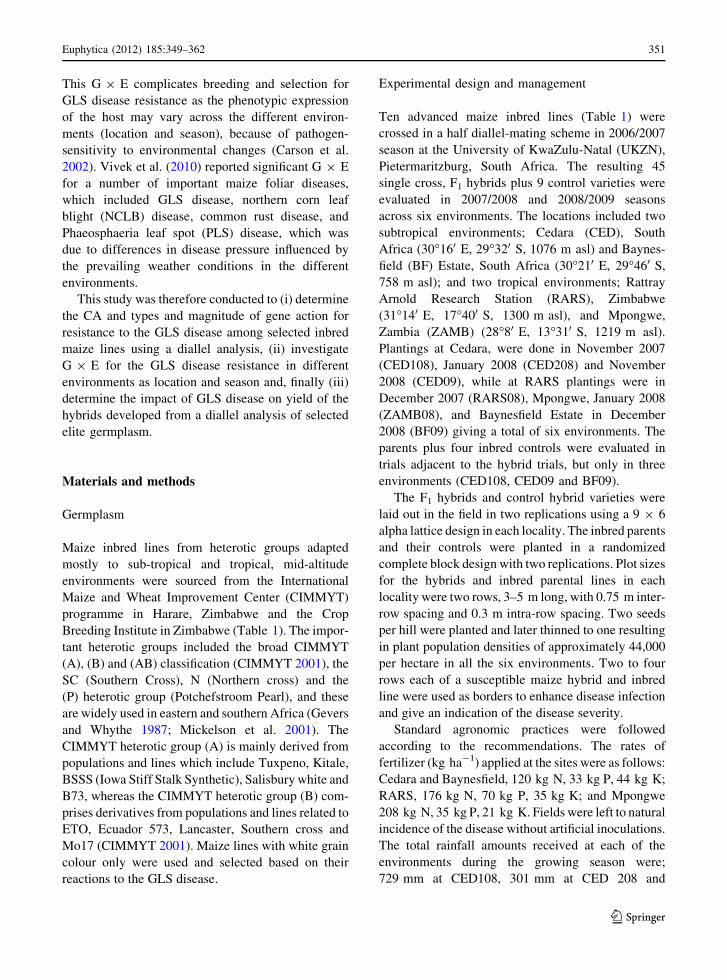
From the GGE biplots, the first two principal
components (PCs) explained 87.88% (PC1 =
81.80% and PC2 = 6.08%) of the total GGE variation
for GLS disease severity. Results of the polygon view
of the GGE biplot is presented in Fig. 1. This biplot
indicated the most susceptible hybrid(s) for each
environment and the groups of environments. The
Table 7 Spearman’s rank order correlation coefficients of the GLS disease scores between pairs of test environments
CED108 CED208 RARS08 ZAMB08 CED09 BF09
CED108 1
CED208 0.68*** 1
RARS08 0.61*** 0.65*** 1
ZAMB08 0.75*** 0.72*** 0.76*** 1
CED09 0.71*** 0.68*** 0.67*** 0.80*** 1
BF09 0.82*** 0.75*** 0.64*** 0.87*** 0.81*** 1
CED108 Cedara November 2007 planting, CED208 Cedara January 2008 planting, CED09 Cedara November 2008 planting, BF09Baynesfield December 2008 planting, RARS08 Rattray Arnold Research station December 2007 planting and ZAMB08 Mpongwe,
Zambia January 2008 planting
*** Significant at P B 0.001
Euphytica (2012) 185:349–362 359
123
rays of the biplot divided the plot into nine sections,
with the six environments all appearing in one sector.
According to Yan et al. (2007), when different
environments fall into different sectors, it implies that
they have different high yielding cultivars (susceptible
or resistant) for those sectors and it shows crossover
G 9 E, suggesting that the test environments could be
divided into mega-environments. However, in this
study, all the environments fell within one sector,
indicating one mega-environment and absence of
significant crossover interaction. The vertex families
for each quadrant represented the hybrids with the
highest mean disease severity score and for these
environments, the vertex hybrid was entry 37 (N3-2-3-
3 9 A16). The other hybrids were located within the
polygon and most of them near the plot origin.
According to Yan et al. (2000), genotypes within the
polygon, especially those located near the plot origin,
were less responsive than the vertex genotypes.
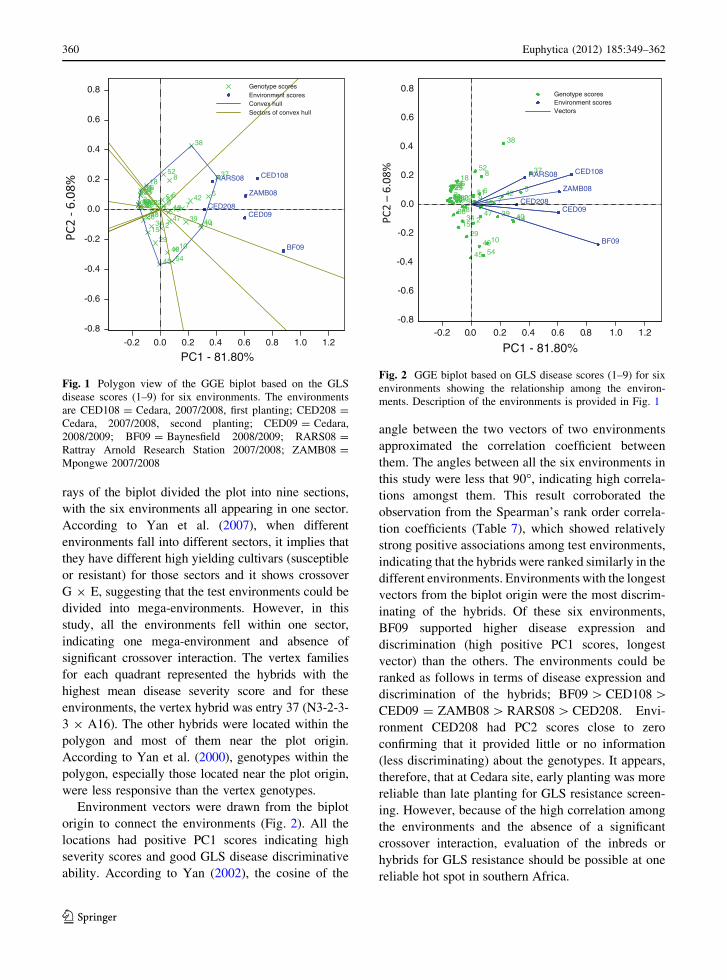
Environment vectors were drawn from the biplot
origin to connect the environments (Fig. 2). All the
locations had positive PC1 scores indicating high
severity scores and good GLS disease discriminative
ability. According to Yan (2002), the cosine of the
angle between the two vectors of two environments
approximated the correlation coefficient between
them. The angles between all the six environments in
this study were less that 90�, indicating high correla-
tions amongst them. This result corroborated the
observation from the Spearman’s rank order correla-
tion coefficients (Table 7), which showed relatively
strong positive associations among test environments,
indicating that the hybrids were ranked similarly in the
different environments. Environments with the longest
vectors from the biplot origin were the most discrim-
inating of the hybrids. Of these six environments,
BF09 supported higher disease expression and
discrimination (high positive PC1 scores, longest
vector) than the others. The environments could be
ranked as follows in terms of disease expression and
discrimination of the hybrids; BF09 [ CED108 [CED09 = ZAMB08 [ RARS08 [ CED208. Envi-
ronment CED208 had PC2 scores close to zero
confirming that it provided little or no information
(less discriminating) about the genotypes. It appears,
therefore, that at Cedara site, early planting was more
reliable than late planting for GLS resistance screen-
ing. However, because of the high correlation among
the environments and the absence of a significant
crossover interaction, evaluation of the inbreds or
hybrids for GLS resistance should be possible at one
reliable hot spot in southern Africa.
54
52
2526
327
5
29
730 93112
32
14
3316
34
18
36
21
37
23
38
239
6
40
10
42
15
4319
44
24
45
8
4717
413 22
48
49
51
CED108
CED09
BF09
RARS08
CED208
ZAMB08
-0.8
0.0
-0.6
0.4
-0.4
0.8
-0.2
1.2
0.0
0.2
0.4
0.6
0.8
0.2 1.00.6-0.2
PC1 - 81.80%
Genotype scoresEnvironment scoresConvex hullSectors of convex hull
Fig. 1 Polygon view of the GGE biplot based on the GLS
disease scores (1–9) for six environments. The environments
are CED108 = Cedara, 2007/2008, first planting; CED208 =
Cedara, 2007/2008, second planting; CED09 = Cedara,
2008/2009; BF09 = Baynesfield 2008/2009; RARS08 =
Rattray Arnold Research Station 2007/2008; ZAMB08 =
Mpongwe 2007/2008
54
52
51
49
48 47
45
444342
4039
38
37
3634
33
32
3130
29
27
262524
232221
19
18
17 16
1514
1312
10
9
8
76 5
43
2
ZAMB08
CED208CED09
CED108RARS08
BF09
-0.2 0.2 0.6 1.0-0.8
-0.6
-0.4
-0.2
0.4
0.0
1.2
0.2
8.00.0
0.8
0.4
0.6
PC1 - 81.80%
Genotype scoresEnvironment scoresVectors
Fig. 2 GGE biplot based on GLS disease scores (1–9) for six
environments showing the relationship among the environ-
ments. Description of the environments is provided in Fig. 1
360 Euphytica (2012) 185:349–362
123
Conclusion
The most resistant inbred lines CZL00009, CZL00001,
MP82, and MP59 displayed good GCA for the GLS
disease resistance and contributed negative SCA effects
in their respective crosses. Both additive and non-
additive effects conditioned GLS disease resistance and
grain yield in the inbred lines, but the additive effects
were more predominant than the non-additive. Predom-
inance of additive effects suggests that GLS disease
resistance could be enhanced by selection in some of the
populations. This study also revealed that the use of one
parent with resistance would provide adequate GLS
disease resistance in single cross hybrids. Therefore,
non-additive effects towards reduced disease severity
levels may be exploited in developing single cross
hybrids for deployment to environments that are highly
conducive to the GLS disease. The results also showed
the potential that the GLS disease still has in suppressing
grain yield, under high disease pressure, emphasizing
the need for resistant varieties to be grown in the region.
Although G 9 E was observed for the GLS disease, all
the six environments fell within the same quadrant of the
polygon view, implying that the environments were
similar in terms of the GLS disease discriminative
ability and were highly correlated suggesting absence of
the crossover G 9 E; therefore selection for GLS
resistance in the region can be done in one hot spot
area to reduce costs for regional breeding programmes.
The recommended sites from this study would be
Baynesfied and Cedara (normal growing season) as they
provided the highest GLS disease discriminative ability.
Acknowledgments The researchers would like to thank the
Rockefeller Foundation, New York for funding this work
through the African Centre for Crop Improvement (ACCI) in
South Africa. We are grateful to the International Maize and
Wheat Improvement Centre (CIMMYT), Zimbabwe for
providing germplasm, and the assistance of Dr Cosmos
Magorokosho in generating some of the crosses in Harare.
We also express our appreciation to the staff from the Crop
Protection unit, Cedara, South Africa; Mr Walter Chivasa
(SeedCo, Rattray Arnold Research Station, Zimbabwe); Mr
Herbert Masole (SeedCo, Mpongwe, Zambia) and the ACCI
support staff for the assistance in running the trials.
References
Bhatia A, Munkvold GP (2002) Relationships of environmental
and cultural factors with severity of grey leaf spot in
maize. Plant Dis 86:1127–1133
Bookmyer JM, Bonos SA, Meyer WA (2009) Inheritance
characteristics of brown patch resistance in tall fescue.
Crop Sci 49:2302–2308
Carson ML, Goodman MM, Williamson SM (2002) Variation
in aggressiveness among isolates of Cercospora from
maize as a potential cause of genotype-environment
interaction in gray leaf spot trials. Plant Dis 86:1089–1093
CIMMYT (1985) Managing trials and reporting data for CI-
MMYT International Maize Testing Program. CIMMYT,
Mexico
CIMMYT (2001) Maize inbred lines released by CIMMYT: a
compilation of 454 CIMMYT maize lines (CMLs),
CML1–CML454. August 2001. Second Draft. CIMMYT,
Mexico
Cisar G, Brown CM, Jedlinski H (1982) Diallel analyses for
tolerance in winter wheat to the barley yellow dwarf virus.
Crop Sci 22:328–333
Coates ST, White DG (1998) Inheritance of resistance to gray
leaf spot in crosses involving selected resistant inbred
lines of corn. Phytopathology 88:972–982
Cromley JMD, Hallauer AR, Martinson CA (2002) Inheritance
of gray leaf spot resistance in corn. J Iowa Acad Sci
109:25–29
Crous PW, Groenewald JZ, Groenewald M, Caldwell P, Braun
U, Harrington TC (2006) Species of Cercospora associ-
ated with grey leaf spot of maize. Stud Mycol 55:189–197
de Nazareno NRX, Lipps PE, Madden LV (1993) Effects of
levels of corn residue on epidemiology of grey leaf spot of
corn in Ohio. Plant Dis 77:67–70
Derera J (2005) Genetic effects and associations between grain
yield potential, stress tolerance and yield stability in
southern African maize (Zea mays L.) base germplasm.
PhD Thesis, University of KwaZulu-Natal
Derera J, Tongoona P, Pixley KV, Vivek B, Laing MD, van Rij
NC (2008) Gene action controlling gray leaf spot resis-
tance in southern African maize germplasm. Crop Sci
48:93–98
Dhliwayo T, Pixley K, Menkir A, Warburton M (2009)
Combining ability, genetic distances, and heterosis among
elite CIMMYT and IITA tropical maize inbred lines. Crop
Sci 49:1201–1210
Donahue PJ, Stromberg EL, Myers SL (1991) Inheritance of
reaction to gray leaf spot in a diallel cross of 14 maize
inbreds. Crop Sci 31:926–931
Dunkle LD, Levy M (2000) Genetic relatedness of African and
United States populations of Cercospora zeae-maydis.
Phytopathology 90:486–490
Egesi CN, Onyeka TJ, Asiedu R (2009) Environmental sta-
bility of resistance to anthracnose and virus diseases of
water yam (Dioscorea alata). Afr J Agric Res 4:113–118
Elwinger GF, Johnson MW, Hill RR Jr, Ayers JE (1990)
Inheritance of resistance to gray leaf spot of corn. Crop
Sci 30:350–358
Fairbanks DHK, Benn GA (2000) Identifying regional land-
scapes for conservation planning: a case study from
KwaZulu-Natal, South Africa. Landscape Urban Plan
50:237–257
FAO and CIMMYT (1997) White maize: a traditional food grain
in developing countries. Food and Agriculture website.
http://www.fao.org/docrep/W2698E/w2698e00.htm.
Accessed 10 Oct 2010
Euphytica (2012) 185:349–362 361
123
Gevers HO, Whythe IV (1987) Patterns of heterosis in South
African maize breeding material. In: Fourie AP, Du
Plessis JG (eds) Proceedings of the seventh South African
maize breeding symposium. Summer Grain Centre, Grain
Crops Research Institute, Potchefstroom, South Africa,
pp 21–26
Gevers HO, Lake JK, Hohls T (1994) Diallel cross analysis
of resistance to gray leaf spot in maize. Plant Dis
78:379–383
Gordon SG, Lipps PE, Pratt RC (2006) Heritability and com-
ponents of resistance to Cercospora zeae-maydis derived
from maize inbred VO613Y. Phytopathology 96:593–598
Hohls T, Shanahan PE, Clarke GPY, Gevers HO (1995)
Genetic analyses of grey leaf spot infection of maize in a
single location 12 9 12 diallel. S Afr J Plant Soil
12:133–139
Huff CA, Ayers JE, Hill RR Jr (1988) Inheritance of resistance
in corn (Zea mays) to gray leaf spot. Phytopathology
78:790–794
Kasuga S, Inoue N (2001) Diallel analysis of the resistance to
sheath blight (Rhizoctonia solani Kuhn) in sorghum.
Grassland Sci 47:45–49
Latterell FM, Rossi AE (1983) Gray leaf spot of maize: a
disease on the move. Plant Dis 67:842–847
Levy Y, Pataky JK (1992) Epidemiology of northern leaf blight
on sweet corn. Phytoparasitica 20:53–66
Lipps PE (1998) Gray leaf spot: a global threat to corn production.
APSnet Features. Online. doi:10.1094/APSnetFeature-1998-
0598. http://www.apsnet.org/publications/apsnetfeatures/
Pages/GrayLeafSpot.aspx. Accessed 18 Oct 2009
Meisel B, Korsman J, Kloppers FJ, Berger DK (2009) Cer-cospora zeina is the causal agent of grey leaf spot disease
of maize in southern Africa. Eur J Plant Pathol
124:577–583
Menkir A, Ayodele M (2005) Genetic analysis of resistance to
gray leaf spot of mid-altitude maize inbred lines. Crop Sci
45:163–170
Mickelson HR, Cordova H, Pixley KV, Bjarnason MS (2001)
Heterotic relationships among nine temperate and sub-
tropical maize populations. Crop Sci 41:1012–1020
Munkvold GP, Martinson CA, Shriver JM, Dixon PM (2001)
Probabilities for profitable fungicide use against gray leaf
spot in hybrid maize. Phytopathology 91:477–484
Payne RW, Murray DA, Harding SA, Baird DB, Soutar DM
(2010) GenStat for Windows (12th edition) introduction.
VSN International, Hemel Hempstead
Rupe JC, Siegel MR, Hartman JR (1982) Influence of envi-
ronment and plant maturity on gray leaf spot of corn
caused by Cercospora zeae-maydis. Phytopathology
72:1587–1591
SAS Institute Inc (2002) The SAS system for Windows, release
9.3. SAS Institute Inc., Cary
Thompson DL, Bergquist RR, Payne GA, Bowman DT,
Goodman MM (1987) Inheritance of resistance to gray
leaf spot in maize. Crop Sci 27:243–246
Ulrich JF, Hawk JA, Carroll RB (1990) Diallel analysis of
maize inbreds for resistance to gray leaf spot. Crop Sci
30:1198–1200
Vivek BS, Odongo O, Njuguna J, Imanywoha J, Bigirwa G,
Diallo A, Pixley K (2010) Diallel analysis of grain yield
and resistance to seven diseases of 12 African maize (Zeamays L.) inbred lines. Euphytica 172:329–340
Ward JMJ, Hohls T, Laing MD, Rijkenberg FHJ (1996) Fun-
gicide responses of maize hybrids and grey leaf spot. Eur J
Plant Pathol 102:765–771
Ward JMJ, Laing MD, Nowell DC (1997a) Chemical control of
maize grey leaf spot. Crop Prot 16:265–271
Ward JMJ, Laing MD, Rijkenberg FHJ (1997b) Frequency and
timing of fungicide applications for the control of grey
leaf spot in maize. Plant Dis 81:41–48
Ward JMJ, Stromberg EL, Nowell DC, Nutter FW Jr (1999)
Gray leaf spot: a disease of global importance in maize
production. Plant Dis 83:884–895
Yan W (2002) Singular-value partitioning in biplot analysis of
multienvironmental trial data. Agron J 94:990–996
Yan W, Hunt LA, Sheng Q, Szlavnics Z (2000) Cultivar
evaluation and mega-environment investigation based on
the GGE Biplot. Crop Sci 40:597–605
Yan W, Kang BM, Woods S, Cornelius PL (2007) GGE biplot
vs. AMMI analysis of genotype-by-genotype environment
data. Crop Sci 47:643–655
Zhang Y, Kang MS (1997) DIALLEL-SAS: a SAS program for
Griffing’s diallel analyses. Agron J 89:176–182
Zhang Y, Kang MS, Lamkey KR (2005) Diallel-SAS05: a
comprehensive program for Griffing’s and Gardner-
Eberhart analyses. Agron J 97:1097–1106
362 Euphytica (2012) 185:349–362
123