Copyright 0 1985 by the Genetics Society of America GENETIC ANALYSIS OF SIZE-SCALING PATTERNS IN THE MOUSE MANDIBLE WILLIAM R. ATCHLEY, A. ALISON PLUMMER AND BRUCE RISKA Laboratory of Genetics, University of Wisconsin, Madison, Wisconsin 53706 Manuscript received March 1 1, 1985 Revised copy accepted July 1, 1985 ABSTRACT The relationship between multidimensional form of the adult mouse man- dible and body size is examined from an ontogenetic perspective. The origin and ontogeny of phenotypic correlations are described in terms of genetic and environmental covariance patterns between adult skeletal morphology and growth in body weight. Different ontogenetic patterns are observed in the genetic correlations, and these can be related to the developmental as well as the functional aspects of mandibular form. The quantitative genetic aspects of craniomandibular growth and morphogenesis are explored, together with an examination of the impact of ontogenetic changes in the genetic variance- covariance structure on morphogenetic integration and evolution by selection. OMPLEX skeletal structures, such as the mammalian cranium and man- c dible, are composed of parts that have different embryological origins, are affected by different causal agents, and exhibit different rates of develop- ment (ATCHLEY, PLUMMER and RISKA 1985). In spite of this morphogenetic diversity, growth trajectories of the various parts must be cohesively integrated during ontogeny to produce harmoniously functioning morphological struc- tures. Although such morphogenetic integration is important and widespread in development, the actual mechanisms contributing to it are not well under- stood. As a result, many important problems remain to be resolved, including (1) coordination of growth trajectories, (2) interactions among controlling fac- tors and (3) how selection on both age-specific traits and developmental rates affects coordinated growth patterns. One aspect of the coordination of growth trajectories is the scaling relation- ship between skeletal dimensions and body size. Variability in skeletal struc- tures, soft body tissues and physiological processes is often dependent on body size or, at least, is highly correlated with it (ATCHLEY and RUTLEDCE 1980; ATCHLEY 1983, 1984; ATCHLEY et al. 1984; PETERS 1983; SCHMIDT-NIELSON 1984; CALDER 1984). Empirical descriptions of the morphological or physio- logical consequences of variability in body size are available from the literature on allometric growth. Unfortunately, the developmental and genetic bases of these scaling relationships are not well understood, and only recently have realistic models been proposed to explain the underlying processes (e.g., LANDE Genetics 111: 579-595 November, 1985
Transcript
Copyright 0 1985 by the Genetics Society of America
GENETIC ANALYSIS OF SIZE-SCALING PATTERNS IN THE MOUSE MANDIBLE
WILLIAM R. ATCHLEY, A. ALISON PLUMMER AND BRUCE RISKA
Laboratory of Genetics, University of Wisconsin, Madison, Wisconsin 53706
Manuscript received March 1 1 , 1985 Revised copy accepted July 1 , 1985
ABSTRACT
The relationship between multidimensional form of the adult mouse man- dible and body size is examined from an ontogenetic perspective. The origin and ontogeny of phenotypic correlations are described in terms of genetic and environmental covariance patterns between adult skeletal morphology and growth in body weight. Different ontogenetic patterns are observed in the genetic correlations, and these can be related to the developmental as well as the functional aspects of mandibular form. The quantitative genetic aspects of craniomandibular growth and morphogenesis are explored, together with an examination of the impact of ontogenetic changes in the genetic variance- covariance structure on morphogenetic integration and evolution by selection.
OMPLEX skeletal structures, such as the mammalian cranium and man- c dible, are composed of parts that have different embryological origins, are affected by different causal agents, and exhibit different rates of develop- ment (ATCHLEY, PLUMMER and RISKA 1985). In spite of this morphogenetic diversity, growth trajectories of the various parts must be cohesively integrated during ontogeny to produce harmoniously functioning morphological struc- tures. Although such morphogenetic integration is important and widespread in development, the actual mechanisms contributing to it are not well under- stood. As a result, many important problems remain to be resolved, including (1) coordination of growth trajectories, (2) interactions among controlling fac- tors and (3) how selection on both age-specific traits and developmental rates affects coordinated growth patterns.
One aspect of the coordination of growth trajectories is the scaling relation- ship between skeletal dimensions and body size. Variability in skeletal struc- tures, soft body tissues and physiological processes is often dependent on body size or, at least, is highly correlated with it (ATCHLEY and RUTLEDCE 1980; ATCHLEY 1983, 1984; ATCHLEY et al. 1984; PETERS 1983; SCHMIDT-NIELSON 1984; CALDER 1984). Empirical descriptions of the morphological or physio- logical consequences of variability in body size are available from the literature on allometric growth. Unfortunately, the developmental and genetic bases of these scaling relationships are not well understood, and only recently have realistic models been proposed to explain the underlying processes (e.g., LANDE
Genetics 111: 579-595 November, 1985
580 W. R. ATCHLEY, A. A. PLUMMER AND B. RISKA
1979; ATCHLEY, RUTLEDGE and COWLEY 1981; ATCHLEY et al. 1984; CHEV- ERUD, RUTLEDCE and ATCHLEY 1983; RISKA, ATCHLEY and RUTLEDCE 1984; RISKA and ATCHLEY 1985).
The mammalian mandible is an excellent structure in which to study the genetic and developmental aspects of body-size scaling. The mandible appears to be a single skeletal entity of simple origin, but in actuality is a develop- mentally complex structure, the phenotypic variability of which stems from the activities of a number of intrinsic and extrinsic factors. Growth patterns involve both intramembranous and endochrondral ossification, as well as surface re- modeling (HALL 1978, 1982a,b; MOORE 198 1).
In addition to heterogeneity in embryological origin and ossification patterns within the mandible itself, the facial region, in general, continues to grow after the braincase growth has stopped (MOORE and LAVELLE 1974; MOORE 1981). As a result, the skull becomes more and more prolonged during postnatal growth. Thus, one might hypothesize that developmental variability in the mandible would reflect both the basicranial and facial patterns of growth be- cause the mandible articulates with the basal portion of the skull, has masti- catory structures common with the facial region and exhibits continuous incisor growth.
The quantitative genetic consequences of heterogeneity in embryonic origin and growth patterns on the form of the adult mandible are unknown. To explore the problem, we have dissected phenotypic correlations between man- dible traits and body weight and rate of development in body weight into their underlying genetic and nongenetic components. Mandible traits are available for 70-day-old mice, while body weight and weight gain are available at weekly intervals between 14 and 70 days of age. Hence, we can inquire about how body weight and rate of development influence adult mandible form. In this paper, we deal with four questions: (1) What are the causal factors underlying scaling relationships between mandibular form and body weight in adult ran- dombred mice? (2) Is the heterogeneous embryological origin of various parts of the mandible reflected by different scaling relationships with body weight? (3) Do scaling relationships observed between mandible dimensions and body weight in adults persist between adult mandible dimensions and body weight much earlier in ontogeny? (4) Do parts of the mandible exhibit distinct scaling patterns during ontogeny that can be associated with the basicranial and facial portions of the skull?
MATERIALS AND METHODS
The ICK randombred mice used in these analyses are derived from the more extensive exper- iment described in the accompanying paper (ATCHLEY, PLUMMER and RISKA 1985); therefore, only a brief outline of the methods and materials used will be given here. The mice were randomly pair-mated, and litters were standardized at birth to eight pups, usually four males and four females. A random half of each litter was cross-fostered between unrelated dams which had pupped on the same day. Pups were weaned at 21 days and were then maintained in single-sex cages each containing less than five mice, as well as unliniited food and water. A total of 5 10 families of mice consisting of 1803 individuals are included in these analyses.
Body weight was recorded at weekly intervals, beginning at 2 wk of age and continuing until
GENETICS OF SIZE-SCALING 58 1
4 2
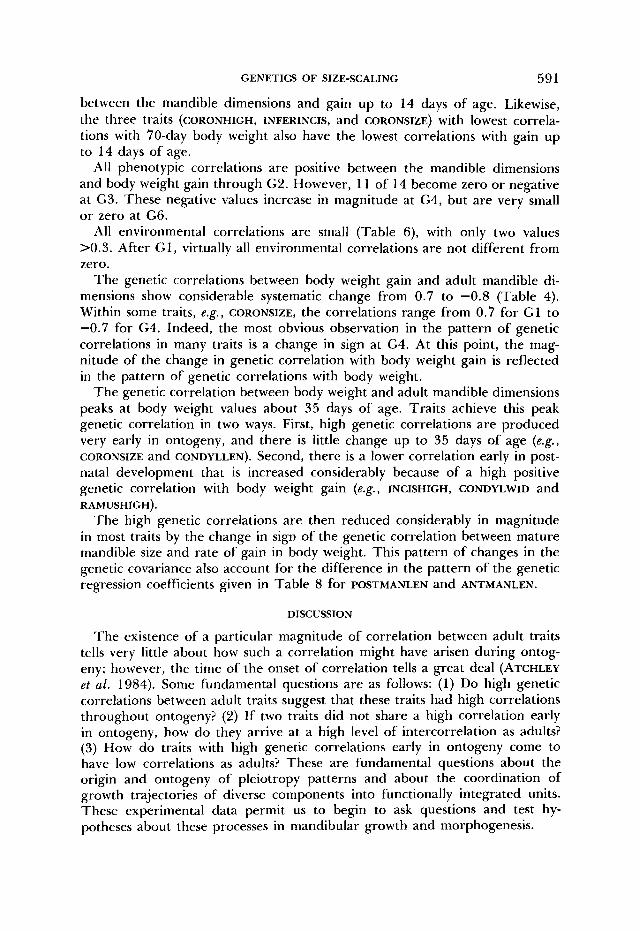
FIGURE 1 .-Outline of the mature niouse mandible denoting the position of morphological landmarks used to describe the traits presented in Table 1 .
TABLE 1
Mandible traits included in these analyses, together with a short descriptive code
1 . 2. 3 . 4. 5. 6.
7. 8.
9.
10.
1 1 .
12.
13.
14.
Posterior mandible length (P0STMANLEN)-Euclidean distance from 1-4 Anterior mandible length (ANTMANLEN)-Euclidean distance from 4-6 Height at mandibular notch (NOTCHHIGH)-Euc~idean distance from 3- 14 Height at incisor region (INCIsHIGH)-Euclidean distance from 5-8 Concavity (coNcAvrry)-Vertical distance from 3 to a line computed from 2-4 Height of ascending ramus (RAMUSHIGH)-VertiCal distance from 2 to a horizontal line
Condyloid width (coNDYLw1D)-Euclidean distance from 15- 18 Condyloid length (C0NDYLLEN)-Euclidean distance from the midpoint of a h e from
Coronoid height (CORONHIGH)-VertiCd distance (perpendicular to 2-4 line) from 12-
Coronoid area (coRoNs1zE)-Area defined by the triangle ( 1 1, 12, 14) minus the area
Angular process length (ANGuLARLEN)-Euclidean distance of a line segment from the
Tooth bearing area (TOOTHAREA)-ArCa of a polygon defined by points (3, 4, 5, 6, 7,
Superior incisive process curve (SUPERINCIS)-Shortest distance to 8 from a line from
Inferior incisive process curve (lNFERINCIS)-ShOrteSt distance to 5 from a line from 4-
at 16 parallel to the line computed from 2-4
16-17 to the midpoint of a line from 14-19
14
of (12, 13, 14)
midpoint of 1-2 to the midpoint 3-19
8, 9, 1 1 )
4-6
6 ~~
Figure 1 explains the origin of these measurements.
the mice were 10 wk old. Mice were sacrificed at 10 wk of age, enviscerated, skinned and defleshed by dermestid beetles. T h e mandibles were then measured by projecting the image of the dentary onto a microcomputer-driven digitizer, and the data from 19 landmark points were recorded in x-y space (ATCHLEY, PLUMMER and RISKA 1985). From these 19 landmarks, 14 traits were obtained (Figure 1 ) which, with a short code, are described in Table 1.
All data were transformed to natural logarithms and were analyzed by analysis of variance and
582 W. R. ATCHLEY, A. A. PLUMMER AND B. RISKA
covariawe. The resulting variance compounds were equated with genetic expectations following ATCHLEY et al. (1984). The variance and covariance components of body weight and weight gain are described in detail by RISKA, ATCHLEY and RUTLEDCE (1984), while the variance and covari- ance components for the mandible traits are described by ATCHLEY, PLUMMER and RISKA (1985).
Body weight is equated to body size in these analyses. The relationship between adult mandible dimensions and body weight and body weight gain were determined by estimating the components of phenotypic covariance between log transformed data for the mandibular traits and body weight and weight gain over six postnatal intervals: GI = gain up to 14 days (including prenatal weight gain), G2 = between 14 and 21 days, G3 = between 21 and 28 days, G4 = between 28 and 35 days, G5 = 35 to 42 days, and G6 = 42 to 70 days. Body weight gain is determined as the difference between natural logs of weights in the respective intervals. Therefore, we are dealing with proportional gain, rather than absolute gain. As pointed out by RISKA, ATCHLEY and RUTLEDGE (1984), body weight at 14 days of age is equivalent to body weight gain up to 14 days of age. Although identical, both values are included in the tables to assist the reader.
RISKA, ATCHLEY and RUTLEDCE (1984) indicate that after an early exponential growth phase, the growth curves for body weight in these mice pass through inflection points for Gompertz growth curves at 22 and 20 days for males and females, respectively. By 42 days of age, growth has begun to level off in a linear phase that persists to the end of the experiment.
Although we have data on the mandibles of the parents, data on their body weight were not available. As a result, the covariances of the mandible traits with body weight are estimated using only the covariances between crossfostered and noncrossfostered full-sibs, rather than the more extensive model described in ATCHLEY et al. (1985). Therefore, the model for decomposition of the phenotypic covariance between the ith mandible trait (Y,) and body weight (XW) or body weight gain (Xc) is
~ ( X V P ~(xw + fl(w + ~ ( X O R R E
where q x n p = phenotypic covariance; U(XV)C = genetic covariance, including all of the additive and one-half of the dominance effects; u ( 0 ~ = postnatal maternal covariance, including preweaning cage effects; and qwfifi = residual environmental covariance after postnatal maternal effects are removed. Genetic covariance was estimated as twice the covariance component for genetic mother; postnatal maternal covariance was equated with the component for postnatal mother; and residual environmental covariance was estimated as the residual, after subtracting the component for ge- netic mother from the pooled interaction and residual within-cell components.
The mandible is a structure exhibiting high intercorrelations among some of its component parts. T o resolve the intercorrelations into patterns of morphogenetic variability, the phenotypic mandible data are analyzed by Varimax-rotated principal components analyses, and a series of principal component scores are produced that position each mouse along an axis of multivariate variability (ATCHLEY, PLUMMER and RISKA 1985). The principal component scores are then treated as typical univariate traits, and their variability is decomposed into genetic and residual environ- mental fractions. The components of the phenotypic correlation are computed between the Vari- max-rotated phenotypic principal components scores and body weight and weight gain.
RESULTS
This section is divided into three main parts to reflect the questions posed in the introductory section of this paper. These parts include (1) results relating to the underlying components of the scaling relationships between adult man- dible dimensions and adult body weight, (2) the casual components underlying correlations between adult mandible dimensions and body weight during on- togeny and (3) the relationships between mandible dimensions and rate of gain in body weight.
GENETICS OF SIZE-SCALING 583 TABLE 2
Phenotypic correlations of adult mandible dimensions with body weight and with body weight gain at various postnatal intervals
~ ~~
Days Postnatal intervals
Trait 14 21 28 35 42 70 GI G2 G3 G4 G5 G6
POSTMANLEN
ANTMANLEN
NOTCHHIGH
INCISHIGH
CONCAVITY
RAMUSHIGH
CONDYLWID
CONDYLLEN
CORONHIGH
CORONSIZE
ANGULARLEN
TOOTHAREA
SUPERINCIS
INFERINCIS
43
30
34
12
4
35
10
18
2 16
25
47
11
3
Body weight
46 50 52 50 41
34 36 39 43 39
36 41 41 41 34
12 17 26 31 30
10 11 16 21 21
37 41 43 45 42
12 13 14 15 1 1
17 17 17 16 16
5 6 6 8 3
20 23 23 24 18
30 33 38 40 38
51 54 58 60 51
14 15 16 18 17
5 5 9 9 7
Body weight gain
43 15 -9 -33 -22
30 13 -9 -21 -9
34 10 -2 -29 -16
12 3 7 -2 -2
4 12 -1 -3 3
35 13 -6 -27 -12
10 6 -2 -9 -4
18 3 -6 -13 -9
2 7 1 -4 0
16 11 -1 -17 -6
25 15 -4 -18 -10
47 17 -12 -32 -19
11 9 -5 -8 -3
3 3 0 2 -4
-9
-1
-7 2
2
-1
-5
2
-8
-8
2
-8
0
-1
GI = gain up to 14 days, G2 = gain between 14 and 21 days, G3 = gain between 21 and 28 days, G4 = gain between 28 and 35 days, G5 = gain between 35 and 42 days and G6 = gain between 42 and 70 days of age. Decimal points have been removed, and standard errors are approximately 3 for all estimates.
Adult mandible dimensions and adult body weight
Phenotypic correlations: Generally speaking, the phenotypic correlations with 70-day body weight (Table 2) are low, ranging from 0.03 for CORONHIGH to 0.51 for TOOTHAREA. The geometric mean of the 14 correlations is only 0.21. Although many phenotypic correlations are significant in a statistical sense due to very large sample sizes, the biological importance of very small correlations can be debated.
The largest phenotypic correlations with adult body weight are found for the major dimensions of the mandible, i.e., TOOTHAREA, POSTMANLEN, ANT- MANLEN, RAMUSHIGH and ANGULARLEN. Correlations of 0.2 or less are found for CORONHIGH, CORONSIZE, CONDYLWID, CONDYLLEN, INFERINCIS, SUPERINCIS
and CONCAVITY. The first four of these traits are strongly affected by biome- chanical factors during prenatal and early postnatal development (ATCHLEY, PLUMMER and RISKA 1985). Therefore, it is not unexpected that these latter traits are lowly correlated with adult body weight. We have shown elsewhere that the correlation between growth up to 14 days of age is lowly correlated with later growth (RISKA, ATCHLEY and RUTLEDGE 1984). Further, there is
584 W . R. ATCHLEY, A. A. PLUMMER AND B. RISKA
T A B L E 3
Phenotypic correlatzons between the scores from a Varimax-rotated principal components analysis of 14 mandible traits and ( I ) the log of body weight at various
ages (in days), and (2) the gain in body weight between various ages
Days Postnatal intervals
Trait 14 21 28 35 42 70 Cl G2 G3 G4 G5 G6
Body weight Body weight gain
P, 32 36 40 48 53 50 32 15 -6 -19 - 1 1 1
Pp 18 20 24 22 22 14 18 9 0 -19 -8 -12
P3 5 6 6 5 6 5 5 4 -2 -6 - 1 0
P4 26 28 29 27 25 22 26 8 -8 -23 -13 -3 ~~~~~~~~-
Decimal points have been removed and all standard errors are approximately three G1 = gain up to 14 days, G2 = gain between 14 and 21 days, G3 = gain between 21 and 28 days, G4 = gain between 28 and 35 days, G5 = gain between 35 and 42 days and G6 = gain between 42 and 70 days of age
little reason to believe that the curvature of the incisor (INFERINCIS and SUPER- INCIS) should be correlated with adult body weight.
The Varimax-rotated principal components analysis of these 14 traits gave a phenotypic solution with four vectors (ATCHLEY, PLUMMER and RISKA 1985). The first rotated vector has largest coefficients for TOOTHAREA, ANTMANLEN,
INCISHIGH, CONCAVITY, ANGULARLEN and RAMUSHIGH. These traits reflect measures of the height of the mandible, particularly at the distal or corpus end. The second rotated vector has largest coefficients for CORONSIZE, CORON- HIGH and NOTCHHIGH, traits reflecting the height and area of the middle portion of the mandible between the posterior end of the mandibular tooth row and the mandibular notch. The third rotated vector has large coefficients for SUPERINCIS and INFERINCIS, a pattern of variability reflecting the curvature of the distal portion of the mandible ( i . e . , the curvature of the incisor). The fact that these coefficients are of opposite sign may stem from correlated measurement error. The fourth rotated vector reflects variability in the ramus, and CONDYLLEN, RAMUSHIGH, CONDYLWID and POSTMANLEN contribute the most to this pattern of variability.
Phenotypic correlations between these principal component scores and adult body weight range from 0.5 for the first vector to 0.05 for the third vector (Table 3).
Genetic correlations: Genetic correlations significantly different from zero are found between adult body weight and ANTMANLEN, INCISHIGH, TOOTHAREA, CONDYLLEN, RAMUSHIGH, NOTCHHIGH and CORONSIZE (Table 4). With the ex- ception of CORONSIZE, these are traits associated with the body of the mandible. In all of these traits, except for CORONSIZE, growth occurs by typical bone growth and ossification, rather than by biomechanical stimulation arising from muscle activity.
'The Varimax-rotated principal components solution for the genetic corre- lations produced four vectors. The first rotated vector reflects genetic covar-
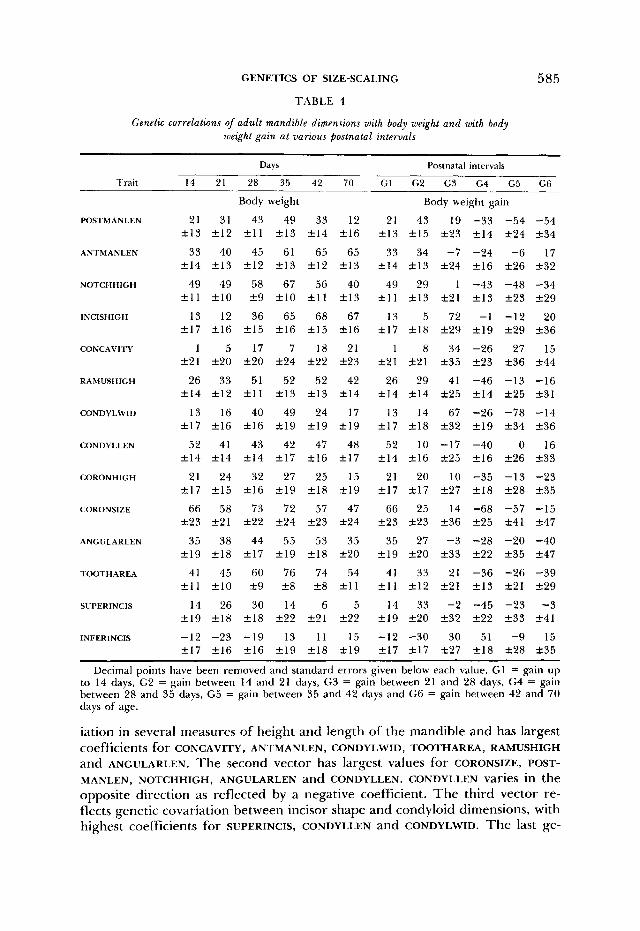
GENETICS OF SIZE-SCALING 585 TABLE 4
Genetic correlations of adult mandible dimensions with body weight and with body weight gain at various postnatal intervals
Trait
POSTMANLEN
ANTMANLEN
NOTCHHIGH
INCISHIGH
CONCAVITY
RAMUSHIGH
CONDYLWID
CONDYLLEN
CORONHIGH
CORONSIZE
ANGULARLEN
TOOTH AREA
SUPERINCIS
INFERINCIS
Days
14 21 28 35 42 70 G1
Body weight
21 31 43 49 33 12 21 f 1 3 +12 + 1 1 +13 f 1 4 +16 f 1 3
33 40 45 61 65 65 33 f 1 4 f 1 3 +12 +13 f 1 2 +13 + I 4
49 49 58 67 56 40 49 +11 f 1 0 +9 210 f l l f 1 3 +11
13 12 36 65 68 67 13 +I7 + I 6 +15 + I 6 + I 5 +16 217
1 5 17 7 18 21 1 +21 +20 f 2 0 +24 +22 +23 f 2 1
26 33 51 52 52 42 26 + I 4 f 1 2 f l l +13 +13 +14 f 1 4
13 16 40 49 24 17 13 +17 +16 +16 k19 f 1 9 f 1 9 +17
35 38 44 55 53 35 35 +19 f 1 8 +17 +19 + I 8 +20 +19
41 45 60 76 74 54 41 +11 f 1 0 29 2 8 +8 f l l + I 1
14 26 30 14 6 5 14 +19 + I 8 + I 8 k22 +21 +22 + I 9
-12 -23 -19 13 11 15 -12 + I 7 +I6 f 1 6 + I 9 +18 +19 +I7
Postnatal intervals
G2 G3 G4 G5 G6
Body weight gain
43 19 -33 -54 -54 215 +23 +14 224 234
34 -7 -24 -6 17 +13 +24 f 1 6 f 2 6 +32
29 1 -43 -48 -34 2 1 3 +21 +13 +23 +29
5 72 -1 -12 20 218 +29 +19 +29 +36
8 34 -26 27 15 221 +35 +23 +36 +44
29 41 -46 -13 -16 214 +25 +14 f 2 5 +31
14 67 -26 -78 -14 218 +32 f 1 9 f 3 4 t-36
10 -17 -40 0 16 216 225 +16 +26 t-33
20 10 -35 -13 -23 zk17 +27 +18 +28 235
25 14 -68 -57 -15 2 2 3 +36 +25 +41 +47
27 -3 -28 -20 -40 f 2 0 +33 +22 +35 +47
33 21 -36 -26 -39 f 1 2 f 2 1 f 1 3 +21 +29
33 -2 -45 -23 -3 f 2 0 +32 +22 +33 +41
-30 30 51 -9 15 f 1 7 +27 + I 8 228 +35
Decimal points have been removed and standard errors given below each value. GI = gain up to 14 days, G2 = gain between 14 and 21 days, G3 = gain between 21 and 28 days, G4 = gain between 28 and 35 days, G5 = gain between 35 and 42 days and G6 = gain between 42 and 70 days of age.
iation in several measures of height and length of the mandible and has largest coefficients for CONCAVITY, ANTMANLEN, CONDYLWID, TOOTHAREA, RAMUSHIGH and ANGULARLEN. The second vector has largest values for CORONSIZE, POST- MANLEN, NOTCHHIGH, ANGULARLEN and CONDYLLEN. CONDYLLEN varies in the opposite direction as reflected by a negative coefficient. The third vector re- flects genetic covariation between incisor shape and condyloid dimensions, with highest coefficients for SUPERINCIS, CONDYLLEN and CONDYLWID. The last ge-
586 W. R. ATCHLEY, A. A. PLUMMER AND B. RISKA
TABLE 5
Genetic correlations between the scores from a Varimax-rotated principal components analysis of 14 mandible traits and (1) the log of body weight at various ages and (2)
the various logs of body weight gain ~~
Days Postnatal intervals
Trait 14 21 28 35 42 70 GI G2 G3 G4 G5 G6
Body weight Body weight gain
Pi 22 28 42 62 67 60 22 24 29 -15 -4 -2 +I5 t 1 3 213 +12 +I1 +13 +15 + I 5 +25 +17 +26 f 3 3
P p 42 44 60 62 42 22 42 29 22 -51 -70 -48 +17 +15 +15 +18 +18 +20 +17 +18 +29 f 1 8 +33 +39
Pa 43 41 54 49 40 27 43 23 15 -54 -36 -27 + I 5 +-14 + I 4 +17 +17 f 1 8 +15 +17 +27 +17 +29 236
Decimal points have been removed and standard errors are given below each value. G1 = gain up to 14 days, G2 = gain between 14 and 21 days, G3 = gain between 21 and 28 days, G4 = gain between 28 and 35 days, G5 = gain between 35 and 42 days and G6 = gain between 42 and 70 days of age.
netic vector has largest coefficients of opposite signs for INCISHIGH and CORON-
Genetic correlations between adult body weight and the scores from the Varimax-rotated principal components of mandible dimensions range from 0.6 for the first rotated vector to -0.2 for the remaining three vectors (Table 5). Only the first rotated vector has a significant genetic correlation with body weight at 70 days of age.
Residual environmental correlations: Residual environmental correlations are quite low, and only the correlation between body weight and POSTMANLEN is >0.40 (Table 6). The Varimax-rotated principal components have large coef- ficients on the first vector measures of the lower dimensions of the ramus, including POSTMANLEN, ANCULARLEN, RAMUSHIGH and CONCAVITY. The second vector has high coefficients for TOOTHAREA, SUPERINCIS, INCISHIGH and ANT- MANLEN; the third vector reflects environmental variability in CORONSIZE, co- RONHIGH, NOTCHHIGH and CONDYLLEN; and the fourth vector reflects variabil- ity in INFERINCIS, CONDYLWID, RAMUSHIGH and ANTMANLEN.
Only the first environmental rotated vector exhibits a correlation with adult body weight significantly different from zero (Table 7).
Adul t mandible dimensions and developing body weight Having described the components of correlation between mandibular form
and body weight at 70 days of age, we might inquire about the magnitude and pattern of correlation between mandibular form in adult mice and body weight changes during earlier ontogenetic stages. Different parts of the man- dible exhibit different growth patterns, suggesting that they may share differ- ent genetic precursors with body weight at various intervals during ontogeny.
HIGH.
GENETICS OF SIZE-SCALING 587
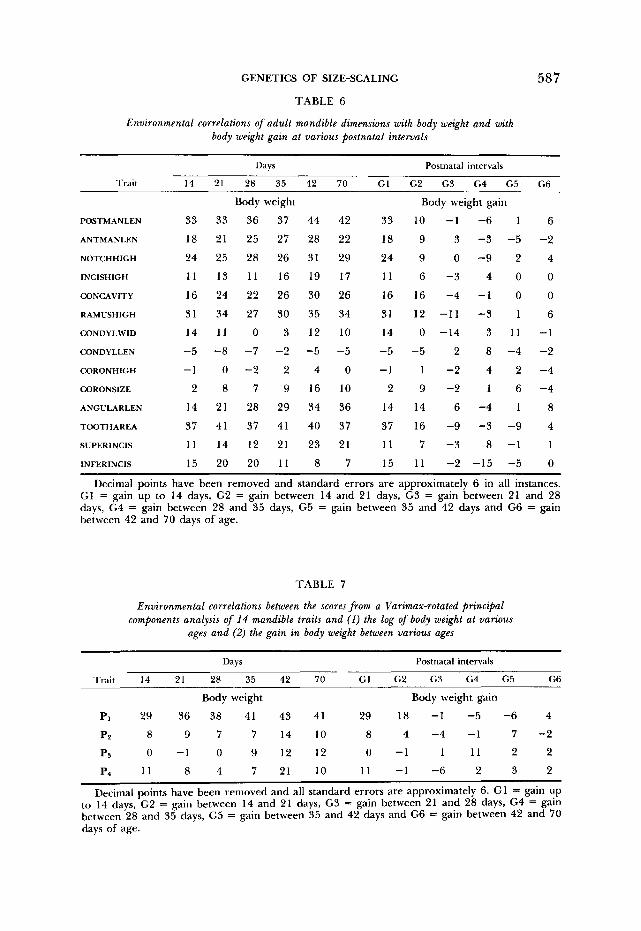
TABLE 6
Environmental correlations of adult mandible dimensions with body weight and with body weight gain at various postnatal intervals
Decimal points have been removed and standard errors are approximately 6 in all instances. G1 = gain up to 14 days, G2 = gain between 14 and 21 days, G3 = gain between 21 and 28 days, G4 = gain between 28 and 35 days, G5 = gain between 35 and 42 days and G6 = gain between 42 and 70 days of age.
TABLE 7
Environmental correlations between the scores from a Varimax-rotated principal components analysis of 14 mandible traits and (1) the log of body weight at various
ages and (2) the gain in body weight between various ages
Days Postnatal intervals
Trait 14 21 28 35 42 70 G1 G2 G3 G4 G5 G6
Body weight Body weight gain
Pi 29 36 38 41 43 41 29 18 -1 -5 -6 4
PP 8 9 7 7 14 10 8 4 -4 -1 7 -2
1 1 1 2 2 ps 0 -1 0 9 12 12
Pq 11 8 4 7 21 10 11 -1 -6 2 3 2
Decimal points have been removed and all standard errors are approximately 6. GI = gain up to 14 days, G2 = gain between 14 and 21 days, G3 = gain between 21 and 28 days, G4 = gain between 28 and 35 days, G5 = gain between 35 and 42 days and G6 = gain between 42 and 70 days of age.
0 - 1
588 W. R. ATCHLEY, A. A. PLUMMER AND B. RISKA
I , 4- 0-14 14-11 21-18 28-35 15-12 41-70
INTERVAL I N WEEKS
FIGURE S.--Genetic correlations between anterior mandible length (ANTMANLEN), posterior mandible length (POSTMANLEN) and condyloid length (CONDYLLEN) with body weight at ten intervals and body weight gain at six intervals.
Hence, we can inquire whether the various functional parts of the adult man- dible exhibit similar correlations with body weight during earlier ontogenetic periods, and whether the correlation between mandible dimensions and body weight increase the nearer the two traits are measured during ontogeny.
Phenotypic correlations between adult mandible dimensions and body weight at 14, 21, 28, 35, 42 and 70 days form a similar pattern for almost all mandible traits. The correlations are never large, and only eight of the 84 correlations are 0.5 or greater. All of these latter correlations occur for two traits, POST- MANLEN and TOOTHAREA.
There is a small but systematic increase in phenotypic correlation between 14 days and 21 days of age, followed by a slight decrease in correlation be- tween 42 and 70 days of age. In several instances, i . e . , CONCAVITY, CORONHIGH, INFERINCIS, INCISHIGH, CONDYLWID and SUPERINCIS, the initial correlation is very low and, in at least three instances, not different from zero; however, the correlations increased severalfold for INCISHIGH and CONCAVITY between 14 and 70 days of age.
Residual environmental correlations are generally low, and only five of 84 correlations are 0.4 or greater, and again, these five involve only two traits, POSTMANLEN and TOOTHAREA (Table 6). Further, the environmental correla- tions are quite stable during ontogeny and in several instances, i . e . , INCISHIGH, CONDY LLEN, CONDYLWID, CORONHIGH and CORONSIZE, are almost never differ- ent from zero at any time.
The genetic correlations, however, show interesting patterns of ontogenetic change (Table 4). There seem to be three patterns of change in the genetic correlations over this interval (Figure 2). Because of the magnitude of the standard errors, it is not possible to test statistically the validity of these pat-
GENETICS OF SIZE-SCALING 589
terns; thus, for the time being, they will have to be considered as qualitative patterns.
The first pattern is found in CONDYLLEN, where there is little change in the genetic correlation throughout the entire measurement period. The initial correlation at 14 days is 0.52, and the final 70-day correlation is 0.48.
In the remaining traits, there is an initial increase in the genetic correlation between body weight from 14 to 35 days of age and adult mandible dimen- sions. In some traits, the increase is quite marked (TOOTHAREA, INCISHIGH, CONDYLWID and POSTMANLEN), whereas in others the change is rather modest (CORONHIGH and CORONSIZE). However, two patterns of change in correlations become evident after the initial 35-day increase. In the first pattern, found in most traits, there is a decrease, often quite marked, in the genetic correlations (Figure 2). This pattern is most pronounced in CONDYLWID, POSTMANLEN, AN- GULARLEN, TOOTHAREA and SUPERINCIS and is less marked, but still present, in CORONSIZE and NOTCHHIGH.
A second pattern is found in ANTMANLEN and INCISHIGH (Figure 2). Here, there is no change in the genetic correlation after 35 days of age. It is possible that RAMUSHIGH might belong to this pattern because there is a 3-week period of stability in the genetic correlations from 28-42 days, followed by a small decrease after 42 days. It is not known at present whether this decrease is simply sampling variability about a stable value.
Earlier, it was pointed out that the basicranium and facial region of the skull exhibit different patterns of growth. Because of its articulation with the basal part of the skull, its integration of the masticatory structures with facial region and its continuous incisor growth, we would hypothesize that developmental variability in the mandible would reflect both the basicranial and facial patterns of growth. Verification of this hypothesis is found in the comparison of genetic correlations with body weight during ontogeny of dimensions of the corpus with those from the ramus region. The genetic correlation between adult ANTMANLEN and INCISHIGH and body weight increase to a peak at about 35 days of age, after which the high correlation changes very little. These traits from the corpus region of the mandible may be reflecting the facial growth pattern.
Correlations with body weight of traits in the ramus region, e.g., CONDYLWID, CORONSIZE and POSTMANLEN, increase also up to 35 days of age; however, the correlations for these traits then decrease, often markedly, after that point. This latter pattern may be reflecting growth of the cranial base as a result of the condylar articulation with the skull and the origin of some of the muscles that insert on the ramus. Braincase volume shows this pattern very clearly (ATCHLEY et al. 1984). This latter pattern suggests that the morphological traits have stopped growing at around 35 days of age, or, at least, that any growth after that age is very lowly correlated to growth in body weight.
Discussions about the evolutionary consequences of selection often assume that the genetic covariance structure remains relatively constant during ontog- eny. However, ATCHLEY (1984), RISKA, ATCHLEY and RUTLEDGE (1984) and ATCHLEY et al. (1984) provide experimental evidence of pronounced ontoge-
590 W. R. ATCHLEY, A. A. PLUMMER AND B. RISKA
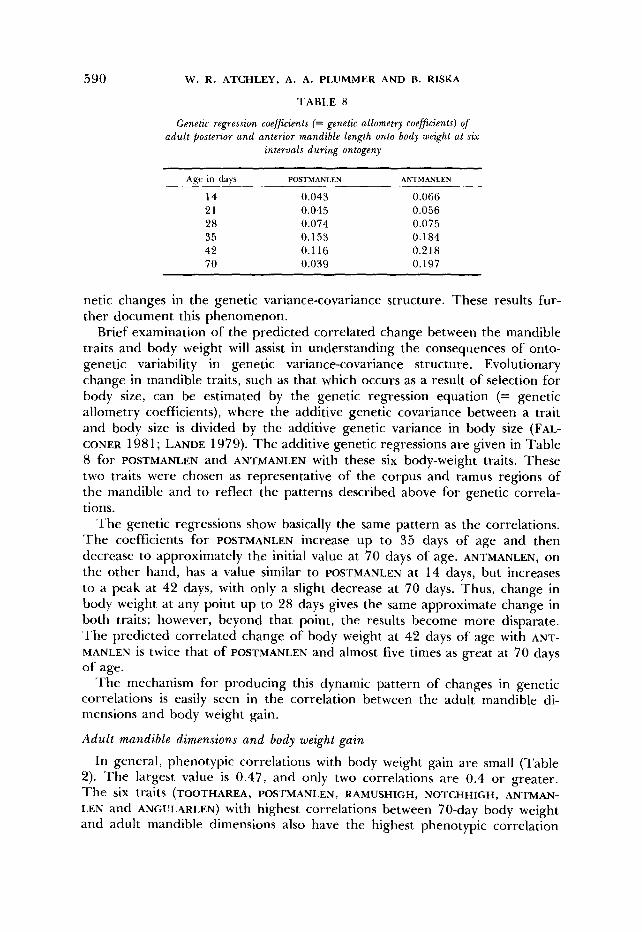
TABLE 8
Genetic regression coefficients (= genetic allometry coefficients) of adult posterior and anterior mandible length onto body weight at six
netic changes in the genetic variance-covariance structure. These results fur- ther document this phenomenon.
Brief examination of the predicted correlated change between the mandible traits and body weight will assist in understanding the consequences of onto- genetic variability in genetic variance-covariance structure. Evolutionary change in mandible traits, such as that which occurs as a result of selection for body size, can be estimated by the genetic regression equation (= genetic allometry coefficients), where the additive genetic covariance between a trait and body size is divided by the additive genetic variance in body size (FAL- CONER 1981; LANDE 1979). The additive genetic regressions are given in Table 8 for POSTMANLEN and ANTMANLEN with these six body-weight traits. These two traits were chosen as representative of the corpus and ramus regions of the mandible and to reflect the patterns described above for genetic correla- tions.
The genetic regressions show basically the same pattern as the correlations. The coefficients for POSTMANLEN increase up to 35 days of age and then decrease to approximately the initial value at 70 days of age. ANTMANLEN, on the other hand, has a value similar to POSTMANLEN at 14 days, but increases to a peak at 42 days, with only a slight decrease at 70 days. Thus, change in body weight at any point up to 28 days gives the same approximate change in both traits; however, beyond that point, the results become more disparate. The predicted correlated change of body weight at 42 days of age with ANT- MANLEN is twice that of POSTMANLEN and almost five times as great at 70 days of age.
The mechanism for producing this dynamic pattern of changes in genetic correlations is easily seen in the correlation between the adult mandible di- mensions and body weight gain.
Adult mandible dimensions and body weight gain
In general, phenotypic correlations with body weight gain are small (Table 2). The largest value is 0.47, and only two correlations are 0.4 or greater. The six traits (TOOTHAREA, POSTMANLEN, RAMUSHIGH, NOTCHHIGH, ANTMAN- LEN and ANGULARLEN) with highest correlations between 70-day body weight and adult mandible dimensions also have the highest phenotypic correlation
GENETICS OF SIZE-SCALING 59 1
between the mandible dimensions and gain up to 14 days of age. Likewise, the three traits (CORONHIGH, INFERINCIS, and CORONSIZE) with lowest correla- tions with 70-day body weight also have the lowest correlations with gain up to 14 days of age.
All phenotypic correlations are positive between the mandible dimensions and body weight gain through G2. However, 1 1 of 14 become zero or negative at G3. These negative values increase in magnitude at G4, but are very small or zero at G6.
All environmental correlations are small (Table 6), with only two values >0.3. After G1, virtually all environmental correlations are not different from zero.
The genetic correlations between body weight gain and adult mandible di- mensions show considerable systematic change from 0.7 to -0.8 (Table 4). Within some traits, e.g., CORONSIZE, the correlations range from 0.7 for G1 to -0.7 for G4. Indeed, the most obvious observation in the pattern of genetic correlations in many traits is a change in sign at G4. At this point, the mag- nitude of the change in genetic correlation with body weight gain is reflected in the pattern of genetic correlations with body weight.
The genetic correlation between body weight and adult mandible dimensions peaks at body weight values about 35 days of age. Traits achieve this peak genetic correlation in two ways. First, high genetic correlations are produced very early in ontogeny, and there is little change up to 35 days of age (e.g., CORONSIZE and CONDYLLEN). Second, there is a lower correlation early in post- natal development that is increased considerably because of a high positive genetic correlation with body weight gain (e.g., INCISHIGH, CONDYLWID and RAMUSHIGH).
The high genetic correlations are then reduced considerably in magnitude in most traits by the change in sign of the genetic correlation between mature mandible size and rate of gain in body weight. This pattern of changes in the genetic covariance also account for the difference in the pattern of the genetic regression coefficients given in Table 8 for POSTMANLEN and ANTMANLEN.
DISCUSSION
The existence of a particular magnitude of correlation between adult traits tells very little about how such a correlation might have arisen during ontog- eny; however, the time of the onset of correlation tells a great deal (ATCHLEY et al. 1984). Some fundamental questions are as follows: ( 1 ) Do high genetic correlations between adult traits suggest that these traits had high correlations throughout ontogeny? (2) If two traits did not share a high correlation early in ontogeny, how do they arrive at a high level of intercorrelation as adults? (3) How do traits with high genetic correlations early in ontogeny come to have low correlations as adults? These are fundamental questions about the origin and ontogeny of pleiotropy patterns and about the coordination of growth trajectories of diverse components into functionally integrated units. These experimental data permit us to begin to ask questions and test hy- potheses about these processes in mandibular growth and morphogenesis.
592 W . R. ATCHLEY, A. A. PLUMMER AND B. RISKA
To explore some of these questions, let us examine the distal or corpus portion of the mandible. There is high genetic correlation among the length, width and area of the distal or corpus portion of the mandible and also be- tween these measures and adult body weight. ANTMANLEN, INCISHIGH and TO- OTHAREA measure the length and height of the corpus region of the mandible, and coordination of these dimensions is necessary to achieve the correct occlu- sal relationships with the maxilla. The first two traits probably relate to the dimensions and function of the incisor itself. TOOTHAREA, on the other hand, describes the portion of the mandible occupied by the molars; however, it probably also includes some influence from the incisor, because the incisor passes through this region of the mandible. The three traits have high genetic intercorrelations (0.5-0.8) and cluster together in cluster analyses of the inan- dible traits (ATCHLEY, PLUMMER and RISKA 1985). Further, these three traits have the highest genetic correlations with 70-day body weight (0.5-0.7).
In spite of their functional relationships and high intercorrelations in adult mice, ANTMANLEN, INCISHIGH and TOOTHAREA exhibit quite different relation- ships with body weight and rate of gain in body weight during ontogeny. The genetic correlations of adult ANTMANLEN and TOOTHAREA with 14-day body weight are significantly different from zero (0.33 and 0.41, respectively), whereas the genetic correlation for INCISHIGH with 14-day body weight is not different from zero (0.13). With regard to rate of development of body weight, ANTMANLEN and TOOTHAREA have genetic correlations with G1 and G2 of 0.3- 0.4. The early correlations are significantly different from zero, but the cor- relation with weight gain goes to zero or becomes negative from G3 or G4 through G5. However, the negative correlation is only significantly different from zero for TOOTHAREA at G4. INCISHIGH, on the other hand, has a corre- lation of zero with GI and G2, after which the correlation increases markedly to 0.7 with G3. After this point, the correlation is never significantly different from zero.
Thus, while these adult traits are, themselves, genetically intercorrelated in the adult mouse, these results suggest that they arrive at high correlations with adult body weight by different mechanisms, in terms of their genetical manip- ulation of the correlation with rate of development of body weight.
Other traits from the corpus region, e.g. , incisor curvature, are not geneti- cally correlated with adult body size.
Another important suggestion from these data involves a general pattern of genetic integration in the craniomandibular region. The various genetic cor- relations with body weight suggest that genetic integration of the entire man- dible, and by extension the skull, increases from birth to a particular point in postnatal development, after which it is markedly decreased throughout the craniomandibular region. Thus, if we had measurements of craniomandibular dimensions at a number of points during postnatal ontogeny, would an index of genetic integration (ATCHLEY, PLUMMER and RISKA 1985) increase in mag- nitude up to a point and then markedly decrease, as seen with the correlations with developing body size? Many studies report that changes occurring from mutation or selection are greater the earlier they occur in ontogeny. This
GENETICS OF SIZE-SCALING 593
suggests that the affected processes themselves have a very general mode of action and impact on a number of traits. Alternatively, it might be that a very high level of genetic correlation exists among traits early in development, so that changes in any single trait produces concomitant changes in many others. These two explanations are related, but are not the same.
Growth relationship: There are several additional general observations about the genetic aspects of scaling relationships that are evident from these results.
First, traits that define the general shape of the body or basic functional unit of the mandible should also have highest correlations with early devel- opment, because it is early in development that the basic form of the mandible is determined. NOTCHHIGH, ANTMANLEN, TOOTHAREA and CONDYLLEN define large areas of the body of the mandible, and they have their highest genetic correlations with G1 and G2. After G2, the correlation with gain for NOTCH- HIGH, ANTMANLEN and CONDYLLEN goes to zero, or becomes slightly negative at G3 and rather strongly negative in G4. In TOOTHAREA, the G3 correlation is 0.2 1, after which it becomes strongly negative. Posterior mandible length also contributes to some extent here and has significant positive genetic cor- relations with G1 and G2 and is significantly negative at G4 and beyond.
Second, the level of ossification of the coronoid, angular and condyloid processes depends on muscle development in prenatal and early postnatal on- togeny. Thus, these processes should have high positive genetic correlations with early body-weight gain. Indeed, the highest correlations for coronoid and angular process size and condyloid length is with body weight gain up to 14 days. This is not the case with the width of the condyloid process. The con- dyloid process continues to develop in mass considerably into postnatal devel- opment in response to biomechanical stimulation associated with mastication activities. Therefore, condyloid width probably would not have its highest correlation with the earliest periods of gain, because mastication activities do not become important until around the time of weaning, when the mice begin to take solid food. Indeed, condyloid width is not significantly correlated ge- netically with G1 or G2, but, rather, has its highest genetic correlation with body weight gain between 21 and 28 days of age for reasons that are described next.
Third, in these mice, the obligatory switch to solid food occurs with forced weaning at 21 days of age. This switch should be paralleled or followed by growth and development of those structures devoted to mastication. INCISHIGH
and CONDYLWID have their highest correlations with body weight gain from 21-28 days of age ( i . e . , 0.72 and 0.67, respectively). TOOTHAREA is another trait strongly involved with mastication, and it has its highest correlation with weight gain in the preceding intervals but the correlation with weight gain is still positive (0.21) during the 21- to 28-day interval.
Fourth, the incisor tooth, which extends back to the neck of the condyloid process, continues to grow throughout postnatal life in rodents. Thus, incisor growth is probably strongly correlated with growth in body weight throughout rnuch of the postweaning life history of the mouse. Although we have no direct measure of incisor growth, we might expect that skeletal dimensions associated
594 W. R. ATCHLEY, A. A. PLUMMER AND B. RISKA
with the incisor might continue to be correlated with later body-weight gain. At the least, these latter traits should not exhibit a strong negative correlation with body weight gain. Figure 2 shows that INCISHIGH, ANTMANLEN and CON-
DYLLEN have stable genetic correlations with body weight after 5 weeks of age, an observation that reflects the fact that the correlation with body weight gain does not go strongly negative. This latter observation is true for INCISHIGH and ANTMANLEN; however, CONDYLLEN has a correlation of -0.4 with G4.
Selection: Patterns of genetic correlation between POSTMANLEN and ANTMAN-
LEN (Table 8 and Figure 2) and both body weight and body weight gain clarify the role that timing of selection might play in the evolution of morphological form. In nature, selection often operates on body size or rate of development (CALDER 1984). When traits are highly intercorrelated genetically and possess significant additive genetic variance, selection upon one trait, e.g., body size, often has a marked effect throughout the body (ATCHLEY,
RUTLEDGE and COWLEY 1982). The impact of selection of skeletal traits is defined by the equation for multivariate selection response (LANDE 1979) as
Ay = G P-' s
where y is a vector of traits including mandibular dimensions, body weight at various ages and body weight gain, G and P are the additive genetic and phenotypic covariance matrices for these traits during ontogeny and s is a vector of selection differentials. From the results reported here, it is obvious that change in y will depend on when during ontogeny the selection occurs, the genetic correlation structure between the mandible traits, body weight and rates of development at different ages. In other words, y, G , P and s must contain age-specific traits.
Our results suggest that the effect of selection for body weight or rate of development of size and shape of the mandible may differ depending on when selection occurs during ontogeny, and the genetic variance-covariance structure among traits at that point in time. Selection on body size often occurs on components arising early in ontogeny (RISKA and ATCHLEY 1985), and the genetic correlation between early and late gain in body weight in these mice is low and often negative (RISKA, ATCHLEY and RUTLEDGE 1984). Because of this, accurate prediction of correlated response by mandible traits to selection for body size will depend on the actual correlation structure among the man- dible traits themselves early in ontogeny and their genetic correlation with early and later postnatal rates of development. These data suggest that accurate prediction may not be possible if only mandible and body weight data for adults are used.
We are indebted to BRIAN HAIL, JAMES CHEVERUD and the reviewers for their critical comments on the manuscript. This research was supported by National Science Foundation grant DEB- 8109904 and by the College of Agriculture and Life Sciences, University of Wisconsin, Madison. Contribution 2821 from the I,abordtory of Genetics, University of Wisconsin.
GENETICS OF SIZE-SCALING 595
LITERATURE CITED
ATCHLEY, W. R., 1983 A genetic analysis of the mandible and maxilla in the rat. J. Craniofacial
Ontogeny, timing of development and genetic variance-covariance struc-
Genetics of mandible form in the mouse.
Genet. Dev. Biol. 3: 409-422.
ATCHLEY, U'. R., 1984 ture. Am. Nat. 123: 519-540.
ATCHLEY, W. R., A. A. PLUMMER and B. RISKA, 1985 Genetics 11 1: 555-577.
ATCHLEY, W. R., B. RISKA, L. A. KOHN, A. A. PLUMMER and J. J. RUTLEDGE, 1984 A quantitative genetic analysis of brain and body association, their origin and ontogeny: data from mice. Evolution 38: 1 165-1 179.
Genetic components of size and shape. I. Dynamic components of phenotypic variability and covariability in the laboratory rat. Evolution 35: 1161-1 173.
AICHLEY, W. R. and J. J. RUTLEDGE, 1980
ATCHLEY, U'. R., J. J. RUTLEDGE and D. E. COWLEY, 1981 Genetic components of size and shape.
A multivariate analysis of direct and
Size, Function and Lfe History. Harvard University Press, Cambridge, Mas-
Quantitative genetics of develop- ment: genetic correlations among age-specific trait values and the evolution of ontogeny. Evolution 37: 895-905.
11. Multivariate covariance patterns in the rat and mouse skull. Evolution 35: 1037-1055.
AI'CHLEY, W. R., J. J. RUILEDGE and D. E. COWLEY, 1982
CALDER, W. A., 1984
CHEVERUD, J. M., J. J. RUTLEDGE and W. R. ATCHLEY, 1983
correlated response to selection in the rat. Evolution 36: 677-698.
sachusetts.
FALCONER, D. S., 198 1
HALL, B. K., 1978
HALL, B. K., 1982a
Introduction to Quantitative Genetics. Longman, London.
Developmental and Cellular Skeletal Biology. Academic Press, New York
Mandibular morphogenesis and craniofacial malformations. J. Craniofacial Genet. Dev. Biol. 2: 309-322.
HALL, B. K., 198213 How is mandibular growth controlled during development and evolution. J. Craniofacial Genet. Dev. Biol. 2: 45-49.
LANDE, R., 1979 Quantitative genetic analysis of multivariate evolution, applied to brain:body
The Mammalian Skull. Cambridge University Press, Cambridge, England.
si7e allometry. Evolution 33: 402-416.
MOORE, W. J., 198 1
MOORE, W. J. and C. B. LAVELLE, 1974 Growth of the Facial Skeleton in the Hominoidea. Academic Press, London.
England.
Cambridge, England.
Science 229: 668-671.
PETERS, R. H., 1983 The Ecological Implications of Size. Cambridge University Press, Cambridge,
Scaling: Why Is Animal Size So Important? Cambridge University Press,
Genetics of growth predicts patterns of brain-size evolution.
T h e genetics of targeted growth. Genetics
Communicating editor: B. S. WEIR
SCHMIDT-NIELSON, K., 1984
RISKA, B. and W. R. ACTHLEY, 1985
RISKA, B., W. R. ACTHLEY and J. J. RUTLEDGE, 1984 107: 70-101.