Genet. Mol. Res. 11 (4): 4008-4018 (2012)Received July 24, 2012Accepted October 25, 2012Published November 26, 2012DOI http://dx.doi.org/10.4238/2012.November.26.2
ABSTRACT. Oenocarpus mapora is an Amazonian palm species commonly used by native populations for food and in folk medicine. We measured genetic variability, using RAPD markers, of material kept in a germplasm bank composed of accessions sampled from the Brazilian Amazon. These included 74 individuals from 23 accessions sampled from 9 localities in three States of the Brazilian Amazon. Jaccard genetic similarities were calculated based on 137 polymorphic bands, amplified by 15 primers. Dendrograms constructed based on the genetic similarities among individuals and sample localities demonstrated genetic separation of Acre State from the States of Amazonas and Pará. Two models in three hierarchical levels were considered for AMOVA: one considering the grouping of sampling sites in each state, and the other considering sampling sites in each subgroup formed by the dendrograms. The first model showed no significant genetic variation among states. On the other hand, genetic variation among subgroups was significant. In this model, the within-sample-site genetic diversity was 47.15%, which is considered to be low, since O. mapora is allogamous. By means of Bayesian analysis, the sample sites were clustered into five groups, and their distribution was similar to what we found in the dendrograms based on genetic similarity.
RAPD detection of genetic variation in a palm species
INTRODUCTION
The Amazon Forest is one of the regions that contains the biggest biodiversity of ani-mals and plants and represents an important storage source of species for humankind (Clay and Clement, 1993). The palms, or family Arecaceae, are among the group of plants with the highest relevance for Amazonian ecosystems. It is estimated that the Amazon flora comprises a substantial number of palms, including 200 to 250 species (Glassman, 1972; Balick et al., 1982; Lorenzi, 2010). Palms are known among local communities for their multiple uses and are used locally and commercially. Local communities use approximately 40% of the Amazonian palms, mainly for food, to build houses, and for ornamentation or handcrafts (Almeida and Silva, 1997).
Considering all these aspects, Oenocarpus species have notable characteristics. The genus is composed of seven species, which are dispersed in northern South America and Cen-tral America. Five Oenocarpus species occur in the Amazon Forest. Among these, the species O. mapora, also known as ‘bacabi’ or ‘bacabinha’, is an important source of food, which is obtained from its fruits and palm-of-heart. The fruit pulp produces a beverage that is much appreciated and can be locally consumed or commercially exploited. Its heart-of-palm also has fine organoleptic characteristics. In addition, an oil similar to olive oil can be obtained from its fruits (Balick, 1986). This palm species is largely used by local communities where it is abundant (Zambrana et al., 2007), but its market is still local.
Some authors consider a sixth species that occurs in Amazonia, named O. minor (Henderson et al., 1995; Lorenzi, 2010). However, Bernal et al. (1991) mention that there are no qualitative characters that can distinguish O. minor from O. mapora. Thus, they sug-gest that O. minor is a small form of O. mapora and that both species may be considered as one. Henderson et al. (1995) also agree that both species are very similar and that they can be considered as one. Although descriptions mention that O. mapora in Brazil occurs only in the western part of Brazilian Amazonia, which includes Acre State and southwestern Amazonas State (Balick, 1986; Lorenzi, 2010), samples had been collected in eastern Amazonia, specifi-cally in northeastern Pará State and along the borders of Pará and Amazonas.
The possibility to maintain a part of the genetic variability of O. mapora in germ-plasm banks reduces the risks of loss due to environmental degradation. To achieve this, the phase of genetic variation analysis is crucial to establish sampling strategies and procedures for conservation and management. From 1984 to 1992, Embrapa Eastern Amazon obtained samples of Oenocarpus species at various sites in Amazonia, including samples of O. mapora, to establish a germplasm bank in its facilities. Nowadays, this bank represents the only source of genetic resources of these species in Brazil, and possibly in the world.
The genetic study of samples collected from different sites allows us to evaluate the presence of genetic variation structure and the possibility of genetic erosion. This information allows us to identify critical sites for sampling to establish and enrich germplasm banks and to conduct in situ conservation programs.
Molecular markers are useful tools in the quantification of variability, since they are not subject to environmental influence and are able to show a higher percentage of the genome when compared to phenotypic markers (Grattapaglia, 2007). Random amplified polymorphic DNA (RAPD) markers were first described by Williams et al. (1990), and they are low-cost and show high levels of polymorphism. RAPD is a dominant marker, and consequently, it is less informative than codominant markers, such as microsatellites. However, these markers can generate enough polymorphism to estimate the levels of genetic variation in the populations
evaluated. Analysis of molecular variance (AMOVA) procedure allows us to determine the distribution of genetic variation within and between different types of groups, such as natural populations, and has been substantially applied in studies of plants with dominant markers (Ro-drigues et al., 2004; Oliveira and Silva, 2008; Gomes et al., 2011). Although the use of RAPD has been criticized (Jones et al., 1997), information generated by theses markers has been con-firmed by other more refined techniques. RAPD markers determined that the Solimões race of Bactris gasipaes corresponds to an extension of the Putumayo race (Sousa et al., 2001), and the same assumption was confirmed by amplified fragment length polymorphism (AFLP) markers (Clement et al., 2002), demonstrating that RAPD markers can provide insightful results.
Thus, the aim of this study was to estimate RAPD markers using the genetic variabil-ity in accessions of O. mapora from different sample places in Amazonia and maintained in a germplasm bank.
MATERIAL AND METHODS
The Oenocarpus/Jessenia complex Germplasm Bank of Embrapa Eastern Amazon was established based on samplings between 1984 and 1992. Samples were obtained in the Brazilian States of Acre, Amazonas and Pará. The bank is located in Belém, Pará, Brazil, 15 km from the local Embrapa head office. In each sample area, fruits were sampled from each plant matrix. Thus, each accession from the germplasm bank represents an open-pollinated family.
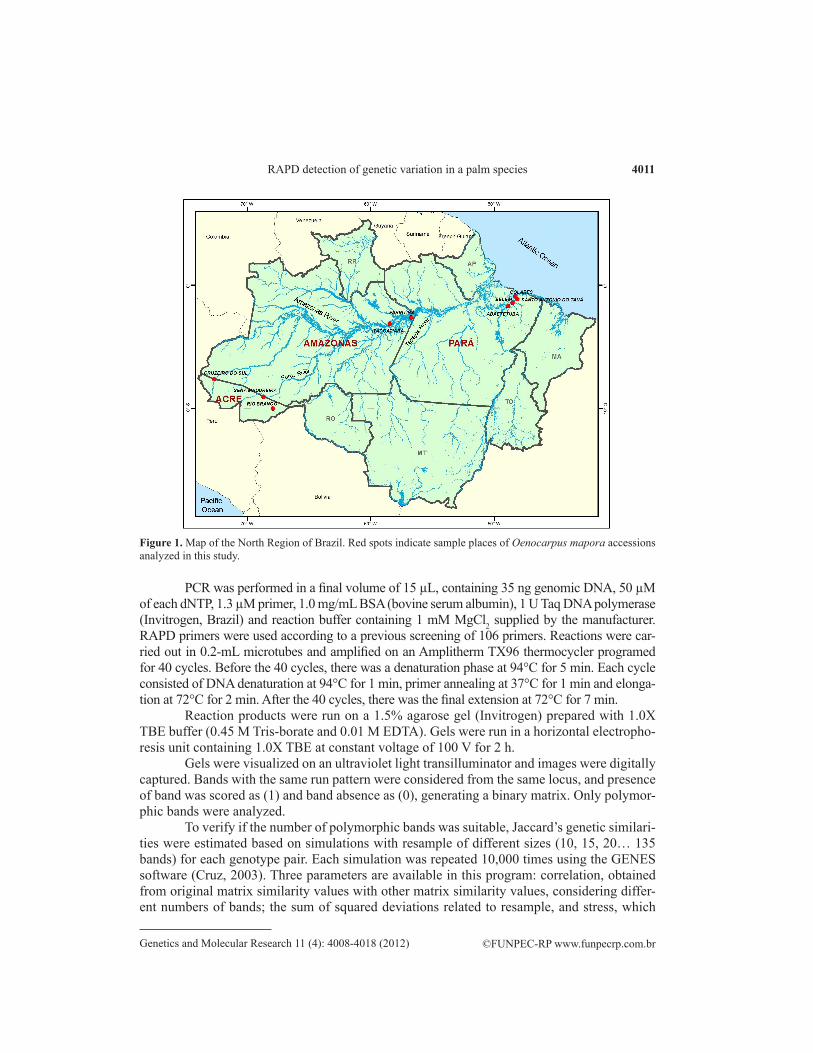
To estimate the genetic variability of O. mapora maintained in the bank, we selected 74 plants, which belonged to 25 accessions from 9 different sample areas (Table 1). Figure 1 shows the sample places in the Amazonian states. Total genomic DNA was extracted accord-ing to a procedure similar to that of Doyle and Doyle (1990). Leaflets were macerated with liq-uid nitrogen, and polyvinylpyrrolidone (PVP) and 3 mL CTAB extraction buffer (2% CTAB, 5 M NaCl, 0.5 M EDTA, PVP, 1 M Tris-HCl, and sterile water) were added to the macerate. The macerate was homogenized and incubated in hot water bath at 65°C for 1 h. Afterwards, chloroform:isoamyl alcohol (24:1) was added followed by homogenization, and the samples were centrifuged for 10 min at 10,000 rpm. Three milliliters of 95% ethyl alcohol was added to the supernatant to precipitate the DNA, and the samples were centrifuged for 10 min at 10,000 rpm. Next, the precipitate was washed with 70% ethyl alcohol for 10 min and centrifuged at 5000 rpm. DNA samples were resuspended in 300 µL TE buffer (10 mM Tris-HCl, 1 mM EDTA, pH 8.0) and RNAse. DNA was quantified on a 1% agarose gel using lambda phage DNA as a standard, at different concentrations (50, 100 and 200 ng/µL).
Sample place State No. of accessions No. of plants
Cruzeiro do Sul Acre 9 15Rio Branco 1 5Sena Madureira 1 6Itacoatiara Amazonas 1 13Parintins 2 8Abaetetuba Pará 6 13Colares 1 6Coqueiro (Belém) 1 3Santo Antonio do Tauá 1 5Total 23 74
Table 1. Number of individuals and accessions of Oenocarpus mapora per sample.
RAPD detection of genetic variation in a palm species
PCR was performed in a final volume of 15 µL, containing 35 ng genomic DNA, 50 µM of each dNTP, 1.3 µM primer, 1.0 mg/mL BSA (bovine serum albumin), 1 U Taq DNA polymerase (Invitrogen, Brazil) and reaction buffer containing 1 mM MgCl2 supplied by the manufacturer. RAPD primers were used according to a previous screening of 106 primers. Reactions were car-ried out in 0.2-mL microtubes and amplified on an Amplitherm TX96 thermocycler programed for 40 cycles. Before the 40 cycles, there was a denaturation phase at 94°C for 5 min. Each cycle consisted of DNA denaturation at 94°C for 1 min, primer annealing at 37°C for 1 min and elonga-tion at 72°C for 2 min. After the 40 cycles, there was the final extension at 72°C for 7 min.
Reaction products were run on a 1.5% agarose gel (Invitrogen) prepared with 1.0X TBE buffer (0.45 M Tris-borate and 0.01 M EDTA). Gels were run in a horizontal electropho-resis unit containing 1.0X TBE at constant voltage of 100 V for 2 h.
Gels were visualized on an ultraviolet light transilluminator and images were digitally captured. Bands with the same run pattern were considered from the same locus, and presence of band was scored as (1) and band absence as (0), generating a binary matrix. Only polymor-phic bands were analyzed.
To verify if the number of polymorphic bands was suitable, Jaccard’s genetic similari-ties were estimated based on simulations with resample of different sizes (10, 15, 20… 135 bands) for each genotype pair. Each simulation was repeated 10,000 times using the GENES software (Cruz, 2003). Three parameters are available in this program: correlation, obtained from original matrix similarity values with other matrix similarity values, considering differ-ent numbers of bands; the sum of squared deviations related to resample, and stress, which
Figure 1. Map of the North Region of Brazil. Red spots indicate sample places of Oenocarpus mapora accessions analyzed in this study.
indicates the adjustment between the original and the sampled matrix. These parameters are obtained by the Equation:
S =
where S means stress, sij* is the mean genetic similarity between all pairs of genotypes for each
resample, and sij is the mean genetic similarity between all pairs of genotypes estimated by the total number of polymorphic bands. The ideal number of bands is the one where the stress value (S) is less than 0.05 (Kruskal, 1964). The binary matrix was used to obtain Jaccard’s ge-netic similarities between individuals, using the NTSYS-pc 2.1 software (Rohlf, 2000). Using the genetic similarities matrix, the dendrogram was generated by the SAHN procedure from the NTSYS-pc 2.1 software using UPGMA. The binary analysis procedure of the GENES software was used to obtain the genetic similarities between each pair of sample places. Con-sidering sjj Jaccard’s genetic similarity between two individuals from sample places i and i’, with ni and ni’ individuals, one can obtain
and the mean genetic similarity between two sample places was estimated by
The genetic similarity matrix obtained for each pair of sample place was used to build a dendrogram by the UPGMA method using the SAHN procedure of the NTSYS-pc 2.1 soft-ware. The cophenetic correlation coefficient (CCC) between the genetic similarity matrix and the cophenetic value matrix was calculated to determine the consistency of groupings. CCC values above 0.8 indicate great representation among similarities (Bussard et al., 1990). The main component method was used to determine groupings from another perspective, using the NTSYS-pc 2.1 software. AMOVA proposed by Excoffier et al. (1992) was carried out using the GENES software. The genetic structure and F statistics were estimated based on the Euclidian distances obtained for each pair of individuals. Two models considering three hierarchical levels were tested. In the first model (a), sample places were separated based on the state of origin, and in the second model (b), they were separated into two subgroups. FGT statistics was performed to test the genetic differentiation between groups of sample areas in each model, and 1000 permutations were made for each analysis. The assignment of individu-als to populations and relatedness between populations were assessed with the Structure 2.1 software (Pritchard et al., 2000). The admixture model and the recessive alleles model without prior population information were used. Following a burn-in period of 10,000, three indepen-dent runs were carried out for each value of K (from 1 to 9) with 100,000 repeats. The true value of K (∆K) was chosen according to Evanno et al. (2005).
RAPD detection of genetic variation in a palm species
RESULTS
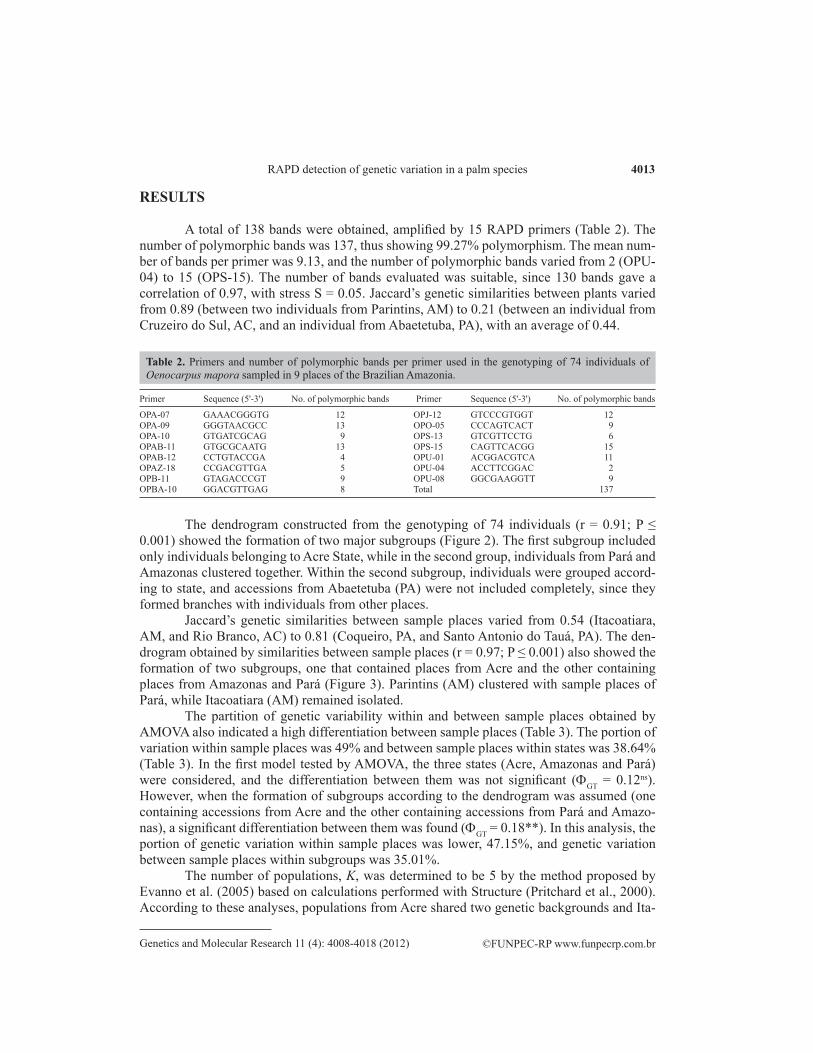
A total of 138 bands were obtained, amplified by 15 RAPD primers (Table 2). The number of polymorphic bands was 137, thus showing 99.27% polymorphism. The mean num-ber of bands per primer was 9.13, and the number of polymorphic bands varied from 2 (OPU-04) to 15 (OPS-15). The number of bands evaluated was suitable, since 130 bands gave a correlation of 0.97, with stress S = 0.05. Jaccard’s genetic similarities between plants varied from 0.89 (between two individuals from Parintins, AM) to 0.21 (between an individual from Cruzeiro do Sul, AC, and an individual from Abaetetuba, PA), with an average of 0.44.
Primer Sequence (5'-3') No. of polymorphic bands Primer Sequence (5'-3') No. of polymorphic bands
Table 2. Primers and number of polymorphic bands per primer used in the genotyping of 74 individuals of Oenocarpus mapora sampled in 9 places of the Brazilian Amazonia.
The dendrogram constructed from the genotyping of 74 individuals (r = 0.91; P ≤ 0.001) showed the formation of two major subgroups (Figure 2). The first subgroup included only individuals belonging to Acre State, while in the second group, individuals from Pará and Amazonas clustered together. Within the second subgroup, individuals were grouped accord-ing to state, and accessions from Abaetetuba (PA) were not included completely, since they formed branches with individuals from other places.
Jaccard’s genetic similarities between sample places varied from 0.54 (Itacoatiara, AM, and Rio Branco, AC) to 0.81 (Coqueiro, PA, and Santo Antonio do Tauá, PA). The den-drogram obtained by similarities between sample places (r = 0.97; P ≤ 0.001) also showed the formation of two subgroups, one that contained places from Acre and the other containing places from Amazonas and Pará (Figure 3). Parintins (AM) clustered with sample places of Pará, while Itacoatiara (AM) remained isolated.
The partition of genetic variability within and between sample places obtained by AMOVA also indicated a high differentiation between sample places (Table 3). The portion of variation within sample places was 49% and between sample places within states was 38.64% (Table 3). In the first model tested by AMOVA, the three states (Acre, Amazonas and Pará) were considered, and the differentiation between them was not significant (FGT = 0.12ns). However, when the formation of subgroups according to the dendrogram was assumed (one containing accessions from Acre and the other containing accessions from Pará and Amazo-nas), a significant differentiation between them was found (FGT = 0.18**). In this analysis, the portion of genetic variation within sample places was lower, 47.15%, and genetic variation between sample places within subgroups was 35.01%.
The number of populations, K, was determined to be 5 by the method proposed by Evanno et al. (2005) based on calculations performed with Structure (Pritchard et al., 2000). According to these analyses, populations from Acre shared two genetic backgrounds and Ita-
coatiara, AM, represented a distinct group (Figure 4). All sample places in Pará and Parintins in Amazonas had the same genetic background, except for three individuals that represented the same accession from Abaetetuba, PA (Figure 4).
Figure 2. Dendrogram based on Jaccard’s genetic similarities obtained between 74 genotypes of Oenocarpus mapora and genotyped with RAPD markers. Legends mean sample places, first number means accession and second number means plant of the accession. CS = Cruzeiro do Sul; RB = Rio Branco; SM = Sena Madureira; IT = Itacoatiara; PA = Parintins; AB = Abaetetuba; CO = Colares; COQ = Coqueiro (Belém); ST = Santo Antonio do Tauá. The dendrogram shows the formation of two principal groups (cophenetic correlation coefficient = 0.91; P ≤ 0.001).
Figure 3. Dendrogram based on Jaccard’s mean genetic similarities between 9 sample places of Oenocarpus mapora accessions in Brazilian Amazonia. CS = Cruzeiro do Sul; RB = Rio Branco; SM = Sena Madureira; IT = Itacoatiara; PA = Parintins; AB = Abaetetuba; COL = Colares; COQ = Coqueiro (Belém); ST = Santo Antonio do Tauá (cophenetic correlation coefficient = 0.97; P ≤ 0.001).
RAPD detection of genetic variation in a palm species
Figure 4. The best clustering result (K = 5) for Oenocarpus mapora samples. Each individual is represented by a vertical line partitioned into colored segments (yellow, red, blue, green, and pink), the length of which is proportional to the individuals cluster-membership coefficients. For abbreviations, see legend to Figure 3.
DISCUSSION
The analysis with RAPD molecular markers showed a high genetic diversity con-tained in the germplasm bank of O. mapora. The analysis also showed a differentiation of genotypes according to sample places. This distinct differentiation between individuals from different sample areas can be indicative of genetic structuring according to geographic local-ization of O. mapora genotypes.
The genetic similarity between the two subgroups formed on the two dendrograms (0.58, according to the dendrogram between sample places) was lower than the one found in other species that have defined races. The analysis with AFLP clearly separated B. gasipaes landraces into two subgroups, and Jaccard’s genetic similarity between them was 0.79 (Clem-ent et al., 2002). These two subgroups of O. mapora may represent heterotic groups, which can be used in genetic breeding programs.
Geographically, the sample places of Acre are far more distant from sample places in Pará and Amazonas (Figure 1). The distance between Sena Madureira (Acre) and Itacoatiara (Amazonas), the closest sample places from Acre and the two States, is more than 1700 km. Genetic similarity between these two sample places was 0.54, one of the lowest. The value of genetic similarity between the more distant sample places of Euterpe edulis was 0.84, mea-sured by AFLP markers (Cardoso et al., 2000). The low similarity between the two sample
Sources of variation d.f. SS Components of variance Total (%)
Between states 2 331.82 2.73 12.36 Between sample places within states 6 309.50 8.52 38.64 Within sample places 65 702.54 10.81 49.00 Total 73 1343.86 22.06 Between subgroups evidenced in the dendrogram 1 233.73 4.09 17.84 Between sample places within subgroups 7 407.60 8.03 35.01 Within sample places 65 702.54 10.81 47.15 Total 1343.85 22.92 100
d.f. = degrees of freedom; SS = some of squares.
Table 3. Analysis of molecular variance for two models (a and b) based on the genotyping of 74 individuals of Oenocarpus mapora sampled in nine sample places of three States of Brazilian Amazonia.
places may be indicative of an absence or reduction of gene flow continuity, which character-izes distance isolation. The genetic isolation of these sample areas needs to be tested more accurately based on heterozygosity to have a more accurate estimate.
The separation of sample places per state may not have been significant according to AMOVA due to the lack of differentiation between materials from Amazonas and Pará. Because of that, sample places from these two states were treated as a single group. There are indications that plants of O. mapora occurring in Pará State are actually the result of introduc-tions. According to Balick (1986) and Lorenzi (2010), the geographic range of O. mapora does not include Pará State. This hypothesis is congruent with the fact that the seeds that were sampled to compose the germplasm bank were collected on farmers’ properties. Since the samples from Pará showed higher genetic similarity with the ones sampled in Amazonas, it is more likely that materials sampled in Pará State were introduced from Amazonas.
The within-portion of genetic variation generated by AMOVA (49%) can be consid-ered below what is expected for a species considered allogamous and protandric (Kalume et al., 2002). Other Neotropical palm species with an allogamous habit show relatively low val-ues for within genetic variation, such as 57.4% for E. edulis (Cardoso et al., 2000) and 75.85% for E. oleracea (Oliveira and Silva, 2008). The high differentiation between the sample places of O. mapora may be related to the limited distances covered by beetles, their natural pollina-tors (Kuchmeister et al., 1998; Couturier et al., 2002). With the possible fragmentation of O. mapora habitats, the possibilities of distance isolation are higher, which may have occurred between populations of Acre and Amazonas. It can be suggested that the high differentiation between sample places may be a result of the effect of seed collections from a single plant in most sample places. However, these accessions represent half-sib families, and considering the allogamous nature of the plants (Kalume et al., 2002), these progenies were from pollen of different plants that also represented the sample place. Endogamic crosses may have occurred in these sample places, because of a reduced number of individuals per sample place or due to the low dispersion of seeds and pollen.
Bayesian analysis proposed that the individuals that compose the germplasm bank are distributed into five groups. The distribution of these groups confirmed the formation of groups in the dendrogram, where sample places from Acre clustered together, a sample place from Itacoatiara (AM) formed a separate group, and sample places from Parintins, Amazo-nas and all from Pará clustered together. According to this analysis, populations from Acre have two genetic backgrounds, and they are mixed, which means that these sample places had a continuous gene flow at the moment of sampling. Sample places from Pará belonged mainly to cluster green, the same as Parintins, AM. Three individuals from Abaetetuba, PA, belonged mainly to cluster pink, which also constitutes a small percentage of an individual from Itacoatiara, AM. Individuals from Abaetetuba, PA, and Colares, PA, also belonged to a small percentage from cluster blue, which is the main constitution of the individuals from Itacoatiara, AM. This also confirms that plants from Pará consisted mainly of samples col-lected in Amazonas State.
Data from dominant markers are not the best to estimate heterozygosity, and there-fore, estimates such as gene flow that depend on this parameter, may be unbiased. However, the results and analysis performed were sufficient to demonstrate the high genetic differentia-tion between sample places of O. mapora, especially between the States of Amazonas and Acre. RAPD markers were also efficient in determining that plants occurring in Pará were
RAPD detection of genetic variation in a palm species
probably introduced from Amazonas. The maintenance of these materials in the O. mapora germplasm bank is of extreme importance, because two gene pools are available for genetic breeding purposes. It is worth noting that this is the only germplasm bank of this species in Brazil and probably in the world, despite the intensive use of ‘bacabi’ by indigenous and ‘cabocla’ (mixed) populations in South America.
CONCLUSION
Analysis using RAPD markers revealed that the germplasm bank of O. mapora from eastern Amazon, in Pará State, is characterized by high genetic variability for the species. In addition, it was shown that the germplasm bank possibly comprises two heterotic groups of O. mapora. Besides, programs of in situ conservation of this species or future expeditions for samples must consider the high genetic differentiation found here.
ACKNOWLEDGMENTS
Research supported by FAPESPA, Embrapa and CNPq (scholarship grants).
REFERENCES
Almeida SS and Silva PJD (1997). As Palmeiras: Aspectos Botânicos, Ecológicos e Econômicos. In: Caxiuanã (Lisboa PLB, ed.). MPEG, Belém, 235-251.
Balick MJ (1986). Advances in Economic Botany, v.3: Systematics and Economic Botany of the Oenocarpus-Jessenia (Palmae) Complex. Allen Press, Lawrence.
Balick MJ, Anderson AB and Silva MF (1982). Palm taxonomy in Brazilian Amazonia: the state of systematic collections in regional herbaria. Brittonia 34: 463-477.
Bernal RG, Galeano G and Henderson A (1991). Notes on Oenocarpus (Palmae) in the Colombian Amazon. Brittonia 43: 154-164.
Bussard WO, Miazaki ES and Andrade DF (1990). Introdução à Análise de Agrupamentos. ABE, São Paulo.Cardoso SR, Eloy NB, Provan J, Cardoso MA, et al. (2000). Genetic differentiation of Euterpe edulis Mart. populations
estimated by AFLP analysis. Mol. Ecol. 9: 1753-1760.Clay J and Clement C (1993). Income Generating Forest and Conservation in Amazonia. FAO Forestry Paper, Rome.Clement CR, Sousa NR, Rodrigues DP, Astolfi-Filho S, et al. (2002). Use of AFLPs to distinguish landraces of pejibaye
(Bactris gasipaes) in Brazilian Amazonia. Sci. Agric. 59: 743-753.Couturier G, Oliveira MSP, Beserra P, Pluot-Sigwalt D, et al. (2002). Biology of Discocoris drakei (Hemiptera:
Thaumastocoridae) on Oenocarpus mapora (Palmae). Florida Entomol. 85: 261-266.Cruz CD (2003). Programa GENES: Versão Windows - Aplicativo Computacional em Genética e Estatística. Editora
UFV, Viçosa.Doyle JJ and Doyle JL (1990). Isolation of plant DNA from fresh tissue. Focus 12: 13-15.Evanno G, Regnaut S and Goudet J (2005) Detecting the number of clusters of individuals using the software STRUCTURE:
A simulation study. Mol. Ecol. 14: 2611-2620.Excoffier L, Smouse PE and Quattro JM (1992). Analysis of molecular variance inferred from metric distances among
DNA haplotypes: application to human mitochondrial DNA restriction data. Genetics 131: 479-491.Glassman SF (1972). A Revision of B.E. Dahlgren’s Index of American Palms. Verlag, Lehre.Gomes LRP, Lopes MTG, Bentes JLS, Barros WS, et al. (2011). Genetic diversity in natural populations of buriti (Mauritia
flexuosa L. f.). Crop Breed. Appl. Biotechnol. 11: 216-223.Grattapaglia D (2007). Aplicações Operacionais de Marcadores. In: Biotecnologia Florestal (Borém A, ed.). Editora UFV,
Viçosa, 175-200.Henderson A, Galeano G and Bernal R (1995). Field Guide to the Palms of the Americas. Princeton University Press,
Princeton.Jones CJ, Edwards KJ, Castaglione S, Winfield MO, et al. (1997). Reproducibility testing of RAPD, AFLP and SSR
markers in plants by a network of European laboratories. Mol. Breed. 3: 381-390.Kalume MAA, Padilha MS and Carreira LMM (2002). Avaliação do sistema reprodutivo em acessos de bacabinha
(Oenocarpus mapora Karsten.) em Belém-PA. Bol. Mus. Para. Emilio Goeldi, Ser. Bot. 18: 85-100.Kruskal JB (1964). Multidimensional scaling by optimizing goodness of fit to a nonmetric hypothesis. Psychometrika 29:
1-27.Kuchmeister H, Webber AC, Silberbauer-Gottsberger I and Gottsberger G (1998). A polinização e sua relação com a
termogênese em espécies de Arecaceae e Annonaceae da Amazônia Central. Acta Amaz. 28: 217-245.Lorenzi H (2010). Flora Brasileira Lorenzi: Arecaceae (Palmeiras). Nova Odessa, São Paulo.Oliveira MSP and Silva KJD (2008). Diferenciação genética entre procedências de açaizeiro por marcadores RAPD e
SSR. Rev. Bras. Frutic. 30: 438-443.Pritchard NK, Stephens M and Donnelly P (2000). Inference of population structure using multilocus genotype data.
Genetics 155: 945-959.Rodrigues DP, Astolfi-Filho S and Clement CR (2004). Molecular marker-mediated validation of morphologically defined
landraces of pejibaye (Bactris gasipaes) and their phylogenetic relationships. Genet. Resour. Crop Evol. 51: 871-882.Rohlf FJ (2000). Numerical Taxonomy and Multivariate Analysis System Version 2.1. Exeter Software, New York.Sousa NR, Rodrigues DP, Clement CR, Astolfi-Filho S, et al. (2001). Discriminação de raças primitivas de pupunha
(Bactris gasipaes) na Amazônia brasileira com marcadores moleculares RAPDs. Acta Amaz. 31: 539-545.Williams JG, Kubelik AR, Livak KJ, Rafalski JA, et al. (1990). DNA polymorphisms amplified by arbitrary primers are
useful as genetic markers. Nucleic Acids Res. 18: 6531-6535.Zambrana NY, Byg A, Svenning JC, Moraes M, et al. (2007). Diversity of palm uses in the western Amazon. Biodivers.