1 GENETIC MODIFIERS OF THE CARDIOVASCULAR PHENOTYPE CAUSED BY ELASTIN HAPLOINSUFFICIENCY ACT BY EXTRINSIC NON-COMPLEMENTATION* Kozel, Beth A. 1 , Knutsen, Russell H. 2 , Ye, Li 1 , Ciliberto, Christopher H. 2 , Broekelmann, Thomas J . 2 , and Mecham, Robert P. 2 From Washington University School of Medicine, Department of Pediatrics 1 and Department of Cell Biology and Physiology 2 Running title: Modifiers of elastin insufficiency Correspondence should be addressed to: Dr. Beth A. Kozel, Washington University School of Medicine, Dept. of Pediatrics, Campus Box 8116, 660 S. Euclid St. Louis, MO 63110. Fax 314-362-2252; E-mail: [email protected]Background: Variability in vascular pathology is associated with elastin loss-of-function mutations. Results: QTLs and several candidate genes that modify vessel pathology were identified in a mouse model of elastin insufficiency. Conclusions: The effects of elastin insufficiency are determined by interactions between the primary elastin defect and unrelated secondary modifiers. Significance: Identification of modifier genes enhances our understanding of disease mechanisms associated with elastin mutations. Elastin haploinsufficiency causes the cardiovascular complications associated with Williams-Beuren syndrome and isolated supravalvular aortic stenosis. Significant variability exists in the vascular pathology in these individuals. Using the Eln +/- mouse, we sought to identify the source of this variability. Following outcrossing of C57Bl/6J Eln +/- , two backgrounds were identified whose cardiovascular parameters deviated significantly from the parental strain. F1 progeny of the C57Bl/6J; Eln +/- x129X1/SvJ were more hypertensive and their arteries less compliant. In contrast, Eln +/- animals crossed to DBA/2J were protected from the pathologic changes associated with elastin insufficiency. Among the crosses, aortic elastin and collagen content did not correlate with quantitative vasculopathy traits. Quantitative trait locus analysis performed on F2 C57; Eln +/- x129 intercrosses identified highly significant peaks on chromosome 1 (LOD 9.7) for systolic blood pressure and on chromosome 9 (LOD 8.7) for aortic diameter. Additional peaks were identified that affect only Eln +/- , including a region upstream of Eln on chromosome 5 (LOD 4.5). Bioinformatic analysis of the QTL peaks revealed several interesting candidates, including Ren1, Ncf1, and Nos1; genes whose functions are unrelated to elastic fiber assembly, but whose effects may synergize with elastin insufficiency to predispose to hypertension and stiffer blood vessels. Real time RT-PCR studies show background-specific increased expression of Ncf1 (a subunit of the NOX2 NAPDH oxidase) that parallel the presence of increased oxidative stress in Eln +/- aortas. This finding raises the possibility that polymorphisms in genes affecting the generation of reactive oxygen species alter cardiovascular function in individuals with elastin haploinsufficiency through extrinsic non-complementation. Elastin is a highly conserved extracellular matrix protein that provides recoil in tissues that undergo repeated deformation, such as the lungs, large conducting arteries, and skin. Alterations of the elastin gene that cause haploinsufficiency for elastin result in a primarily vascular disease, supravalvular aortic stenosis (1-3)(SVAS 1 , MIM #185500). A microdeletion on human chromosome 7, which includes the elastin gene, causes Williams- Beuren syndrome (WBS, MIM #194050). In addition to the vascular features of SVAS, http://www.jbc.org/cgi/doi/10.1074/jbc.M111.274779 The latest version is at JBC Papers in Press. Published on November 2, 2011 as Manuscript M111.274779 Copyright 2011 by The American Society for Biochemistry and Molecular Biology, Inc. by guest on May 28, 2018 http://www.jbc.org/ Downloaded from
Transcript
1
GENETIC MODIFIERS OF THE CARDIOVASCULAR PHENOTYPE CAUSED BY ELASTIN HAPLOINSUFFICIENCY ACT BY EXTRINSIC NON-COMPLEMENTATION*
Kozel, Beth A.1, Knutsen, Russell H.2, Ye, Li1, Ciliberto, Christopher H.2,
Broekelmann, Thomas J .2, and Mecham, Robert P.2
From Washington University School of Medicine, Department of Pediatrics1 and
Department of Cell Biology and Physiology2
Running title: Modifiers of elastin insufficiency
Correspondence should be addressed to: Dr. Beth A. Kozel, Washington University School of Medicine, Dept. of Pediatrics, Campus Box 8116, 660 S. Euclid St. Louis, MO 63110. Fax 314-362-2252; E-mail: [email protected] Background: Variability in vascular pathology is associated with elastin loss-of-function mutations. Results: QTLs and several candidate genes that modify vessel pathology were identified in a mouse model of elastin insufficiency. Conclusions: The effects of elastin insufficiency are determined by interactions between the primary elastin defect and unrelated secondary modifiers. Significance: Identification of modifier genes enhances our understanding of disease mechanisms associated with elastin mutations. Elastin haploinsufficiency causes the cardiovascular complications associated with Williams-Beuren syndrome and isolated supravalvular aortic stenosis. Significant variability exists in the vascular pathology in these individuals. Using the Eln+/- mouse, we sought to identify the source of this variability. Following outcrossing of C57Bl/6J Eln+/-, two backgrounds were identified whose cardiovascular parameters deviated significantly from the parental strain. F1 progeny of the C57Bl/6J; Eln+/- x129X1/SvJ were more hypertensive and their arteries less compliant. In contrast, Eln+/- animals crossed to DBA/2J were protected from the pathologic changes associated with elastin insufficiency. Among the crosses, aortic elastin and collagen content did not correlate with quantitative vasculopathy traits. Quantitative trait locus analysis performed on F2 C57; Eln+/- x129 intercrosses identified highly significant
peaks on chromosome 1 (LOD 9.7) for systolic blood pressure and on chromosome 9 (LOD 8.7) for aortic diameter. Additional peaks were identified that affect only Eln+/-, including a region upstream of Eln on chromosome 5 (LOD 4.5). Bioinformatic analysis of the QTL peaks revealed several interesting candidates, including Ren1, Ncf1, and Nos1; genes whose functions are unrelated to elastic fiber assembly, but whose effects may synergize with elastin insufficiency to predispose to hypertension and stiffer blood vessels. Real time RT-PCR studies show background-specific increased expression of Ncf1 (a subunit of the NOX2 NAPDH oxidase) that parallel the presence of increased oxidative stress in Eln+/- aortas. This finding raises the possibility that polymorphisms in genes affecting the generation of reactive oxygen species alter cardiovascular function in individuals with elastin haploinsufficiency through extrinsic non-complementation. Elastin is a highly conserved extracellular matrix protein that provides recoil in tissues that undergo repeated deformation, such as the lungs, large conducting arteries, and skin. Alterations of the elastin gene that cause haploinsufficiency for elastin result in a primarily vascular disease, supravalvular aortic stenosis (1-3)(SVAS1, MIM #185500). A microdeletion on human chromosome 7, which includes the elastin gene, causes Williams-Beuren syndrome (WBS, MIM #194050). In addition to the vascular features of SVAS,
http://www.jbc.org/cgi/doi/10.1074/jbc.M111.274779The latest version is at JBC Papers in Press. Published on November 2, 2011 as Manuscript M111.274779
Copyright 2011 by The American Society for Biochemistry and Molecular Biology, Inc.
individuals with WBS possess characteristic facial features, a gregarious personality and abnormal endocrine function with hypercalcemia and thyroid abnormalities (4,5).
Vascular features in SVAS and WBS syndrome include narrowing in large conducting vessels such as the aorta and pulmonary artery (6), increased vascular stiffness (7) and hypertension (8,9). An affected individual may exhibit one or all of these features to varying degrees of severity. Although one-third of patients require surgical intervention for their vascular disease, 15% have no vasculopathy (10-12). No risk factors are known that predict who will develop significant vascular disease. The wide variation in vascular pathology has been suggested to arise from differences in the amount of elastin deposited in the vessels from the single remaining ELN allele (10-12).
Previous work in the rat shows that genetic background-related variations in elastin and collagen deposition affect vascular health (13). Mouse models illustrate the dose effect of reduced elastin expression on cardiovascular development and vessel function. Animals with no elastin (Eln-/-) die at P0-P4.5 of cardiac failure secondary to SVAS (14) and increased left ventricular pressure (15). In contrast, Eln+/- animals with half the normal levels of elastin protein have a normal lifespan although their vessels are narrower (14,16). Similar to humans with WBS and SVAS, Eln+/- mice have stiffer vessels (14,15,17) with increased lamellar number (14) and have elevated blood pressure (17).
Past studies of elastin-insufficient mice utilized a single genetic background, C57BL/6. Abundant evidence, however, demonstrates the profound influence of genetic background on cardiovascular phenotypes (18-23). To determine whether inbred strain polymorphisms influence the elastin mutant phenotype, we outcrossed the Eln+/- mouse from the parental background into 4 genetically distinct mouse lines (129x1/SvJ, FVB/NJ, DBA/2J, C3H/HeJ) and were readily able to detect differences in phenotype in F1 animals. Our results mirrored the human condition in demonstrating a gradation of severity for elastin haploinsufficiency-associated vascular disease, with the 129-F1 at the more severe end of the
spectrum and DBA-F1 Eln+/- mice protected from the pathological effects of low elastin.
Interestingly, quantification of aortic elastin and collagen shows that strain-specific differences in elastin deposition do not correlate with the degree of vascular pathology. In fact, mice with the lowest elastin concentration (DBA-F1 Eln+/-) show similar features to WT mice that have twice the elastin content. Database mining identified no coding differences in the elastin gene among the strains that would suggest qualitative differences in the protein. Quantitative trait locus (QTL) analysis performed on F2 C57 x129 intercrosses facilitated the identification of genomic regions distinct from the elastin locus that exacerbate the effect of Eln haploinsufficiency in mice. Expression studies looking at one of our candidate genes, Ncf1, showed differential expression in Eln+/- and suggests a role for reactive oxygen species in the pathology of elastinopathies.
Taken together, our findings show that cardiovascular disease manifestations associated with elastin insufficiency are determined by interactions between the primary elastin defect and secondary modifiers unrelated to elastin concentration that act together to raise the risk of disease phenotype, so-called extrinsic non-complementation (24).
EXPERIMENTAL PROCEDURES: Mouse strains and breeding: The Eln+/- mouse was generated in R1 (25) ES cells and crossed into C57 as per Li et al. (14). The line has been maintained by intermittent backcrossing into C57. F1 animals were generated by breeding Eln+/- parental males to 129X1/SvJ, FVB/NJ, DBA/2J, or C3H/HeJ females (Jackson Laboratory). F1 progeny were genotyped for elastin as previously described (26). Prior to breeding for F2 experiments, the line was backcrossed 3 more times by mating to C57Bl/6J males. To generate C57x129 C57x129 F2 mice, 129-F1 Eln+/- and WT sibs were intercrossed. Male Eln+/- and WT littermates (F1 or F2, as appropriate) were phenotyped at 3 months of age, although not all phenotypic traits were assessed in every animal. All animals were housed together under standard conditions. The experiments were approved by
the animal studies committee at Washington University School of Medicine.
Blood pressure: The animals were anesthetized using 1% inhaled isoflurane and were then restrained on a warmer to maintain body temperature. A Millar pressure transducer was inserted into the ascending aorta via the right carotid artery to measure heart rate, systolic, and diastolic blood pressure. For F1 analysis, average values were computed for each background and genotype and student t-tests were used to assign statistical significance between C57 and other backgrounds. In the F2 studies, data from each animal was collected and stored in a searchable database for subsequent QTL analysis.
Pressure/Volume measurements: Isolated ascending aortas were cannulated and mounted on a pressure arteriograph (Danish Myotechnology). Vessels were bathed in physiologic saline solution and the vessel inflated with physiological saline over a pressure range of 0 – 175 mmHg. Vessels were transilluminated under an inverted microscope connected to a charged coupled device camera and computerized system, allowing a continuous recording of changes in vessel diameter with change in pressure. Further experimental details are described in our previous studies (16,27).
Lamellar number: Descending aortas were removed and fixed in 10% formalin overnight. After fixation, the tissue was dehydrated into 70% EtOH and positioned for semi-thin sectioning in plastic. Sections were taken just distal to the branching of the left brachiocephalic and were stained with toluidine blue. Vessels were photographed and the lamellar number counted in each quadrant in that section. Average values were computed for each background and genotype and student t-tests were used to assign statistical significance.
Elastin and collagen analysis: Elastin, collagen, and total protein content in the ascending aorta were quantified by amino acid analysis using a Beckman 7300 amino acid analyzer according to previously published methods (28). The ascending aorta, from the aortic root until just beyond the brachiocephalic bifurcation, was dissected from each 3-month-old mouse then hydrolyzed for 48 hours at 110°C in 6N HCl. HCl was removed under
vacuum and the dried samples were re-suspended in amino acid sample buffer then filtered using Ultrafree-MC (0.45µm) centrifugal filters (Millipore). Elastin content for each aorta was determined from the desmosine peak using purified bovine ligamentum nuchae elastin (Elastin Products Company Inc.) as a standard. Total protein was calculated from each sample using the Pickering Laboratories Protein Hydrolysate standard. Using these calibrations, “% elastin” was calculated as mg elastin/mg total protein X 100. Hydroxyproline content was determined by amino acid analysis using the Pickering Laboratories Collagen Standard and expressed relative to total protein (nmol hydroxyproline/mg total protein).
Elastin single nucleotide polymorphism (SNP) variation analysis: Mouse SNP databases at Wellcome Trust (http://www.sanger.ac.uk/cgi-bin/modelorgs/mousegenomes/snps.pl) and Jackson Laboratory, Center for Genome Dynamics (http://cgd.jax.org/cgdsnpdb/) were interrogated for SNPs in the elastin gene among the inbred strains studied here. The Wellcome Trust site includes 25.8x coverage of C57Bl/6 and 21.7x coverage of DBA/2. The 129x1/Sv is not specifically included in this database but 24-38.5x coverage was achieved for two closely related 129 strains (129P2 and 129S1). At the MGI database data from up to 7 sources (MusDiv, NIEHS, GNF, Paigen, Celera, Wild Derived and Broad) were analyzed to provide coverage of the 3 strains discussed here. The imputed database was also available for analysis. SNP Genotyping: Genomic DNA was prepared following protease K digestion of tail SNPs and phenol-chloroform extraction. Each sample was quantified using a Nanodrop spectrophotometer and the 260/280 ratio was inspected to ensure a quality product. DNAs were arrayed in 96 well plates (Midwest Scientific) at 5ng/µl for genotyping. Samples were submitted for Sequenom MassARRAY genotyping (29) using primers spaced at ~15 cM intervals over the 19 autosomes.
QTL analysis: F2 genotype data was displayed on a spreadsheet together with quantitative phenotype data from each animal. Genome-wide scans were plotted using the J/QTL mapping program, version 1.3.1
(http://research.jax.org/faculty/churchill/). Following Bonferroni correction for multiple phenotype testing, suggestive (α=0.32 (0.63/2)), significant (α =0.025 (0.05/2)) and highly significant (α =0.001) thresholds were established empirically for each phenotypic trait by 1000 permutation tests using all informative markers (30).
Reactive oxygen species measurement: Aortas were dissected from C57 Eln WT and +/- animals and immediately embedded in O.C.T. Compound (TissueTek) without fixation and flash-frozen on dry ice. Tissue sections (4 µm) were incubated with dihydroethidiun (DHE, Calbiochem) or stained for Nitrotyrosine using the anti-Nitrotyrosine antibody (Millipore). DHE is a cell-‐permeable molecule that, when oxidized, is able to intercalate with DNA leading to emission of a bright red color detectable by fluorescence microscopy (31). DHE was dissolved at 5mM in DMSO and diluted to 5µM in PBS for incubation with tissue. Frozen sections were incubated with DHE for 30 min at 37°C and then rinsed in PBS. For the nitrotyrosine study, sections of C57 (parental strain) Eln +/- and WT were first blocked in 5% BSA (Sigma) and 0.1% Triton X-100 (Sigma) prior to incubation with anti-nitrotyrosine antibody (diluted 1:100 in PBS with 2.5% BSA and 0.05% Triton X-100) for 60 min at 37°C. After subsequent washes, the tissue was incubated with Alexa Fluor 594 (Molecular Probes) anti-rabbit IgG diluted 1:1000. After staining, the slides were rinsed with PBS and cover slips were mounted on each slide with Mounting Medium (Richard-Allan Scientific). Images were captured on a fluorescence microscope (Zeiss Axioscope) with a Qicam Fast1394 camera using Qcapture software. Care was taken to utilize identical exposure time for Eln+/- and WT and the images were optimized identically in Photoshop. Each assay was performed on multiple slides from 2-3 animals in each genotype. Representative images are shown. All images are 20X.
Quantitative RT-PCR: Identically located segments of descending aorta were collected from C57x129 F2 mice at the time of phenotyping, rinsed and stored in RNAlater (Ambion). Biological subgroups (C57 WT, C57
Eln+/-, 129 WT, 129 Eln+/- were defined by elastin genotype (WT vs Eln+/-) and SNP genotype (homozygous C57 vs 129) at SNP rs3656108 (the SNP closest to the peak of the chromsome 5 QTL). To isolate RNA, tissues were minced under RNase free conditions with a razor blade and homogenized manually using a tube and pestle in TRIzol (Invitrogen). After a 5 min room temperature incubation, chloroform was added and the samples were spun at 4°C in Phase-Lock Gel tubes (Fisher). The clear phase was transferred to a clean tube and an equal volume of 70% EtOH was added prior to applying the solution to a column from the Qiagen RNeasy minikit. DNase digestion (Qiagen) was performed on column and the remaining RNA purification was done according to the manufacturer’s instructions. RNA concentration was determined using a Nanodrop spectrophotometer. Reverse transcription was performed using iScript RT kit (Bio-Rad), which includes a mixture of polyT and random primers and 500ng of RNA. RT products were diluted 1:10 and 5µl of total sample was used per well. Real time PCR was performed using Taq Man assays (Ncf1-Mm00447921m1, Cybb-Mm00432775m1, Gusb-Mm00446953m1, Ipo8-Mm01255158m1 from Applied Biosystems) with TaqMan Fast Universal PCR mix on an ABI ViiA7 machine. Control genes Gusb and Ipo8 were chosen following screening WT mice from the different backgrounds using the Mouse Endogenous Control Array (Applied Biosystems) for equivalent expression in the aorta. Five animals were sampled per biological subgroup and each animal was studied in duplicate. On each plate, a replicate from the previous plate was used to assure similar amplification between plates. In each case, replicates were highly similar. Replicate data was not used in the final expression calculations. Relative expression was determined using the ΔΔCT method and results are expressed as mean fold change +/- SE as compared to C57 WT values and ANOVA was performed for significance. RT minus and water controls were performed and were negative. RESULTS
Previous characterization of C57BL/6 Eln+/- mice documented higher blood pressure,
stiffer blood vessels with narrower vessel diameter and more elastic lamellar units relative to C57BL/6 WT animals (14,17). To evaluate changes to these documented phenotypes in mice of differing genetic backgrounds, F1 outcrosses were made between C57Bl/6J Eln+/- mice and either C57Bl/6J WTs or WT animals from one of four other inbred mouse strains (129X1/SvJ, FVB/NJ, DBA/2J, C3H/HeJ). Male WT and Eln+/- progeny were sacrificed for phenotyping at 3 months of age. Techniques for evaluation of cardiovascular phenotype included invasive arterial blood pressure monitoring with a Millar catheter and aortic compliance measurement using a pressure arteriograph, as well as histological examination of the aorta. Five or more animals of each genotype were used in each evaluation as suggested by power calculations. The results below highlight the effect of the two most divergent genetic backgrounds (C3H and FVB data not shown.).
129x1/SVJ polymorphisms exacerbate the Eln+/- cardiovascular phenotype.
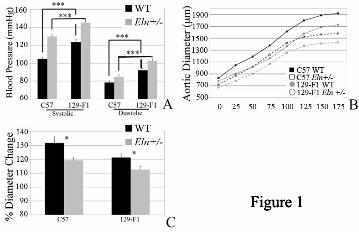
Compared to the C57 strain, 129-F1 mice had more severe cardiovascular defects. Evaluation of blood pressure showed increased systolic and diastolic pressures (Figure 1A) in both 129-F1 WT and Eln+/- animals. When evaluated using the pressure myograph, the ascending aorta in 129-F1 mice was narrower and stretched less with incremental internal pressure increases (Figure 1B), suggesting a stiffer vessel. Over a pressure range of 0-175mm Hg, the aortas of 129-F1 WT and Eln+/- mice distended less than their genotypic counterpart in the C57 strain when normalized for the starting diameter (Figure 1C). The phenotypes follow a graded scale of severity where C57 WT animals are the mildest, while 129-F1 WT and C57 Eln+/- give intermediate values. In each case, the 129-F1 Eln+/- are the most severely affected. As the vascular diameter becomes narrower, there is a concomitant increase in blood pressure, suggesting that vascular diameter and blood pressure are linked physiologically in these animals as previously reported in the C57 Eln+/- background (17)
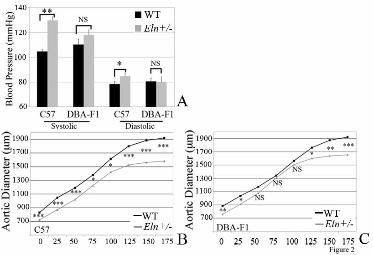
DBA/2J polymorphisms interact with elastin genotype to protect animals from the effects of elastin haploinsufficiency. Unlike in the 129-F1 background, vessels in the DBA-F1 animals display little response to elastin haploinsufficiency. In the C57 background, Eln+/- animals have significantly greater systolic and diastolic blood pressure compared to WT mice (Figure 2A). In the DBA-F1 cross, Eln+/- animals demonstrated an insignificant increase in systolic blood pressure and no rise in diastolic blood pressure relative to DBA-F1 WT (Figure 2A). Likewise, pressure-volume curves show narrower and stiffer vessels for C57 Eln+/- mice compared to C57 WT at all pressures tested (Figure 2B). However, no differences were detectable in the DBA-F1 WT and Eln+/- animals over the physiologic range of blood pressure (Figure 2C).
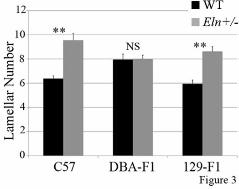
Previous studies showed that conducting vessels in humans and mice with elastin haploinsufficiency have increased lamellar number (14). In the C57 background, WT and Eln+/- animals have between 6 and 9 lamellar units, respectively, in the descending aorta. The lamellar number in DBA-F1s, however, does not increase in the mutant (Figure 3). Of note, 129-F1 Eln+/- mice show an increase in lamellar number, similar to C57 (Figure 3). DBA-F1 WT animals have slightly higher baseline blood pressure, vascular stiffness and lamellar number compared to their C57 counterparts. In contrast, the DBA-F1 Eln+/- animals are protected from further changes associated with elastin deficiency and generally have blood pressure and aortic diameter values that are less severe than the C57 Eln+/-mice. Consequently, it appears that there are mechanisms that specifically protect the Eln+/- animal in this background from additional vascular pathology. Strain-specific elastin polymorphisms are not identified among the 3 strains analyzed
Data from elastin mutants in the C57 background showed incrementally more severe disease as elastin deposition decreased from WT levels to 70%, 50% or 30% of WT quantities (26) . Some have speculated that variation in the severity of vascular disease in the SVAS/Williams patient population reflects the
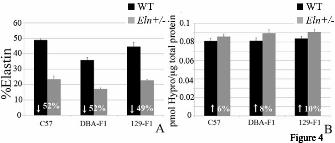
elastin content deposited from the single remaining functional ELN allele (10-12). Consequently, we sought to determine whether elastin differed in WT and Eln+/- animals among the outcrossed backgrounds. To determine whether the strain-specific differences could be due to polymorphisms present on the non-deleted elastin allele, we searched for synonymous, non-synonymous or non-coding elastin SNPs among these strains in the Jackson Laboratories and Wellcome Trust library annotations. No gene variations among the strains studied have been published to date (June, 2011). The annotation for the C57 and DBA/2 backgrounds is excellent (>20x coverage for each at Wellcome Trust and coverage from 7 contributors at the CGD site.) While no data for the 129x1/SvJ strain was available at Wellcome Trust, two closely related and well-covered 129 strains (129P2 and 129S1) were analyzed. At the CGD, data on 129x1/SVJ had been submitted from 6 sources. Imputed data was also available for all three strains used for this analysis. However, specific oversequencing of the Eln regions in these strains has not been undertaken and other, not-yet-described genetic or epigenetic differences could exist between elastin genes that may explain interstrain differences in the vascular parameters described here. Variation in elastin content among strains does not explain the degree of vasculopathy Previous work in the rat identified quantitative trait loci (QTL’s) related to variations in vascular elastin and collagen content (13). To determine whether the changes in vascular mechanics we observed were due to variations in the total amount of elastin or collagen deposited in the aortic wall, total protein, collagen (hydroxyproline) and elastin (desmosine) content were assessed. In all backgrounds, the aortic elastin content was decreased by approximately 50% (49.2-52%) in the Eln+/- genotype relative to the strain-specific WT (Figure 4A). This is consistent with previous findings in the C57 background(14). Comparisons among strains show that over all, the DBA-F1 aorta has the lowest WT elastin content (35% of total protein) (Figure 4A), while C57 (48% total protein) and 129-F1
(45%) WT are higher (129-F1, p=NS compared to C57). DBA-F1 Eln+/- mice also have lower elastin content (17% of total protein) compared to C57 (23%; p<0.05), while the elastin content in 129-F1s Eln+/- mice is not statistically different from C57 Eln+/-. Collagen content shows a similar (but statistically insignificant) increase in all Eln+/- mice (Figure 4B). Based on previous data from the C57 Eln+/- (∼50% WT elastin) and Eln-/-; hBAC mice (∼30% WT elastin) (26), if severity of conducting artery phenotype and elastin content were strictly correlated, 129-F1 vessels would be expected to have the least elastin because they are most severely affected. Likewise, DBA-F1s, that fail to show pathological response to elastin haploinsufficiency, would be predicted to have more residual elastin in the Eln+/- state. Instead, the 129-F1 elastin concentration is statistically indistinguishable from C57. Moreover, the DBA-F1 and C57 Eln+/- vessels show a similar decrease in elastin content. In fact, percent elastin content in the DBA-F1 Eln+/- aorta is only ~1/3 of the level in C57 WT. This quantity is similar to the ∼30% of WT elastin seen in the Eln-/-; hBAC (26). However, the DBA-F1 Eln+/- animals do not share the severe vascular pathology of the Eln-/-; hBAC mice and retain relatively normal cardiovascular mechanics. The fact that direct correlations between percent elastin content and cardiovascular phenotype cannot be made suggests that among outbred Eln+/- animals, extrinsic non-complementation (i.e. elastin-independent modifiers) must predispose to or protect animals from hypertension, vascular stiffness and vessel remodeling. Genetic linkage analyses in a C57-129 F2 intercross for modifiers of Eln+/- vasculopathy
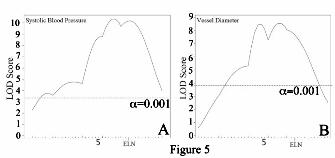
To identify candidate modifiers for cardiovascular severity in the 129-F1 Eln+/- model, 129-F1 Eln+/- and WT animals were crossed to generate ~370 F2 male WT or Eln+/- progeny. Blood pressure and vessel diameter were measured in these F2 animals at 3 months of age. Genetic linkage analysis was performed using polymorphic SNP markers spaced ~15cM apart. During the course of this investigation, some Eln+/- mice in the C57 background were found to have retained portions of chromosomes
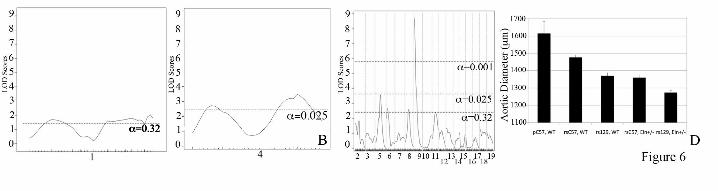
1 and 4 derived from the targeted 129 strain used to generate the original Eln knockout, despite greater than 8 generations of backcrossing to C57. To control for this variation, all progeny derived from F1 parents not C57/129 heterozygous in these regions were excluded, and data from chromosomes 1 and 4 were analyzed separately using only a smaller cohort of ~125 (chromosome 1) or ~230 (chromosome 4) animals. To maximize power, the remaining chromosomes, where parental genotypes were as anticipated, were analyzed using the total cohort of ~370 animals. When WT and Eln+/- mice were analyzed together, a highly significant peak (LOD 8-10, depending on phenotype) is identified on chromosome 5 for both systolic blood pressure and aortic diameter (Figure 5). The elastin locus sits under each peak, confirming the causative role of the Eln mutation in these phenotypes. Additive and interactive QTLs are identified for aortic diameter in C57/129 F2 animals. We have shown that the aorta in 129-F1 animals is narrower than in C57 mice at all pressures tested. To identify genes associated with this effect, genetic linkage was performed by evaluating the aortic diameter at 100 mm Hg as a quantitative trait. 100 mm Hg was chosen because it is within the operating blood pressure of vessels from both backgrounds. When analysis was performed using the Eln genotype as an additive covariate, a highly significant QTL peak, EDL7 (Table 1), was identified on chromosome 9 (LOD 8.7 at position MB 30.3, Figure 6C). A significant peak on chromosome 5, proximal to the elastin locus is also observed. Suggestive loci on chromosomes 1, 4, 6, 8, and 11 were also identified (α<0.32, Figures 6A-C). Subanalysis by rs13480120 (the closest SNP to the peak of the chromosome 9 tracing) and elastin genotypes confirmed the additive effect of genetic background with elastin genotype in each case (Figure 6C). Using an additive plus interactive covariate analysis with the Eln genotype, our data show a mild to moderate increase in LOD score for the peaks on chromosomes 1,4, 5, 6 and 9, suggesting that while these peaks have a predominantly additive effect, they also have an interactive component (Table 1). When Eln+/-
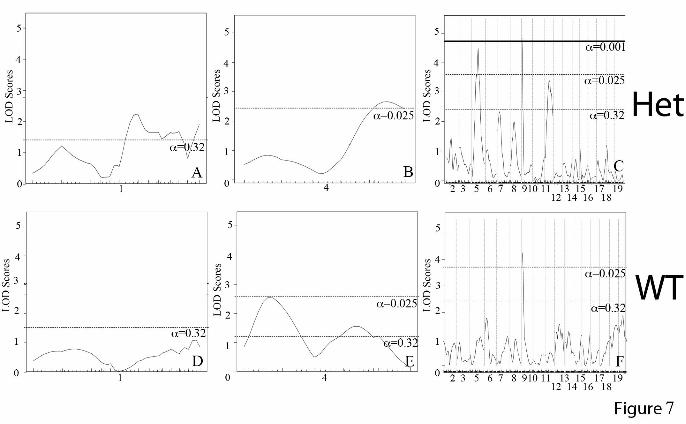
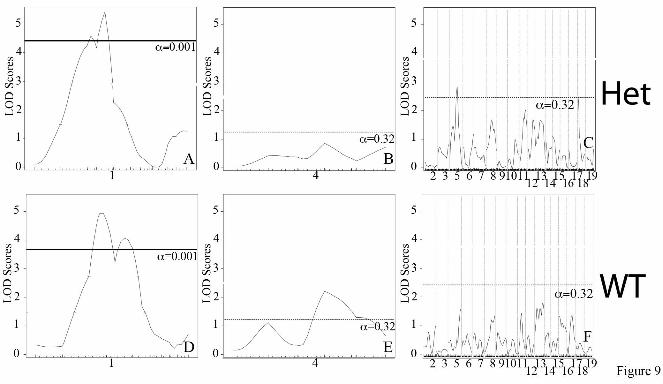
and WT were analyzed separately, the chromosome 9 peak remains strong in both groups (Figure 7). The peaks on chromosomes 5 and 11, however, appear to only be significant in the Eln+/- mice. In the case of chromosome 5, it is the C57 background that imparts more severe disease and suggests the possibility of a gene upstream from elastin, potentially within the orthologous Williams critical region (32), whose effect modifies the elastin insufficiency phenotype. On chromosome 4, the centromeric peak (ELD2, see Table 1) is significant only in WT animals while the telomeric peak (ELD3) is significant in Eln+/-. At this reduced power, the peaks on 6 and 8 are no longer significant. A significant peak is also present on chromosome 1 but is a large distance from the original (ELD1) and may reflect increased noise in this small sample. Additive and interactive peaks are identified for systolic blood pressure in C57/129 F2 animals.
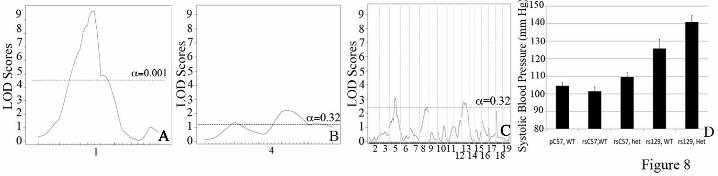
The 129-F1 background exacerbates the hypertension exhibited by Eln+/- mice. QTL analysis evaluating systolic blood pressure in C57x129 F2 males revealed a highly significant peak on chromosome 1 (LOD 9.7 at 47.5MB when elastin genotype is used as a covariate in an additive model) (Figure 8A). More minor peaks on chromosomes 4, 5 and 13 cross the suggestive threshold with LODs between 2.0 and 4.0 (Figure 8B and C). When systolic blood pressure is analyzed by genotype at rs369822 (the SNP at the peak of the chromosome 1 QTL) and the Eln genotype, we see the additive effect of the two components (Figure 8D). Animals that are WT for elastin and are homozygous for the C57 background at rs369822 have a systolic blood pressure of 102 mmHg, while rs3694822 C57 homozygotes that are Eln+/- and rs3694822 129 homozygotes WTs have SBP of 110 and 126 mmHg respectively. Eln+/- rs369822 129 homozygotes, however, have an even higher SBP of 141 mmHg. A similarly located peak was identified in a C3HxKK intercross by Feng et al (18), but in this case the total pressure difference between homozygous genotypes was only 3 mmHg.
When analyzed in an interactive model, the LOD score for each peak rises a small degree
suggesting a component of interaction with the Eln genotype (Table 1). When Eln+/- and WT were analyzed separately, the chromosome 1 peak remains strong in both groups, again as would be expected given the predominately additive effect shown here (Figure 9 A and D). At this reduced power, the peak on chromosome 13 is no longer significant (Figure 9C and F). The peak on chromosomes 5 is again present only in the Eln+/- animals (Figure 9C and F), suggesting an interaction with the Eln+/-
genotype. Again, the C57 allele is associated with more severe disease.
Candidate Gene Evaluation Using a LOD score drop threshold of 1.5 to identify regions of interest under each peak (Table 1), we interrogated the hypertension-associated region on chromosome 1 (85-132.7 MB) and the aortic diameter linked chromosome 9 region (1-39.9MB). Initial screening involved filtering for genes with phenotype appropriate designations using the Biomart database (http://www.biomart.org). Using the search term “blood pressure” yielded two candidate genes Htr2b (87.9 MB), and Ramp1 (93.1 MB) under the chromosome 1 peak. Extending this interval 0.5 cM yielded two additional candidates, IL10 (132.9 MB) and Ren1 (135.2 MB). Ren1 is of particular interest because Eln+/- mice exhibit elevated renin activity relative to WT controls. The chronic kidney disease blood pressure locus 1 (ckdbp1) QTL located at position 112.5MB is also present in this interval (33). Similar analysis of the chromosome 9 peak associated with vessel diameter, using phenotype terms aimed at identifying genes associated with abnormal vascular development, produced a list of 4 potential candidates: Trpc6 (8.5MB), Angptl6 (20.7 MB), Fli1 (32.2 MB), and Ets1 (32.5 MB) .
The hypertension and vascular diameter loci on chromosome 5 have substantial overlap. The loci are 65-143 and 77-126 MB, respectively. Four interesting genes, Ncf1 (134.6 MB), Nos1 (118 MB), Spp1 (104.9 MB), and Idua (109 MB), reside in this interval. Ncf1 is within the Williams critical region and its inclusion in the deletion affects the risk for hypertension in individuals with WBS (34). The product of Nos1 (nitric oxide synthase 1) plays a
significant role in vasodilation of large and small vessels in humans and mice (35,36). Interestingly, SNPs in two genes in this interval, Fgf5 (98.6 MB) and Sh2b3 (122.2 MB) were recently identified in a human GWAS study to be associated with hypertension and increased cardiovascular disease risk (37).
In each case, the genes identified through these screens (with the exception of Idua (38)) are not known to affect the quality or extent of elastic fiber assembly. Consequently, their actions are expected to act by extrinsic non-complementation with elastin to protect from or predispose to hypertension and vascular narrowing in mice.
Eln+/- aortas show evidence of increased oxidative stress
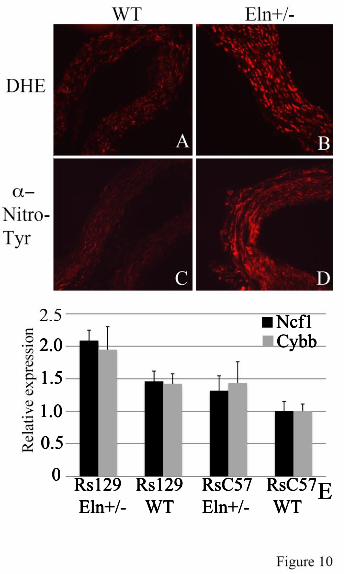
Previous work by Del Campo et al (34) showed a correlation between copy number for Ncf1 and risk of hypertension. In their study, the inclusion of NCF1 in the Williams deletion (copy number=1) was associated with decreased hypertension risk in those patients relative to those with two copies of the gene. Ncf1 (p47phox) functions as a regulatory subunit for several NAPDH oxidase (NOX) family members that are expressed in the vasculature (39,40), and consequently, likely contributes to the production of reactive oxygen species (ROS) in those tissues.
To determine if oxidative stress is associated with elastin insufficiency, we stained frozen sections of mouse aorta with dihydroethidium (DHE), a cell permeable dye that, when oxidized, is able to intercalate with DNA, producing a fluorescent red stain of the nucleus (41). The degree of staining is linearly related to the level of oxidative stress in a tissue. Figure 10 shows significantly enhanced staining of Eln+/- vs WT tissue, suggesting higher oxidative stress in the elastin-insufficient vessel. Confirmation of oxidative changes was obtained using nitrotyrosine antibodies, which detect the presence of oxidation-induced nitrosylated amino acids in cellular and extracellular proteins (Figure 10). Together, these results confirm a higher level of reactive oxygen species (ROS) in vessels with elastin haploinsufficiency.
NcfI shows differential expression in 129 Eln+/- aorta Genotype-specific Ncf1 expression was undertaken using quantitative real time RT-PCR in aortic tissue from C57 Eln+/- X 129 F2 animals. Animals were assigned to genotype categories based on the Eln genotype (WT or +/-) and SNP genotype (homozygous C57 Bl/6 (rsC57) or homozygous 129x1/Sv (rs129)) at the peak of the chromosome 5 Eln+/-. All data are shown relative to rsC57 WT. In each genetic background, the Eln+/- expresses more Ncf1 than its matching WT (Figure 10E, black), but the rs129 Eln+/-‘s expression of Ncf1 is highest (p<0.05). Expression analysis of Cybb, one of the molecules complexed with Ncf1 in the NOX2 NAPDH oxidase, shows a similar trend (Figure 10E, gray). The p value was not significant (p=0.07). However, given the similar pattern of expression to Ncf1, it is likely that each of the complex’s subunits are similarly upregulated. Nos1 analysis (data not shown) showed an interesting pattern of differential expression, with the rsC57 animals expressing 2-4 times more Nos1 than their rs129 counterparts. However, the biological replicates showed wide variation in expression and statistical significance could not be met. Similar analysis of genes under the chromosome 9 peak (Fli1 and Angptl6, data not shown) did not reveal differential expression between genetic backgrounds. These findings suggest a specific role for reactive oxygen species and oxidative stress in the pathology of elastic fiber disease. DISCUSSION
Elastin is a highly conserved extracellular matrix protein that provides recoil in tissues that undergo repeated deformation, such as the lungs, large conducting arteries, and skin. It is expressed during a tightly controlled developmental window occurring from the late fetal period to early post-natal life (42-44). Inadequate deposition of elastin during this critical period cannot be compensated by later expression and individuals with elastin insufficiency are consequently at risk for significant pathology in their vascular and other elastic tissues.
Individuals with genetic defects leading to elastin haploinsufficiency, such as those with
WBS and isolated SVAS, exhibit vascular pathology including narrower and stiffer blood vessels, hypertension, and increased elastic lamellar number. The degree to which each individual is affected varies significantly. Approximately 85% of individuals with elastin mutations have some degree of cardiovascular involvement. Conversely, 15% have no cardiovascular problems. About one-third of WBS/SVAS patients require surgical intervention, while the others are more mildly affected. About half of WBS individuals have hypertension, and vascular stiffness also varies in this population (7,45-47). There is currently little data to explain these disparities, although the effects of genetic and environmental modifiers have long been hypothesized.
Variability in the amount of elastin deposited in the vessel wall of haploinsufficient people and animals has been suggested to be responsible for these differences in penetrance and expressivity (10-12). To investigate this hypothesis more fully, we made use of the Eln+/-
mouse. This animal shares many of the features of human elastin insufficiency disease, including hypertension, narrow blood vessels with increased lamellar number, and decreased vascular compliance. While animal models may not perfectly recapitulate the human disease, they can provide mechanistic insight toward understanding human pathology. Our quantitative data shows that the more severely affected 129-F1 animals have elastin content that is similar to the C57 parental strain while the DBA-F1s, which are more mildly affected, have a relative elastin concentration that is significantly lower than C57. These data indicate that within a given genetic background, gradations of elastin are important for determining severity of phenotype, but between strains, other elastin-independent pathways modulate the risk for hypertension, vascular stiffness and vessel remodeling.
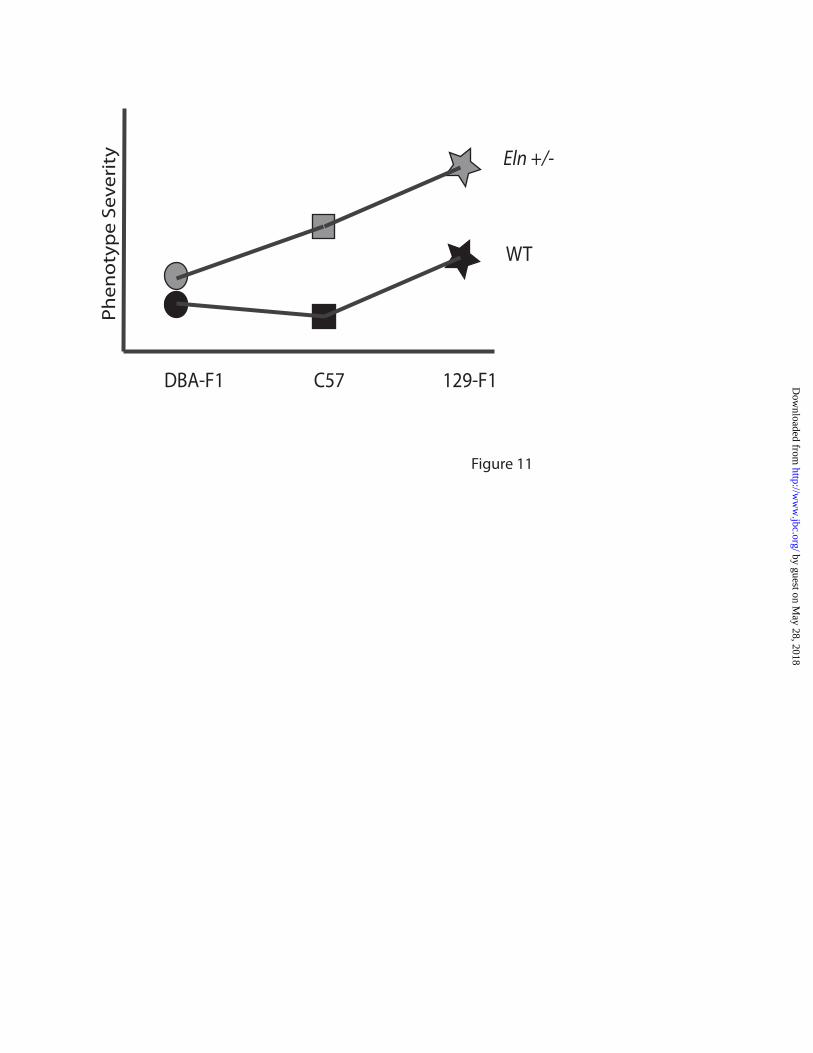
With extrinsic non-complementation, genetic alterations occur through two different pathways, but the effects of those changes combine to raise the risk of the disease phenotype. For the Eln+/-; C57x129 intercross animals, the strain effect appears largely additive with the effect of Eln heterozygosity (Figure 11). In both the WT and Eln+/- mice, the
vascular phenotype in 129-F1 animals is more severe than matched C57s. The vessels are increasingly narrow and stiff and the mice are more hypertensive. In such a model, an Eln+/- individual may experience clinically insignificant increases in blood pressure or arterial stiffness associated with decreased elastin deposition, but further aggravation of these phenotypes by polymorphisms in the 129 background could cross a threshold causing irreparable pathology and severe disease. For example, blood pressure data in our mice exhibit a continuum, where C57 WT are clearly in the normal range and the addition of either elastin haploinsufficiency or the 129 background causes a mild-moderate jump in systolic blood pressure. The combination of the 129 background with elastin haploinsufficiency, however, clearly raises blood pressure into the pathologic range.
The DBA/2J outcross, however, presents a different story. DBA-F1 Eln+/- animals appear to be protected from the alterations associated with elastin haploinsufficiency. There is no change in blood pressure or lamellar number and the change in vascular compliance is only detectable outside of the in vivo systolic and diastolic pressure range. In this case, extrinsic non-complementation in the DBA background provides a “buffering effect” (24) for elastin haploinsufficiency, creating a milder phenotype for the Eln+/- genotype (Figure 10).
To identify genomic regions that modify an elastin mutation to augment the disease state, we undertook an F2 C57Bl/6x129x1/Sv intercross. The resulting QTL analyses point to several genomic regions in which gene changes are predicted to play substantive roles in aggravating the phenotypes associated with elastin haploinsufficiency. Interestingly, the orthologous human region to the chromosome 1 blood pressure locus (EBP1), located at human 1q31 has been identified through GWAS to be associated with hypertension as well (48). Similarly, Nos1 (EBP3 and ELD4) was noted to play a dominant role in modulating vascular tone in studies in humans and mice (35,36). Additionally, work from our lab has shown elevated renin (Ren1) in Eln+/- mice relative to WT controls (17). Renin is a major component of the renin-angiotensin pathway while nitric
oxide is important for influencing vascular tone—both have known effects on blood pressure. It has been suggested that increased expression of these molecules occurs in order to maintain cardiac output through the narrower and stiffer vessels associated with elastin insufficiency (17). Since the aorta in Eln+/- mice in the 129 background is narrower and stiffer than in C57, it seems reasonable that these systems would be further upregulated in an adaptive response to this vascular pathology and may suggest a more global physiological adaptation to variations in vascular anatomy.
Previous studies in individuals with the Williams-Beuren deletion (34) have shown copy number changes in Ncf1 (EBP3) to affect the degree of hypertension in this patient population. Our data parallels the findings of that study suggest that changes in oxidative stress may alter cardiovascular function in individuals with elastin haploinisufficiency. Our findings also suggest that not only deletion of the gene, but polymorphisms within NCF1 that alter its expression may modify cardiovascular risk.
It is noted that statistical significance could not be met on all genotype comparisons using aortic tissue from the F2 animals. This is likely due to the wide variability in genetic background intrinsic to F2 animals. In addition, modifiers may cause only moderate changes in expression of target transcripts that are at the limit of that detected by real time RT-PCR technology. Consequently, further analysis of the NAPDH oxidase and other candidate pathways from a developmental perspective is imperative. Examination of the role of the these systems in modulating the effects of elastin haploinsufficiency could suggest rational therapies, akin to the use of TGF-beta antagonists in Marfan syndrome (49,50), that may minimize additional cardiovascular damage in affected individuals. Potential pathways responsible for the protective effects of the DBA/2J background are still to be determined but may harbor interesting clues about why a sizable proportion of SVAS/WS individuals bear no cardiovascular effects of their elastin gene mutation.
Overall, our mouse work recapitulates what has been described clinically in humans with WBS and SVAS; that the loss of a single
elastin gene is not sufficient to cause cardiovascular disease in all genetically affected individuals. Instead, multiple genes function in concert (and likely together with environmental effects) to alter the degree of vascular pathology an individual with elastin haploinsufficiency will face. Due to the dynamic and developmentally complex nature of elastic fiber assembly, no therapy has been identified that can restore normal elastin to those with elastin insufficiency. As a result, these individuals are at life-long risk of vascular disease due to their elastin gene
defect. Identification of new elastin-independent pathways that modulate the effects of elastin haploinsufficiency, however, may allow physicians to both stratify risk for their patients and to potentially provide novel pharmacotherapies based on those pathways; thus protecting the cardiovascular health of these individuals.
REFERENCES 1. Curran, M. E., Atkinson, D. L., Ewart, A. K., Morris, C. A., Leppert, M. F., and Keating,
M. T. (1993) Cell 73, 159-168 2. Ewart, A. K., Jin, W., Atkinson, D., Morris, C. A., and Keating, M. T. (1994) J Clin
Invest 93, 1071-1077 3. Li, D. Y., Brooke, B., Davis, E. C., Mecham, R. P., Sorensen, L. K., Boak, B. B.,
Eichwald, E., and Keating, M. T. (1998) Nature 393, 276-280 4. Morris, C. A., and Mervis, C. B. (2000) Annu Rev Genomics Hum Genet 1, 461-484 5. Pober, B. R. (2010) N Engl J Med 362, 239-252 6. Dridi, S. M., Foucault Bertaud, A., Igondjo Tchen, S., Senni, K., Ejeil, A. L., Pellat, B.,
Lyonnet, S., Bonnet, D., Charpiot, P., and Godeau, G. (2005) J Vasc Res 42, 190-201 7. Bassareo, P. P., and Mercuro, G. (2010) Blood Press Monit 15, 257-261 8. Sylos, C., Pereira, A. C., Azeka, E., Miura, N., Mesquita, S. M., and Ebaid, M. (2002)
Arq Bras Cardiol 79, 173-180 9. Broder, K., Reinhardt, E., Ahern, J., Lifton, R., Tamborlane, W., and Pober, B. (1999)
Am J Med Genet 83, 356-360 10. Pober, B. R., Johnson, M., and Urban, Z. (2008) J Clin Invest 118, 1606-1615 11. Chiarella, F., Lupi, G., Bellotti, P., Domenicucci, S., Bricarelli, F. D., and Vecchio, C.
(1989) G Ital Cardiol 19, 497-506 12. Metcalfe, K., Rucka, A. K., Smoot, L., Hofstadler, G., Tuzler, G., McKeown, P., Siu, V.,
Rauch, A., Dean, J., Dennis, N., Ellis, I., Reardon, W., Cytrynbaum, C., Osborne, L., Yates, J. R., Read, A. P., Donnai, D., and Tassabehji, M. (2000) Eur J Hum Genet 8, 955-963
13. Gauguier, D., Behmoaras, J., Argoud, K., Wilder, S. P., Pradines, C., Bihoreau, M. T., Osborne-Pellegrin, M., and Jacob, M. P. (2005) Hypertension 45, 460-466
14. Li, D. Y., Faury, G., Taylor, D. G., Davis, E. C., Boyle, W. A., Mecham, R. P., Stenzel, P., Boak, B., and Keating, M. T. (1998) J Clin Invest 102, 1783-1787
15. Wagenseil, J. E., Ciliberto, C. H., Knutsen, R. H., Levy, M. A., Kovacs, A., and Mecham, R. P. (2009) Circ Res 104, 1217-1224
16. Wagenseil, J. E., Nerurkar, N. L., Knutsen, R. H., Okamoto, R. J., Li, D. Y., and Mecham, R. P. (2005) Am J Physiol Heart Circ Physiol 289, H1209-1217
17. Faury, G., Pezet, M., Knutsen, R. H., Boyle, W. A., Heximer, S. P., McLean, S. E., Minkes, R. K., Blumer, K. J., Kovacs, A., Kelly, D. P., Li, D. Y., Starcher, B., and Mecham, R. P. (2003) J Clin Invest 112, 1419-1428
18. Feng, M., Deerhake, M. E., Keating, R., Thaisz, J., Xu, L., Tsaih, S. W., Smith, R., Ishige, T., Sugiyama, F., Churchill, G. A., and DiPetrillo, K. (2009) Hypertension 54, 802-809
19. Sugiyama, F., Churchill, G. A., Li, R., Libby, L. J., Carver, T., Yagami, K., John, S. W., and Paigen, B. (2002) Physiol Genomics 10, 5-12
20. Tomita, H., Zhilicheva, S., Kim, S., and Maeda, N. Circ Res 106, 1052-1060 21. Wheeler, F. C., Fernandez, L., Carlson, K. M., Wolf, M. J., Rockman, H. A., and
Marchuk, D. A. (2005) Mamm Genome 16, 414-423 22. Yuan, Z., Pei, H., Roberts, D. J., Zhang, Z., Rowlan, J. S., Matsumoto, A. H., and Shi, W.
(2009) Circ Cardiovasc Genet 2, 220-228 23. Massett, M. P., and Berk, B. C. (2005) Am J Physiol Regul Integr Comp Physiol 288,
R1006-1013 24. Hartman, J. L. t., Garvik, B., and Hartwell, L. (2001) Science 291, 1001-1004 25. Nagy, A., Rossant, J., Nagy, R., Abramow-Newerly, W., and Roder, J. C. (1993) Proc
Natl Acad Sci U S A 90, 8424-8428 26. Hirano E, K. R., Sugitani H, Ciliberto CH, Mecham RP. (2007) Circulation Research
101, 523-531 27. Faury, G., Maher, G. M., Li, D. Y., Keating, M. T., Mecham, R. P., and Boyle, W. A.
(1999) Am J Physiol 277, H1745-1753 28. Brown-Augsburger, P., Tisdale, C., Broekelmann, T., Sloan, C., and Mecham, R. P.
(1995) J Biol Chem 270, 17778-17783 29. Ding, C., and Cantor, C. R. (2003) Proc Natl Acad Sci U S A 100, 3059-3064 30. Lander, E., and Kruglyak, L. (1995) Nat Genet 11, 241-247 31. Zhao, H., Kalivendi, S., Zhang, H., Joseph, J., Nithipatikom, K., Vasquez-Vivar, J., and
Kalyanaraman, B. (2003) Free Radic Biol Med 34, 1359-1368 32. DeSilva, U., Elnitski, L., Idol, J. R., Doyle, J. L., Gan, W., Thomas, J. W., Schwartz, S.,
Dietrich, N. L., Beckstrom-Sternberg, S. M., McDowell, J. C., Blakesley, R. W., Bouffard, G. G., Thomas, P. J., Touchman, J. W., Miller, W., and Green, E. D. (2002) Genome Res 12, 3-15
33. Salzler, H. R., Griffiths, R., Ruiz, P., Chi, L., Frey, C., Marchuk, D. A., Rockman, H. A., and Le, T. H. (2007) Kidney Int 72, 1226-1232
34. Del Campo, M., Antonell, A., Magano, L. F., Munoz, F. J., Flores, R., Bayes, M., and Perez Jurado, L. A. (2006) Am J Hum Genet 78, 533-542
35. Capettini, L. S., Cortes, S. F., and Lemos, V. S. (2010) Eur J Pharmacol 643, 260-266 36. Melikian, N., Seddon, M. D., Casadei, B., Chowienczyk, P. J., and Shah, A. M. (2009)
Trends Cardiovasc Med 19, 256-262 37. Ehret, G. B., Munroe, P. B., Rice, K. M., Bochud, M., Johnson, A. D., Chasman, D. I.,
et.al. (2011) Nature 478, 103-109 38. Ma, X., Tittiger, M., Knutsen, R. H., Kovacs, A., Schaller, L., Mecham, R. P., and
Ponder, K. P. (2008) Mol Genet Metab 94, 298-304 39. Al Ghouleh, I., Khoo, N. K., Knaus, U. G., Griendling, K. K., Touyz, R. M., Thannickal,
V. J., Barchowsky, A., Nauseef, W. M., Kelley, E. E., Bauer, P. M., Darley-Usmar, V., Shiva, S., Cifuentes-Pagano, E., Freeman, B. A., Gladwin, M. T., and Pagano, P. J. (2011) Free Radic Biol Med
40. Lassegue, B., and Griendling, K. K. (2010) Arterioscler Thromb Vasc Biol 30, 653-661
41. Cai, H., Dikalov, S., Griendling, K. K., and Harrison, D. G. (2007) Methods Mol Med 139, 293-311
42. Cleary, E. G., Sandberg, L. B., and Jackson, D. S. (1967) J Cell Biol 33, 469-479 43. Foster, J. A., Rich, C. B., and Karr, S. R. (1983) Int Rev Connect Tissue Res 10, 65-95 44. Wagenseil, J. E., and Mecham, R. P. (2009) Physiol Rev 89, 957-989 45. Aggoun, Y., Sidi, D., Levy, B. I., Lyonnet, S., Kachaner, J., and Bonnet, D. (2000) Heart
84, 290-293 46. Lacolley, P., Boutouyrie, P., Glukhova, M., Daniel Lamaziere, J. M., Plouin, P. F.,
Bruneval, P., Vuong, P., Corvol, P., and Laurent, S. (2002) Clin Sci (Lond) 103, 21-29 47. Salaymeh, K. J., and Banerjee, A. (2001) Am Heart J 142, 549-555 48. Shi, G., Gu, C. C., Kraja, A. T., Arnett, D. K., Myers, R. H., Pankow, J. S., Hunt, S. C.,
and Rao, D. C. (2009) Hypertension 53, 35-41 49. Brooke, B. S., Habashi, J. P., Judge, D. P., Patel, N., Loeys, B., and Dietz, H. C., 3rd.
(2008) N Engl J Med 358, 2787-2795 50. Habashi, J. P., Judge, D. P., Holm, T. M., Cohn, R. D., Loeys, B. L., Cooper, T. K.,
Myers, L., Klein, E. C., Liu, G., Calvi, C., Podowski, M., Neptune, E. R., Halushka, M. K., Bedja, D., Gabrielson, K., Rifkin, D. B., Carta, L., Ramirez, F., Huso, D. L., and Dietz, H. C. (2006) Science 312, 117-121
Acknowledgements: Thanks to Marilyn Levy for the thin sectioning and staining of aortic tissues. We also thank Drs. James Cheverud, Patrick Jay and Jessica Wagenseil for their thoughtful reading of the manuscript and helpful suggestions. Sequenom genotyping was performed through the Human Genetics Division Genotyping Core at WUSM. FOOTNOTES 1Non-standard abbreviations and acronyms: C57Bl/6J/129x1/SvJ-129-F1; C57Bl/6J/DBA/2J-DBA-F1; C57Bl/6J-C57; Supravalvular aortic stenosis-SVAS. Williams-Beuren syndrome-WBS. *This research was supported by NIH T32 HD043010, K12 HL089968 and K08 HL109076 to Beth A. Kozel. Funding was also provided to Dr. Kozel by the Children’s Discovery Institute at Washington University. Dr. Kozel serves as a Scholar of the Child Health Research Center of Excellence in Developmental Biology at Washington University School of Medicine (K12-HD01487). Other funding pas provided by NIH HL074138, HL105314 and HL53325 to Robert P. Mecham. FIGURE LEGENDS Figure 1: Elastin insufficiency phenotypes are more severe in the 129-F1 background. In figures A and C black bars are used for WT animals and grey bars are used for Eln+/-. Error bars are standard error. (p<0.05 (*), p<0.001 (***)). In 1A, systolic and diastolic blood pressure for C57 and 129-F1 are shown. In both backgrounds, there is a statistically significant rise in systolic and diastolic BP between the WT and the Eln+/- animals (C57 SBP WT to Eln+/-p<0.001 and DBP p<0.05; 129-F1 SBP WT to Eln+/-p<0.001 and DBP p<0.01). Comparing between strains, 129-F1 Eln+/-s and WT mice are more hypertensive than C57 Eln+/-s and WT. In Figure 1B, pressure-volume data for the ascending aorta are shown for C57 (black) and 129-F1 (grey), WT (solid lines) and Eln+/-(dashed lines) mice. Compared to Eln genotype matched C57 controls, the 129-F1 aorta has the smallest diameter at all pressures (all statistically significant, see Supplementary Table 1 for p values). Figure 1C shows percent aortic diameter change (((ending vessel diameter (175mm Hg) - starting vessel diameter (0mm Hg)) / (starting vessel diameter))*100) for C57 and 129-F1. This data confirms that Eln+/- mice from both strains have lower compliance relative to WT and that 129-F1 Eln+/- animals are the stiffest over all.
Figure 2: DBA-F1 mice are protected from the effects of elastin haploinsufficiency. Black bars/lines are used for WT animals and grey bars/lines are used for Eln+/-. Error bars are standard error. (p<0.05 (*), p<0.01 (**), p<0.001 (***)). In 2A, systolic and diastolic blood pressure for C57 and DBA-F1 animals are shown. In the C57 background, there is a statistically significant rise in systolic and diastolic blood pressure between the WT and the Eln+/-, while DBA-F1 pressures are not significantly affected (see * on graph for p value). DBA-F1 Eln+/- systolic blood pressures are lower than C57 Eln+/- (p<0.05). The remaining C57-DBA-F1 blood pressure differences are non-significant. Figure 1B and 1C show the pressure-volume curves for the ascending aorta from WT and Eln+/- C57 (1B) and DBA-F1 (1C) animals. WT and Eln+/- C57 mice differ over the entire range of pressures while the DBA-F1 curves overlap over the operating pressures of the vessel. Figure 3: Lamellar number is unchanged in DBA-F1 mice in response to elastin insufficiency. Elastic lamellar number in the descending aorta, quantified just distal to the left subclavian are shown. Black bars/lines are used for WT animals and grey bars/lines are used for Eln+/-. Error bars are standard error. (p<0.01 (**)). There is a statistically significant increase in lamellar number between WT and Eln+/- animals in C57 and 129-F1. DBA-F1 lamellar number is unchanged. Figure 4: Cardiovascular severity does not correlate with aortic elastin content. Elastin content, expressed as a fraction of total protein is plotted in 4A. WT is black and Eln+/- mice are grey. The elastin content is decreased by approximately 50% in Eln+/- animals relative to WT (exact % shown in white overlying bars). DBA-F1 Eln+/- has the lowest relative elastin content (p<0.0001 compared to C57 WT and p<0.05 for C57 Eln+/-). Collagen levels (4B), expressed as pmol hydroxyproline content/µg total protein, trend slightly higher in Eln+/-, but are statistically unchanged between WT and Eln+/- in each strain. Figure 5: QTL for blood pressure and aortic diameter overlap the Eln locus on chromosome 5. The graphs in Figures 5A and B present the results of a chromosome wide linkage scan for systolic blood pressure (5A) and aortic diameter at 100 mm Hg (5B) in the intercross population. Chromosomes 5 SNPs are represented as tics on the x axes. The y axes depict the LOD score. Highly significant (p<0.001) linkage was determined by 1000 permutation tests. Analysis performed with no covariates shows a peak on chromosome 5 overlying the elastin (denoted ELN on the graphs) for each phenotype. LODs are between 8-10 depending on phenotype. Figure 6: QTL mapping for aortic diameter. The graphs in Figures 6A-C present the results of a linkage scan in the intercross population. Chromosome wide analysis is shown for chromosomes 1 (Figure A) and 4 (Figure B) due to the finding of retained polymorphic regions in a subset of the animals tested. Figure C depicts results following genome wide linkage analysis of ~370 F2 C57x129 progeny. Chromosomes 1 through 19 are represented numerically on the x axes. The y axes depict the LOD scores. The suggestive (p<0.32 (0.63/2)), significant (p<0.025 (0.05/2)) and highly significant (p<0.001) levels of linkage were determined by 1000 permutation tests. Proximal chromosome 9, displays highly significant linkage for aortic diameter, with a LOD scores of 8.7. A significant locus is identified on chromosome 4 and suggestive loci are also present on chromosomes 1, 5, 6, 8 and 11. Figure D shows the additive effect of the chromosome 9 peak and elastin genotype in these animals. Animals were grouped by their genotype at rs13480120 (the SNP at the peak of the chromosome 9 peak) and their elastin genotype. Animals denoted RsC57 are homozygous for the C57 background at this locus and rs129 is homozygous for 129x1/SvJ. The parental C57 WT data point (pC57, WT) is shown for comparison. Figure 7: Vascular diameter peaks on chromosomes 5 and 11 are significant only in Eln+/-. Subanalysis of Eln+/- (Figures 7A-C) and WT animals (Figures 7D-F) show the presence of significant peaks on chromosome 5 and 11 not seen in WT animals, while the chromosome 9 peak is present in both
Eln+/- and WT. On chromosome 4, the proximal peak is significant in WT animals while the distal peak is significant in the Eln+/-. Figure 8: A major locus for blood pressure maps to chromosome 1. The graphs in Figures 8A-C present the results of a linkage scan for systolic blood pressure in our intercross population. Figures A and B depict chromosome wide analysis of chromosomes 1 and 4. Figure C displays genome wide linkage of ~370 F2 C57x129 progeny. One region of the genome, chromosome 1, displays highly significant linkage to systolic blood pressure in the animals, with a LOD of 9.7. Three peaks mapping to chromosomes 4, 5 and 13 reached the suggestive level. Figure 8C shows the additive effect of the chromosome 1 peak and elastin genotype. Animals were grouped by their genotype at rs3694822 (the SNP at the peak of the chromosome 1 peak) and their elastin genotype (WT or Eln+/-). RsC57 is homozygous for the C57 background at this locus and rs129 is homozygous for 129. The parental C57 data point (pC57, WT) is shown for comparison. Figure 9: Blood pressure peak on chromosomes 5 in Eln+/-. Subanalysis of Eln+/- (Figures 9A-C) and WT animals (Figures 9D-F) shows the presence of significant peaks on chromosomes 5 and 18 not seen in WT animals, while the chromosome 1 peak is present in both Eln+/- and WT. A suggestive peak on distal chromosome 4 is present only in WT animals. Figure 10: Eln+/- aortas show evidence of increased oxidative stress and background specific expression of NAPDH oxidase complex genes. Representative sections of C57 WT and Eln+/- aortas are shown following staining with DHE (A and B) and Anti-nitrotyrosine antibody (C and D). The Eln+/- (B and D) show increased staining with both methods suggesting the presence of increased oxidative stress in these tissues. In panel E, relative expression of Ncf1 (black) and Cybb (grey) are shown. Animals are grouped by elastin genotype (WT or Eln+/-) and by genotype at rs3656108 (C57 or 129), under the chromosome 5 peak. Values are 1/(2^ΔΔCT) with data expressed relative to the C57 value. Both Ncf1 and Cybb2 are most highly expressed in rs129 Eln+/-. Intermediate values are present for rs129 WT and rsC57 Eln+/- and C57 WT have the lowest expression of these molecules. Values are mean +/- standard error. p value <0.05 for Ncf1 and p=0.07 for Cybb. Figure 11: F1 analysis reveals additive and interactive effects of genetic background on elastin haploinsufficiency. This model denotes the relative change in severity of the vascular phenotypes interrogated for the genetic backgrounds and genotypes tested here. Squares denote the parental C57 WT (black) and Eln+/- (grey) phenotypes with the Eln+/- being more severely affected in all outputs recorded than the corresponding WT. The stars represent the 129-F1 animals. In both the WT and Eln+/- case, the animals are more severely affected than the genotype matched parental strain. This suggests a largely additive effect of genetic background. Circles denote DBA-F1 animals. The model shows the DBA-F1 WT as slightly more severe than the C57 WT but only a diminutive increase in severity when the DBA-F1 becomes haploinsufficient for Eln, suggesting an interactive effect of the DBA background.
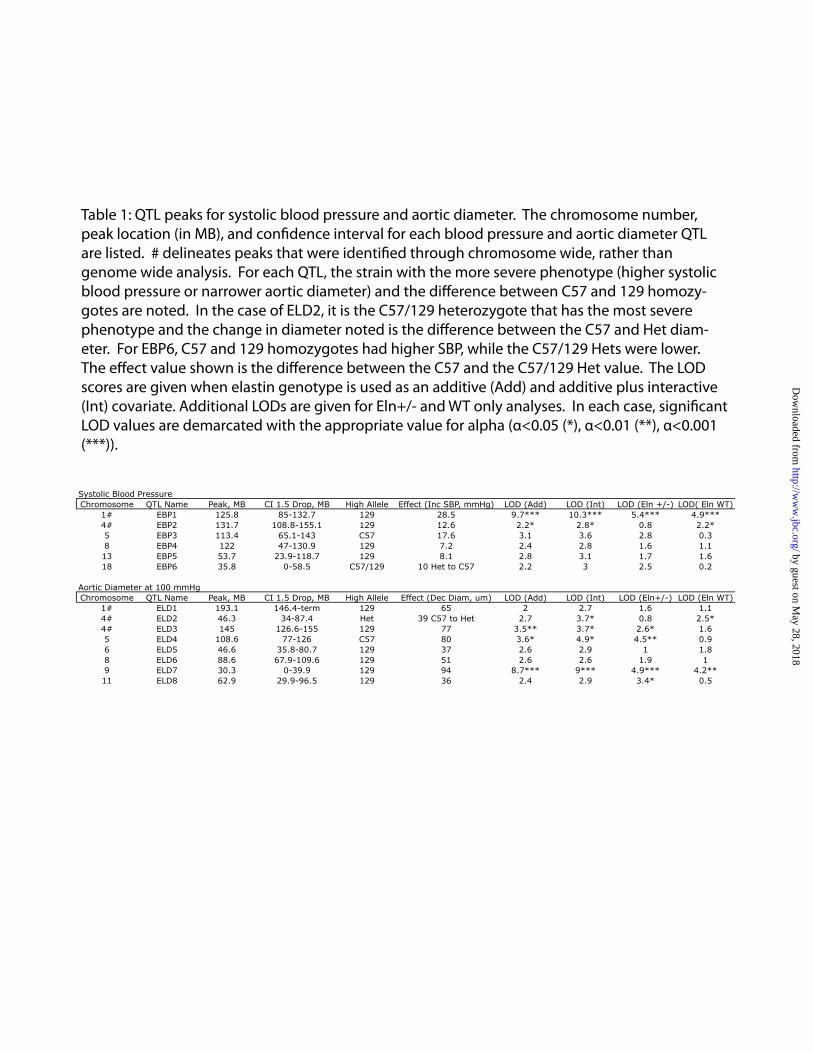
Table 1: QTL peaks for systolic blood pressure and aortic diameter. The chromosome number, peak location (in MB), and con�dence interval for each blood pressure and aortic diameter QTL are listed. # delineates peaks that were identi�ed through chromosome wide, rather than genome wide analysis. For each QTL, the strain with the more severe phenotype (higher systolic blood pressure or narrower aortic diameter) and the di�erence between C57 and 129 homozy-gotes are noted. In the case of ELD2, it is the C57/129 heterozygote that has the most severe phenotype and the change in diameter noted is the di�erence between the C57 and Het diam-eter. For EBP6, C57 and 129 homozygotes had higher SBP, while the C57/129 Hets were lower. The e�ect value shown is the di�erence between the C57 and the C57/129 Het value. The LOD scores are given when elastin genotype is used as an additive (Add) and additive plus interactive (Int) covariate. Additional LODs are given for Eln+/- and WT only analyses. In each case, signi�cant LOD values are demarcated with the appropriate value for alpha (α<0.05 (*), α<0.01 (**), α<0.001 (***)).