Telahigue, K., Hajji, T., El Cafsi, M., Saavedra, C., 2018. Genetic structure and demographic history of the endemic Mediterranean scallop Pecten jacobaeus inferred from mitochondrial 16s DNA sequence analysis. Animal Biodiversity and Conservation, 41.1: 61–73.
AbstractGenetic structure and demographic history of the endemic Mediterranean scallop Pecten jacobaeus inferred from mitochondrial 16s DNA sequence analysis. Understanding the genetic population structure of species going through population decline is primordial in implementing a management plan. In the case of Pecten jacobaeus, previous genetic studies have been limited to populations in the western Mediterranean (Spain) and the Adria-tic Sea (Italy). To check the presence of phylogeographic breaks between the two Mediterranean basins, we scored the variability of the mitochondrial 16S rRNA gene in two populations from the eastern basin (Tunisia and Greece) and pooled them with those cited above. The two newly analyzed populations shared the most frequent haplotypes with the other populations and showed no evidence of phylogeographic breaks. We found lower levels of genetic variability in the Adriatic and the Aegean populations, but not in Tunisia, with respect to the Western Mediterranean. Significant differences in pooled haplotype frequencies indicated some genetic differentiation between the pooled Chioggia and Vouliagmeni populations and the other pooled populations.
Key words: Scallop, Sequence, Genetic diversity, Population structure
ResumenEstructura genética e historia demográfica de la vieira endémica del Mediterráneo Pecten jacobaeus inferidas a partir del análisis de la secuencia del ADN mitocondrial que codifica la subunidad 16S del ARNr. Con vistas a im-plementar un plan de gestión para las especies cuyas poblaciones están menguando, es fundamental comprender la estructura genética de dichas poblaciones. En el caso de Pecten jacobaeus, los estudios genéticos previos se han limitado a analizar poblaciones situadas en el Mediterráneo occidental (España) y en el mar Adriático (Italia). Para comprobar la presencia de discontinuidades filogeográficas entre las dos cuencas del Mediterráneo, hemos estudiado la variabilidad del gen mitocondrial del ARNr 16S en dos poblaciones de la cuenca oriental (Túnez y Grecia) y la hemos analizado junto con la de las mencionadas anteriormente. Las dos poblaciones estudiadas re-cientemente compartieron los haplotipos más frecuentes con las otras y no se encontraron indicios de que exista una discontinuidad filogeográfica. Se observó un grado menor de variabilidad genética en relación con el Mediterráneo occidental en las poblaciones del Adriático y el Egeo, pero no en Túnez. Las diferencias significativas observadas cuando se agruparon los datos sobre las frecuencias haplotípicas indicaron la existencia de una cierta diferen-ciación genética entre las poblaciones de Chioggia (Italia) y Vouliagmeni (Grecia) y las de las otras poblaciones.
Palabras clave: Vieira, Secuencia, Diversidad genetica, Estructura de la población
Received: 23 II 17; Conditional acceptance: 28 IV 17; Final acceptance: 13 VI 17
Khaoula Telahigue, M’hamed El Cafsi, Physiology and Aquatic Environment, Dept. of Biology, Fac. of Sciences of Tunis, Univ. of Tunis, El Manar, 2092 Tunis, Tunisia.– Tarek Hajji, Higher Inst. of Biotechnology–Sidi Thabet, Univ. Manouba, BVBGR–LR11ES31 Biotechpole, Sidi Thabet, 2020 Ariana, Tunisia.– Carlos Saavedra, Inst. de Acuicultura de Torre la Sal–CSIC, Ribera de Cabanes, 12595 Castellon, Spain.
Scallops (family Pectinidae) are filter–feeding bivalve molluscs that live mainly on sandy gravel or gravel seabed and colonize all waters from the northern to the southern hemispheres (Gosling, 2003). Due to its high nutritional values, this group is highly prized as a food source (Caers et al., 1999; Palacios et al., 2005; Telahigue et al., 2010). Currently, more than 40 com-mercial species of scallop are exploited worldwide. The global production from fishing and aquaculture combined reached 2.5 million tonnes (FAO, 2012).
Among pectinids, the scallops of the genus Pecten are the most appreciated in Europe. Two Pecten taxa can be found on European coasts. The king scallop Pecten maximus (Linneaeus, 1758) occurs in the At-lantic, reaching the coasts of northern Africa. It enters the western end of the Mediterranean Sea, but not further than the Almeria–Oran Oceanographic front, which appears to be a barrier to dispersal of this and many other species in the region (Wilding et al., 1999; Rıos et al., 2002; Saavedra and Peña, 2004, 2005; Morvezen et al., 2016). The king scallop is replaced in the remaining part of the Mediterranean Sea by the great Mediterranean scallop Pecten jacobaeus (Linneaeus, 1758) (Rombouts, 1991). The two taxa can be easily distinguished by the shell morphology. However, genetic studies carried out with different ty-pes of genetic markers, such as allozymes, mitochon-drial DNA restriction fragment–length polymorphism, mitochondrial sequences and microsatellites, suggest that the two scallops could be races or subspecies (Wilding et al., 1999; Rıos et al., 2002; Saavedra and Peña, 2004, 2005; Morvezen et al., 2016). For clarity we will use P. jacobaeus to refer to the Mediterranean populations throughout the paper.
The great Mediterranean scallop P. jacobaeus occurs in exploitable quantities only in the northern Adriatic Sea. Fishing activities using dredges and trawls came into use in the early 1980s, and the total annual landing has since declined. After 30 years of exploiting the natural beds of this bivalve (particularly in the Adriatic Sea), stocks are now severely depleted (Pranovi et al., 2001; Katsanevakis, 2005). To manage and conserve the species, a better understanding of the genetic variability and genetic population structure is essential (Moritz, 1994; Mahidol et al., 2007).
Several studies have shown that Mediterranean marine species often exhibit important genetic diffe-rentiation between western and eastern Mediterranean populations. Such differentiation includes phylogeo-graphic breaks, attributed to the isolation of stocks due to sea level changes during the Pleistocene glaciations (Patarnello et al., 2007; Borrero–Pérez et al., 2011; Bowen et al., 2016). Quite often, genetically differentiated populations are restricted to specific regions such as the Adriatic, the Aegean, or the Gulf of Gabès (Rabaoui et al., 2011; Cordero et al., 2014).
In the case of P. jacobaeus, the data available about the genetic population structure of the species are very limited. Previous studies in this species showed relatively little genetic differentiation between popula-tions and an absence of phylogeographic subdivision
(Wilding et al., 1999; Rıos et al., 2002; Saavedra and Peña, 2004, 2005; Morvezen et al., 2016). However, most studies were based on only a few populations from the west Mediterranean Sea. Only two genetic studies in this species have considered samples from the eastern Mediterranean Sea, and these were limi-ted to a single population from the northern Adriatic (Rıos et al., 2002; Saavedra and Peña, 2005). This population showed less genetic variability than other P. jacobaeus populations from the western Mediterra-nean, but it was not possible to state if this was a local effect or a feature shared by all eastern Mediterranean populations. Moreover, no statistically significant genetic differentiation between all populations was found. But since a large part of the distribution area of the species in the Eastern Mediterranean was not sampled, a conclusion of no genetic subdivision in the species would be premature. Clearly, a genetic study based on a wider sampling of P. jacobaeus in the eastern Mediterranean is desirable to clarify the genetic structure of this taxon.
Here we present a study of the genetic structure of P. jacobaeus over a broader geographical scale than previous studies. We sampled two further populations in the eastern Mediterranean, one in the Aegean Sea (Greece) and the other in the Gulf of Tunis (Tunisia). These new samples expand the geographic area co-vered to the south and the east. We analyzed these populations together with those studied previously by Saavedra and Peña (2005), thus covering the majority of the range of P. jacobaeus. We used partial sequen-ces of the same mitochondrial 16S ribosomal RNA gene studied by the previous authors. This genetic marker is a powerful tool for measuring genetic variation and gene flow among populations (Duran et al., 2009).
Material and methods
Sample collection
A total of 35 P. jacobaeus adults of different sizes were sampled from the eastern basin (fig. 1); 22 individuals were dredged from the open sea near Kelibia in the northeastern coast of Tunisia, and 13 specimens were caught in the marine Lake Vouliagmeni, a lagoon located in the Korinthiakos Gulf, on the Aegean coast of Greece. Tissue samples (adductor muscle) from each individual were soaked in 90 % ethanol and sent to the IATS–CSIC laboratory (Castellón, Spain) where the molecular analyses procedures were carried out. Samples with ID numbers 'KEL 1 to 22' and 'VOU 1 to 13' are kept at the IATS–CSIC laboratory and are available upon request to the corresponding author.
DNA extraction, amplification and sequencing
Total DNA was extracted by a salt extraction protocol (Miller et al., 1988). We used primer Pec16S–F1 (5'GTTTTAAGGTCGGGGAAAG–3') (Saavedra and Peña, 2005) designed from the complete P. maximus 16S rRNA sequence deposited in GenBank (accession no. X92688) and reverse primer 16Sbr of Palumbi
Animal Biodiversity and Conservation 41.1 (2018) 63
(1996) (5'CCGGTCTGAACTCAGATCACGT–3') to amplify a fragment of 512 base pairs (bp) of the mitochondrial 16S rRNA gene.
Amplifications were done in 20 µL reaction volume containing 1 µL template DNA (~ 500 ng), 0.2 mM of each dNTP, 0.8 µM of each primer, 1.5 mM of MgCl2, and 0.15 U Taq polymerase (GIBCO–Life Technolo-gies) in the buffer supplied by the manufacturer. PCR was performed using the following parameters: after an initial denaturation at 95 °C for 4 min, the PCR mix was subjected to 35 cycles consisting of a 1 min step at 95 °C, a 30 s step at 55 °C followed by a 30 s step at 72 °C, and a final extension of 3 min at 72 °C. PCR products were purified with the QiaQuick PCR kit (QIAGEN), and sequenced in an ABI 377 automatic sequencer by using the Big Dye Terminator chemistry in the DNA Sequencing Service of the University of Valencia (Spain). Sequences were edited in BioEdit 7.2.5 (Hall, 1999) and aligned with Clustal W (Thomp-son et al., 1994), as implemented in BioEdit.
Genetic analyses
Our data were analyzed together with sequences from three other populations, two from the western Medite-rranean (CAS and VAL) and one from the Adriatic Sea (CHI) (Saavedra and Peña 2005). Genetic diversity
was estimated for each population with the software DnaSP 5.10.01 (Librado and Rozas, 2009) using se-veral indices, such as the number of haplotypes (h), haplotype diversity (H), number of segregating sites (SS), and nucleotide diversity (θπ). A median–joining (MJ) network was constructed to visualize genetic relationships between mtDNA haplotypes with Network 5.0 software (Bandelt et al., 1999).
Differences in haplotype frequencies between populations were tested using the x²–test (Preacher, 2001). For population structure analysis, we used the Arlequin version 3.5.2.2 program (Fu, 1997) to estimate pairwise FST–values (Ramos–Onsins and Rozas, 2002) for each population pair using haplotype frequencies. Significance of all pairwise values was measured using 10,000 permutations and assessed using correction for multiple tests under Arlequin. We also applied the same software to examine the distribution of genetic variability into hierarchical levels through Analysis of Molecular Variance (AMOVA) within and between P. jacobaeus populations. Nei’s genetic distances (Nei, 1972, 1979) were computed from haplotype frequencies and used for constructing a tree showing the similarities between population samples by the Neighbor Joining Method (Saitou and Nei, 1987).
To infer the historical demography, DnaSP was used to conduct neutrality tests of Tajima’s D (Tajima,
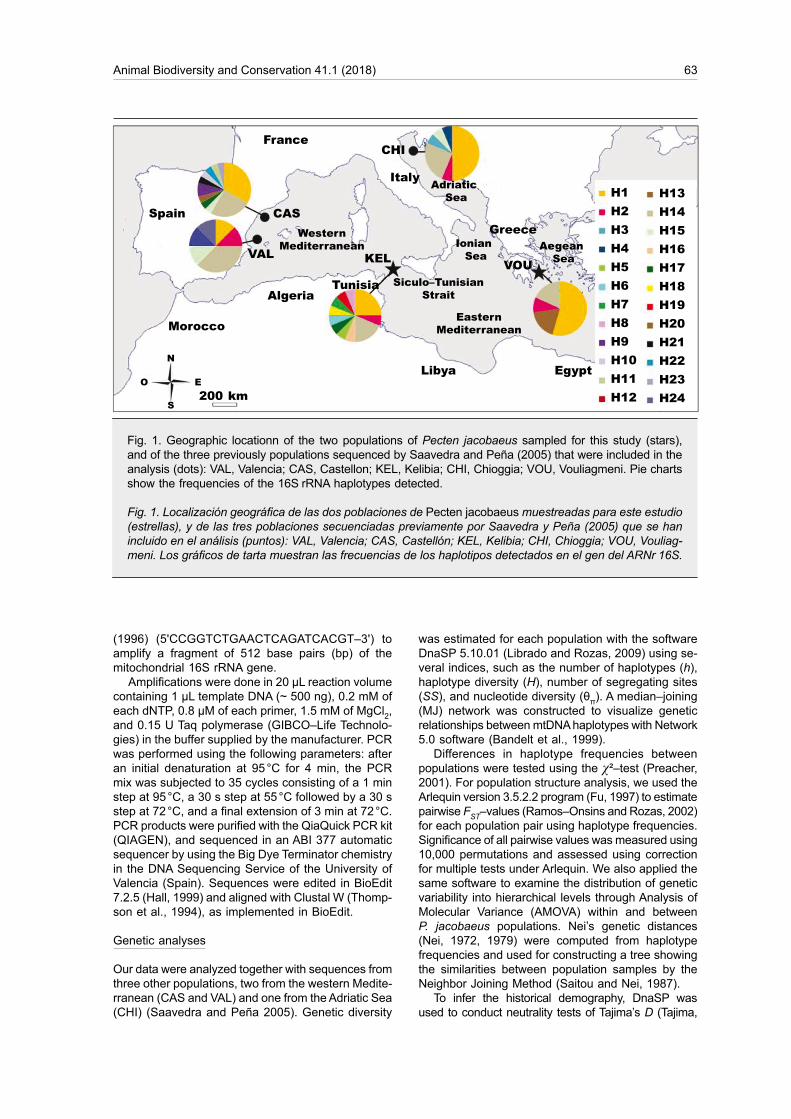
Fig. 1. Geographic locationn of the two populations of Pecten jacobaeus sampled for this study (stars), and of the three previously populations sequenced by Saavedra and Peña (2005) that were included in the analysis (dots): VAL, Valencia; CAS, Castellon; KEL, Kelibia; CHI, Chioggia; VOU, Vouliagmeni. Pie charts show the frequencies of the 16S rRNA haplotypes detected.
Fig. 1. Localización geográfica de las dos poblaciones de Pecten jacobaeus muestreadas para este estudio (estrellas), y de las tres poblaciones secuenciadas previamente por Saavedra y Peña (2005) que se han incluido en el análisis (puntos): VAL, Valencia; CAS, Castellón; KEL, Kelibia; CHI, Chioggia; VOU, Vouliag-meni. Los gráficos de tarta muestran las frecuencias de los haplotipos detectados en el gen del ARNr 16S.
H1H2H3H4H5H6H7H8H9H10H11H12
H13H14H15H16H17H18H19H20H21H22H23H24
CHI
VOU
CAS
VAL KEL
WesternMediterranean
Adriatic Sea
Aegean Sea
EasternMediterranean
Algeria
Morocco
Spain
France
Italy
Greece
Tunisia Siculo–TunisianStrait
Libya Egypt
Ionian Sea
200 km
N
O E
S
64 Telahigue et al.
1989), Fu's FS (Fu, 1997) and Ramos–Onsins and Rozas'R2 (Ramos–Onsins and Rozas, 2002) to detect whether there was any deviation from the assumption of neutrality, which would indicate a recent population expansion. Tajima's D is widely used in neutrality tests. It is known that 'D' is based on the comparison of two different estimates of genetic diversity (Ɵ and π). 'D' is expected to be equal to 0 under the neutral equilibrium model. A significant negative value indicates an excess of rare variants as expected under positive selection. It can also reflect a demographic event such as population expansion. A significant positive 'D' value, in contrast, indicates an excess of intermediate frequency variants reflecting balancing selection or diversifying selection. It can also reflect population structure or bottleneck events (Oleksyk et al., 2010; Camus–Kulandaivelu et al., 2014) Fu’s FS and the Ramos–Onsins and Rozas R2–test were confirmed to be the most powerful tools in examining population growth (Ramos–Onsins and Rozas, 2002). The latter was proven to be particularly sensitive for limited sample sizes (Ramos–Onsins and Rozas, 2002). P–values for neutrality statistics were ob-tained by coalescent simulations with 10,000 replicates.
A goodness of fit test was performed to test the validity of the sudden expansion model using a para-metric bootstrap approach based on the sum of square deviations (SSD) between the observed and expected mismatch distributions. The raggedness index, which measures the smoothness of the mismatch distribution, was calculated for each distribution. Small raggedness values represent a population that has experienced sudden expansion whereas higher values of the rag-gedness index suggest a stationary population or a population that has experienced a bottleneck.
The demographic expansion parameters tau (τ), Ɵ0 and Ɵt based on the mismatch distribution outputs from Arlequin were estimated under a demographic expansion hypothesis by a generalized non–linear least–square approach (Schneider and Excoffier, 1999). The time since the expansion (t) was estimated using the Li's formula (Li, 1977): t = τ/2u, where u is the mutation rate per sequence per generation (Schneider and Excoffier, 1999; Rogers, 1995). We adopted the mutation rate of 1.22 x 10⁻⁶ proposed by Saavedra and Peña (2005) for the same species and same gene fragment, which is based on fossil calibration.
Finally, mismatch distributions of P. jacobaeus po-pulations were performed using DnaSP to test whether demographic processes were consistent with the mismatch distribution test statistics. The distribution is usually multimodal in samples drawn from populations at demographic equilibrium, whereas populations that have gone through a recent demographic expansion are expected to be unimodal (Harpending, 1994).
Results
Sequence variation and haplotype diversity
Sequences of a 512 base pair fragment of the 16S rRNA gene were obtained for 27 individuals from VOU and KEL. The obtained sequences were pooled
with 48 sequences from the populations VAL, CAS and CHI from the study of Saavedra and Peña (2005). Polymorphism was detected at 25 sites: 24 substitu-tions and two indels (insertion/deletion). Among the substitutions, we identified four transversions and 21 transitions, two sites showed multiple substitutions that allowed detection in twenty–four haplotypes (table 1). Table 2 shows haplotype frequencies. Six-teen haplotypes were previously found by Saavedra and Peña (2005), and eight are new sequences found in KEL and VOU. The sequences of the new haplotypes have been deposited in GenBank under accessions MF183948–MF183955. Among the scored haplotypes, only two (H1 and H4) were common to all studied populations, together representing 60 % of the total number of obtained sequences. Among these common haplotypes, haplotype H1 was the most frequent. The remaining haplotypes (71 % of total number of haplotypes) were present in a single population (private), with the exception of haplotypes H3, H6 and H10, which appeared in four (VAL, KEL, CHI, VOU), three (VAL, CAS, CHI) and two (CAS, KEL) populations, respectively. Figure 1 shows the geographical distribution of all recorded haplotypes and their respective frequencies per site . The median joining haplotype network (fig. 2) showed two central haplotypes (H1 and H4) linked by four low frequency haplotypes and 17 other haplotypes differing from the central ones by 1–4 mutations. No obvious pattern of haplotype distribution across geographical locations is apparent.
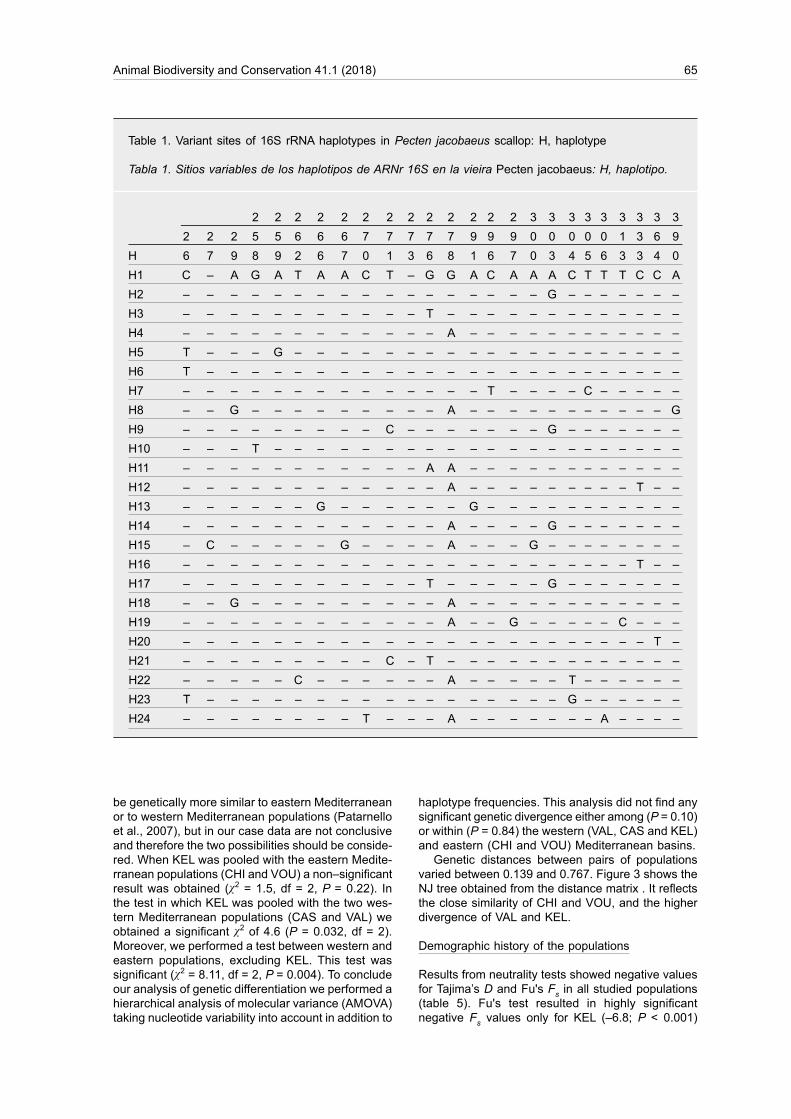
Table 3 shows estimates of gene diversity. Overall, all populations displayed high values of haplotype diversity and low values of nucleotide diversity, as is typical in this species (Saavedra and Peña, 2005). The two populations from the eastern Mediterranean (CHI and VOU) presented the lowest values of haplo-type diversity (0.717–0.691) and nucleotide diversity (0.00223–0.00164), while the highest values were observed in KEL (0.925 and 0.0044).
Population genetic differentiation
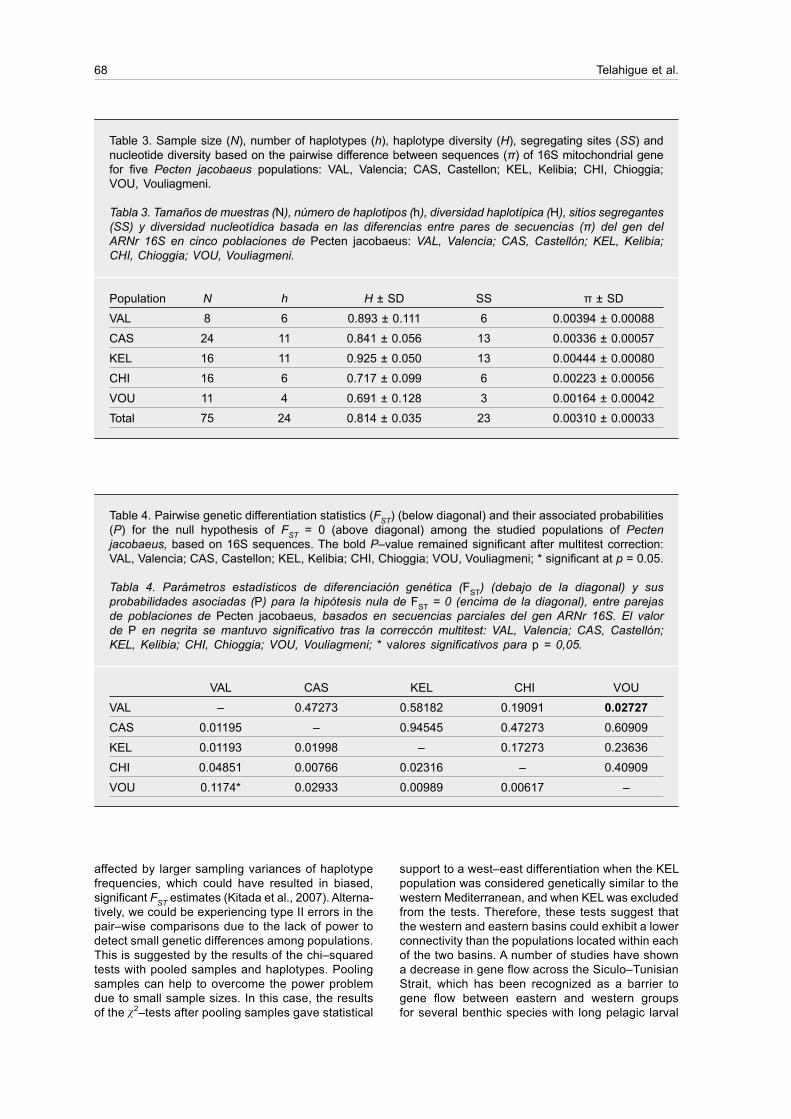
We quantified the inter–population genetic diver-gence in haplotype frequencies using the pairwise population differentiation statistic (FST). The estimated FST–values varied between 0.006 and 0.117, and were not significant (even with correction for multi-ple tests), except for the comparison between VOU and VAL (table 4). Since low sample sizes and high haplotype numbers could interfere with statistical detection of genetic differentiation, we performed 2 x 2 contingency x2–test after pooling the less fre-quent haplotypes all together, and pooling populations according to their location on the Western or on the Eastern Mediterranean. We carried out two tests that differed in pooling of the Tunisian population of KEL alternatively with the western or with the eastern Mediterranean populations. The rationale for this is that this population is geographically located in the Siculo–Tunisian Strait, just in the area of separation of the two Mediterranean basins. In studies of other species the populations from this region turned out to
Animal Biodiversity and Conservation 41.1 (2018) 65
be genetically more similar to eastern Mediterranean or to western Mediterranean populations (Patarnello et al., 2007), but in our case data are not conclusive and therefore the two possibilities should be conside-red. When KEL was pooled with the eastern Medite-rranean populations (CHI and VOU) a non–significant result was obtained (x2 = 1.5, df = 2, P = 0.22). In the test in which KEL was pooled with the two wes-tern Mediterranean populations (CAS and VAL) we obtained a significant x2 of 4.6 (P = 0.032, df = 2). Moreover, we performed a test between western and eastern populations, excluding KEL. This test was significant (x2 = 8.11, df = 2, P = 0.004). To conclude our analysis of genetic differentiation we performed a hierarchical analysis of molecular variance (AMOVA) taking nucleotide variability into account in addition to
haplotype frequencies. This analysis did not find any significant genetic divergence either among (P = 0.10) or within (P = 0.84) the western (VAL, CAS and KEL) and eastern (CHI and VOU) Mediterranean basins.
Genetic distances between pairs of populations varied between 0.139 and 0.767. Figure 3 shows the NJ tree obtained from the distance matrix . It reflects the close similarity of CHI and VOU, and the higher divergence of VAL and KEL.
Demographic history of the populations
Results from neutrality tests showed negative values for Tajima’s D and Fu's Fs in all studied populations (table 5). Fu's test resulted in highly significant negative Fs values only for KEL (–6.8; P < 0.001)
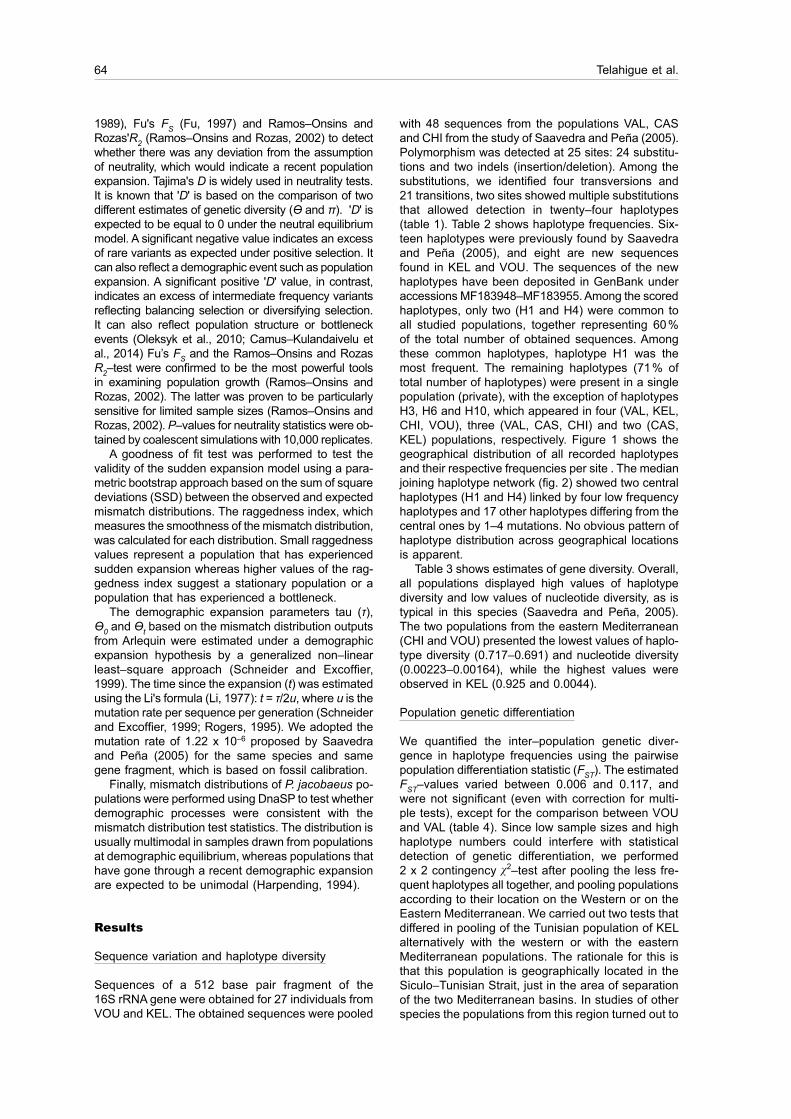
Table 1. Variant sites of 16S rRNA haplotypes in Pecten jacobaeus scallop: H, haplotype
Tabla 1. Sitios variables de los haplotipos de ARNr 16S en la vieira Pecten jacobaeus: H, haplotipo.
(Tajima, 1989), purifying selection, and a recruitment of rare alleles from the western or eastern basins.
Figure 4 shows the mismatch frequency spectra for the two populations (KEL, VOU). The studied populations showed a positive skewed unimodal dis-tribution and supported the hypothesis of the sudden expansion model.
None of the sums of squared deviations (SSD) of mismatch distribution (table 6) was significant, indicat-ing that the curves fit the sudden expansion model tested. The significant fit between the observed and the expected distributions was also confirmed by the low and not significant raggedness index values for all studied populations. We noted that the VOU popula-tion was distinguished from the other populations with a higher but non–significant Rg value (0.23702). These results were further confirmed by the Ramos–Onsins and Rozas test R2. This test gave significant results, rejecting the null hypothesis of constant size and supporting a recent demographic expansion.
The tau value (τ), which reflects the location of the mismatch distribution crest, provided a rough esti-mation of the time when rapid population expansion started. The observed values of the age expansion parameter (τ) were very close between KEL and VAL (2.250 and 2.695 respectively) suggesting a similar timing of demographic events. In comparison, CHI and VOU showed the lowest τ (0.71). Estimates of ϴ0 and ϴ1 indicated that all studied populations expanded from a very small (close to 0 in almost cases) to a very large size (table 6). The results for the pooled western Mediterranean samples are in the same line. Assuming the mutation rate of 1.22 x 10⁻⁶ for 16S gene and the equation τ = 2ut, the time of expansion for P. jacobaeus populations likely occurred approximately between 1.10 myr and 0.29 myr before present for VAL and CHI respectively.
Discussion
By sampling two populations of P. jacobaeus from Tunisia and Greece, we have increased the number of populations available for the genetic study in the eastern Mediterranean from one to three, and we have also extended the sampled area by ~1,000 km. We studied a total of five populations, two in the west Me-diterranean and three in the eastern Mediterranean. This allowed a comparison between the two basins with acceptable rigor.
The first interesting result of our study is that the 16S haplotype network did not show new clades, in contrast with the network described by Saavedra and Peña (2005), after adding the new populations. This confirms the absence of a phylo-geographic break between the two basins that was suggested in the previous study by Saavedra and Peña (2005); however, we note that this does not completely eliminate the possibility of a phylogeo-graphic subdivision in the Mediterranean scallop. For example, in the carpet–shell clam, Cordero et al. (2014) found two mitochondrial clades, but the less frequent cladewas restricted to the northern Aegean
Table 2. The haplotype frequencies of 16S rRNA gene in five Pecten jacobaeus populations: h, haplotype; VAL, Valencia; CAS, Castellon; KEL, Kelibia; CHI, Chioggia; VOU, Vouliagmeni.
Tabla 2. Frecuencias haplotípicas del gen ARNr 16S en cinco poblaciones de Pecten jacobaeus: h, haplotipo; VAL, Valencia; CAS, Castellón; KEL, Kelibia; CHI, Chioggia; VOU, Vouliagmeni.
and CAS (–5.9; P < 0.001) populations. However, Tajima’s test showed no significant negative D values for all populations except for the KEL sample (1.8; P < 0.001). The overall negative values resulting from both tests pointed towards an excess of low frequency polymorphisms in relative to expectation. Since the western Mediterranean populations were genetically homogeneous, we carried out the same tests poo-ling the three samples from this region. The results show a clear deviation from neutrality (D and Fs) and demographic instability (R2). Potential explanations include population size expansion, positive selection
Animal Biodiversity and Conservation 41.1 (2018) 67
and Turkey. Therefore, sampling of the easternmost coasts of the Mediterranean, especially the Aegean Sea, would be necessary to be conclusive in the case of the scallop.
Saavedra and Peña (2005) also found no signifi-cant differentiation in haplotype frequencies between the three P. jacobaeus populations that they studied. We found essentially the same result after adding two eastern Mediterranean populations, as indicated by the non–significant pairwise FST estimates. How-ever, there was an exception in the comparison of VOU with respect to VAL, which gave a significant FST value of 0.11. This is a relatively high value for a marine species with a planktonic larval stage that lasts for several weeks. Genetic divergence in this case could be the result of the long geographic dis-tance (3,000 km) that separates these two localities, but the lack of significant differentiation between CAS (which is very close to VAL) and VOU casts
Fig. 2. Median joining haplotype network of the 24 haplotypes determined in Pecten jacobaeus specimens at the 16S mitochondrial gene. The circle areas are proportional to haplotype frequency and the lines connecting haplotypes represent one step mutationt. The locations of the haplotypes are indicated in color according to the codes in the legend.
Fig. 2. Red de unión de medianas de los 24 haplotipos determinados en los especímenes de Pecten jacobaeus en el gen mitocondrial del ARNr 16S. El área de los círculos es proporcional a la frecuencia de los haplotipos y las líneas que conectan los haplotipos representan una mutación. La localización de los haplotipos se indica con un código de colores (véase la leyenda).
doubt on this explanation, and other explanations should be sought. The VOU sample was taken from Lake Vouliagmeni, which originated ca. 2,000 years ago (Papapetrou–Zamanis, 1969). The lake was originally brackish, as indicated by the fossil fauna recovered, but a channel was open some 100 years ago to connect the lake with the sea and the fauna of the lake was replaced by typically marine species (Vardala–Theodorou and Nicolaidu, 2007). It is at that time when the origin of the VOU scallop population can be established. Since the area of the lake is small (1.8 km long), it is most likely that the population size is small. Consequently, genetic drift should be an important factor acting on the genetic pool of this population and could increase its ge-netic differentiation over levels typical of open sea populations. On the other hand, the VOU and VAL samples were the smallest in our study, and there-fore another possibility is that these samples were
KelibiaVouliagmeniCastellonChioggiaValencia
H1
H2
H3
H4
H5H6
H7H8
H9
H10
H11
H12
H13
H14
H15
H16 H17
H18
H19
H20
H21
H22
H23
H24
68 Telahigue et al.
affected by larger sampling variances of haplotype frequencies, which could have resulted in biased, significant FST estimates (Kitada et al., 2007). Alterna-tively, we could be experiencing type II errors in the pair–wise comparisons due to the lack of power to detect small genetic differences among populations. This is suggested by the results of the chi–squared tests with pooled samples and haplotypes. Pooling samples can help to overcome the power problem due to small sample sizes. In this case, the results of the x2–tests after pooling samples gave statistical
Table 3. Sample size (N), number of haplotypes (h), haplotype diversity (H), segregating sites (SS) and nucleotide diversity based on the pairwise difference between sequences (π) of 16S mitochondrial gene for five Pecten jacobaeus populations: VAL, Valencia; CAS, Castellon; KEL, Kelibia; CHI, Chioggia; VOU, Vouliagmeni.
Tabla 3. Tamaños de muestras (N), número de haplotipos (h), diversidad haplotípica (H), sitios segregantes (SS) y diversidad nucleotídica basada en las diferencias entre pares de secuencias (π) del gen del ARNr 16S en cinco poblaciones de Pecten jacobaeus: VAL, Valencia; CAS, Castellón; KEL, Kelibia; CHI, Chioggia; VOU, Vouliagmeni.
Population N h H ± SD SS π ± SD
VAL 8 6 0.893 ± 0.111 6 0.00394 ± 0.00088
CAS 24 11 0.841 ± 0.056 13 0.00336 ± 0.00057
KEL 16 11 0.925 ± 0.050 13 0.00444 ± 0.00080
CHI 16 6 0.717 ± 0.099 6 0.00223 ± 0.00056
VOU 11 4 0.691 ± 0.128 3 0.00164 ± 0.00042
Total 75 24 0.814 ± 0.035 23 0.00310 ± 0.00033
Table 4. Pairwise genetic differentiation statistics (FST) (below diagonal) and their associated probabilities (P) for the null hypothesis of FST = 0 (above diagonal) among the studied populations of Pecten jacobaeus, based on 16S sequences. The bold P–value remained significant after multitest correction: VAL, Valencia; CAS, Castellon; KEL, Kelibia; CHI, Chioggia; VOU, Vouliagmeni; * significant at p = 0.05.
Tabla 4. Parámetros estadísticos de diferenciación genética (FST) (debajo de la diagonal) y sus probabilidades asociadas (P) para la hipótesis nula de FST = 0 (encima de la diagonal), entre parejas de poblaciones de Pecten jacobaeus, basados en secuencias parciales del gen ARNr 16S. El valor de P en negrita se mantuvo significativo tras la correccón multitest: VAL, Valencia; CAS, Castellón; KEL, Kelibia; CHI, Chioggia; VOU, Vouliagmeni; * valores significativos para p = 0,05.
support to a west–east differentiation when the KEL population was considered genetically similar to the western Mediterranean, and when KEL was excluded from the tests. Therefore, these tests suggest that the western and eastern basins could exhibit a lower connectivity than the populations located within each of the two basins. A number of studies have shown a decrease in gene flow across the Siculo–Tunisian Strait, which has been recognized as a barrier to gene flow between eastern and western groups for several benthic species with long pelagic larval
Animal Biodiversity and Conservation 41.1 (2018) 69
This leads to the hypothesis that the influence of the Atlantic populations contributes to the observed patterns. The Atlantic influence can result from gene flow facilitated by the current that enters the western Mediterranean from the Atlantic and flows eastward along the northern coasts for Africa, past the Alme-ria–Oran front (Millot and Taupier–Letage, 2005).
The second interesting result of our study regards the levels of intra–population genetic variability. Saavedra and Peña (2005) described lower levels of genetic variability in the Adriatic population (CHI) than in the western Mediterranean populations (VAL and CAS). We found that the Aegean population (VOU) shares this feature with CHI, but that the Tunisian population (KEL) does not, and that it currently shows the highest levels of variability. The high level of genetic variability observed in KEL contrasts with the other two eastern Mediterranean populations, which show only half or a quarter of the nucleotide variability found in the Tunisian population. A number of factors could contribute to this result. One factor could be a gene diversity input from the Atlantic and western Mediterranean favored by the North African current, which flows from the Atlantic to the eastern Mediterranean along the North African coast (Patarnello et al., 2007). This possibility is supported by the x2–test of genetic differentiation with pooled populations and haplotypes, which suggest a high-er similarity of KEL to the western Mediterranean populations. In other species, the populations of the northern Tunisian coasts often show similarities to the western Mediterranean populations (Bahri–Sfar et al., 2000; Cordero et al., 2014). Furthermore, the apparent west–east cline for the two most common haplotypes, the highest amount of private haplotypes and genetic variability recorded for the western pop-ulations may suggest that the western populations
Fig. 3. Unrooted neighbor joining tree showing the genetic differences between populations, based on Nei's genetic distances computed from haplotype frequencies. Significant bootstrap values are also indicated.
Fig. 3. Árbol de unión de vecinos sin raíz que muestra las diferencias genéticas entre pobla-ciones, basado en las distancias genéticas de Nei calculadas a partir de las frecuencias haplotípicas. Se indican también los valores de bootstrap significativos.
Table 5. Statistical tests of neutrality and estimates of demographic parameters in populations of Pecten jacobaeus, based on partial sequences of the 16S rRNA gene: VAL, Valencia; CAS, Castellon; KEL, Kelibia; CHI, Chioggia; VOU, Vouliagmeni; WM, West Mediterranean (pooled VAL, CAS, KEL) (* P < 0.05 ** P < 0.001).
Tabla 5. Pruebas estadísticas de neutralidad y estimaciones de los parámetros demográficos en poblaciones de Pecten jacobaeus, basados en secuencias parciales del gen ARNr 16S: VAL, Valencia; CAS, Castellon; KEL, Kelibia; CHI, Chioggia; VOU, Vouliagmeni; WM, Mediterráneo occidental (agrupación VAL, CAS, KEL) (* P < 0,05 ** P < 0,001).
Mismatch SSD (P) Tajima's D Fs Rg (P) R2
VAL 2.500 0.033 (0.35) –0.63262 –2.050 (0.057) 0.03444 (0.940) 0.177**
CAS 1.834 0.002 (0.65) –1.76498 –5.866 (0.001)** 0.04513 (0.280) 0.123**
KEL 2.258 0.001 (0.97) –1.80726** –6.830 (0.001)** 0.05201 (0.230) 0.141**
CHI 1.367 0.006 (0.53) –1.27752 –1.742 (0.089) 0.04611 (1.000) 0.137**
stages (Nikula and Vainola, 2003; Zitari–Chatti et al., 2009; Tir et al., 2014). However, the NJ tree based on Nei distances shows that the genetic differentia-tion increases on approaching the Strait of Gibraltar.
70 Telahigue et al.
are ancestral and are the source of the eastern populations, with KEL representing an intermediate transition sample between the twoh basins. Another factor could be that the Adriatic and Aegean pop-ulations have been affected by population–specific events that resulted in lower effective population size (Ne) and subsequently in the loss of intrapopulation diversity. The smaller Ne in the Adriatic could be caused by a restriction of available habitat during the glacial epoch, present–day geographic isolation, or historical demographic instability. The Adriatic Sea disappeared almost completely during the last glacial maximum (ca. 18.00 years BP) (Lambeck and Purcell, 2005), and the scallop populations now living in the northern Adriatic certainly derive from a recolonization process which might have resulted in lower genetic variability. Finally, fishing could affect variability levels through its effect on the effective population size. The Adriatic scallop population is the most exploited in the Mediterranean Sea. Several authors have reported large fluctuations of popula-tions and landings of this scallop over the past 50 years (Orel et al., 1993; Mattei and Pellizzato, 1996). Overexploitation activities could cause bottleneck ef-fects and alter genetic diversity within populations, as recorded in several commercially exploited scallops (Saavedra and Peña, 2004; Gaffney et al., 2010; Bert et al., 2011).
Low variability in the VOU population could have resulted from a founder effect and a bottleneck occur-
Fig. 4. Observed and expected pairwise mismatch distributions in the two Pecten jacobaeus populations (VOU and KEL) under the sudden population expansion model. The number of pairwise nucleotide differences between haplotypes is represented on the abscissa whereas their frequencies are represented on the ordinate axis: KEL, Kelibia; VOU. Vouliagmeni.
Fig. 4. Distribuciones de desajuste observadas y esperadas en las dos poblaciones de Pecten jacobaeus muestreadas (VOU y KEL), utilizando el modelo de expansión súbita. El número de diferencias nucleotí-dicas entre pares de haplotipos se representa en el eje de abscisas mientras que sus frecuencias se representan en el eje de ordenadas: KEL, Kelibia; VOU, Vouliagmeni.
rind at the moment the population became established a century ago, and could have subsequently reduced Ne. Several studies have recorded low intrapopulation diversity in bivalves that have experienced severe genetic drift due to bottlenecking and/or founder events (Jordaens et al., 2000; Tarnowska et al., 2010; Barbieri et al., 2015). According to Hanzawa et al. (2012), the founder events when the marine lakes were formed must have affected the genetic diversity of the present populationy. The higher value of R2 and lower t showed by VOU in the demographic analysis support this view.
In conclusion, our study has clearly determined the absencecof a phylogeographic subdivision bet-ween the western and the eastern Mediterranean populations of P. jacobaeus, and has shown that the populations from the northern coasts of the eastern Mediterranean have lower genetic variability levels due to local historical events that wouldd have affec-ted their Ne. The possibility of a phylogeographic subdivision in the easternmost populations (Aegean Sea, Levantine Sea) remains to be explored. The use of 16S rRNA or other mitochondrial marker could be a nice tool for this. However, the increasing availability of nuclear markers in this species will be of great help for this purpose. In their study on the carpet–shell clam (Cordero et al., 2014) observed, a high homogeneity across the Atlantic, the western Mediterranean and the eastern Mediterranean at the mitochondrial marker. However, the study of
Animal Biodiversity and Conservation 41.1 (2018) 71
References
Bahri–Sfar, L., Lemaire, C., Hassine, O. K., Bonhom-me, F., 2000. Fragmentation of sea bass popula-tions in the western and eastern Mediterranean as revealed by microsatellite polymorphism. Pro-ceedings of the Royal Society of London Series B, Biological Sciences, 267(1446): 929–935.
Bandelt, H. J., Forster, P., Röhl, A., 1999. Median–join-ing networks for inferring intraspecific phylogenies. Molecular Biology and Evolution, 16(1): 37–48.
Barbieri, M., Deidun, A., Maltagliati, F., Castelli, A., 2015. A contribution to the phylogeography of Pinctada imbricata radiata (Leach, 1814) (Bivalvia: Pteriidae) from the Eastern Mediterranean Sea by means of the mitochondrial COI marker. Italian Jour-nal of Zoology, 83(1): 113–120.
Bert, T. M., Arnold, W. S., McMillen–Jackson, A. L., Wilbur, A. E., Crawford, C., 2011. Natural and anthropogenic forces shape the population genetics and recent evolutionary history of eastern United States bay scallops (Argopecten irradians). Journal of Shellfish Research, 30(3): 583–608.
Borrero–Pérez, G. H., González–Wangüemert, M., Marcos, C., Pérez–Ruzafa, A., 2011. Phylogeogra-phy of the Atlanto–Mediterranean sea cucumber (Holothuria mammata): The combined effects of historical processes and current oceanographical pattern. Molecular Ecology, 20(9): 1964–1975.
Bowen, B. W., Gaither, M. R., DiBattista, J. D., Iacchei, M., Andrews, K. R., Grant, W. S., Toonen, R. J., Briggs, J. C., 2016. Comparative phylogeography of the Ocean Planet. Proceedings of the Natio-nal Academy of Sciences of the USA, 113(29): 7962–7969.
Caers, M., Coutteau, P., Cure, K., Morales, V., Gajardo, G., Sorgeloos, P., 1999. The Chilean scallop Argopecten purpuratus (Lamarck, 1819): II. Manipulation of the fatty acid composition and lipid content of the eggs via lipid supplementation of the broodstock diet. Comparative Biochemis-try and Physiology Part B: Biochemistry and Molecular Biology, 123(1): 97–103.
Camus–Kulandaivelu, L., Favreau, B., Ueno, S., Przybyla, J., Bouvet, J.–M., 2014. Impact of natural selection on lignin and cellulose candidate genes in a natural population of Eucalyptus urophylla. Open Journal of Ecology, 4: 1128–1150.
Cordero, D., Peña, J. B., Saavedra, C., 2014. Phylo-geographic analysis of introns and mitochondrial DNA in the clam Ruditapes decussatus uncovers the effects of Pleistocene glaciations and endoge-nous barriers to gene flow. Molecular Phylogenetics and Evolution, 71: 274–287.
Duran, C., Appleby, N., Edwards, D., Batley, J., 2009. Molecular genetic markers: discovery, applications, data storage and visualisation. Current Bioinfor-matics, 4: 16–27.
FAO, 2012. FAO Statistics. Available at http://www.fao.org/fishery/statistics/en.
Fu, Y. X., 1997. Statistical tests of neutrality of mu-tations against population growth, hitchhiking, and background selection. Genetics, 147(2): 915–925.
Table 6. Parameters for Pecten jacobaeus populations obtained from mismatch distribution analyses: age of expansion in units of mutational time (τ), population size before (ϴ0) and after (ϴ1) the expansion in units of mutational time and time since expansion expressed in million years t: VAL, Valencia; CAS, Castellon; KEL, Kelibia; CHI, Chioggia; VOU, Vouliagmeni; WM, West Mediterranean (pooled VAL, CAS, KEL).
Tabla 6. Parámetros de los análisis de la distribución del desajuste de secuencias entre poblaciones de Pecten jacobaeus: edad de la expansión en unidades de tiempo mutacional (τ), tamaño de la población antes (ϴ0) y después (ϴ1) de la expansión, en unidades de tiempo mutacional, y tiempo desde la expansión expresados en millones de años t: VAL, Valencia; CAS, Castellón; KEL, Kelibia; CHI, Chioggia; VOU, Vouliagmeni; WM, Mediterráneo occidental (agrupación VAL, CAS, KEL).
Populations τ ϴ0 ϴ1 t
VOU 1.000 0.000 3407 0.41
CAS 1.875 0.000 3444 0.77
KEL 2.250 0.000 3469 0.92
VAL 2.695 0.000 27 1.10
CHI 0.7111 0.072 7400 0.29
WM 1.956 0.083 65042 0.78
six nuclear intronic markers revealed that three of these showed clear differentiation between the three basins. In the case of scallops, the microsatellite data reported by Morvezen et al. (2016) suggest that there is greater genetic differentiation for nuclear markers than for mitochondrial DNA between the Atlantic and the western Mediterranean populations, so it is possi-ble that the same could be happening to the genetic differentiation between the western and the eastern basins, or even among other smaller regions within the Mediterranean Sea. Finally, the use of nuclear markers and more extensive sampling will be neces-sary to determine whether there is a reduced genetic connectivity between scallop populations living in the eastern and western Mediterranean basins.
Acknowledgements
We are indebted to Juan Peña (retired) for his invaluable help during the preparation of this study, and to S. Katsanevanis for providing the samples from Vouliagmeni Lake. We also thank an anonymous reviewer for kind suggestions to improve the work.
Gaffney, P. M., Pascal, C. M., Barnhart, J., Grant, W. S., Seeb, J. E., 2010. Genetic homogeneity of weathervane scallops (Patinopecten caurinus) in the Northeastern Pacific. Canadian Journal of Fis-heries and Aquatic Sciences, 67(11): 1827–1839.
Gosling, E., 2003. Bivalve Molluscs: Biology, Ecology and Culture. Fishing News Books, Oxford, UK.
Hall, T. A., 1999. BioEdit: a user–friendly biological sequence alignment editor and analysis program for Windows 95/98/NT. Nucleic Acids Symposium Series, 41: 95–98.
Hanzawa, N., Gotoh, R. O., Sekimoto, H., Goto, T. V., Chiba, S. N., Kuriiwa, K., Tamate, H. B., 2012. Genetic diversity and evolution of marine animals isolated in marine lakes. In: Analysis of genetic variation in animals: 121–150 (M. Caliskan, Eds.). InTech, Rijeka.
Harpending, H., 1994. Signature of ancient population growth in a low–resolution mitochondrial DNA mis-match distribution. Human Biology, 66(4): 591–600.
Jordaens, K., De Wolf, H., Willems, T., Van Dongen, S., Brito, C., Frias Martins, A. M., Backeljau, T., 2000. Loss of genetic variation in a strongly isolated Azorean population of the edible clam, Tapes de-cussates. Journal of Shellfish Research, 19: 29–34.
Katsanevakis, S., 2005. Abundance and spatial distribution of the Mediterranean scallop, Pecten jacobaeus, in a marine lake. Fisheries Research, 76: 417–429.
Kitada, S., Kitakado, T., Kishino, H., 2007. Empirical Bayes inference of pairwise FST and its distribution in the genome. Genetics, 177(2): 861–873.
Lambeck, K., Purcell, A., 2005. Sea–level change in the Mediterranean Sea since the LGM: model predictions for tectonically stable areas. Quaternary Science Reviews, 24: 1969–1988.
Li, W.–H., 1977. Distribution of nucleotide differences between two randomly chosen cistrons in a finite population. Genetics, 85(2): 331–337.
Librado, P., Rozas, J., 2009. DnaSP v5: A software for comprehensive analysis of DNA polymorphism data. Bioinformatics, 25(11): 1451–1452.
Mahidol, C., Na–Nakorn, U., Taniguchi, N., Nguyen, T. T., 2007. Mitochondrial DNA Diversity of the Asian Moon Scallop, Amusium pleuronectes (Pectinidae), in Thailand. Marine Biotechnology, 9(3): 352–359.
Mattei, N., Pellizzato, M., 1996. A population study on three stocks of a commercial Adriatic Pectinid (Pec-ten jacobaeus). Fisheries Research, 26: 49–65.
Miller, S. A., Dykes, D. D., Polesky, H. F., 1988. A simple salting out procedure for extracting DNA from nucleated cells. Nucleic Acids Research, 16(3): 1215.
Millot, C., Taupier–Letage, I., 2005. Circulation in the Mediterranean Sea. The Handbook of Environ-mental Chemistry, 5: 29–66.
Moritz, C., 1994. Applications of mitochondrial DNA analysis in conservation: a critical review. Molecular Ecology, 3(4): 401–411.
Morvezen, R., Charrier, G., Boudry, P., Chauvaud, L., Breton, F., Strand, O., Laroche, J., 2016. Genetic structure of a commercially exploited bivalve, the
great scallop Pecten maximus, along the European coasts. Conservation Genetics, 17(1): 57–67.
Nei, M., 1972. Genetic distance between populations. The American Naturalist, 106: 283–292
– 1979. Estimation of average heterozygosity and genetic distance from a small number of individuals. Genetics, 89: 583–590.
Nikula, R., Vainola, R., 2003. Phylogeography of Ce-rastoderma glaucum (Bivalvia: Cardiidae) across Europe: a major break in the Eastern Mediterra-nean. Marine Biology, 143(2): 339–350.
Oleksyk, T. K., Smith, M. W., O’Brien, J., 2010. Geno-me–wide scans for footprints of natural selection. Philosophical Transactions of the Royal Society of London Series B: Biological Sciences, 365(1537): 185–205.
Orel, G., Fonda Umani, S., Aleffi, F., 1993. Ipossie e anossie di fondali marini. L’Alto Adriatico e il Golfo di Trieste. Regione Autonoma Friuli–Venezia Giulia, Direzione regionale Ambiente: 1–104.
Palacios, E., Racotta, I. S., Kraffe, E., Marty, Y., Moal, J., Samain, J. F., 2005. Lipid composition of the Pacific lion–paw scallop, Nodipecten (Lyropecten) subnodosus, in relation to gametogenesis I. Fatty acids. Aquaculture, 250: 270–282.
Palumbi, S., 1996. Nucleic acids II: the polymerase chain reaction. In: Molecular systematic: 205–247 (D. M. Hillis, C. Moritz, B. K. Mable, Eds.). Sinauer, Sunderland.
Papapetrou–Zamanis, A., 1969. Le lac de Vouliagmeni (Attiki). Annales Géologiques des Pays Helléniques, 21: 210–216.
Patarnello, T., Volckaert, F. A. M. J., Castilho, R., 2007. Pillars of Hercules: is the Atlantic–Mediterranean transition a phylogeographical break? Molecular Ecology, 16: 4426–4444.
Pranovi, F., Raicevich, S., Franceschini, G., Torricelli, P., Giovanardi, O., 2001. Discard analysis and damage to non–target species in the rapid trawl fishery. Marine Biology, 139: 863–875.
Preacher, K. J., 2001. Calculation for the chi–square test: An interactive calculation tool for chi–square tests of goodness of fit and independence [Com-puter software], (Available at http://quantpsy.org).
Rabaoui, L., Tlig–Zouari, S., Katsanevakis, S., Ben Hassine, O. K., 2011. Modelling population den-sity of Pinna nobilis (Bivalvia) on the Eastern and Southeastern coast of Tunisia. Journal of Molluscan Studies, 76: 340–347.
Ramos–Onsins, S. E., Rozas, J., 2002. Statistical properties of new neutrality tests against population growth. Molecular Biology and Evolution, 19(12): 2092–2100.
Rıos, C., Sanz, S., Saavedra, C., Penã, J. B., 2002. Allozyme variation in populations of scallops, Pecten jacobaeus (L.) and P. maximus (L.) (Bi-valvia: Pectinidae), across the Almeria–Oran front. Journal of Experimental Marine Biology and Ecol-ogy, 267(2): 223–244.
Rogers, A. R., 1995. Genetic evidence for a Pleis-tocene population explosion. Evolution, 49(4): 608–615.
Animal Biodiversity and Conservation 41.1 (2018) 73
Shells: Recent Pectinidae and Propeamussiidae of the World. Crawford House Press, Bathurst: 1–157.
Saavedra, C., Peña, J. B., 2004. Phylogenetic relationships of commercial European and Aus-tralasian scallops (Pecten spp.) based on partial 16S ribosomal RNA gene sequences. Aquaculture, 235(1): 153–166.
– 2005. Nucleotide diversity and Pleistocene pop-ulation expansion in Atlantic and Mediterranean scallops (Pecten maximus and P. jacobaeus) as revealed by the mitochondrial 16S ribosomal RNA gene. Journal of Experimental Marine Biolo-gy and Ecology, 323(2): 138–150.
Saitou, N., Nei, M., 1987. The neighbor–joining meth-od: a new method for reconstructing phylogenetic trees. Molecular Biology and Evolution, 4: 406–425.
Schneider, S., Excoffier, L., 1999. Estimation of past demographic parameters from the distribution of pairwise differences when the mutation rates vary among sites: application to human mitochondrial DNA. Genetics, 152(3): 1079–1089.
Tajima, F., 1989. Statistical method for testing the neutral mutation hypothesis by DNA polymorphism. Genetics, 123(3): 585–595.
Tarnowska, K., Chenuil, A., Nikula, R., Féral, J. P., Wolowicz, M., 2010. Complex genetic population structure of the bivalve Cerastoderma glaucum in a highly fragmented lagoon habitat. Marine Ecology Progress Series, 406: 173–184.
Telahigue, K., Chetoui, I., Rabeh, I., Romdane, M. S., El Cafsi, M., 2010. Comparative fatty acids profiles in edible parts of wild scallops from Tunisian coast. Food Chemistry, 122(3): 744–746.
Thompson, J. D., Higgins, D. G., Gibson, T. J., 1994. Clustal W: Improving the sensitivity of progressive multiple sequence alignment through sequence weighting, position–specific gap penalties and weight matrix choice. Nucleic Acids Research, 22(22): 4673–4680.
Tir, M., Tombari, W., Telahigue, K., Hajji, T., Ghram, A., El Cafsi, M., 2014. Genetic diversity and population structure of Sepia officinalis from the Tunisian cost revealed by mitochondrial COI sequences. Molec-ular Biology Reports, 42(1): 77–86.
Vardala–Theodorou, E., Nicolaidu, A., 2007. On the Recent and fossil malacofauna of 'Vouliagmeni Lake', Perachora (Korinthiakos Gulf, Greece). Bollettino malacologico, 43(1–8): 62–70.
Wilding, C. S., Beaumont, A. R., Latchford, J. W., 1999. Are Pecten maximus and Pecten jacobaeus different species? Journal of the Marine Biologi-cal Association UK, 79(5): 949–952.
Zitari–Chatti, R., Chatti, N., Fulgione, D., Caiazza, I., Aprea, G., Elouaer A., Said, K., Capriglione, T., 2009. Mitochondrial DNA variation in the caramote prawn Penaeus (Melicertus) kerathurus across a transition zone in the Mediterranean Sea. Genetica, 136(3): 439–447.