This article was downloaded by: [Laurentian University] On: 06 October 2013, At: 02:27 Publisher: Taylor & Francis Informa Ltd Registered in England and Wales Registered Number: 1072954 Registered office: Mortimer House, 37-41 Mortimer Street, London W1T 3JH, UK International Journal of Vegetable Science Publication details, including instructions for authors and subscription information: http://www.tandfonline.com/loi/wijv20 Genetic Variability, Correlation and Path Coefficient Analysis in Tomato Dharminder Kumar a , Rajeev Kumar a , Sandeep Kumar a , M. L. Bhardwaj a , M. C. Thakur a , Ramesh Kumar a , Kuldeep Singh Thakur a , Balbir Singh Dogra b , Amit Vikram a , Ashok Thakur c & Prince Kumar a a Department of Vegetable Science , Dr. Y.S. Parmar University of Horticulture and Forestry, Nauni , Solan , HP , India b Regional Horticulture & Forestry Research Station , Bhota , Hamirpur , India c Seed Technology and Production Centre , Dr. Y.S. Parmar University of Horticulture and Forestry, Nauni , Solan , HP , India Accepted author version posted online: 02 Apr 2013. To cite this article: Dharminder Kumar , Rajeev Kumar , Sandeep Kumar , M. L. Bhardwaj , M. C. Thakur , Ramesh Kumar , Kuldeep Singh Thakur , Balbir Singh Dogra , Amit Vikram , Ashok Thakur & Prince Kumar (2013) Genetic Variability, Correlation and Path Coefficient Analysis in Tomato, International Journal of Vegetable Science, 19:4, 313-323, DOI: 10.1080/19315260.2012.726701 To link to this article: http://dx.doi.org/10.1080/19315260.2012.726701 PLEASE SCROLL DOWN FOR ARTICLE Taylor & Francis makes every effort to ensure the accuracy of all the information (the “Content”) contained in the publications on our platform. However, Taylor & Francis, our agents, and our licensors make no representations or warranties whatsoever as to the accuracy, completeness, or suitability for any purpose of the Content. Any opinions and views expressed in this publication are the opinions and views of the authors, and are not the views of or endorsed by Taylor & Francis. The accuracy of the Content should not be relied upon and should be independently verified with primary sources of information. Taylor and Francis shall not be liable for any losses, actions, claims, proceedings, demands, costs, expenses, damages, and other liabilities whatsoever or howsoever caused arising directly or indirectly in connection with, in relation to or arising out of the use of the Content. This article may be used for research, teaching, and private study purposes. Any substantial or systematic reproduction, redistribution, reselling, loan, sub-licensing,
Transcript
This article was downloaded by: [Laurentian University]On: 06 October 2013, At: 02:27Publisher: Taylor & FrancisInforma Ltd Registered in England and Wales Registered Number: 1072954 Registeredoffice: Mortimer House, 37-41 Mortimer Street, London W1T 3JH, UK
International Journal of VegetableSciencePublication details, including instructions for authors andsubscription information:http://www.tandfonline.com/loi/wijv20
Genetic Variability, Correlation and PathCoefficient Analysis in TomatoDharminder Kumar a , Rajeev Kumar a , Sandeep Kumar a , M. L.Bhardwaj a , M. C. Thakur a , Ramesh Kumar a , Kuldeep SinghThakur a , Balbir Singh Dogra b , Amit Vikram a , Ashok Thakur c &Prince Kumar aa Department of Vegetable Science , Dr. Y.S. Parmar University ofHorticulture and Forestry, Nauni , Solan , HP , Indiab Regional Horticulture & Forestry Research Station , Bhota ,Hamirpur , Indiac Seed Technology and Production Centre , Dr. Y.S. Parmar Universityof Horticulture and Forestry, Nauni , Solan , HP , IndiaAccepted author version posted online: 02 Apr 2013.
To cite this article: Dharminder Kumar , Rajeev Kumar , Sandeep Kumar , M. L. Bhardwaj , M. C.Thakur , Ramesh Kumar , Kuldeep Singh Thakur , Balbir Singh Dogra , Amit Vikram , Ashok Thakur& Prince Kumar (2013) Genetic Variability, Correlation and Path Coefficient Analysis in Tomato,International Journal of Vegetable Science, 19:4, 313-323, DOI: 10.1080/19315260.2012.726701
To link to this article: http://dx.doi.org/10.1080/19315260.2012.726701
PLEASE SCROLL DOWN FOR ARTICLE
Taylor & Francis makes every effort to ensure the accuracy of all the information (the“Content”) contained in the publications on our platform. However, Taylor & Francis,our agents, and our licensors make no representations or warranties whatsoever as tothe accuracy, completeness, or suitability for any purpose of the Content. Any opinionsand views expressed in this publication are the opinions and views of the authors,and are not the views of or endorsed by Taylor & Francis. The accuracy of the Contentshould not be relied upon and should be independently verified with primary sourcesof information. Taylor and Francis shall not be liable for any losses, actions, claims,proceedings, demands, costs, expenses, damages, and other liabilities whatsoever orhowsoever caused arising directly or indirectly in connection with, in relation to or arisingout of the use of the Content.
This article may be used for research, teaching, and private study purposes. Anysubstantial or systematic reproduction, redistribution, reselling, loan, sub-licensing,
systematic supply, or distribution in any form to anyone is expressly forbidden. Terms &Conditions of access and use can be found at http://www.tandfonline.com/page/terms-and-conditions
Kuldeep Singh Thakur,1 Balbir Singh Dogra,2 Amit Vikram,1
Ashok Thakur,3 and Prince Kumar1
1Department of Vegetable Science, Dr. Y.S. Parmar University of Horticulture andForestry, Nauni, Solan, HP, India2Regional Horticulture & Forestry Research Station, Bhota, Hamirpur, India3Seed Technology and Production Centre, Dr. Y.S. Parmar University of Horticultureand Forestry, Nauni, Solan, HP, India
Tomato (Solanum lycopersicum L.) yield in India is below world averages. To increaseproductivity, it is necessary to develop superior varieties/hybrids. The efficiency ofselection depends upon the nature and magnitude of genetic variability and degreeof transmissibility of desired characters. Because yield is a complex character, itsdirect improvement is difficult. Twenty-six genotypes of tomato were assessed to deter-mine the nature and magnitude of variability, correlation, and path coefficient analysisbetween yield and yield-contributing characters. The analysis of variance (ANOVA)revealed highly significant differences among all genotypes for the characters. Thegenotype ‘EC-357838’ had the highest mean value for number of fruit per plant, totalsoluble solids, and yield per plant. High PC phenotypic coefficient of variability (PCV),genotypic coefficient of variability (GCV), and heritability estimates, coupled with highgenetic gain, were observed for plant height, number of fruit per plant, yield per plant,and fruit weight, indicating that these characters are under additive gene effects andmore reliable for effective selection. Correlation indicated that yield was significantlyand positively associated with number of fruit per plant and per cluster. Path analysisat the genotypic level indicated that fruit weight had the most positive direct effect onyield per plant followed by number of fruit per plant, fruit diameter, and number of fruitper cluster. Direct selection on the basis of fruit weight, number of fruit per plant, fruitdiameter, and number of fruit per cluster is reliable for yield improvement in tomato.
Address correspondence to Dharminder Kumar, Assistant Professor, Department ofVegetable Science, Dr. Y.S. Parmar University of Horticulture & Forestry, Nauni,Solan-173 230 HP, India. E-mail: [email protected]
Dow
nloa
ded
by [
Lau
rent
ian
Uni
vers
ity]
at 0
2:27
06
Oct
ober
201
3
314 D. Kumar et al.
Tomato (Solanum lycopersicum L.) is an off-season crop in the NorthernIndian plains. Identification and development of new cultivars are importantto improve production and productivity. Planning and execution of a breedingprogram for improvement of quantitative attributes depends, to a great extent,upon the magnitude of genetic variability and the extent to which desirablecharacters are heritable (Adunga and Labuschangne, 2003). Phenotypic andgenotypic coefficients of variation are useful in detecting amounts of variabil-ity present in genotypes. Heritability and genetic advance help in determiningthe influence of environment in expression of characters and the extent towhich improvement is possible after selection (Robinson et al., 1949). Heritablevariation can be effectively studied in conjunction with genetic advance. Highheritability alone is not enough to make efficient selection in segregatinggeneration and needs to be accompanied by a substantial amount of geneticadvance (Johanson et al., 1955). Correlation studies between fruit weight andits components and their relative contribution to yield are of value in plan-ning a breeding program. Path analysis facilitates the partitioning of thecorrelation coefficient into direct and indirect effects on yield and any otherattributes (Islam et al., 2010). Although it has been used in tomato previ-ously, the results are not clear due to different experimental material used.It is necessary to confirm previous results using new experimental materialunder different environmental conditions so selection can be made for higheryield in tomato. This investigation was undertaken to ascertain the magni-tude and extent of genetic variability, correlation, and path coefficient analysisusing new planting material in tomato.
MATERIALS AND METHODS
Experimental Site and EnvironmentThe investigation was carried out at the Research Farm of the Department
of Vegetable Science, Dr. Y.S. Parmar University of Horticulture and Forestry,Nauni, Solan, in the state of Himachal Pradesh, India. This location is at30◦50′ N latitude and 77◦11′30′′ E longitude and is 1260 m above meansea level and represents the mid-hill zone of Himachal Pradesh. Annualprecipitation is 1000–1300 mm, with most rainfall occurring from June toSeptember.
Experimental Material, Arrangement, and ObservationThe experimental material consisted of the tomato genotypes A-3, AP-
10, EC-110264, EC-12217, EC-141827, EC-21132, EC-357838, FT-5, FT-100,Lo1003, Lo 2410, Lo 5635, Oregon-2, Oregon Pride, UHF-503, UHF-505,
Dow
nloa
ded
by [
Lau
rent
ian
Uni
vers
ity]
at 0
2:27
06
Oct
ober
201
3
Genetic Variability in Tomato 315
UHF-506, UHF-512, UHF-517, UHF-519, UHF-521, UHF-562, UHF-571,UHF-659, V-16, and Solan Vajr. The experiment was arranged in a randomizedcomplete block design with three replications of each genotype. The exper-imental field was disked and leveled. About 25 Mt of well-decomposed cowmanure, 100 kg calcium ammonium nitrate, 475 kg single superphosphate, and90 kg muriate of potash·ha−1, respectively, was incorporated at soil prepara-tion. In addition, 100 kg·ha−1 calcium ammonium nitrate was applied at 1 and2 months after transplanting. One-month-old seedlings were transplanted tothe field with a spacing of 90 × 30 cm between and within rows, respectively.Standard cultural practices as recommended in the Package of Practices forVegetable Crops (Anonymous, 2009) were followed. Ten plants were randomlyselected and observations on plant height, number of fruit per cluster, num-ber of fruit per plant, days to first harvest, yield per plant, fruit weight, fruitlength, fruit diameter, pericarp thickness, number of locules per fruit, stem endscar size, harvest duration, number of seed per fruit, hundred seed weight, andtotal soluble solids were determined.
Statistical AnalysisData were subjected to analysis of variance (ANOVA) as per Gomez and
Gomez (1983). The genotypic and phenotypic coefficients of variation were cal-culated using the formulae of Burton and De Vane (1953). Heritability andgenetic advance were calculated according to Allard (1960) and genetic gainwas estimated using the method of Johanson et al. (1955). Genotypic andphenotypic correlations were calculated as per Al-Jibouri et al. (1958) usingan ANOVA and covariance matrix in which total variability was split intoreplications, genotypes, and errors. The genotypic and phenotypic correlationcoefficients were used to determine direct and indirect contribution towardyield per plot. The direct and indirect paths were obtained according to themethod of Dewey and Lu (1959).
RESULTS AND DISCUSSION
Mean PerformanceANOVA indicated significant differences among genotypes for all charac-
ters (Table 1). These differences indicated variability in the germplasm andoffer opportunity for improvement in yield and quality traits of tomato throughselection. The shortest plants were obtained for ‘Oregon Pride’ and the tallestfor ‘EC-110264’. The least number of fruit per cluster was obtained for ‘OregonPride’ and the most for ‘Lo1003’. The most fruit per plant was obtained for‘EC-357838’ and the least for ‘Oregon Pride’.
Dow
nloa
ded
by [
Lau
rent
ian
Uni
vers
ity]
at 0
2:27
06
Oct
ober
201
3
Tab
le1:
Ra
ng
e,m
ea
n,a
nd
AN
OV
Afo
rdiff
ere
nt
ch
ara
cte
rsin
tom
ato
.
Rang
e
Cha
rac
ter
Min
imum
Ma
xim
umM
ea
nSE
(m)±
MSS
valu
eC
D(0
.05)
Pla
nt
he
igh
t(c
m)
39.1
7(O
reg
on
Prid
e)
163.
67(E
C-1
1026
4)11
2.90
3.77
4093
.80
18.5
6N
um
be
rof
fru
itp
erc
lust
er
1.27
(Ore
go
nP
ride
)4.
63(L
o10
03)
3.14
00.
172.
540.
81N
um
be
rof
fru
itp
erp
lan
t7.
67(O
reg
on
Prid
e)
57.4
0(E
C-3
5783
8)25
.64
0.62
407.
723.
04D
ays
tofir
sth
arv
est
57.0
0(E
C-1
4182
7)84
.67
(UH
F-50
1)66
.22
0.63
63.4
93.
12Y
ield
pe
rpla
nt
(g)
181.
67(O
reg
on
Prid
e)
1427
.50
(EC
-357
838)
945.
3848
.17
308,
876.
9023
7.19
Fru
itw
eig
ht
(g)
16.5
0(O
reg
on
-2)
72.5
0(F
T-5)
40.5
60.
7883
0.80
3.85
Fru
itle
ng
th(c
m)
2.12
(Ore
go
n-2
)6.
95(U
HF-
562)
3.87
0.07
3.79
0.34
Fru
itd
iam
ete
r(c
m)
2.36
(Ore
go
n-2
)5.
64(V
-16)
3.86
0.13
1.74
0.64
Peric
arp
thic
kne
ss(m
m)
2.35
(EC
-211
32)
6.34
(FT-
5)4.
010.
122.
760.
61N
um
be
rof
loc
ule
sp
erf
ruit
2.27
(Lo
2410
)4.
87(L
o10
03)
3.55
0.13
1.65
0.63
Ste
me
nd
sca
rsiz
e(m
m)
3.52
(UH
F-51
9)10
.33
(Lo
1003
)7.
420.
1610
.69
0.78
Ha
rve
std
ura
tion
(da
ys)
22.3
3(O
reg
on
-2)
39.3
3(U
HF-
505,
521)
35.5
90.
6540
.99
3.22
Nu
mb
ero
fse
ed
pe
rfru
it53
(Org
eo
n-2
)15
6(F
T-5)
101.
011.
7922
55.9
18.
82H
un
dre
dse
ed
we
igh
t(m
g)
190
(So
lan
Va
jr)36
0(U
HF-
503)
249.
055.
4135
47.0
826
.65
Tota
lso
lub
leso
lids
(◦ B)
3.13
(UH
F-51
2)4.
87(E
C-3
5783
8)4.
020.
090.
720.
43
MSS
:Me
an
Sum
of
Squ
are
s;C
D:C
ritic
alD
iffe
ren
ce
.
316
Dow
nloa
ded
by [
Lau
rent
ian
Uni
vers
ity]
at 0
2:27
06
Oct
ober
201
3
Genetic Variability in Tomato 317
Days to first harvest were shortest for ‘EC-141827’ and longest for ‘UHF-501’. Yield per plant was least for ‘Oregon Pride’ and highest for ‘EC-357838’.The highest fruit weight was obtained for ‘T-5’ and the least for ‘Oregon-2’.The shortest fruit were obtained for ‘Oregon-2’ and the longest for ‘UHF-562’. The widest fruit diameter was obtained for ‘V-16’ and the narrowestfruit for ‘Oregon-2’. The pericarp was thickest for ‘FT-5’ and thinnest for ‘EC-21132’. The fewest number of locules per fruit was obtained for ‘Lo2410’ andthe most for ‘Lo-1003’. Stem end scar size was smallest for ‘UHF-519’ andlargest for ‘Lo1003’. Harvest duration was shortest for ‘Oregon-2’ and longestfor ‘UHF-521’ and ‘UHF-505’. The lowest number of seed per fruit was obtainedfor ‘Oregon-2’ and the most for ‘FT-5’. The lowest hundred seed weight wasobtained for ‘Solan Vajr’ and the highest for ‘UHF-503’. The highest total sol-uble solids was found for ‘EC-357838’ and the lowest for ‘UHF-512’. Tomato isknown to vary widely in expression of horticultural and quality traits in othercultivars or environments (Haydar et al., 2007; Kamruzzahan et al., 2000;Manna and Paul, 2012; Mohamed et al., 2012; Mohanty, 2003) and this allowsopportunities for improvement.
Parameters of Variability
Coefficients of Variability
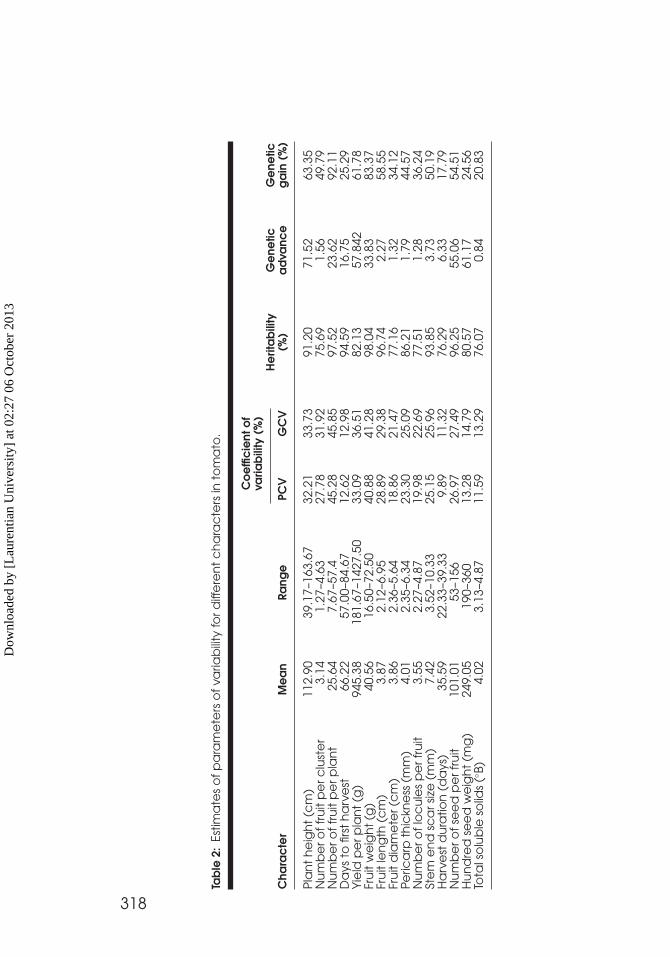
There were differences among all of the genotypes for phenotypic andgenotypic coefficients of variability (Table 2). Estimates of phenotypic andgenotypic coefficients of variability indicated the amount of variation in thegermplasm. For all characters studied, phenotypic coefficients of variabilitywere higher in magnitude than genotypic coefficients of variability, though thedifference was small in some cases. The traits were not influenced by environ-mental factors. Selection based on phenotypic performance is more reliable.Coefficients of variability varied in magnitude from character to character (low,moderate, or high), indicating a large amount of diversity.
Because the estimates of phenotypic variability cannot differentiatebetween genetic and environmental effects, the study of genetic variability iseffective in portioning out real genetic differences. The higher the genotypiccoefficients of variability, the better the chances of improvement in thatcharacter.
The genotypic coefficient of variability (GCV) was high for number of fruitper plant, followed by fruit weight, yield per plant, and plant height. ModerateGCV occurred for number of fruit per cluster, fruit length, fruit diameter,pericarp thickness, number of locules per fruit, stem end scar size, and numberof seed per fruit. The GVC was low for days to first harvest, harvest duration,hundred seed weight, and total soluble solids. Mohanty (2003), Haydar et al.(2007), T. P. Kumar and Tewari (1999), and Mohamed et al. (2012) reported
Dow
nloa
ded
by [
Lau
rent
ian
Uni
vers
ity]
at 0
2:27
06
Oct
ober
201
3
Tab
le2:
Estim
ate
so
fp
ara
me
ters
of
varia
bili
tyfo
rdiff
ere
nt
ch
ara
cte
rsin
tom
ato
.
Co
effi
cie
nto
fva
riab
ility
(%)
Cha
rac
ter
Me
an
Rang
ePC
VG
CV
He
rita
bili
ty(%
)G
ene
tica
dva
nce
Ge
netic
ga
in(%
)
Pla
nt
he
igh
t(c
m)
112.
9039
.17–
163.
6732
.21
33.7
391
.20
71.5
263
.35
Nu
mb
ero
ffr
uit
pe
rclu
ste
r3.
141.
27–4
.63
27.7
831
.92
75.6
91.
5649
.79
Nu
mb
ero
ffr
uit
pe
rpla
nt
25.6
47.
67–5
7.4
45.2
845
.85
97.5
223
.62
92.1
1D
ays
tofir
sth
arv
est
66.2
257
.00–
84.6
712
.62
12.9
894
.59
16.7
525
.29
Yie
ldp
erp
lan
t(g
)94
5.38
181.
67–1
427.
5033
.09
36.5
182
.13
57.8
4261
.78
Fru
itw
eig
ht
(g)
40.5
616
.50–
72.5
040
.88
41.2
898
.04
33.8
383
.37
Fru
itle
ng
th(c
m)
3.87
2.12
–6.9
528
.89
29.3
896
.74
2.27
58.5
5Fr
uit
dia
me
ter(
cm
)3.
862.
36–5
.64
18.8
621
.47
77.1
61.
3234
.12
Peric
arp
thic
kne
ss(m
m)
4.01
2.35
–6.3
423
.30
25.0
986
.21
1.79
44.5
7N
um
be
rof
loc
ule
sp
erf
ruit
3.55
2.27
–4.8
719
.98
22.6
977
.51
1.28
36.2
4St
em
en
dsc
ars
ize
(mm
)7.
423.
52–1
0.33
25.1
525
.96
93.8
53.
7350
.19
Ha
rve
std
ura
tion
(da
ys)
35.5
922
.33–
39.3
39.
8911
.32
76.2
96.
3317
.79
Nu
mb
ero
fse
ed
pe
rfru
it10
1.01
53–1
5626
.97
27.4
996
.25
55.0
654
.51
Hu
nd
red
see
dw
eig
ht
(mg
)24
9.05
190–
360
13.2
814
.79
80.5
761
.17
24.5
6To
tals
olu
ble
solid
s(◦ B
)4.
023.
13–4
.87
11.5
913
.29
76.0
70.
8420
.83
318
Dow
nloa
ded
by [
Lau
rent
ian
Uni
vers
ity]
at 0
2:27
06
Oct
ober
201
3
Genetic Variability in Tomato 319
high genotypic coefficient of variability for number of fruit per plant, fruitweight, yield per plant, and plant height in different genotypes of tomato andclimatic conditions.
Heritability and Genetic Gain
Genotypic coefficients of variation do not estimate the variations thatare heritable, and estimation of heritability becomes necessary. Burton andDe Vane (1953) suggested that genetic coefficients of variability, along withheritability estimates, would provide a reliable indication of expected degreeof improvement through selection.
The estimates of heritability (broad sense) were high for plant height,number of fruit per plant, days to first harvest, yield per plant, fruit weight,fruit length, pericarp thickness, stem end scar size, number of seed perfruit, and hundred seed weight. Number of fruit per cluster, fruit diameter,number of locules per fruit, harvest duration, and total soluble solids hadmoderate heritability estimates (Table 2). T. P. Kumar and Tewari (1999),Mohanty (2003), Haydar et al. (2007), and Mohamed et al. (2012) reportedhigh heritability estimates for plant height, fruit weight, and number of fruitper plant in different genotypes of tomato.
Genetic gain (expressed as a percentage of population mean) was low tohigh in nature for different characters (Table 2). It was high for plant height,number of fruit per plant, yield per plant, fruit weight, fruit length, stem endscar size, and number of seed per fruit. Moderate genetic gain was observedfor number of fruit per cluster, days to first harvest, fruit diameter, pericarpthickness, and number of locules per fruit. Genetic gain was low for harvestduration, hundred seed weight, and total soluble solids. The results agreewith Mohamed et al. (2012), who reported high heritability estimates for plantheight and fruit weight and moderate heritability for number of fruit percluster in different genotypes. Mohanty (2003) and Haydar et al. (2007) alsoreported high heritability estimates for plant height and fruit weight in tomatogenotypes in different environments.
High heritability estimates, coupled with high genetic gain, occurred forplant height, number of fruit per plant, yield per plant, fruit weight, fruitlength, stem end scar size, and number of seed per fruit, indicating that thesecharacters are under additive gene effects and that these characters are morereliable for effective selection (Panse, 1957). High heritability, coupled withmoderate genetic gain, was observed for days to first harvest and pericarpthickness, indicating that these characters are under nonadditive gene effectsand that selection for these characters will be less effective. These traitsare under the influence of the environment and do not respond to selection.High heritability estimates coupled with high genetic gain were reported byMohamed et al. (2012) for plant height and fruit weight; by Mohanty (2003)for plant height, fruit weight, and number of fruit per plant; and by Haydar
Dow
nloa
ded
by [
Lau
rent
ian
Uni
vers
ity]
at 0
2:27
06
Oct
ober
201
3
320 D. Kumar et al.
et al. (2007) for number of fruit per plant and fruit weight in different tomatogenotypes.
Correlation StudiesThe correlation coefficients among characters were determined at the
phenotypic and genotypic levels (Table 3). In general, genotypic correlationcoefficients were higher in magnitude than phenotypic correlation coefficients.This can be interpreted as a strong inherent genotypic relationship betweencharacters studied, through their phenotypic expression was impeded by envi-ronmental influence. These results agree with Harer et al. (2002) and Daret al. (2011), who reported that the genotypic correlation coefficient was higherthan the phenotypic correlation for all characters examined in tomato underdifferent environments.
The phenotypic and genotypic correlation coefficients among differentcharacters indicated that yield per plant was significantly and positively asso-ciated with number of fruit per plant at the phenotypic and genotypic levels.Yield per plant was significantly and positively correlated with number of fruitper cluster only at the genotypic level. Number of fruit per plant was signifi-cantly and positively correlated with number of fruit per cluster. Fruit weightwas significantly and positively correlated with fruit length, fruit diameter,pericarp thickness, and stem end scar size and significantly and negatively
Table 3: Phenotypic and genotypic coefficients of correlation among significantcharacters in tomatoa.
Trait NFPC NFPP YPP FW FL FD PT SESS
PH P 0.605∗G 0.719∗∗
NFPC P 0.698∗∗G 0.769∗∗ 0.561∗ −0.525∗
NFPP P 0.534∗ −0.523∗ −0.548∗G 0.599∗ −0.525∗ −0.549∗
DTFP PG 0.516∗
FW P 0.624∗∗ 0.771∗∗ 0.664∗∗ 0.726∗∗G 0.656∗∗ 0.915∗∗ 0.666∗∗ 0.730∗∗
FL P 0.584∗G 0.589∗
FD P 0.648∗∗ 0.690∗∗G 0.761∗∗ 0.827∗∗
PT P 0.512∗G 0.516∗
∗, ∗∗Significant at the 5% and 1% level of significance.aNFPC = number of fruit per cluster, NFPP = number of fruit per plant, YPP = yield per plant (g),FW = fruit weight (g), FL = fruit length (cm), FD = fruit diameter (cm), PT = pericarp thickness(mm), SESS = stem end scar size (mm), PH = plant height (cm), DTFP = days to first harvest, P =phenotypic, G = genotypic.
Dow
nloa
ded
by [
Lau
rent
ian
Uni
vers
ity]
at 0
2:27
06
Oct
ober
201
3
Genetic Variability in Tomato 321
correlated with number of fruit per plant at the phenotypic and genotypic lev-els. To improve yield per plant in tomato, selection should be based on thesetraits. Significant positive correlations of yield per plant with other horticul-tural traits in tomato were reported by Mohanty (2003), Rani et al. (2010), Daret al. (2011), and M. Kumar and Dudi (2011). Moreover, a significant nega-tive correlation of fruit weight with number of fruit per plants was reportedby Premalakshmi (2001) and Rani et al. (2010) under different environmentalconditions.
Path Coefficient AnalysisAlthough correlation studies are helpful in determining components of
yield, with the inclusion of more variables in correlation studies, the indirectassociation becomes more complex. Two characters may show a correlationbecause they correlate with a common third one. Under such circumstances,path analysis helps in partitioning of correlation coefficients into direct andindirect effects, permitting a critical examination of the relative importance ofeach trait.
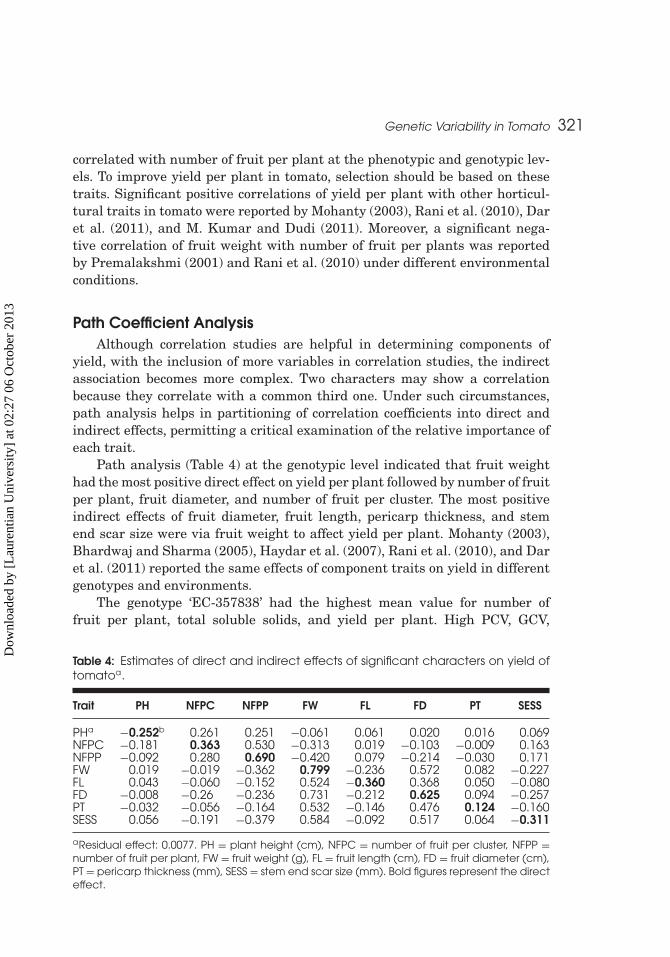
Path analysis (Table 4) at the genotypic level indicated that fruit weighthad the most positive direct effect on yield per plant followed by number of fruitper plant, fruit diameter, and number of fruit per cluster. The most positiveindirect effects of fruit diameter, fruit length, pericarp thickness, and stemend scar size were via fruit weight to affect yield per plant. Mohanty (2003),Bhardwaj and Sharma (2005), Haydar et al. (2007), Rani et al. (2010), and Daret al. (2011) reported the same effects of component traits on yield in differentgenotypes and environments.
The genotype ‘EC-357838’ had the highest mean value for number offruit per plant, total soluble solids, and yield per plant. High PCV, GCV,
Table 4: Estimates of direct and indirect effects of significant characters on yield oftomatoa.
aResidual effect: 0.0077. PH = plant height (cm), NFPC = number of fruit per cluster, NFPP =number of fruit per plant, FW = fruit weight (g), FL = fruit length (cm), FD = fruit diameter (cm),PT = pericarp thickness (mm), SESS = stem end scar size (mm). Bold figures represent the directeffect.
Dow
nloa
ded
by [
Lau
rent
ian
Uni
vers
ity]
at 0
2:27
06
Oct
ober
201
3
322 D. Kumar et al.
and heritability estimates, coupled with high genetic gain, occurred for plantheight, number of fruit per plant, yield per plant, and fruit weight, indicat-ing that these characters are under additive gene effects and more reliable foreffective selection. Correlation indicated that yield was significantly and posi-tively associated with number of fruit per plant and per cluster. Path analysisat the genotypic level indicated that fruit weight had the most positive directeffect on yield per plant followed by number of fruit per plant, fruit diam-eter, and number of fruit per cluster. It is always necessary for untested ornew genetic material be evaluated so that improvements can be made in qual-ity and yield. To do this, the evaluation is best made with a combination ofcorrelation and path analysis.
REFERENCES
Adunga, W. and M.T. Labuschangne. 2003. Association of linseed characters and itsvariability in different environment. J. Agr. Sci. 14:285–296.
Al-Jibouri, H.W., P.A. Millar, and H.F. Robinson. 1958. Genotypic and environmentalvariance and co-variance in an upland cotton cross of interspecific origin. Agron. J.50:633–637.
Allard, R.W. 1960. Principles of plant breeding. John Wiley & Sons, New York.
Anonymous. 2009. Package of practices for vegetable crops. Directorate of Ext.Educ., Dr. Y.S. Parmar Univ. of Hort. and For., Nauni, Solan, Himachal Pradesh,India.
Bhardwaj, N.V. and M.K. Sharma. 2005. Genetic parameters and character associationin tomato. Bangladesh J. Agr. Res. 30(1):49–56.
Burton, G.W. and E.H. De Vane. 1953. Estimating heritability in tall fescue (Festucaarundiancea) from replicated clonal material. Agron. J. 45:478–481.
Dar, R.A., J.P. Sharma, R.K. Gupta, and S. Chopra. 2011. Studies on correlationand path analysis for yield and physicochemical traits in tomato (Lycopersiconesculentum Mill.). Vegetos 24(2):136–141.
Dewey, D.R. and K.H. Lu. 1959. A correlation and path coefficient analysis of crestedwheat grass seed production. Agron. J. 51:515–518.
Gomez, K.A. and A.A. Gomez. 1983. Statistical procedures for agricultural research.John Wiley & Sons, New York.
Harer, P.N., D.B. Lad, and T.J. Bhor. 2002. Correlation and path analysis studies intomato. J. Maharashtra Agr. Univ. 27(3):302–303.
Haydar, A., M.A. Mandal, M.B. Ahmed, M.M. Hannan, and R. Karim. 2007.Studies on genetic variability and interrelationship among different traitsin tomato (Lycopesicon esculantum Mill.). Middle-East J. Sci. Res. 2(3/4):139–142.
Islam, B.M.R., N.A. Ivy, M.G. Rasul, and M. Zakaria. 2010. Character association andpath analysis of exotic tomato (Solanum lycopersicum L.) genotypes. Bangladesh J.Plant Breed. Genet. 23(1):13–18.
Johanson, H.W., H.F. Robinson, and R.E. Comstock. 1955. Estimates of genetic andenvironmental variability in soybean. Agron. J. 47:314–318.
Dow
nloa
ded
by [
Lau
rent
ian
Uni
vers
ity]
at 0
2:27
06
Oct
ober
201
3
Genetic Variability in Tomato 323
Kamruzzahan, M.M., R. Hossain, Islam, and M.F. Alam. 2000. Variability and cor-relation studies in tomato (Lycopersicon esculentum Mill.). Bangladesh J. Genet.Biotechnol. 1(1):21–26.
Kumar, M. and B.S. Dudi. 2011. Study of correlation for yield and quality characters intomato (Lycopersicon esculentum Mill.). Electron. J. Plant Breed. 2(3):453–460.
Kumar, T.P. and R.N. Tewari. 1999. Studies on genetic variability for processingcharacters in tomato. Indian J. Hort. 56:332–336.
Manna, M. and A. Paul. 2012. Studies on genetic variability and characters associationof fruit quality parameters in tomato. Hort. Flora Res. Spectrum 1(2):110–116.
Mohamed, S.M., E.E. Ali, and T.Y. Mohamed. 2012. Study of heritability and geneticvariability among different plant and fruit characters of tomato (Solanumlycopersicon L.). Intl. J. Sci. Technol. Res. 1(2):55–58.
Mohanty, B.K. 2003. Genetic variability, correlation and path coefficient studies intomato. Indian J. Agr. Res. 37(1):68–71.
Panse, V.S. 1957. Genetics of quantitative characters in relation to plant breeding.Indian J. Genet. 17:318–328.
Premalakshmi, V. 2001. Breeding for yield and post harvest qualities in tomato(Solanum lycopersicum L.). PhD Diss., Dept. of Hort. (Veg. Sci.), Tamil Nadu Agr.Univ., Coimbatore, India.
Rani, C.I., I. Muthuvel, and D. Veeraragavathatham. 2010. Correlation and path coef-ficient for yield components and quality traits in tomato (Lycopersicon esculentumMill.). Agr. Sci. Dig. 30(1):11–14.
Robinson, H.F., R.E. Comstock, and P.H. Harvey. 1949. Estimates of heritability anddegree of dominance in corn. Agron. J. 41:253–259.