1 Genetics is the ―study of heredity‖. A more modern definition is the study of composition and functioning of the genetic material. Genetics as a set of principles and analytical procedures did not begin until the 1860s, when an Augustinian monk named Gregor Mendel performed a set of experiments that pointed to the existence of biological elements that we now call genes. Thus genetics can be defined as the study of genes. Mendel studied the garden pea (Pisum sativum), which he chose as his object of study. The choice was a good for the following reasons: • Can be grown in a small area. • Produce lots of offspring.
Transcript
1
Genetics is the ―study of heredity‖. A more modern definition is the study of
composition and functioning of the genetic material. Genetics as a set of principles and
analytical procedures did not begin until the 1860s, when an Augustinian monk named
Gregor Mendel performed a set of experiments that pointed to the existence of biological
elements that we now call genes. Thus genetics can be defined as the study of genes.
Mendel studied the garden pea (Pisum sativum), which he chose as his object of study.
The choice was a good for the following reasons:
• Can be grown in a small area.
• Produce lots of offspring.
2
• Available in many varieties with distinct heritable features with different
variations: flower color, seed color, seed shape, etc.
• Self and cross pollinations can occur.
Generally, the choice of an organism for studying genetics should consider the presence
of the following:
Short life cycle
Available easy system for growth and maintenance.
Sexually reproduction
Controlled matting
Large number of offsprings
Features with different variations.
Mendel’s experimental design
Mendel was careful to focus on only a few specific differences between the plants he was
using and to ignore the countless other differences he must have seen. Consequently, he
studied seven characters. He usually conducted his experiments in three stages:
1. Mendel allowed plants of a given variety to self-cross for multiple generations to
assure himself that the traits he was studying were indeed true-breeding, that is,
transmitted unchanged from generation to generation.
2. Mendel then performed crosses between true-breeding varieties exhibiting alternative
forms of characters. He also performed reciprocal crosses.
3. Finally, Mendel permitted the hybrid offspring produced by these crosses to self
fertilize for several generations, allowing him to observe the inheritance of alternative
forms of a character. Most important, he counted the numbers of offspring exhibiting
each trait in each succeeding generation. This quantification of results is what
distinguished Mendel’s research from that of earlier qualitative investigations.
Mendel’s mathematical analysis of experimental results led to the inheritance model
that we still use today.
3
The Principle of Segregation
A monohybrid cross is a cross that follows only variations on a single character, such as
yellow- and green-colored seeds. A monohybrid cross is made by mating true-breeding
individuals from two parent strains, each exhibiting one of the two contrasting forms of
the character under study. This deceptively simple kind of cross can lead to important
conclusions about the nature of inheritance. The seven characteristics, or characters,
Mendel studied in his experiments possessed two variants that differed from one another
4
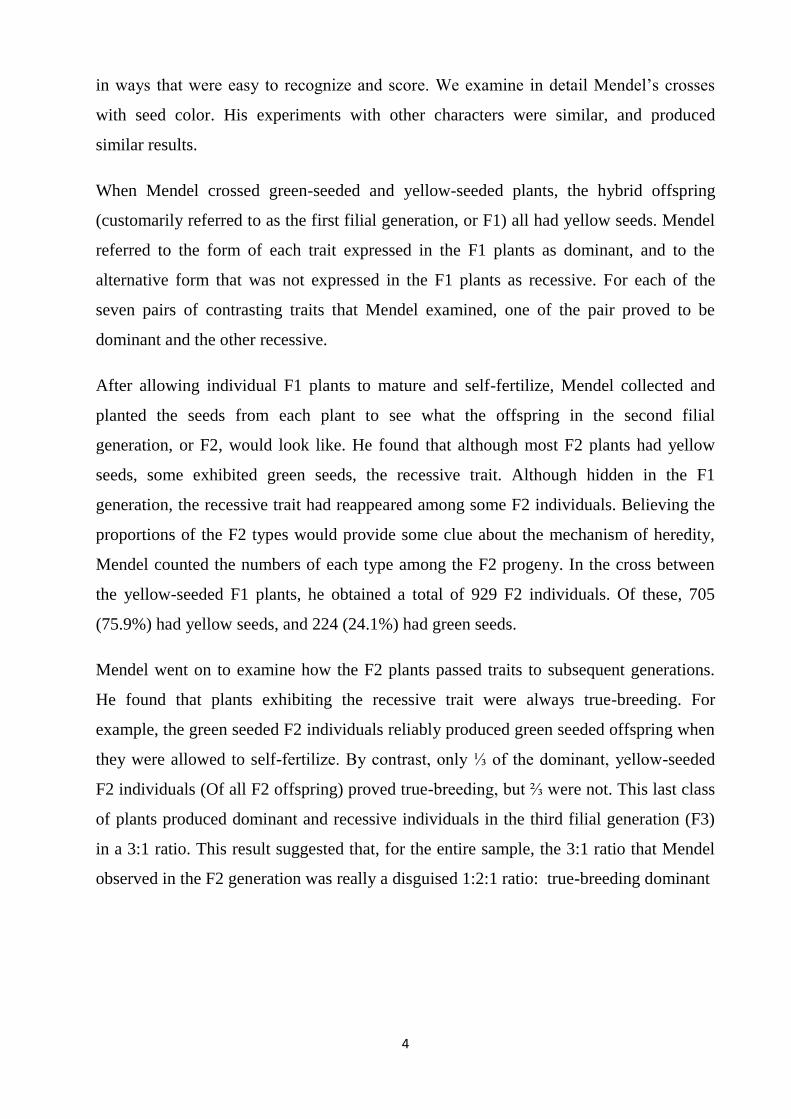
in ways that were easy to recognize and score. We examine in detail Mendel’s crosses
with seed color. His experiments with other characters were similar, and produced
similar results.
When Mendel crossed green-seeded and yellow-seeded plants, the hybrid offspring
(customarily referred to as the first filial generation, or F1) all had yellow seeds. Mendel
referred to the form of each trait expressed in the F1 plants as dominant, and to the
alternative form that was not expressed in the F1 plants as recessive. For each of the
seven pairs of contrasting traits that Mendel examined, one of the pair proved to be
dominant and the other recessive.
After allowing individual F1 plants to mature and self-fertilize, Mendel collected and
planted the seeds from each plant to see what the offspring in the second filial
generation, or F2, would look like. He found that although most F2 plants had yellow
seeds, some exhibited green seeds, the recessive trait. Although hidden in the F1
generation, the recessive trait had reappeared among some F2 individuals. Believing the
proportions of the F2 types would provide some clue about the mechanism of heredity,
Mendel counted the numbers of each type among the F2 progeny. In the cross between
the yellow-seeded F1 plants, he obtained a total of 929 F2 individuals. Of these, 705
(75.9%) had yellow seeds, and 224 (24.1%) had green seeds.
Mendel went on to examine how the F2 plants passed traits to subsequent generations.
He found that plants exhibiting the recessive trait were always true-breeding. For
example, the green seeded F2 individuals reliably produced green seeded offspring when
they were allowed to self-fertilize. By contrast, only ⅓ of the dominant, yellow-seeded
F2 individuals (Of all F2 offspring) proved true-breeding, but ⅔ were not. This last class
of plants produced dominant and recessive individuals in the third filial generation (F3)
in a 3:1 ratio. This result suggested that, for the entire sample, the 3:1 ratio that Mendel
observed in the F2 generation was really a disguised 1:2:1 ratio: true-breeding dominant
5
A summary for Mendel’s observations starting with crossing of 2 True breeding individuals (yellow and green seeded) and subsequent self crossing of the offspring for next 2 generations.
True breeding yellow seeded
plant
True breeding green seeded
plant P
Cross fertilization
yellow seeded offsprings F1
F2
Self fertilization
yellow seeded offspring
yellow seeded offspring
yellow seeded offspring
green seeded offspring
Self fertilization
All yellow All green 3 yellow : 1 green 3 yellow : 1 green
F3
6
individuals, not-true-breeding dominant individuals, and true-breeding recessive
individuals.
From This experiments we can extract the following conclusions upon which Mendel
proposed a simple model that has become one of the most famous in the history of
science:
1. Variations (traits) of a character are determined by discrete information for each trait.
Mendel called these information ―factors‖ We now call these factors alleles.
2. Crossing of true breeding plants (parents) carrying opposite traits of a character results
in offspring (F1) all carrying one of these traits while the other disappear. F1 plants did
not have an intermediate appearance, as a hypothesis of blending inheritance would
have predicted. Instead, different plants inherited each trait intact, as a discrete feature.
3. Upon self-crossing of the offspring (F1), the disappeared trait appears only in ¼ of the
resultant plants (F2). The trait that ―disappeared‖ must therefore be latent (present but
not expressed) in the F1 individuals. Also, the factors (alleles) remain discrete—they
neither blend with nor alter each other. This characteristic 3:1 ratio is referred to as the
Mendelian ratio for a monohybrid cross.
4. Factors (alleles) for any character are not always the same. In such case only factors
(called dominant factors) are expressed while the others (called the recessive factors)
are not expressed. Dominant factors here are responsible for yellow seeds while
recessive ones are responsible for green seeds. Now we call plants carrying the same
alleles for a character homozygous (true breeding) for this character while those
carrying different factors are called heterozygous (not true breeding).
5. Self-crossing of F2 plants showed that green seeded plants are true breeding
(homozygous); carrying only factors for green seeds while only 1/3 of the F2 yellow
seeded plants are true breeding (homozygous); carrying only factors for yellow seeds
and the other 2/3 are not true breeding (heterozygous); carrying factors for both of
yellow and green seeds. Thus, F2 plants are divided into homozygous for the
7
dominant trait, heterozygous and homozygous for the recessive trait in the ratio 1: 2:
1.
6. Based on 5, we have 4 equal (1+2+1) probabilities for offspring of monohybrid self-
cross. This indicates that heterozygous plant has two different factors for seed color.
Factors segregate and rejoin randomly upon crossing. Each individual receives a factor
(allele) from each parent for each character.
Back cross (crossing offspring with parents) was used to confirm this assumption. Back
crossing of F1 with the parent carrying dominant trait results in plants all carrying
dominant phenotype. Back crossing with the parent carrying recessive trait (it is also
called test cross) results in 50% plants carrying dominant phenotype and 50% carrying
the recessive trait. These results are in agreement with Mendel’s assumption and
generalized it to all possible crossings.
Geneticists now refer to the set of alleles that an individual contains as the individual’s
genotype. The physical appearance or other observable characteristics of that individual,
which result from an allele’s expression, is termed the individual’s phenotype. In other
words, the genotype is the blueprint, and the phenotype is the visible outcome in an
individual. This also allows us to present Mendel’s ratios in more modern terms. The 3:1
ratio of dominant to recessive is the monohybrid cross phenotypic ratio. The 1:2:1 ratio
of homozygous dominant to heterozygous to homozygous recessive is the monohybrid
cross genotypic ratio. The genotypic ratio is modified into the phenotypic ratio due to the
action of the dominant allele making the heterozygote appear the same as homozygous
dominant.
Mendel’s model accounts for the ratios he observed in a neat and satisfying way. His
main conclusion—that alternative alleles for a character segregate from each other
during gamete formation and remain distinct—has since been verified in many other
organisms. It is commonly referred to as Mendel’s first law of heredity, or the Principle
of Segregation. It can be simply stated as: The two alleles for a gene segregate during
gamete formation and are rejoined at random, one from each parent, during
fertilization. The physical basis for allele segregation is the behavior of chromosomes
8
during meiosis. Homologues for each chromosome disjoin during anaphase I of meiosis.
The second meiotic division then produces gametes that contain only one homologue for
each chromosome. Thus, Mendel through his analysis arrived at the correct scheme, even
though he had no knowledge of the cellular mechanisms of inheritance; neither
chromosomes nor meiosis had yet been described.
To test his model, Mendel first expressed it in terms of a simple set of symbols (letters:
A, B…etc). He then used the symbols to interpret his results. Geneticists have several
different systems for using symbols to represent genes. We will review a number of these
conventions during the course, but for now, we will adopt one to use consistently
throughout this part. According to this convention, the first letter of the dominant trait
symbolizes the character in question; in lowercase italic, it designates the allele for the
recessive trait, and in uppercase italic, it designates the allele for the dominant trait.
Consider again Mendel’s cross of yellow-seeded with green-seeded plants. By
convention, we assign the symbol Y to the dominant allele, associated with the
production of yellow seeds, and the symbol y to the recessive allele, associated with the
production of green seeds. In this system, the genotype of an individual that is true
breeding for the recessive green-seeded trait would be designated yy. Similarly, the
genotype of a true-breeding yellow-seeded individual would be designated YY. In
contrast, a heterozygote would be designated Yy (dominant allele first). Using these
conventions and denoting a cross between two strains with ―X‖ we can symbolize
Mendel’s original yellow × green cross as YY × yy. Because a green-seeded parent (yy)
can produce only y gametes, and a true-breeding yellow-seeded parent (YY, homozygous
dominant) can produce only Y gametes, the union of these gametes can produce only
heterozygous Yy offspring in the F1 generation. Because the Y allele is dominant, all of
these F1 individuals are expected to have yellow seeds. When F1 individuals are allowed
to self-fertilize, the Y and y alleles segregate during gamete formation to produce both Y
gametes and y gametes. Their subsequent union at fertilization to form F2 individuals is
random.
The F2 possibilities may be visualized in a simple diagram called a Punnett square,
named after its originator, the English geneticist R. C. Punnett. Mendel’s model,
9
analyzed in terms of a Punnett square, clearly predicts that the F2 generation should
consist of ¾ yellow-seeded plants and ¼ green-seeded plants, a phenotypic ratio of 3:1.
The Testcross: Revealing Unknown Genotypes
In a testcross, an individual with unknown genotype is crossed with the homozygous
recessive genotype—that is, the recessive parental variety.
Consider a yellow-seeded pea plant. It is impossible to tell whether such a plant is
homozygous or heterozygous simply by looking at it. To learn its genotype, you can
perform a testcross to a green-seeded plant. In this cross, the two possible test plant
genotypes will give different results:
Alternative 1: Unknown individual is homozygous dominant (YY) YY × yy. All offspring
have yellow seeds (Yy).
Alternative 2: Unknown individual is heterozygous (Yy) Yy × yy. ½ of offspring have
yellow seeds (Yy), and ½ have green seeds (yy). Put simply, the appearance of the
recessive phenotype in the offspring of a testcross indicates that the test individual’s
genotype is heterozygous.
10
Punnett square showing results of crossing of 2 True breeding individuals
(yellow and green seeded) and subsequent self crossing of the offsprings.
Y Y
y Yy Yy
y Yy Yy
Y y
Y YY Yy
y Yy yy
True breeding yellow seeded plant
YY
True breeding green
seeded plant (yy) F1 100% yellow seeded
offspring (Yy)
F2 3 yellow (1 YY & 2 Yy)
1 green (yy)
Yellow seeded hybrid
Yy
Yellow seeded hybrid
Yy
Self fertilization
11
Punnett square showing results of back cross between F1 plant and its
parents.
Y y
Y YY Yy
Y YY Yy
Y y
y Yy yy
y Yy yy
Yy
100% yellow seeded
YY
Yy
50% yellow seeded
50% green seeded
yy
12
Punnett square showing results of test crosses between the possible genotypes
of yellow seeded plants and green seeded plant.
Y Y
y Yy Yy
y Yy Yy
Y y
y Yy yy
y Yy yy
YY
100% yellow seeded
yy
Yy
50% yellow seeded
50% green seeded
yy
13
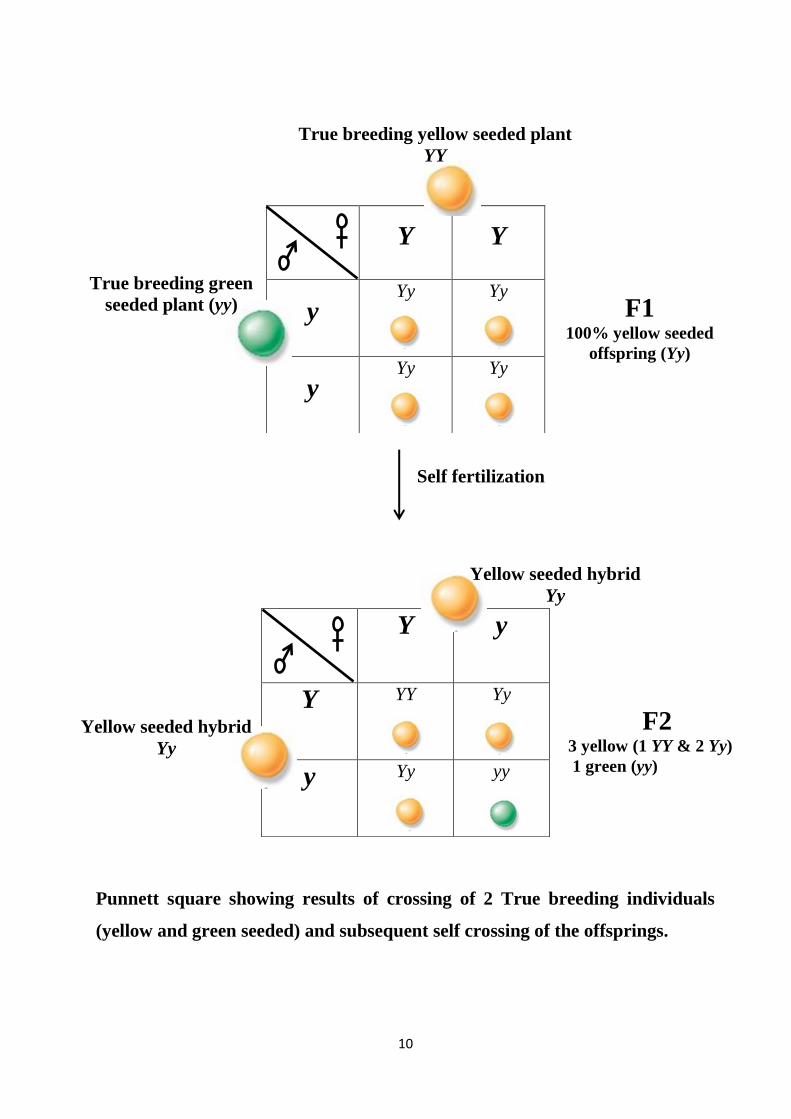
Important Definitions
Gene
A part of DNA carries information about a specific character. Genes are found on
chromosomes and each gene has a designated place on every chromosome, called a
locus.
Alleles
The different versions of the same gene. Each allele is responsible for a trait of the
character the gene controls. They are referred to by letters.
Character
A heritable feature that varies among individuals. An example would be flower color.
Trait
A variant for character, such as white or purple colors for flowers.
Homozygous
The individual is called homozygous for certain character If the two alleles controlling
such character are similar.
Heterozygous
The individual is called heterozygous for certain character If the two alleles controlling
such character are Different.
Dominant and Recessive
In heterozygous individual one allele is expressed and the other allele is not expressed or
masked.
The expressed allele is dominant. The allele is referred to by capital letter.
The allele not expressed or masked is recessive. The allele is referred to by small
letter.
Genotype
It refers to alleles the individual carries eg: YY, Yy and yy.
Phenotype (appearance)
The way an organism looks and behaves.
14
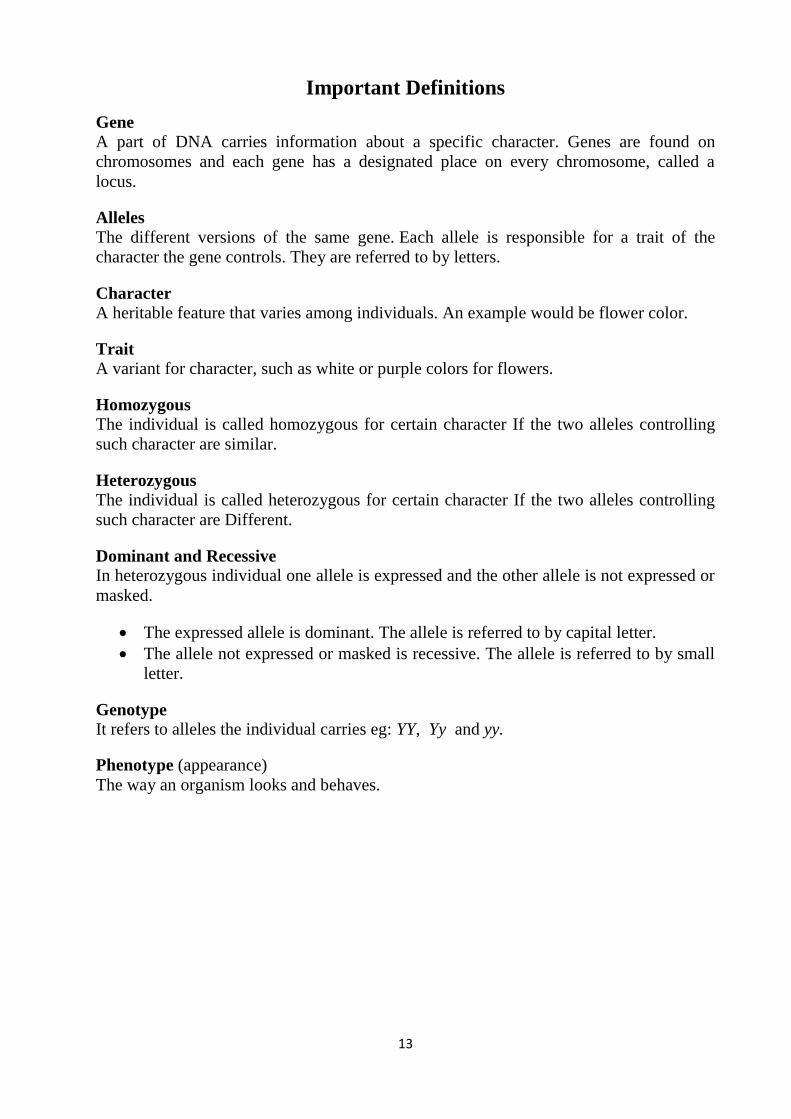
Dihybrid Crosses: The Principle of Independent Assortment
The Principle of Segregation explains the behavior of alternative forms of a single trait in
a monohybrid cross. The next step is to extend this to follow the behavior of two
different traits in a single cross: a dihybrid cross. With an understanding of the behavior
of single traits, Mendel went on to ask if different traits behaved independently in
hybrids. He first established a series of true-breeding lines of peas that differed in two of
the seven characters he had studied. He then crossed contrasting pairs of the true-
breeding lines to create heterozygotes. These heterozygotes are now doubly
heterozygous, or dihybrid. Finally, he self-crossed the dihybrid F1 plants to produce an
F2 generation, and counted all progeny types.
Traits in a dihybrid cross behave independently
Consider a cross involving different seed shape alleles (round, R, and wrinkled, r) and
different seed color alleles (yellow, Y, and green, y). Crossing round yellow (RR YY) with
wrinkled green (rr yy), produces heterozygous F1 individuals having the same phenotype
(namely round and yellow) and the same genotype (Rr Yy). Allowing these dihybrid F1
individuals to selffertilize produces an F2 generation.
The F2 generation exhibits four types of progeny in a 9:3:3:1 ratio
If the traits behave independently, we expect to see all possible combinations between
traits of both characters: round yellow, round green, wrinkled yellow and wrinkled green
seeds. Again, we expect the two types of gametes found in the parents: RY and ry and
new combinations of alleles i.e. Ry and rY.
We can then construct a Punnett square with these gametes to generate all possible
progeny. This is a 4 × 4 square with 16 possible outcomes. Filling in the Punnett square
produces all possible offspring. From this we can see that there are 9 round yellow, 3
wrinkled yellow, 3 round green, and 1 wrinkled green. This predicts a phenotypic ratio of
9:3:3:1 for traits that behave independently.
15
YR Yr yR yr
YR YYRR YYRr YyRR YyRr
Yr YYRr YYrr YyRr Yyrr
yR YyRR YyRr yyRR yyRr
yr YyRr Yyrr yyRr yyrr
Punnett square showing results of crossing of 2 True breeding individuals
(yellow rounded and green wrinkled seeded) and subsequent self crossing of
the offsprings.
True breeding yellow rounded
seeded plant
YYRR
True breeding green wrinkled
seeded plant
yyrr
YR yr
X
Yellow rounded seeded hybrid
YyRr
F1 100% yellow rounded
seeded offspring (YyRr)
Self fertilization
F2 (9 yellowrounded : 3 yellow wrinkled : 3 green rounded : 1: green wrinkled)
16
What did Mendel actually observe?
From a total of 556 seeds from self-fertilized dihybrid plants, he observed the following
results:
315 round yellow (signified R__ Y__, where the underscore indicates the presence
of either allele),
108 round green (R__ yy),
101 wrinkled yellow (rr Y__ ), and
32 wrinkled green (rr yy).
These results are very close to a 9:3:3:1 ratio. (The expected 9:3:3:1 ratio from this many
offspring would be 313:104:104:35.) The alleles of two genes appeared to behave
independently of each other. Mendel referred to this phenomenon as the traits assorting
independently. Note that this independent assortment of different alleles in no way alters
the segregation of individual pairs of alleles for each gene. Round versus wrinkled seeds
occur in a ratio of approximately 3:1 (423:133); so do yellow versus green seeds
(416:140).
17
Mendel obtained similar results for other pairs of traits. We call this Mendel’s second
law of heredity, or the Principle of Independent Assortment. This can also be stated
simply: In a dihybrid cross, the alleles of each gene assort independently.
A more precise statement would be: the segregation of different allele pairs is
independent. This statement more closely ties independent assortment to the behavior of
chromosomes during meiosis. The independent alignment of different homologous
chromosome pairs during metaphase I leads to the independent segregation of the
different allele pairs.
Q: What are the possible results for test crossing of yellow rounded, yellow
wrinkled and green rounded seeded pea plants?
Note:
Yellow rounded seeded plants may carry YYRR, YYRr, YyRR or YyRr genotype.
Yellow wrinkled seeded plants may carry YYrr or Yyrr genotype.
Green rounded seeded plants may carry yyWW or yyWw genotype.
Probability: Predicting the Results of Crosses
Probability allows us to predict the likelihood of the outcome of random events. Because
the behavior of different chromosomes (carrying alleles) during meiosis is independent,
we can use probability to predict the outcome of crosses. The probability of an event that
is certain to happen is equal to 1. In contrast, an event that can never happen has a
probability of 0. Therefore, probabilities for all other events have fractional values,
between 0 and 1. For instance, when you flip a coin, two outcomes are possible; there is
only one way to get the event ―heads‖ so the probability of heads is one divided by two,
or ½ . Another example is rolling a die; only one outcome (of six) is possible. Thus, the
probability any outcome is one divided by six, or 1/6.
In the case of genetics, consider a pea plant heterozygous for the seed color alleles Y and
y. This individual can produce two types of gametes in equal numbers, again due to the
behavior of chromosomes during meiosis. So the probability of any particular gamete
carrying a Y allele is 1 divided by 2 or, just like the coin toss.
18
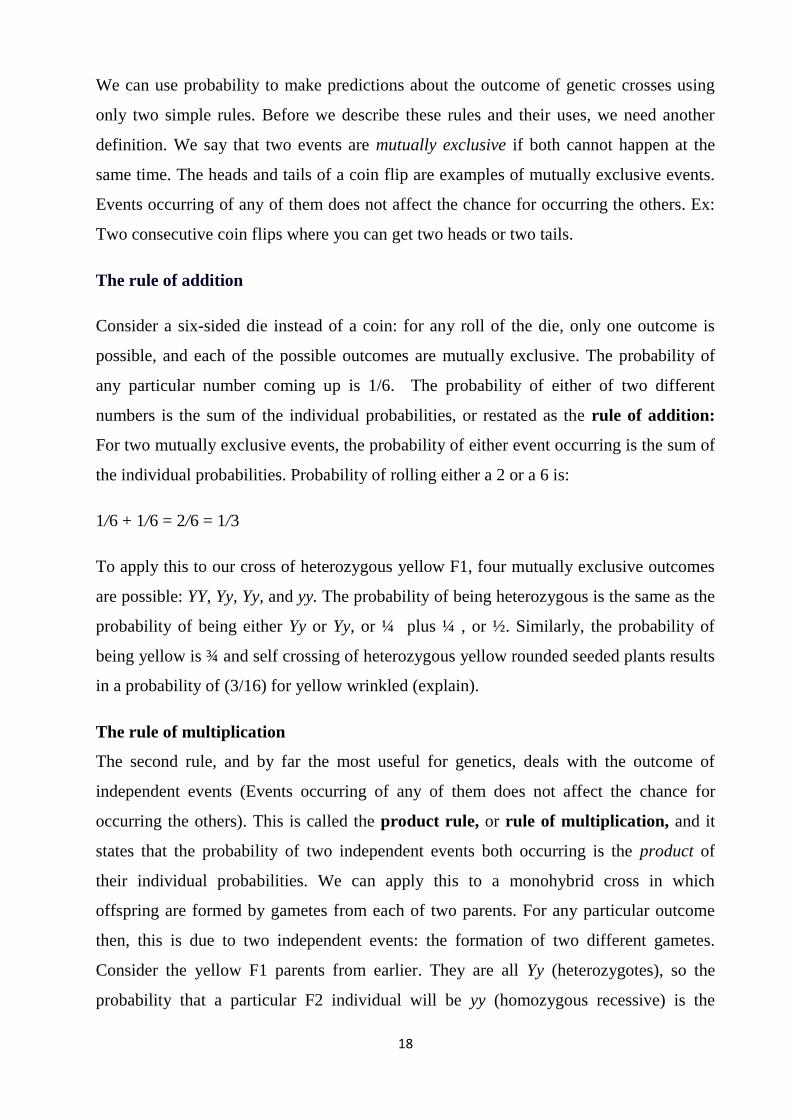
We can use probability to make predictions about the outcome of genetic crosses using
only two simple rules. Before we describe these rules and their uses, we need another
definition. We say that two events are mutually exclusive if both cannot happen at the
same time. The heads and tails of a coin flip are examples of mutually exclusive events.
Events occurring of any of them does not affect the chance for occurring the others. Ex:
Two consecutive coin flips where you can get two heads or two tails.
The rule of addition
Consider a six-sided die instead of a coin: for any roll of the die, only one outcome is
possible, and each of the possible outcomes are mutually exclusive. The probability of
any particular number coming up is 1/6. The probability of either of two different
numbers is the sum of the individual probabilities, or restated as the rule of addition:
For two mutually exclusive events, the probability of either event occurring is the sum of
the individual probabilities. Probability of rolling either a 2 or a 6 is:
1/6 + 1/6 = 2/6 = 1/3
To apply this to our cross of heterozygous yellow F1, four mutually exclusive outcomes
are possible: YY, Yy, Yy, and yy. The probability of being heterozygous is the same as the
probability of being either Yy or Yy, or ¼ plus ¼ , or ½. Similarly, the probability of
being yellow is ¾ and self crossing of heterozygous yellow rounded seeded plants results
in a probability of (3/16) for yellow wrinkled (explain).
The rule of multiplication
The second rule, and by far the most useful for genetics, deals with the outcome of
independent events (Events occurring of any of them does not affect the chance for
occurring the others). This is called the product rule, or rule of multiplication, and it
states that the probability of two independent events both occurring is the product of
their individual probabilities. We can apply this to a monohybrid cross in which
offspring are formed by gametes from each of two parents. For any particular outcome
then, this is due to two independent events: the formation of two different gametes.
Consider the yellow F1 parents from earlier. They are all Yy (heterozygotes), so the
probability that a particular F2 individual will be yy (homozygous recessive) is the
19
probability of receiving a y gamete from the male (½) times the probability of receiving a
y gamete from the female (½), or ¼. This is actually the basis for the Punnett square that
we used before. Each cell in the square was the product of the probabilities of the
gametes that contribute to the cell. Similarly, self crossing of heterozygous yellow
rounded seeded plants results in a probability of (1/16) for green wrinkled (explain).
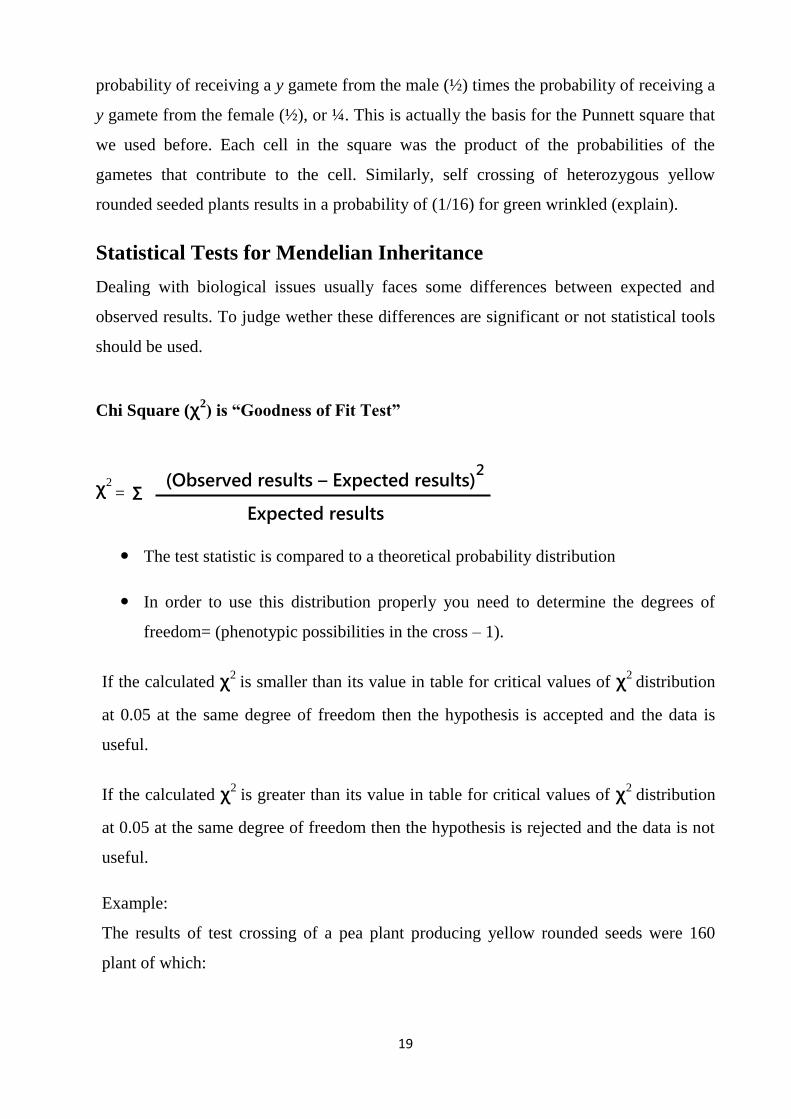
Statistical Tests for Mendelian Inheritance
Dealing with biological issues usually faces some differences between expected and
observed results. To judge wether these differences are significant or not statistical tools
should be used.
Chi Square (χ2) is “Goodness of Fit Test”
χ2 =
The test statistic is compared to a theoretical probability distribution
In order to use this distribution properly you need to determine the degrees of
freedom= (phenotypic possibilities in the cross – 1).
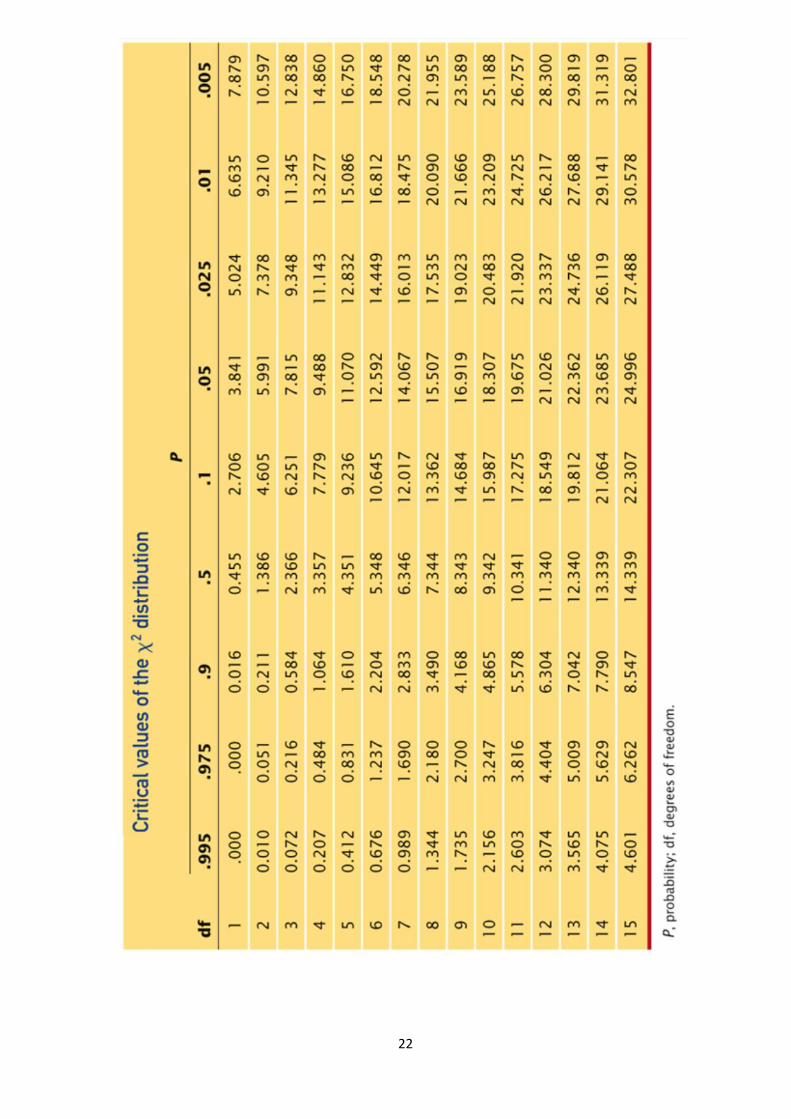
If the calculated χ2 is smaller than its value in table for critical values of χ2
distribution
at 0.05 at the same degree of freedom then the hypothesis is accepted and the data is
useful.
If the calculated χ2 is greater than its value in table for critical values of χ2
distribution
at 0.05 at the same degree of freedom then the hypothesis is rejected and the data is not
useful.
Example:
The results of test crossing of a pea plant producing yellow rounded seeds were 160
plant of which:
Ʃ (Observed results – Expected results)
2
Expected results
20
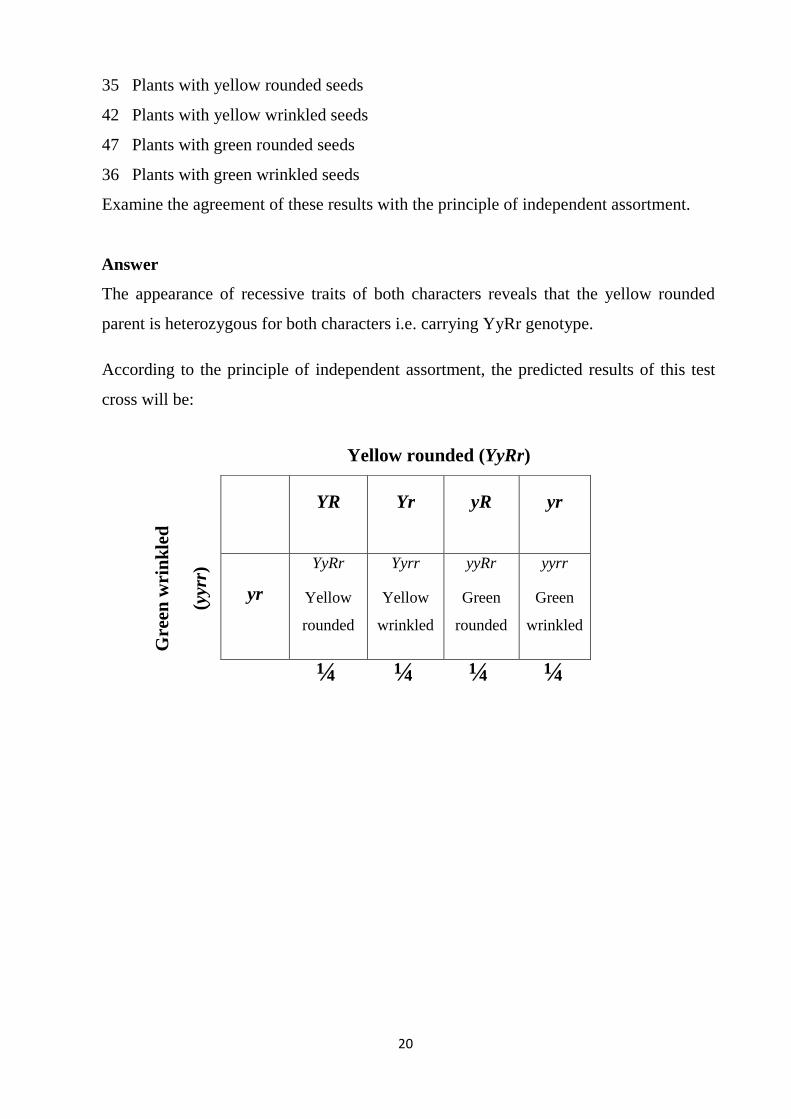
35 Plants with yellow rounded seeds
42 Plants with yellow wrinkled seeds
47 Plants with green rounded seeds
36 Plants with green wrinkled seeds
Examine the agreement of these results with the principle of independent assortment.
Answer
The appearance of recessive traits of both characters reveals that the yellow rounded
parent is heterozygous for both characters i.e. carrying YyRr genotype.
According to the principle of independent assortment, the predicted results of this test
cross will be:
YR Yr yR yr
yr
YyRr
Yellow
rounded
Yyrr
Yellow
wrinkled
yyRr
Green
rounded
yyrr
Green
wrinkled
Yellow rounded (YyRr)
Gre
en w
rin
kle
d
(yyr
r)
¼ ¼ ¼ ¼
21
Number of plants in each class = probability of its occurrence X total number of plants.
Plants with yellow rounded seeds = 160 X ¼ = 40 Plant
Plants with yellow wrinkled seeds = 160 X ¼ = 40 Plant
Plants with green rounded seeds = 160 X ¼ = 40 Plant
Plants with green wrinkled seeds = 160 X ¼ = 40 Plant
χ2 =
χ2 =
χ2 = 2.35
We have 4 phenotypic possibilities:
• Yellow Rounded
• Yellow wrinkled
• green Rounded
• green wrinkled
Degree of freedom= (phenotypic possibilities in the cross – 1) = 4 -1 = 3.
In table for critical values of χ2 distribution at 0.05 at 3 degrees of freedom
χ2 = 7.815
Thus calculated χ2 is smaller than that of table i.e. these data agree with the