15
Linkage Mapping in Drosophila Melanogaster Genetics: Fall 2012 Joshua Hanau

Linkage Mapping in Drosophila Melanogaster Genetics: Fall 2012
Joshua Hanau
Introduction:
An experiment was performed in order to determine the presence and
degree of gene linkage in Drosophila Melanogaster. Gene linkage describes whether
or not two or more genes are located on the same chromosome in a eukaryotic
individual. The degree of gene linkage can describe the relative distance between
two linked genes on a single chromosome.
Drosophila Melanogaster, which is also known by the common name “Fruit
Fly,” is an ideal organism to use for genetic studies. Drosophila proliferates rapidly,
are small, are cheap to maintain, and their phenotypes are easily observable.
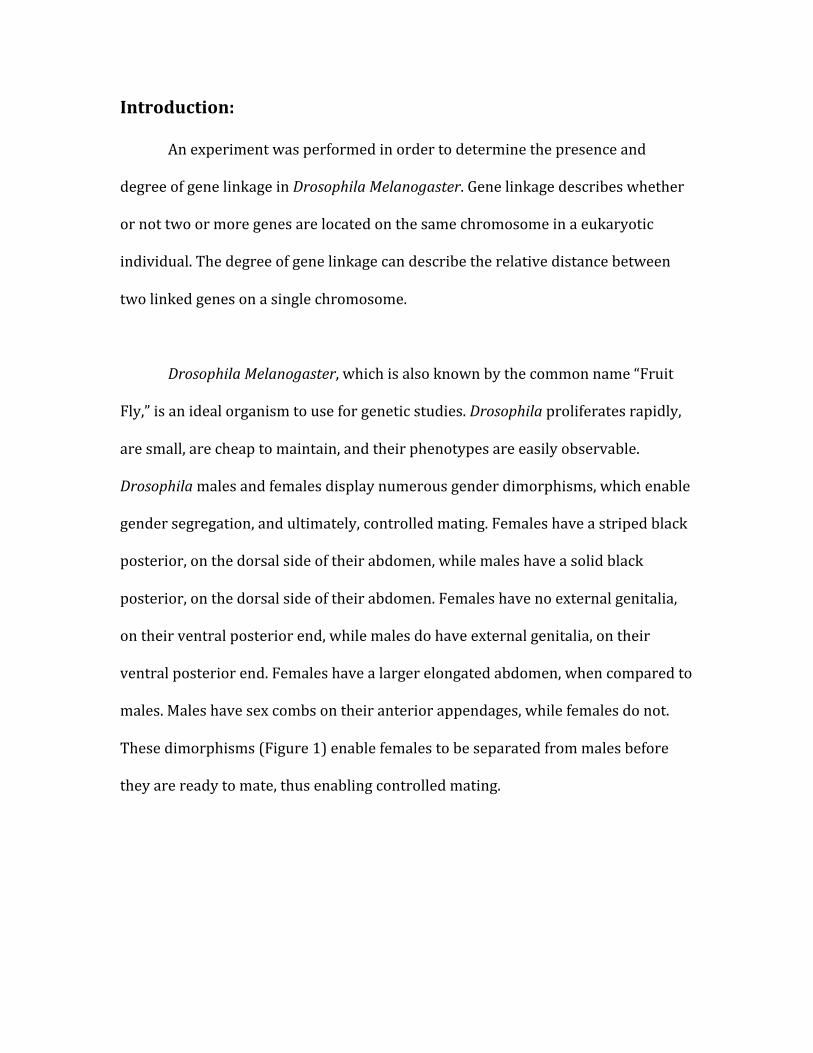
Drosophila males and females display numerous gender dimorphisms, which enable
gender segregation, and ultimately, controlled mating. Females have a striped black
posterior, on the dorsal side of their abdomen, while males have a solid black
posterior, on the dorsal side of their abdomen. Females have no external genitalia,
on their ventral posterior end, while males do have external genitalia, on their
ventral posterior end. Females have a larger elongated abdomen, when compared to
males. Males have sex combs on their anterior appendages, while females do not.
These dimorphisms (Figure 1) enable females to be separated from males before
they are ready to mate, thus enabling controlled mating.

Figure 1: Ventral Gender Dimorphisms in Drosophila [I]
A three-‐factor cross was the method used to determine whether or not three
drosophila genes were linked, and if so, to what degree. The three genes that were
analyzed displayed different phenotypes when they were in mutant and wild type
forms. The first of these genes corresponded to the fly’s eye-‐color. While wild type
flies have dull red colored eyes, the mutants displayed brighter orange colored eyes.
The second gene analyzed corresponded to the bristles located on the dorsal side of
the fly’s thorax. Wild type flies had long straight bristles, while the mutants had
short and curled bristled. The third gene analyzed corresponded to the body color
being displayed on the dorsal side of the fly’s abdominal section. The wild type flies
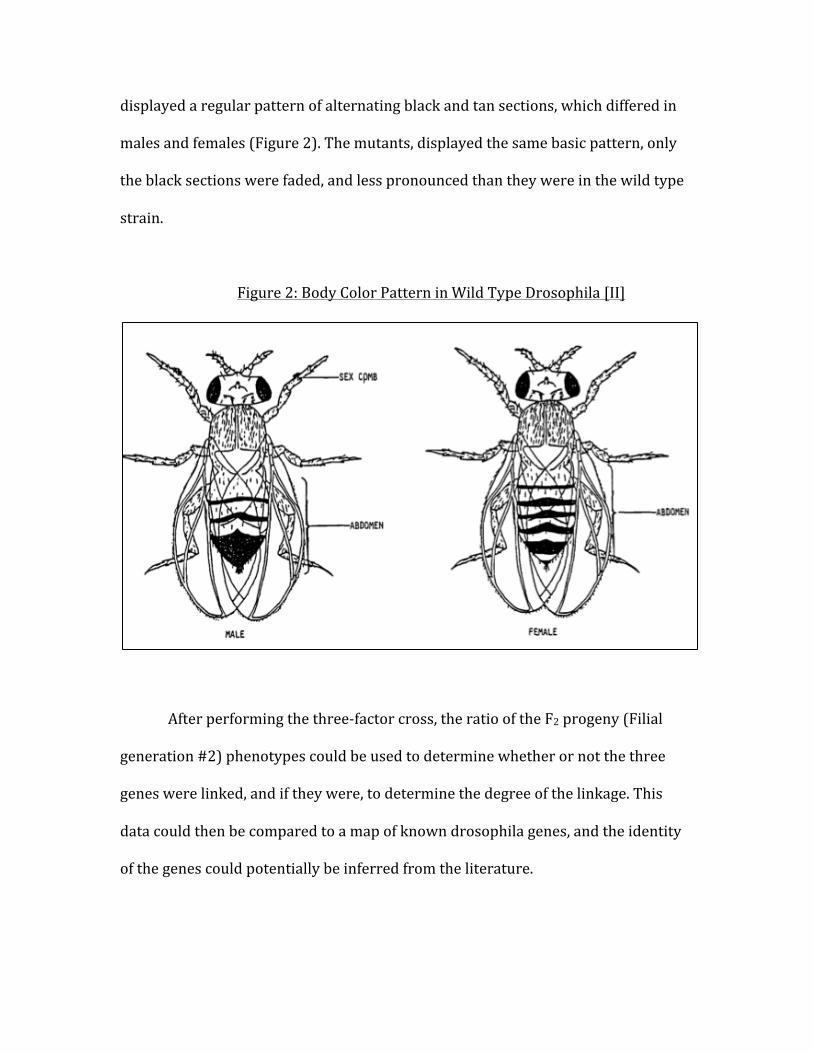
displayed a regular pattern of alternating black and tan sections, which differed in
males and females (Figure 2). The mutants, displayed the same basic pattern, only
the black sections were faded, and less pronounced than they were in the wild type
strain.
Figure 2: Body Color Pattern in Wild Type Drosophila [II]
After performing the three-‐factor cross, the ratio of the F2 progeny (Filial
generation #2) phenotypes could be used to determine whether or not the three
genes were linked, and if they were, to determine the degree of the linkage. This
data could then be compared to a map of known drosophila genes, and the identity
of the genes could potentially be inferred from the literature.
Methods:
At the start of the experiment, two strains of flies were crossed. The first
strain was a true-‐breeding wild type stock, which proves that it was homozygous for
all three wild type alleles, or +/+ ; +/+ ; +/+, where “+” indicates the wild type allele
for any given gene. The second strain was a true breeding triple mutant, which
proves it was homozygous for all three mutant alleles, or e/e ; br/br ; bc/bc, where
“e” indicates the unknown mutant eye color allele, “br” indicates the unknown
mutant bristle allele, and “bc” indicates the unknown mutant body color allele.
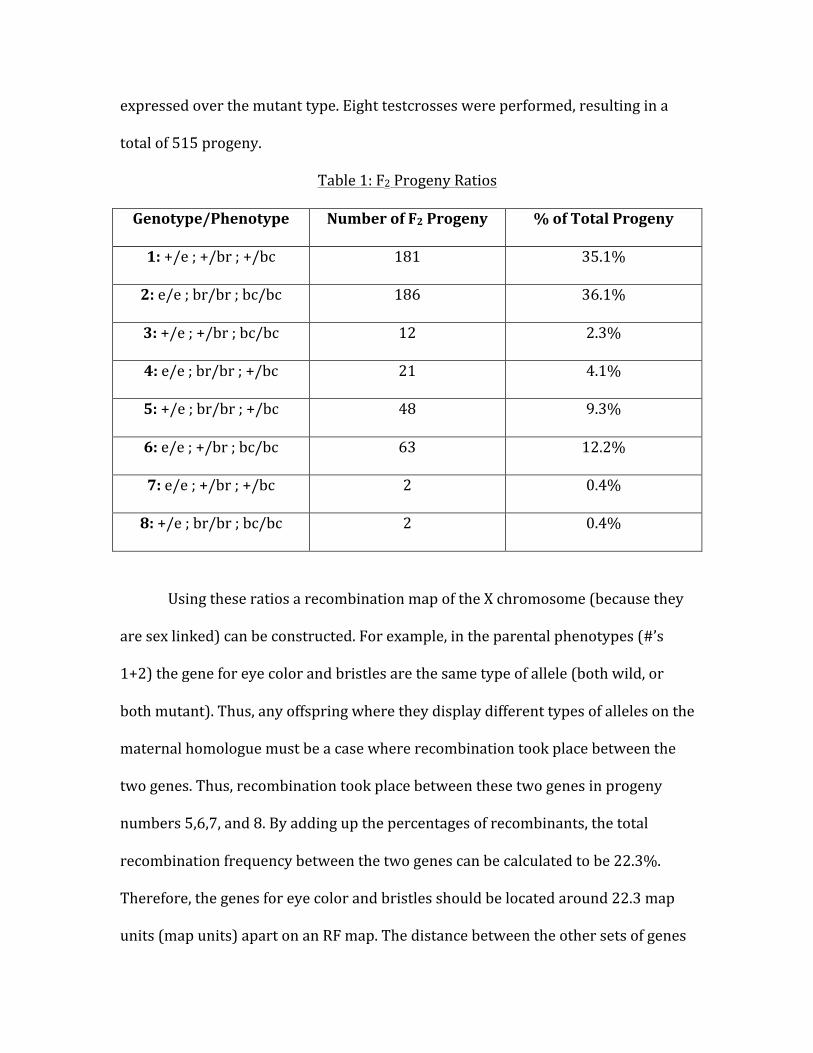
To perform a cross, virgin females of one strain must be placed in a vial with
males of the other strain. Virgin females can be identified by their pale coloring,
their folded wings, their enlarged abdomens, and by the presence of a meconium
(Figure 3). Not all four of these signs are required, but the presence of a meconium
is the most important sign of recent eclosion (emergence from the pupa casing), and
the best guarantee of a female fly being a virgin, since drosophila females do not
mate for the first few hours (around 8 on average) after eclosion. Using virgin
females in all crosses is crucial. Female drosophila can only mate with one male, and
they then store that male’s sperm for the rest of their adult life cycle. Therefore, in
order to control mating, females must be isolated soon after they eclose from their
pupa casing, while they still exhibit the features listed above, and have a guaranteed
virgin status.

Figure 3: Virgin Female Drosophila Image [III]
The general pattern of a cross was as follows (Figure 4). Once 4-‐5 virgin
females were isolated, they were placed in a vial with 8-‐10 males from the other
cross strain. The flies would mate, and the females began laying eggs shortly
thereafter. After the eggs were laid, the larva, or 1st instars, would emerge within a
day or so. The larva would continue to grow, and pass through the 2nd and 3rd instar
phases. During the 3rd instar phase, the larva would climb up the wall of the vial and
form a pupa case. Around four days later, and around 10 days after the cross was
started, a new generation of adult flies would emerge. The parental generation was

removed from the vial by this point, to ensure that the two generations were kept
separate.
Figure 4: Drosophila Life Cycle [IV]
Assuming that none of the three genes are sex linked, the progeny of this
initial cross would all display wild type phenotypes, since the wild type is
presumably dominant, and all the offspring would be heterozygous for all three
genes (+/e ; +/br ; +/bc). However, if one or more genes are sex linked, then there is
a possibility that the male offspring, who are hemizygous for x linked genes, would
display the mutant phenotype. To test for sex linkage, reciprocal crosses were

performed. This means that there were two crosses performed between the two
strains, with the genders of each strain alternated in the two crosses. One cross was
between wild type males and female mutants, while the other was between male
mutants and wild type females. If one or more genes were sex linked, then the male
F1 generation (Filial generation #1) offspring of the reciprocal crosses would always
have the same phenotype as their mothers for that one or more genes, instead of
simply having the wild type phenotype that would be expected for all F1 flies.
The second cross was a test cross. A test cross is when heterozygous
individuals (F1 virgin females) are crossed with double mutant individuals (Parental
mutant males). This cross is performed in order to determine whether or not the
genes assort independently. If the genes assorted independently, then all 8 potential
phenotype combinations (2 phenotypes for 3 genes. 23 = 8) would ideally show up
with the same frequency, 12.5%, in the F2 generation. If the parental phenotypes are
displayed the majority of the time, or far greater than the expected 12.5% (i.e. no
need for chi squared analysis), then it can be assumed that the three genes are
linked. Since linked genes are on the same chromosome, it makes sense that the
genes are inherited together the majority of the time, and it explains the lack of
independent assortment. Additionally, any phenotypes that are not parental, in the
linkage scenario, must be the result of crossing over during meiosis, which is also
known as meiotic recombination. Thomas Hunt Morgan’s research showed that the
frequency of recombination between two genes is directly proportional to the
physical distance between them. Thus, using recombinant frequencies, an RF map of

the chromosome, which is similar to the physical map (but not identical), can be
constructed using recombinant frequencies. The progression of crosses performed
is shown below (Figure 5).
Figure 5: Progression of Crosses Performed
Results:
The results of the reciprocal crosses suggest that all three genes are sex
linked, since the male offspring of the cross with the mutant phenotype females
were mutant for all three genes. By extension, all three genes are linked, since there
is only one sex chromosome. Therefore, the ratio of F2 phenotypes were expected to,
and in fact did, deviate from the 1:1:1:1:1:1:1:1 ratio that would be expected in a
case of independent assortment. The number and percentage of each phenotype is
displayed below (Table 1). In addition to there being eight possible phenotypes,
there are eight possible genotypes that can result from this type of test cross. Each
genotype corresponds to a phenotype, where the wild type allele (+) is always
P: ♂ +/+ ; +/+ ; +/+ x ♀ e/e ; br/br ; bc/bc + reciprocal cross
F1: ♂ e/e ; br/br; bc/bc x ♀ +/e ; +/br ; +/bc
F2: Eight possible phenotypes (See results section)
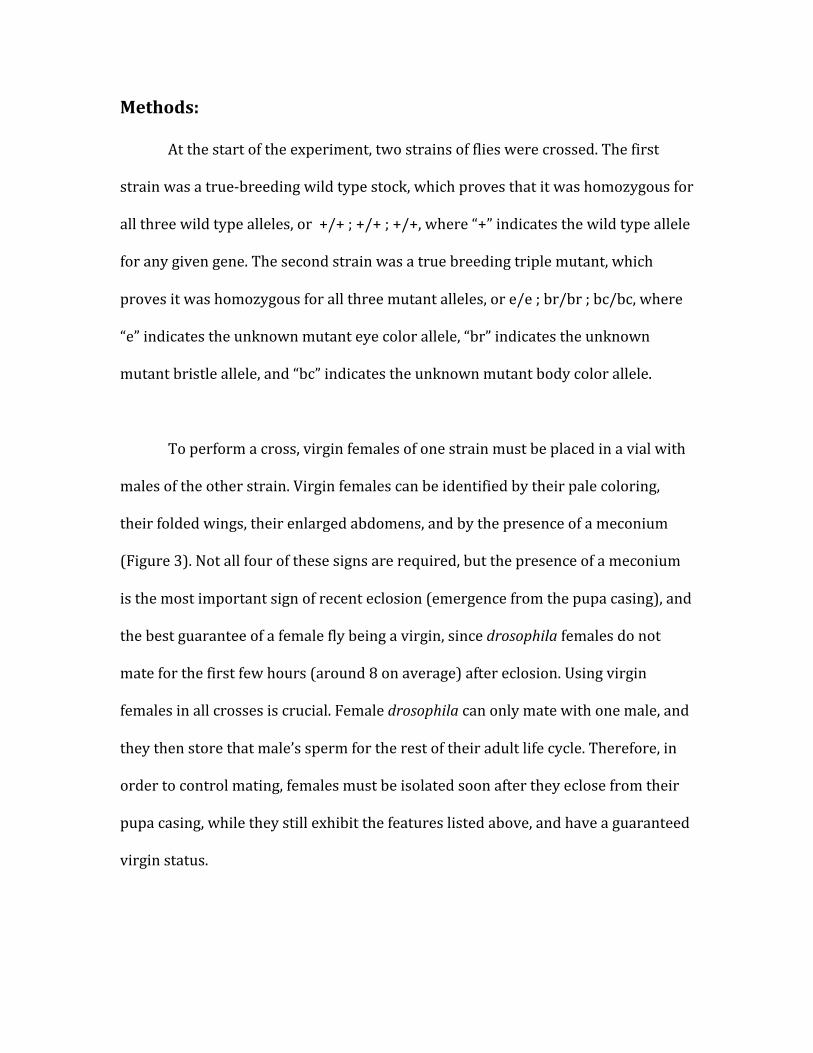
expressed over the mutant type. Eight testcrosses were performed, resulting in a
total of 515 progeny.
Table 1: F2 Progeny Ratios
Genotype/Phenotype Number of F2 Progeny % of Total Progeny
1: +/e ; +/br ; +/bc 181 35.1%
2: e/e ; br/br ; bc/bc 186 36.1%
3: +/e ; +/br ; bc/bc 12 2.3%
4: e/e ; br/br ; +/bc 21 4.1%
5: +/e ; br/br ; +/bc 48 9.3%
6: e/e ; +/br ; bc/bc 63 12.2%
7: e/e ; +/br ; +/bc 2 0.4%
8: +/e ; br/br ; bc/bc 2 0.4%
Using these ratios a recombination map of the X chromosome (because they
are sex linked) can be constructed. For example, in the parental phenotypes (#’s
1+2) the gene for eye color and bristles are the same type of allele (both wild, or
both mutant). Thus, any offspring where they display different types of alleles on the
maternal homologue must be a case where recombination took place between the
two genes. Thus, recombination took place between these two genes in progeny
numbers 5,6,7, and 8. By adding up the percentages of recombinants, the total
recombination frequency between the two genes can be calculated to be 22.3%.
Therefore, the genes for eye color and bristles should be located around 22.3 map
units (map units) apart on an RF map. The distance between the other sets of genes

can be calculated in the same way (Table 2). The one small point to note is that in
between “br” and bc,” the percentage of double recombinants needs to be counted
twice, since two crossover events took place between these two genes in those
scenarios.
Table 2: Recombinant Frequencies
Alleles of Interest Calculation Recombinant Frequency
“e” and “br” 9.3 + 12.2 + 0.4 + 0.4 22.3% (m.u.)
“e” and “bc” 2.3 + 4.1 + 0.4 + 0.4 7.2% (m.u.)
“br” and “bc” 2.3 + 4.1 + 9.3 + 12.2 +
2(0.4) + 2(0.4)
29.5% (m.u.)
Using the tabulated data, an RF map for these three genes can be constructed
(Figure 6). A useful trick for constructing a recombinant map is to look for the
“flipped allele” in the least common phenotype, which is always the result of the
double crossover. This flipped allele in the double recombinant will always be
located between the other two genes [V]. Since the allele for eye color differs from
the two parental strains in the double recombinant, the gene for eye color must be
located between the other two genes on the recombinant map.
Figure 6: RF Map of Three Genes of Interest

Conclusions:
By comparing these results to a map of known genes on the drosophila X
chromosome (Figure 7), the identity of the three genes can be inferred. The three
genes must correspond to eye color, bristle shape, and body color. The distances
between the three known genes must also be similar to the distances calculated
between the three unknown genes in this lab report.
Figure 7: RF Map of Drosophila “X” Chromosome [VI]
This small segment of the Drosophila X chromosome contains the most likely
candidates for our three unknown genes. The calculated distance between our
bristle and body color mutations is 29.5 map units, while in this map, the distance
between “forked bristles” and “tan bodies” is 29.2 maps units. Since both of these
mutations sound like they could correspond with our mutant phenotypes, it is
reasonable to conclude that the two genes that contain these two mutant alleles are
the same as our first unknown genes. Our eye color mutation is located 7.2 maps

units away from our body color mutation, and 22.3 map units away from our bristle
mutation. On this map of known genes, the mutation for “Vermillion eyes” is located
5.5 maps units away from the “tan body” mutation, and 23.7 map units away from
the “forked bristles” mutation. These results are similar enough to conclude that our
eye color mutation might be caused by a mutant “vermillion” allele. Thus, it is
reasonable to conclude that our three unknown genes, correspond with the genes
whose mutated forms result in the “tan body,” “Forked bristles,” and “vermillion
eyes” mutations.
This inference was much easier to make due to the use of a reciprocal cross.
The reciprocal crosses showed that all three genes were sex linked, which led to the
conclusion that all three genes were located on the X chromosome. This narrowed
down the search for the identity of the unknown alleles considerably.
Although the results were pretty close (assuming these are the correct
genes), there was some error, which has to be explained. The most obvious cause is
human error. It was not always easy to distinguish the mutant body color from the
wild type. This may have resulted in incorrect phenotype tallying, and therefore,
faulty recombinant frequencies. The same is true for eye color, which was not
always 100% discernable. The bristle mutation was the only one that was
completely obvious in all cases.

Another source of error may have been due to a failed separation of
generations. In one case, flies were scored from a vial 22 days after the cross was set
up. It is possible that some of the flies that were counted belonged to the F3
generation, and may have interfered with the results.
To verify the identity of the genes a complementation test could be
performed. Flies that are known to be heterozygous for the three genes mentioned
above could be crossed with the unknown mutant parental strain. If the result were
a wild type phenotype (or phenotypes), then the hypothesis of the genes identity of
that gene (or genes) must be incorrect, since complementation suggests the
mutations are on different genes. If mutant phenotype flies were prevalent in 50%
of the offspring, for one or all three genes, then the identity of that mutant allele, or
alleles, will be confirmed.
Citations:
[I]: http://flymove.uni-‐
muenster.de/Genetics/Flies/MaleFemale/MaleFemalepage.html?http&&&flymove.u
ni-‐muenster.de/Genetics/Flies/MaleFemale/MaleFemaleTxt.html
[II]: http://www.ableweb.org/volumes/vol-‐10/15-‐pollock.pdf
[III]: See [I]
[IV]: See [II]

[V]: Griffiths, Anthony; Wessler, Susan; Carroll, Sean; Doebley, John (2012).
Introduction to Genetic Analysis-‐ 10th Edition. New York City: W.H. Freeman and
Company. Pages 134-‐135.
[VI]: http://www.blacksage.com/APBiology/Handouts/DrosophilaMap.htm


