35
Genome Evolution. Amos Tanay 2009 Genome evolution Lecture 12: epistasis and the evolution of gene regulation
| Date post: | 16-Dec-2015 |
| Category: |
Documents |
| Upload: | stewart-hood |
| View: | 226 times |
| Download: | 4 times |
Genome Evolution. Amos Tanay 2009
Genome evolution
Lecture 12: epistasis and the evolution of gene regulation
Genome Evolution. Amos Tanay 2009
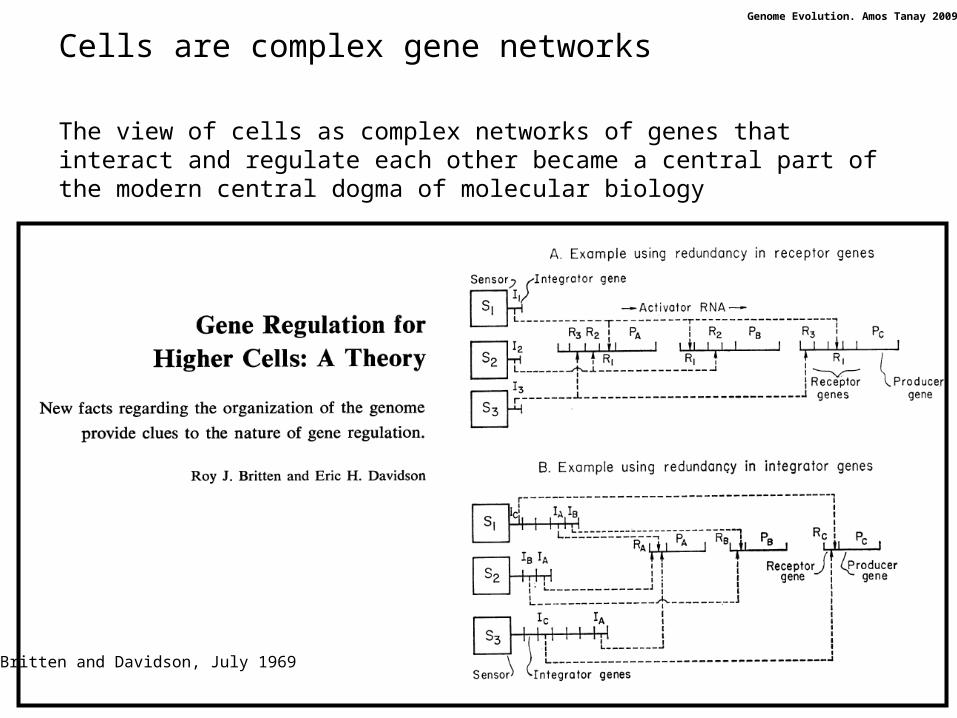
Britten and Davidson, July 1969
The view of cells as complex networks of genes that interact and regulate each other became a central part of the modern central dogma of molecular biology
Cells are complex gene networks
Genome Evolution. Amos Tanay 2009
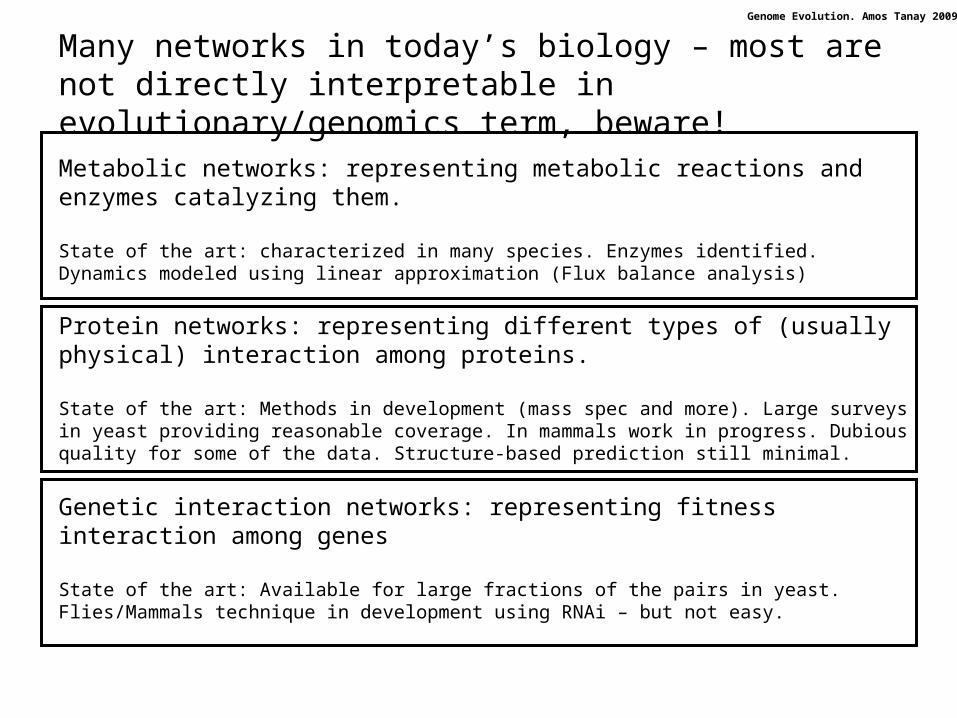
Many networks in today’s biology – most are not directly interpretable in evolutionary/genomics term, beware!
Metabolic networks: representing metabolic reactions and enzymes catalyzing them.
State of the art: characterized in many species. Enzymes identified. Dynamics modeled using linear approximation (Flux balance analysis)
Protein networks: representing different types of (usually physical) interaction among proteins.
State of the art: Methods in development (mass spec and more). Large surveys in yeast providing reasonable coverage. In mammals work in progress. Dubious quality for some of the data. Structure-based prediction still minimal.
Genetic interaction networks: representing fitness interaction among genes
State of the art: Available for large fractions of the pairs in yeast. Flies/Mammals technique in development using RNAi – but not easy.
Genome Evolution. Amos Tanay 2009
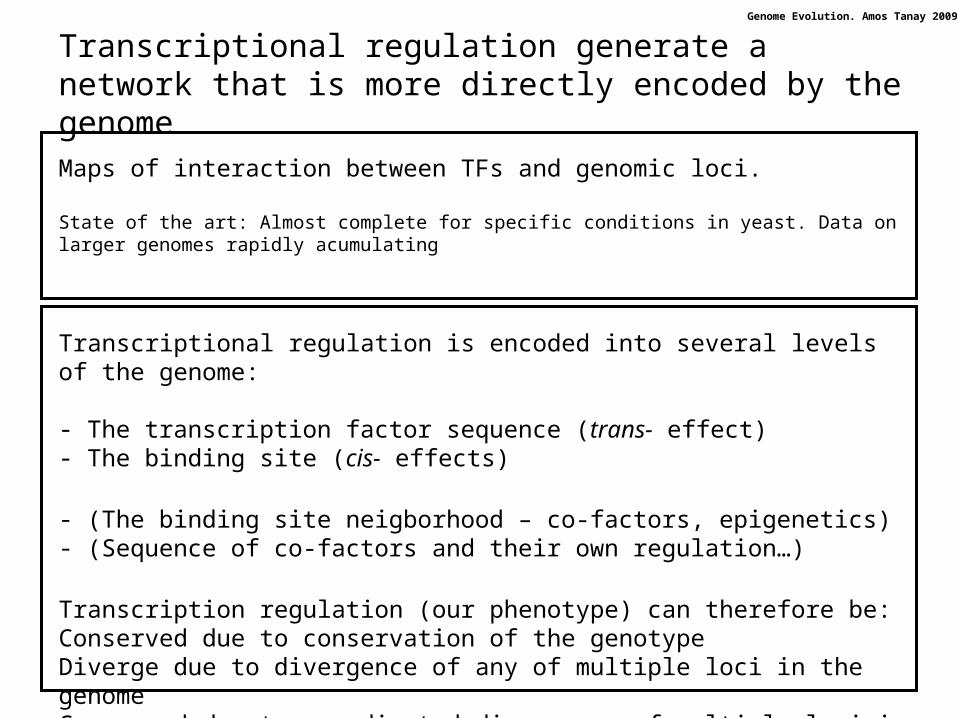
Transcriptional regulation generate a network that is more directly encoded by the genome
Maps of interaction between TFs and genomic loci.
State of the art: Almost complete for specific conditions in yeast. Data on larger genomes rapidly acumulating
Transcriptional regulation is encoded into several levels of the genome:
- The transcription factor sequence (trans- effect)- The binding site (cis- effects)
- (The binding site neigborhood – co-factors, epigenetics)- (Sequence of co-factors and their own regulation…)
Transcription regulation (our phenotype) can therefore be:Conserved due to conservation of the genotypeDiverge due to divergence of any of multiple loci in the genomeConserved due to coordinated divergence of multiple loci in the genome
Genome Evolution. Amos Tanay 2009
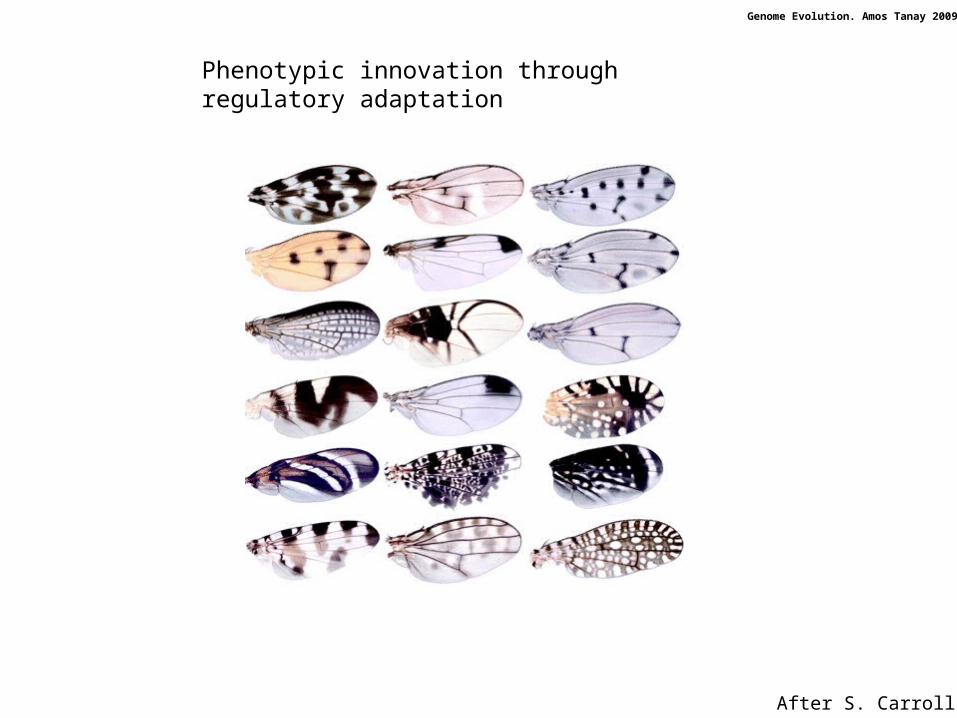
After S. Carroll
Phenotypic innovation through regulatory adaptation
Genome Evolution. Amos Tanay 2009
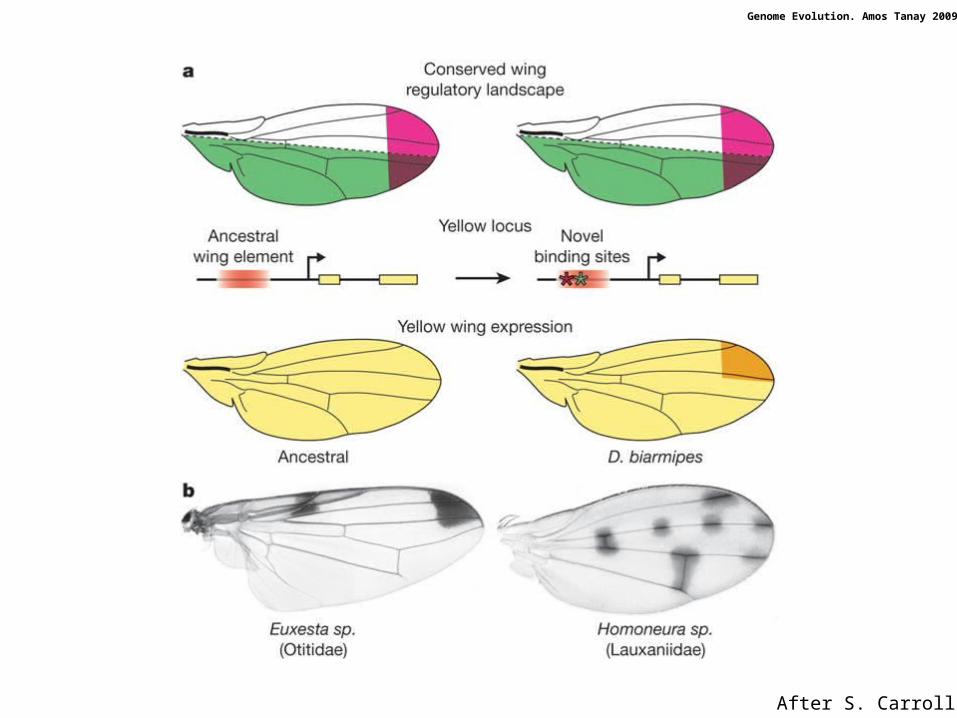
After S. Carroll
Genome Evolution. Amos Tanay 2009
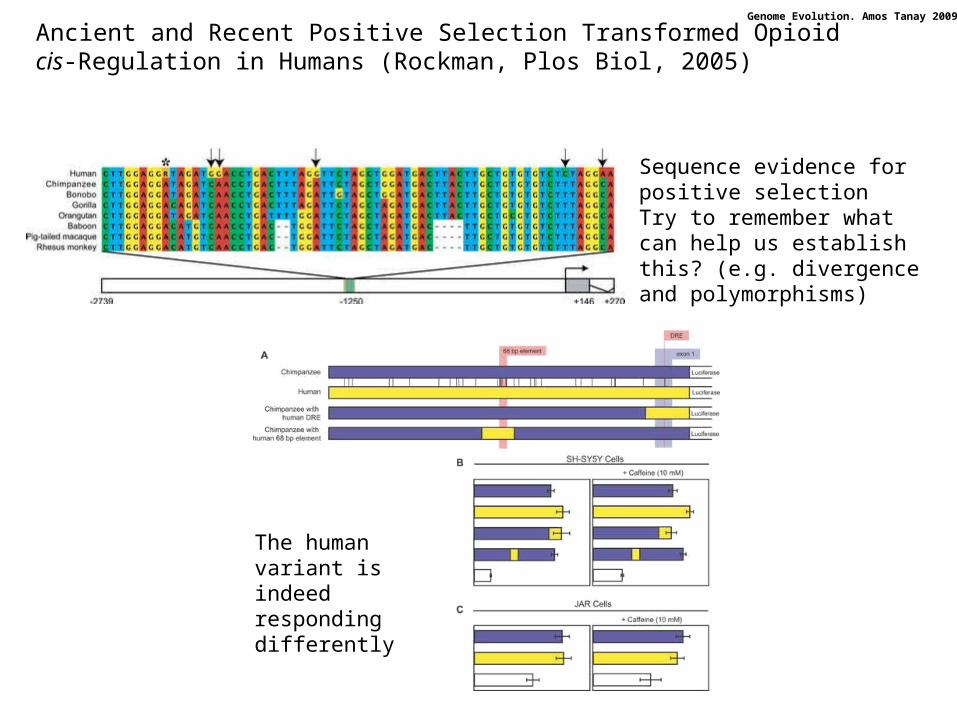
Ancient and Recent Positive Selection Transformed Opioid cis-Regulation in Humans (Rockman, Plos Biol, 2005)
Sequence evidence for positive selectionTry to remember what can help us establish this? (e.g. divergence and polymorphisms)
The human variant is indeed responding differently

Genome Evolution. Amos Tanay 2009
Big questions in evolution of regulation
• How does the network structure affect genome evolution (conservation and divergence)? Can we enhance our understanding of these effects at the population genetics level?
• Which levels in the genome drives regulatory innovation? (cis- or trans-)
• What are the major drivers of phenotypic innovation – regulation or proteins?
Big challenges in comparative genomics of regulation:
• Can we infer regulatory mechanisms from patterns of conservation and divergence?
• Can we combine functional experiments on the regulatory phenotype into our models?
• Would extensive comparative genomic ultimately breaks regulatory codes that are currently not understood?
Genome Evolution. Amos Tanay 2009
Comparative genomics:
• Obtain a set of sequenced genome• Collect some functional data on them (expression, TF interaction,
epigenomics)• Describe the conservation and divergence of the sequence and functional
data• Build models that describe genome evolution given some regulatory potential
and fit it to the data – then infer function from the sequence
Interventions• Work with two or more species
• Introduce some genomic alteration, emulating some evolutionary scenario (possibly and absurdic one)
• Examine the behavior of the altered genomic fragment
Evolutionary experiment• Evolve strains given some controlled conditions
• Follow phenotypic and genomic changes
• (why isn’t it actually possible?) (think about s and
Genome Evolution. Amos Tanay 2009
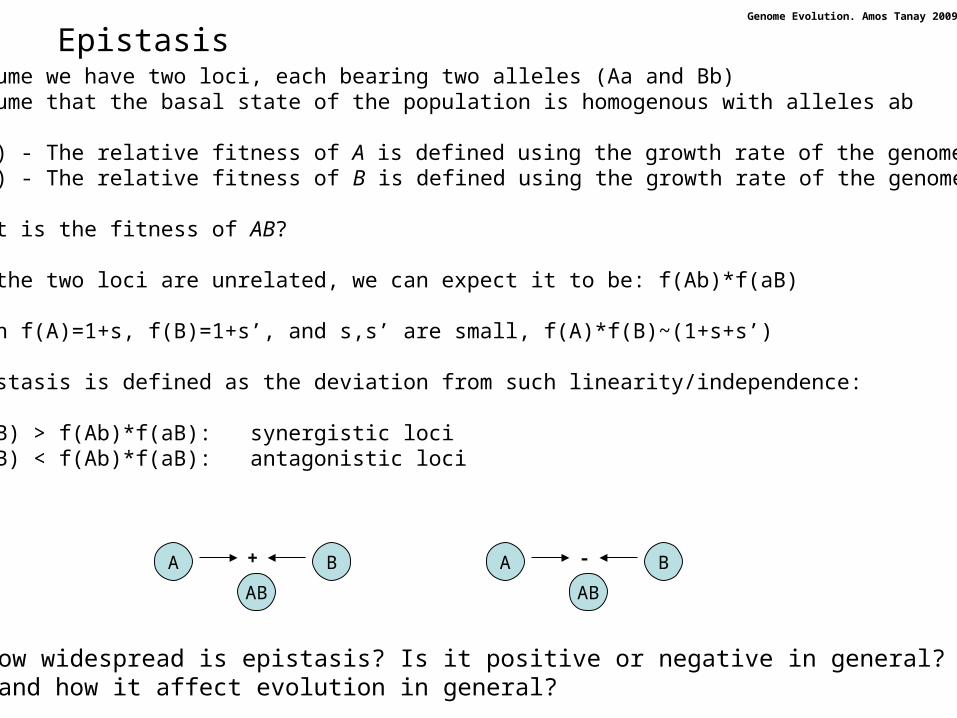
EpistasisAssume we have two loci, each bearing two alleles (Aa and Bb)Assume that the basal state of the population is homogenous with alleles ab
f(A) - The relative fitness of A is defined using the growth rate of the genome Abf(B) - The relative fitness of B is defined using the growth rate of the genome aB
What is the fitness of AB?
If the two loci are unrelated, we can expect it to be: f(Ab)*f(aB)
When f(A)=1+s, f(B)=1+s’, and s,s’ are small, f(A)*f(B)~(1+s+s’)
Epistasis is defined as the deviation from such linearity/independence:
f(AB) > f(Ab)*f(aB): synergistic locif(AB) < f(Ab)*f(aB): antagonistic loci
A B
AB
+ A B
AB
-
How widespread is epistasis? Is it positive or negative in general? and how it affect evolution in general?

Genome Evolution. Amos Tanay 2009
Testing epistasis in viruses: directed mutagenesis
Sanjuan, PNAS 2004
47 genotypes of vesicular stomatitis virus carrying pairs of nucleotide substitution mutations (filled)15 genotypes carrying pairs of beneficial mutations (empty circles)
Epistasis is generally negative here

Genome Evolution. Amos Tanay 2009
Testing epistasis in viruses: HIV-1 isolated drug resistant strains
Comparing growth in drug-free media (extracting viral sequence and reintegrating it in a virus model)Sequencing strains, comparing to some standardPlotting fitness relative to the number of mutations:
Bonhoeffer et al, science 2004
For each pair of loci, compute average fitness for aa,aB,Aa and BB, then estimate epistasis. To assess significance, recompute the same after shuffling the sequences
Mean is significantly higher than randomized meansEffect is stronger when analysis is restricted to 59 loci with significant effect on fitness
Results suggesting that epistasis tends to be positive (at least in these viruses and in this condition)
Genome Evolution. Amos Tanay 2009
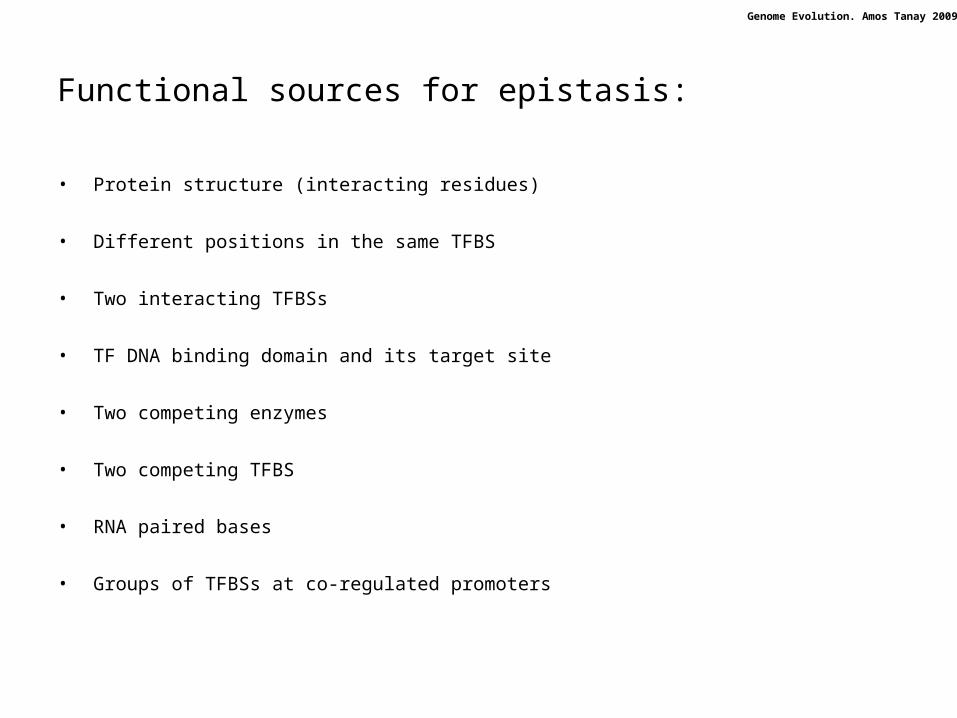
Functional sources for epistasis:
• Protein structure (interacting residues)
• Different positions in the same TFBS
• Two interacting TFBSs
• TF DNA binding domain and its target site
• Two competing enzymes
• Two competing TFBS
• RNA paired bases
• Groups of TFBSs at co-regulated promoters
Genome Evolution. Amos Tanay 2009
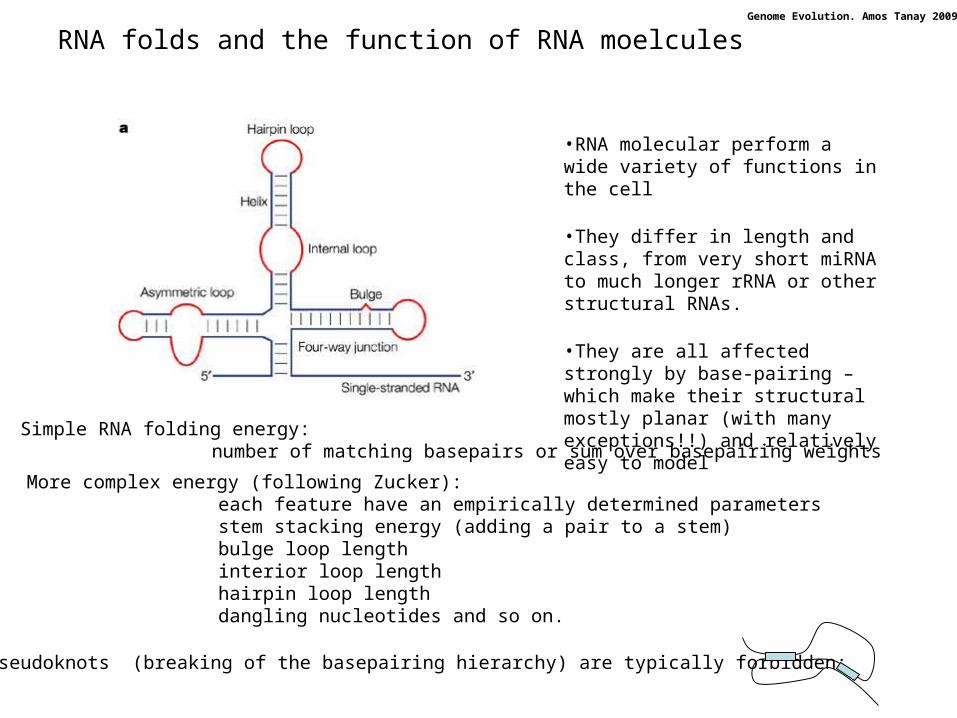
RNA folds and the function of RNA moelcules
•RNA molecular perform a wide variety of functions in the cell
•They differ in length and class, from very short miRNA to much longer rRNA or other structural RNAs.
•They are all affected strongly by base-pairing – which make their structural mostly planar (with many exceptions!!) and relatively easy to model
Simple RNA folding energy: number of matching basepairs or sum over basepairing weights
More complex energy (following Zucker): each feature have an empirically determined parametersstem stacking energy (adding a pair to a stem)bulge loop lengthinterior loop lengthhairpin loop lengthdangling nucleotides and so on.
Pseudoknots (breaking of the basepairing hierarchy) are typically forbidden:
Genome Evolution. Amos Tanay 2009
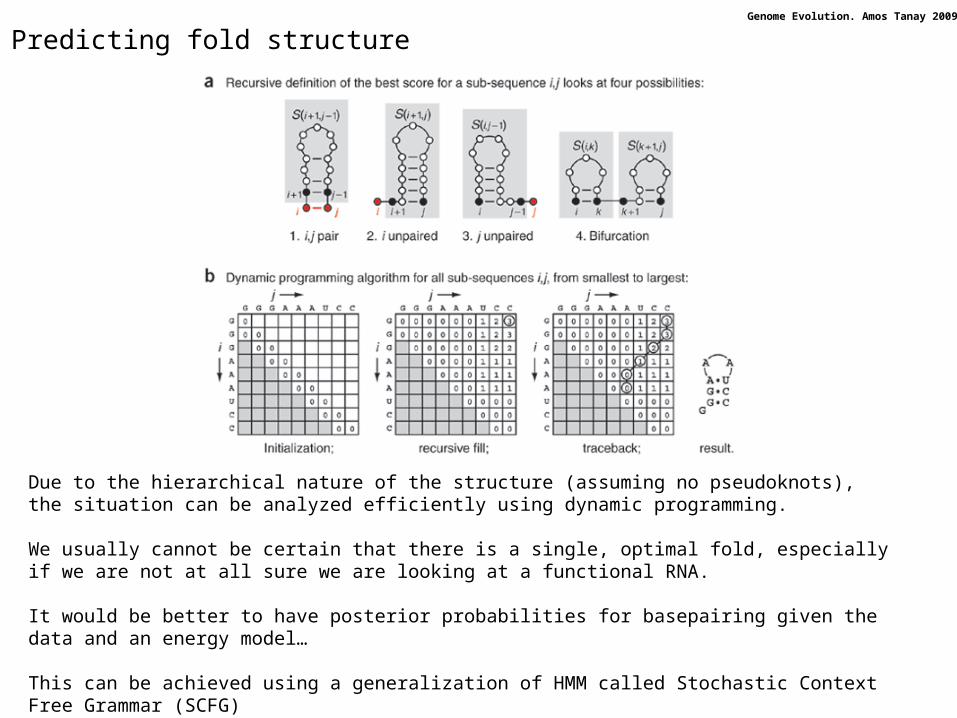
Predicting fold structure
Due to the hierarchical nature of the structure (assuming no pseudoknots), the situation can be analyzed efficiently using dynamic programming.
We usually cannot be certain that there is a single, optimal fold, especially if we are not at all sure we are looking at a functional RNA.
It would be better to have posterior probabilities for basepairing given the data and an energy model…
This can be achieved using a generalization of HMM called Stochastic Context Free Grammar (SCFG)
Genome Evolution. Amos Tanay 2009
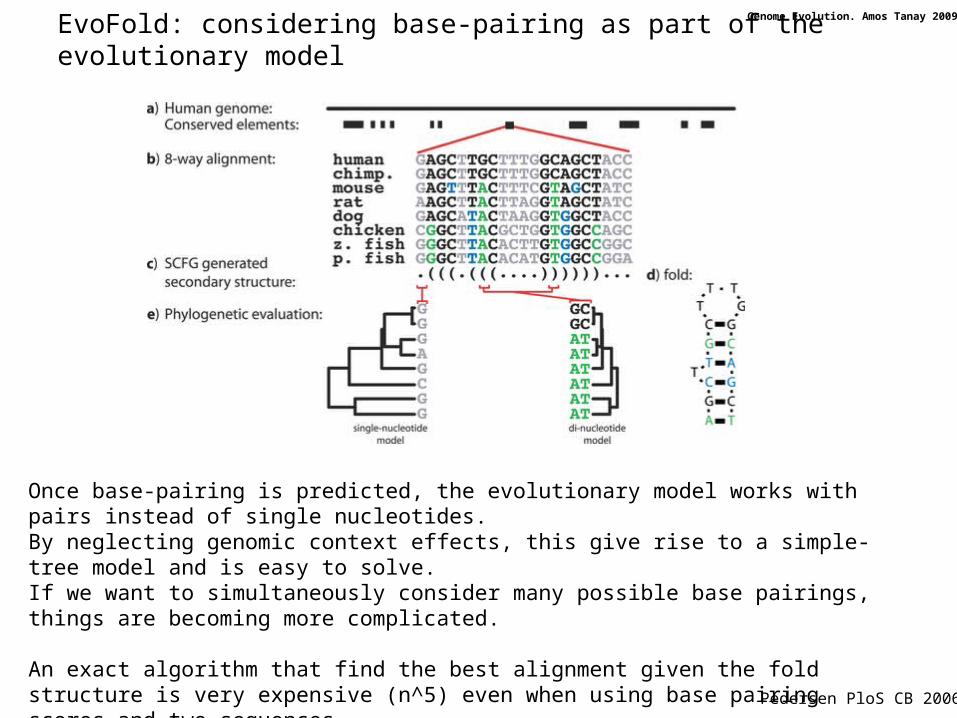
EvoFold: considering base-pairing as part of the evolutionary model
Once base-pairing is predicted, the evolutionary model works with pairs instead of single nucleotides.By neglecting genomic context effects, this give rise to a simple-tree model and is easy to solve.If we want to simultaneously consider many possible base pairings, things are becoming more complicated.
An exact algorithm that find the best alignment given the fold structure is very expensive (n^5) even when using base pairing scores and two sequences. Pedersen PloS CB 2006

Genome Evolution. Amos Tanay 2009
EvoFold: considering base-pairing as part of the evolutionary model
Whenever we discover compensatory mutations, the prediction of a functional RNA becomes much stronger.
Genome Evolution. Amos Tanay 2009
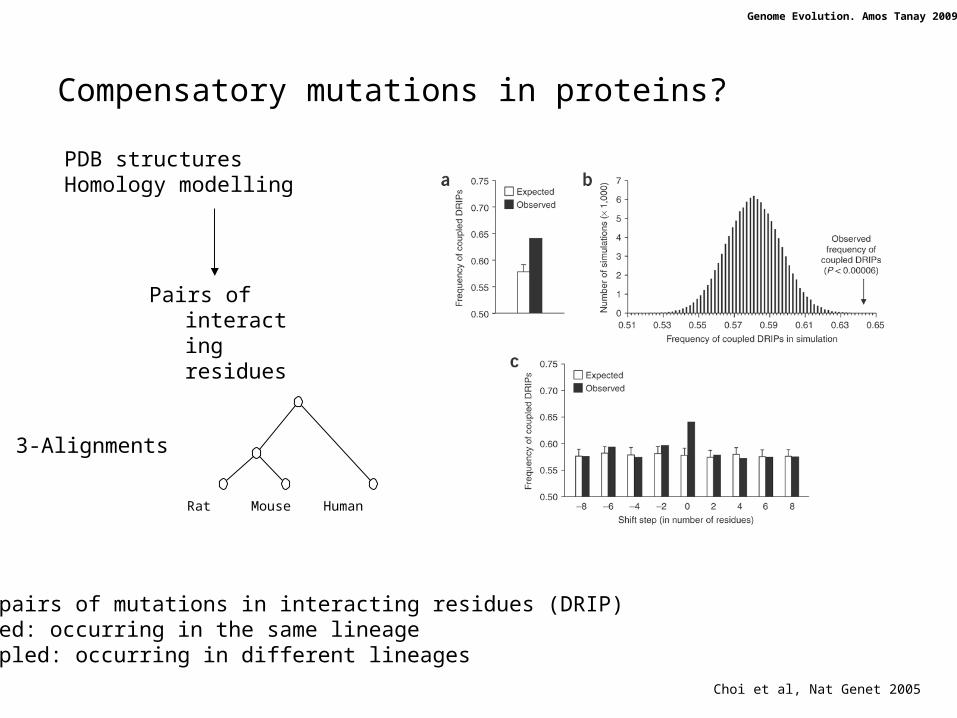
Compensatory mutations in proteins?
PDB structuresHomology modelling
3-Alignments
Pairs of interacting residues
Rat Mouse Human
Choi et al, Nat Genet 2005
Find pairs of mutations in interacting residues (DRIP)Coupled: occurring in the same lineageUncoupled: occurring in different lineages
Genome Evolution. Amos Tanay 2009
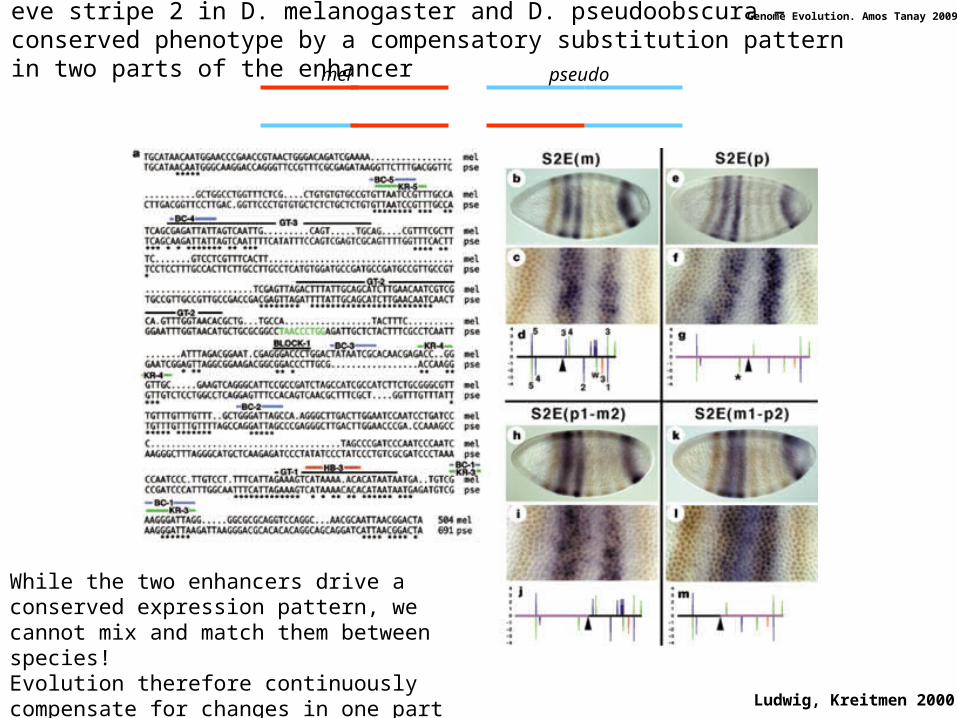
Ludwig, Kreitmen 2000
eve stripe 2 in D. melanogaster and D. pseudoobscura – conserved phenotype by a compensatory substitution pattern in two parts of the enhancer
mel pseudo
While the two enhancers drive a conserved expression pattern, we cannot mix and match them between species!Evolution therefore continuously compensate for changes in one part with changes in the other.
Genome Evolution. Amos Tanay 2009
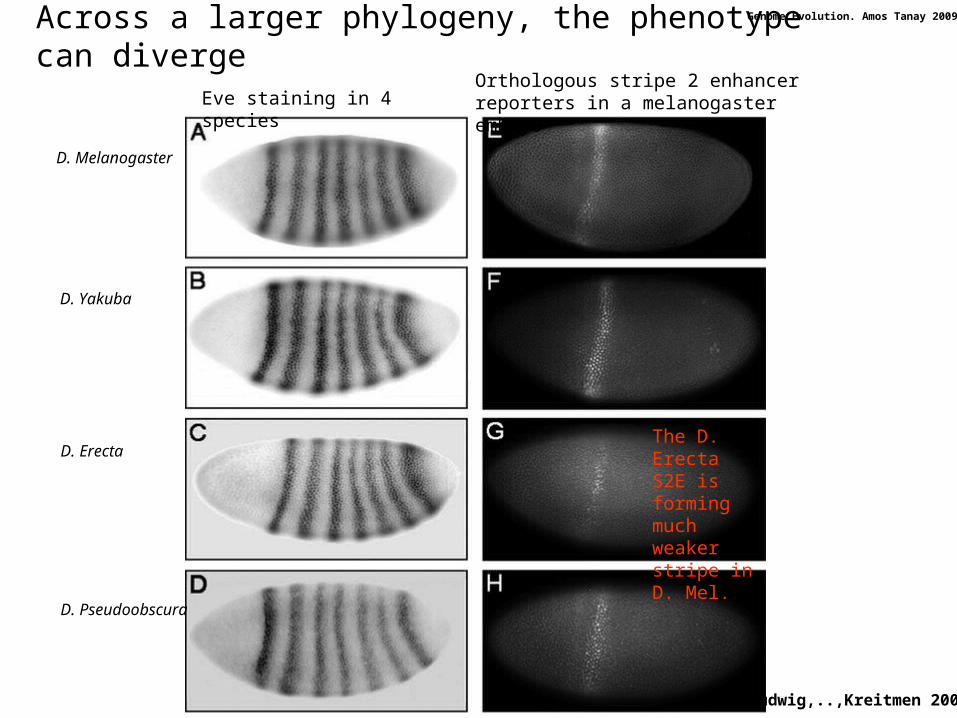
D. Melanogaster
D. Yakuba
D. Erecta
D. Pseudoobscura
Across a larger phylogeny, the phenotype can diverge
Ludwig,..,Kreitmen 2005
The D. Erecta S2E is forming much weaker stripe in D. Mel.
Eve staining in 4 speciesOrthologous stripe 2 enhancer reporters in a melanogaster embryo

Genome Evolution. Amos Tanay 2009
D. Melanogaster
D. Yakuba
D. Erecta
D. Pseudoobscura
The conservation of the enhancer sequence itself cannot predict the conservation of the phenotype
Enhancer functional in mel.
Enhancer functional in mel.
Enhancer not functional in mel.
Sequence conserved
Sequence conserved
Sequence not conserved
May reflect compensation
May reflect trans- diverg
All conserved

Genome Evolution. Amos Tanay 2009
Species-Specific Transcription in Mice Carrying Human Chromosome 21 (Wilson et al. 2008)
Duncan Odom and co-workers introduced human chromosome 21 into mouse cellsUsing ChIP they showed that most binding sites (of enhancer mostly) were remain active as in human cells – suggesting they are determined in cis.
Genome Evolution. Amos Tanay 2009
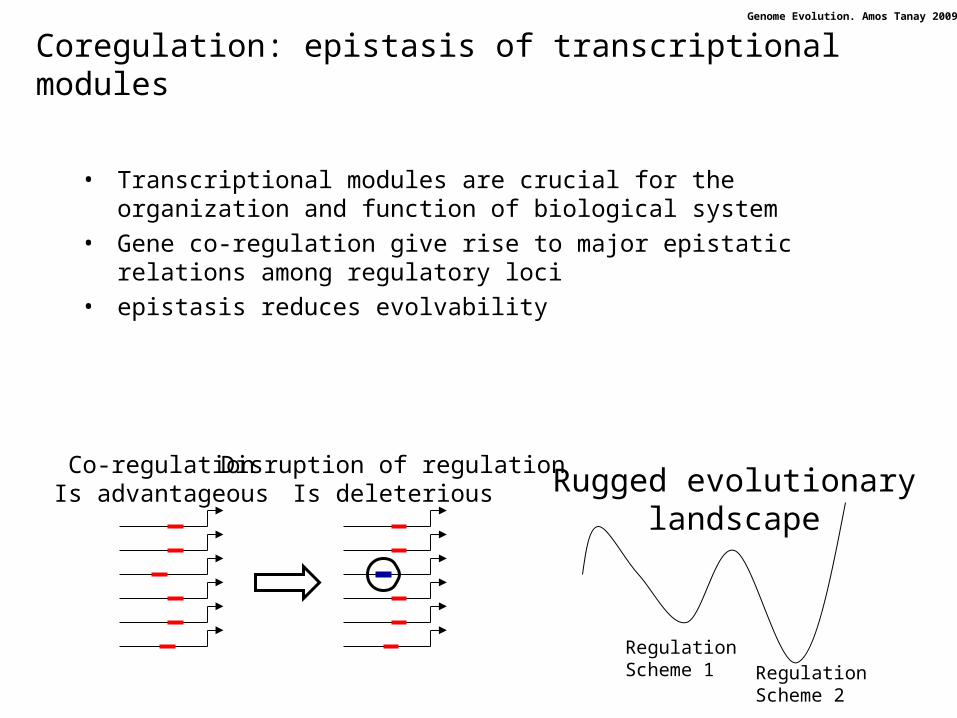
Coregulation: epistasis of transcriptional modules
• Transcriptional modules are crucial for the organization and function of biological system
• Gene co-regulation give rise to major epistatic relations among regulatory loci
• epistasis reduces evolvability
Co-regulationIs advantageous
Disruption of regulationIs deleterious
RegulationScheme 1 Regulation
Scheme 2
Rugged evolutionarylandscape
Genome Evolution. Amos Tanay 2009
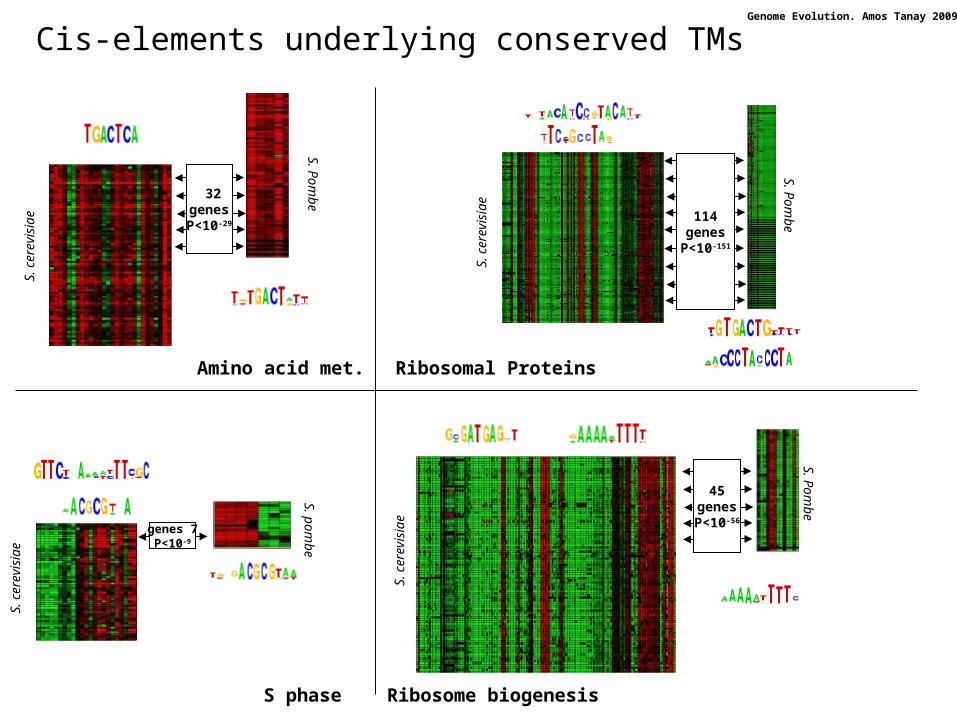
Cis-elements underlying conserved TMs
32 genesP<10-29
S. c
erev
isia
e
S. P
ombe
114genes
P<10-151
S. c
erev
isia
e
S. P
ombe
45genesP<10-56
Ribosome biogenesis
S. P
ombe
S. c
erev
isia
e
S phase
S. pom
be
7 genesP<10-9
S. c
erev
isia
e
Amino acid met. Ribosomal Proteins
Genome Evolution. Amos Tanay 2009
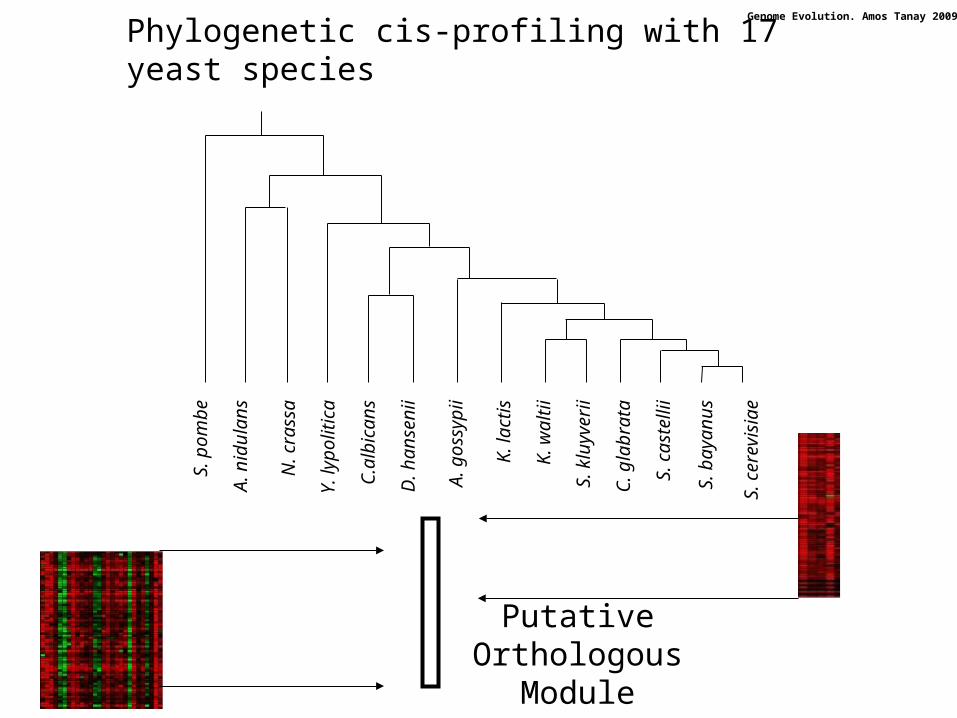
Phylogenetic cis-profiling with 17 yeast species
A.
nidu
lan
s
S.
baya
nus
S.
cere
visi
ae
K.
wal
tii
A.
goss
ypii
S.
cast
ellii
N.
cras
sa
S.
pom
be
C.a
lbic
ans
S.
klu
yver
ii
Y.
lyp
oliti
ca
D.
han
sen
ii
K.
lact
is
C.
glab
rata
Putative Orthologous
Module (POM)

Genome Evolution. Amos Tanay 2009
Conserved cis-elements
S. cerevisiae
S. castellii
S. kluyveri
K. waltii
A. gossypii
C. albicans
N. crassa
A. nidulans
S. bayanus
S. kudriavzevii
S. mikatae
S. paradoxus
S. pombe
MCB HAP2345 GCN4
S phase Respiration Amino acid metabolism
C. galbrata
K. lactis
D. hansenii
Y. lipolytica
•Conserved FM are sometime regulated by remarkably conserved cis elements
•Conserved cis elements are bounded by conserved TFs
Tanay et al. PNAS, 2005

Genome Evolution. Amos Tanay 2009
RAP1 Homol-D IFHL
S. cerevisiae (133)
S. castellii (89)
S. kluyveri (61)
K. waltii (54)
A. gossypii (73)
C. albicans (41)
N. crassa (67)
A. nidulans (72)
S. bayanus (118)
S. kudriavz .(94)
S. mikatae (88)
S. parad. (75)
S. pombe (74)
C. glabrata (69)
K. lactis (75)
D. hansenii (73)
Y. lipolytica (70)
73 44
49
46
30
51 53
41 46
29 3230
31 3034
1735
52 3264
21 4529
45 4053
4054
4048
4657
3146
38112
Rap1 emergence
Homol-Dloss
Ribosomal Protein Module:Evolutionary change viaredundancy
Redundantmechanism
Homol-Dbased

Genome Evolution. Amos Tanay 2009
Rap1 evolution in trans
BCRT Myb Silencing TA
S. cerevisiae
S. castelii
K. waltii
A. gossypii
C. albicans
N. crassa
A. nidulans
S. pombe
H. sapiens
New TA domainCo-emerged withRap1 role in RP regulation
Genome Evolution. Amos Tanay 2009
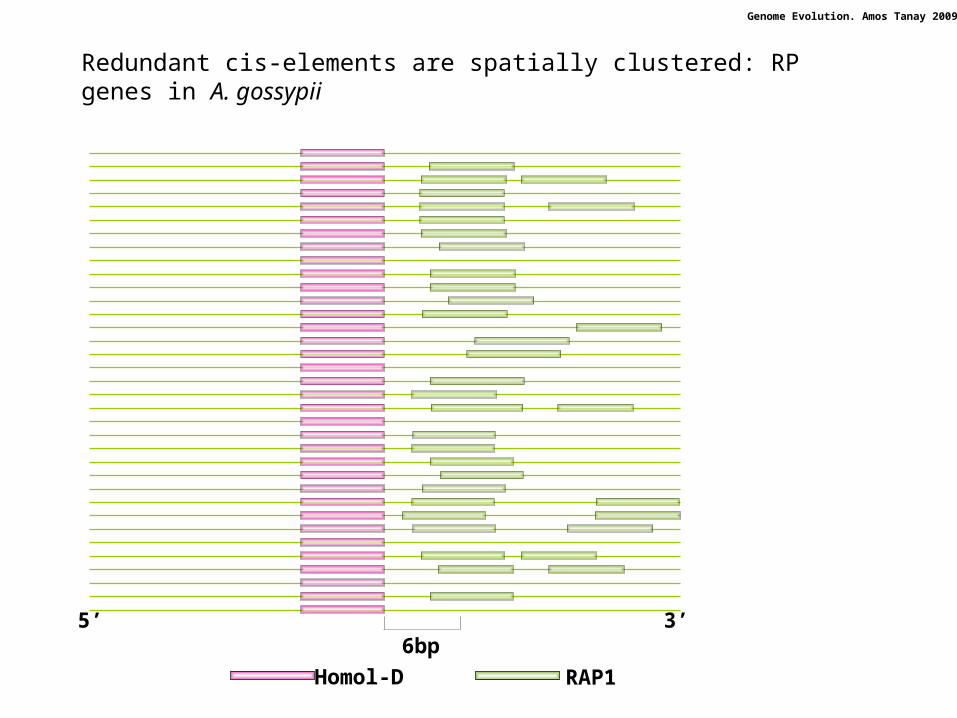
Redundant cis-elements are spatially clustered: RP genes in A. gossypii
3’6bp
Homol-D RAP1
5’

Genome Evolution. Amos Tanay 2009
Evolution of the IFHL element
pombe
nidulans
crassa
lypolityca
albicans
hansenii
sacc. et al.
Tandem duplication
Conservation
Reverse complement duplication
Drift…
Genome Evolution. Amos Tanay 2009
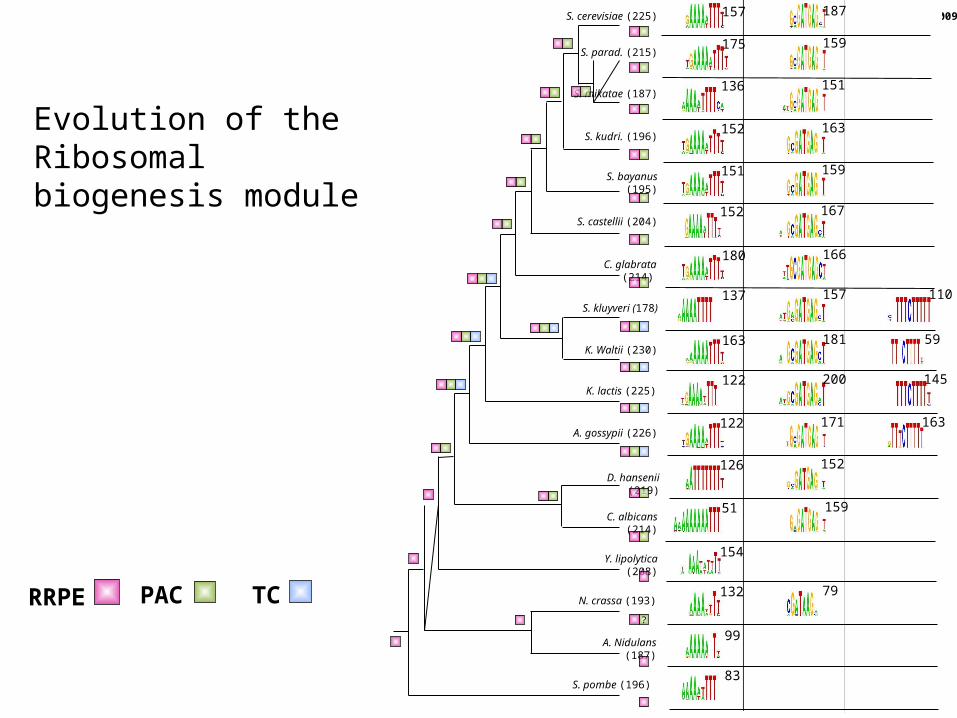
Evolution of the Ribosomal biogenesis module
S. cerevisiae (225)
S. castellii (204)
S. kluyveri (178)
K. Waltii (230)
A. gossypii (226)
C. albicans (214)
N. crassa (193)
A. Nidulans (187)
S. bayanus (195)
S. kudri. (196)
S. mikatae (187)
S. parad. (215)
S. pombe (196)
C. glabrata (214)
K. lactis (225)
D. hansenii (219)
Y. lipolytica (208)
RRPE PAC TC?
83
99
132 79
154
51 159
126 152
122 171 163
122 200 145
163 181 59
137 157 110
180 166
152 167
151 159
152 163
136 151
175 159
157 187
Genome Evolution. Amos Tanay 2009
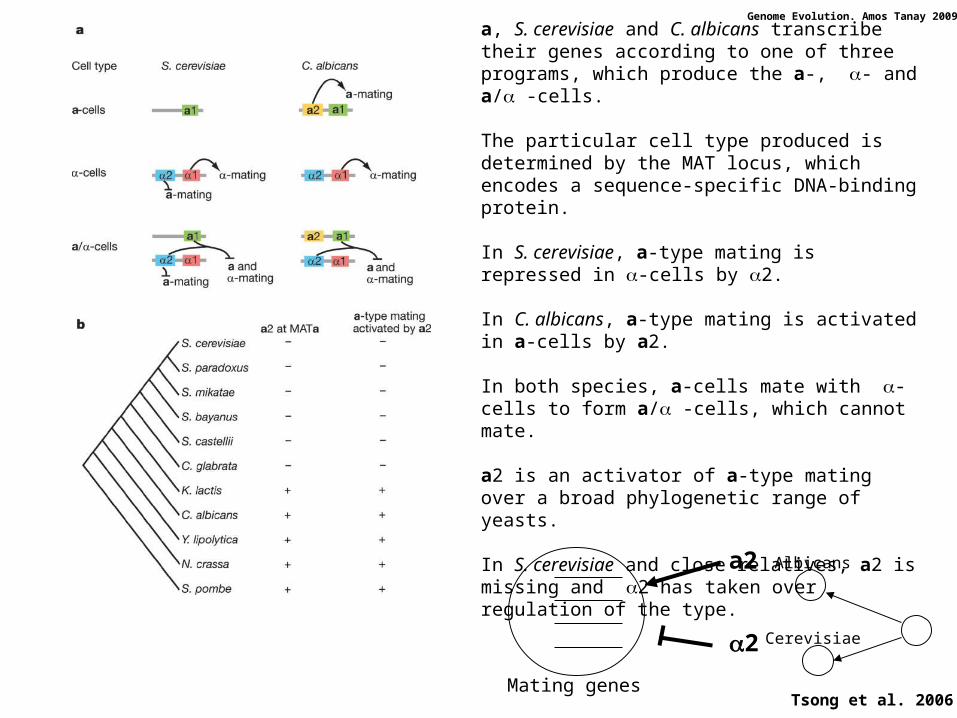
a, S. cerevisiae and C. albicans transcribe their genes according to one of three programs, which produce the a-, - and a/ -cells.
The particular cell type produced is determined by the MAT locus, which encodes a sequence-specific DNA-binding protein.
In S. cerevisiae, a-type mating is repressed in -cells by 2.
In C. albicans, a-type mating is activated in a-cells by a2.
In both species, a-cells mate with -cells to form a/ -cells, which cannot mate.
a2 is an activator of a-type mating over a broad phylogenetic range of yeasts.
In S. cerevisiae and close relatives, a2 is missing and 2 has taken over regulation of the type.
Tsong et al. 2006Mating genes
a2
2
Albicans
Cerevisiae
Genome Evolution. Amos Tanay 2009
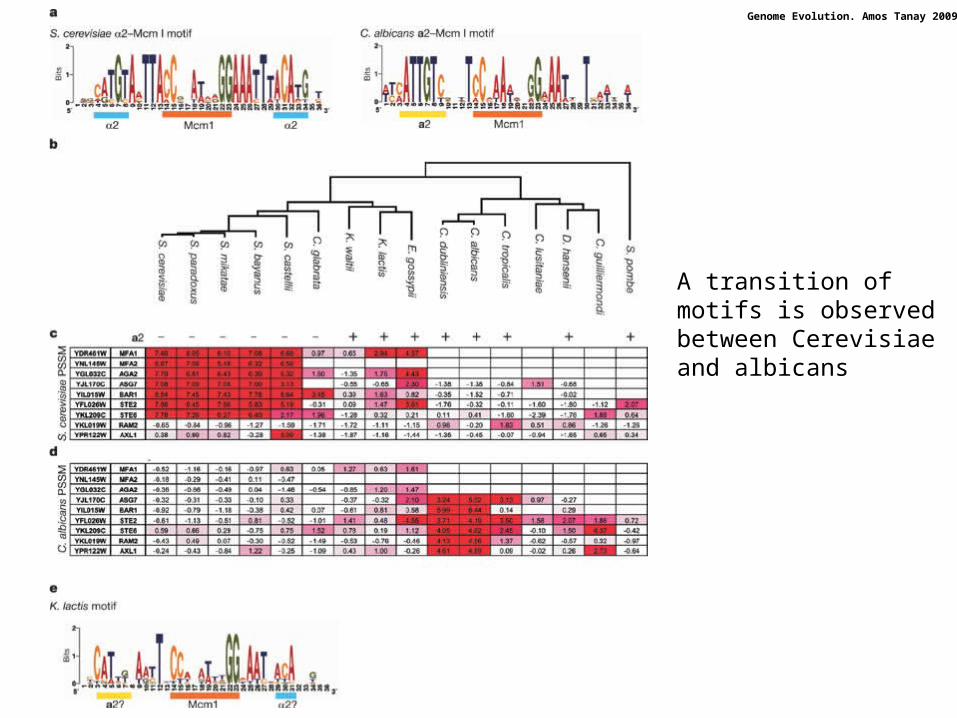
A transition of motifs is observed between Cerevisiae and albicans
Genome Evolution. Amos Tanay 2009
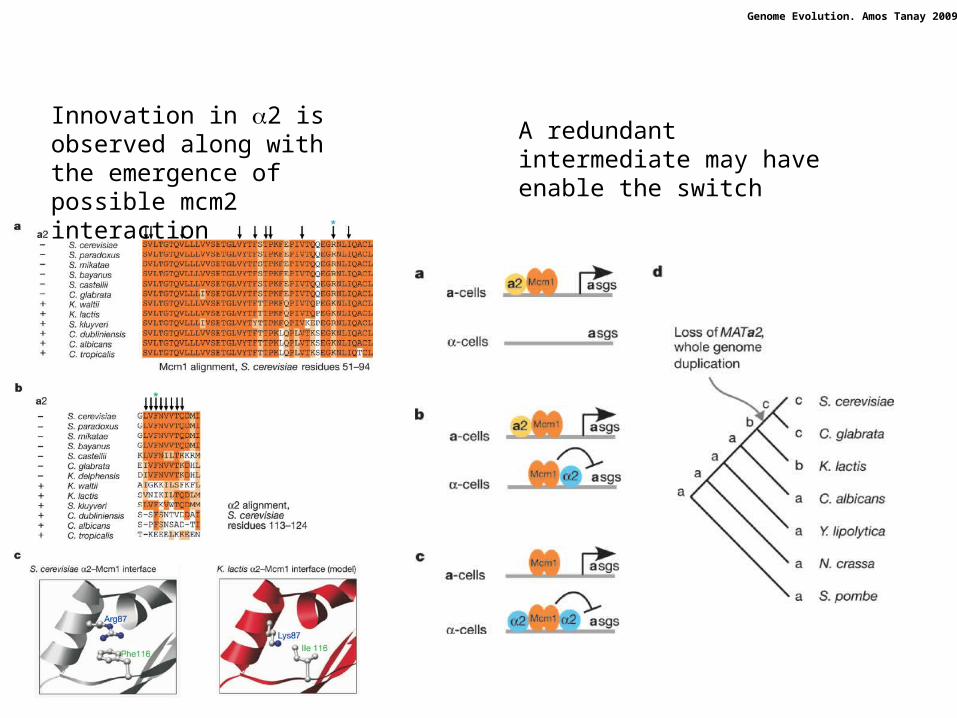
Innovation in 2 is observed along with the emergence of possible mcm2 interaction
A redundant intermediate may have enable the switch

Genome Evolution. Amos Tanay 2009
Ihmels Science, 2005


![[HMG] 04 - Gene Evolution · Genome EvolutionGenome Evolution [Gene Evolution] Genome changes • Mutation • Recombination • Transposition • Gene transfer (e.g., between organelles](https://static.documents.pub/doc/80x56/5f1a27241c38cf435819dbb5/hmg-04-gene-evolution-genome-evolutiongenome-evolution-gene-evolution-genome.jpg)


