General rights Copyright and moral rights for the publications made accessible in the public portal are retained by the authors and/or other copyright owners and it is a condition of accessing publications that users recognise and abide by the legal requirements associated with these rights. Users may download and print one copy of any publication from the public portal for the purpose of private study or research. You may not further distribute the material or use it for any profit-making activity or commercial gain You may freely distribute the URL identifying the publication in the public portal If you believe that this document breaches copyright please contact us providing details, and we will remove access to the work immediately and investigate your claim. Downloaded from orbit.dtu.dk on: Aug 17, 2019 Genomic taxonomy of vibrios Thompson, Cristiane C.; Vicente, Ana Carolina P.; Souza, Rangel C.; Vasconcelos, Ana Tereza R.; Vesth, Tammi Camilla; Alves, Nelson Jr; Ussery, David; Iida, Tetsuya; Thompson, FL Published in: B M C Evolutionary Biology Link to article, DOI: 10.1186/1471-2148-9-258 Publication date: 2009 Document Version Publisher's PDF, also known as Version of record Link back to DTU Orbit Citation (APA): Thompson, C. C., Vicente, A. C. P., Souza, R. C., Vasconcelos, A. T. R., Vesth, T. C., Alves, N. J., ... Thompson, FL. (2009). Genomic taxonomy of vibrios. B M C Evolutionary Biology, 9, 258. https://doi.org/10.1186/1471-2148-9-258
Transcript
General rights Copyright and moral rights for the publications made accessible in the public portal are retained by the authors and/or other copyright owners and it is a condition of accessing publications that users recognise and abide by the legal requirements associated with these rights.
Users may download and print one copy of any publication from the public portal for the purpose of private study or research.
You may not further distribute the material or use it for any profit-making activity or commercial gain
You may freely distribute the URL identifying the publication in the public portal If you believe that this document breaches copyright please contact us providing details, and we will remove access to the work immediately and investigate your claim.
Downloaded from orbit.dtu.dk on: Aug 17, 2019
Genomic taxonomy of vibrios
Thompson, Cristiane C.; Vicente, Ana Carolina P.; Souza, Rangel C.; Vasconcelos, Ana Tereza R.; Vesth,Tammi Camilla; Alves, Nelson Jr; Ussery, David; Iida, Tetsuya; Thompson, FLPublished in:B M C Evolutionary Biology
Link to article, DOI:10.1186/1471-2148-9-258
Publication date:2009
Document VersionPublisher's PDF, also known as Version of record
Link back to DTU Orbit
Citation (APA):Thompson, C. C., Vicente, A. C. P., Souza, R. C., Vasconcelos, A. T. R., Vesth, T. C., Alves, N. J., ...Thompson, FL. (2009). Genomic taxonomy of vibrios. B M C Evolutionary Biology, 9, 258.https://doi.org/10.1186/1471-2148-9-258
Open AcceResearch articleGenomic taxonomy of vibriosCristiane C Thompson*1, Ana Carolina P Vicente1, Rangel C Souza2, Ana Tereza R Vasconcelos2, Tammi Vesth3, Nelson Alves Jr4, David W Ussery3, Tetsuya Iida5 and Fabiano L Thompson*4
Address: 1Laboratory of Molecular Genetics of Microrganims, Oswaldo Cruz Institute, FIOCRUZ, Rio de Janeiro, Brazil, 2National Laboratory for Scientific Computing, Department of Applied and Computational Mathematics, Laboratory of Bioinformatics, Av. Getúlio Vargas 333, Quitandinha, 25651-070, Petropolis, RJ, Brazil, 3Center for Biological Sequence Analysis, Department of Biotechnology, Building 208, The Technical University of Denmark, DK-2800 Kgs. Lyngby, Denmark, 4Department of Genetics, Institute of Biology, Federal University of Rio de Janeiro, UFRJ, Brazil and 5Laboratory of Genomic Research on Pathogenic Bacteria, International Research Center for Infectious Diseases, Research Institute for Microbial Diseases, Osaka University, Suita, Osaka 565-0871, Japan
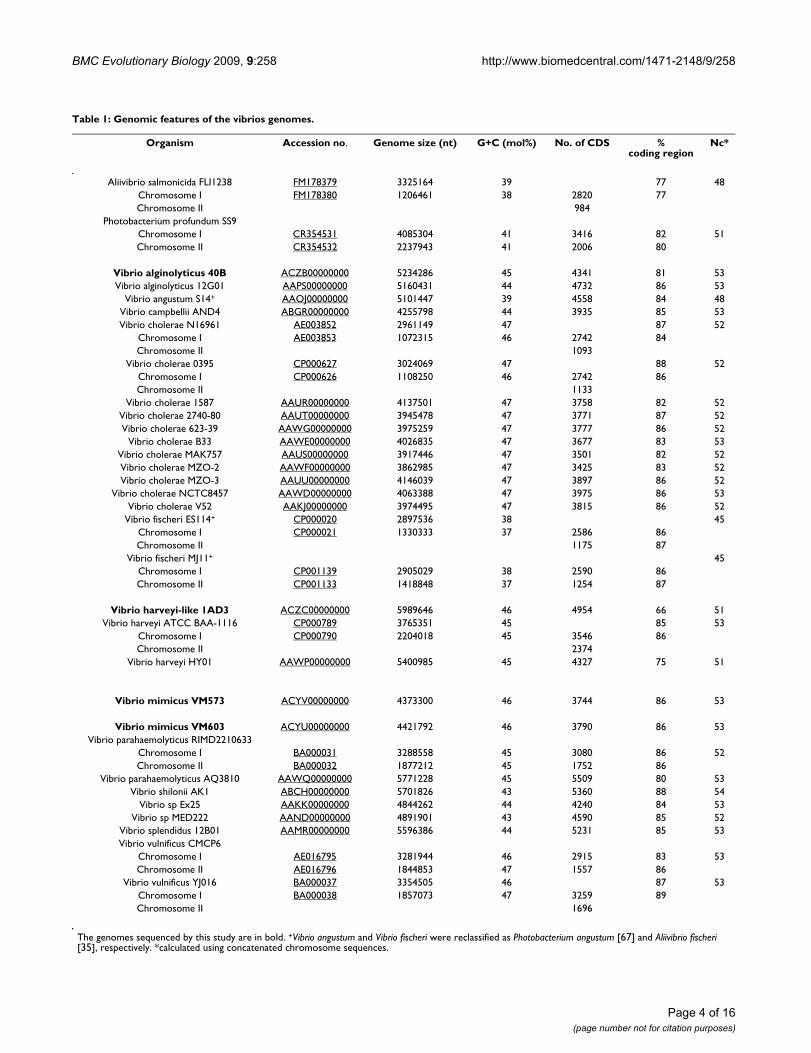
AbstractBackground: Vibrio taxonomy has been based on a polyphasic approach. In this study, we retrieve usefultaxonomic information (i.e. data that can be used to distinguish different taxonomic levels, such as speciesand genera) from 32 genome sequences of different vibrio species. We use a variety of tools to explorethe taxonomic relationship between the sequenced genomes, including Multilocus Sequence Analysis(MLSA), supertrees, Average Amino Acid Identity (AAI), genomic signatures, and Genome BLAST atlases.Our aim is to analyse the usefulness of these tools for species identification in vibrios.
Results: We have generated four new genome sequences of three Vibrio species, i.e., V. alginolyticus 40B,V. harveyi-like 1DA3, and V. mimicus strains VM573 and VM603, and present a broad analyses of thesegenomes along with other sequenced Vibrio species. The genome atlas and pangenome plots provide atantalizing image of the genomic differences that occur between closely related sister species, e.g. V.cholerae and V. mimicus. The vibrio pangenome contains around 26504 genes. The V. cholerae core genomeand pangenome consist of 1520 and 6923 genes, respectively. Pangenomes might allow different strains ofV. cholerae to occupy different niches. MLSA and supertree analyses resulted in a similar phylogeneticpicture, with a clear distinction of four groups (Vibrio core group, V. cholerae-V. mimicus, Aliivibrio spp., andPhotobacterium spp.). A Vibrio species is defined as a group of strains that share > 95% DNA identity inMLSA and supertree analysis, > 96% AAI, ≤ 10 genome signature dissimilarity, and > 61% proteomeidentity. Strains of the same species and species of the same genus will form monophyletic groups on thebasis of MLSA and supertree.
Conclusion: The combination of different analytical and bioinformatics tools will enable the mostaccurate species identification through genomic computational analysis. This endeavour will culminate inthe birth of the online genomic taxonomy whereby researchers and end-users of taxonomy will be ableto identify their isolates through a web-based server. This novel approach to microbial systematics willresult in a tremendous advance concerning biodiversity discovery, description, and understanding.
BackgroundTaxonomy is at the basis of the biological sciences, beingone of its oldest branches. It deals with identification,classification (i.e. creation of new taxa) and nomencla-ture. In the early 1970s, a seminal work done by Colwellput forward the concept of polyphasic taxonomy that iscurrently still in use [1]. According to this concept, inorder to achieve the most natural classification system,there should be an integration of information from themolecular to the ecological levels. DNA-DNA hybridiza-tion (DDH) data had a pivotal role to infer the speciesboundaries in the polyphasic taxonomy. Indeed DDHproved to be the most powerful tool to unambiguouslyidentify prokaryotes, providing for the first time, a reliablemeans of categorizing microbes. However, this techniquesuffers from various limitations, including the need toinclude reference strains in each new experiment. In addi-tion, it is not portable and requires special facilities avail-able in a limited number of international laboratories.The introduction of 16S rRNA analysis as an alternativemethod for use in taxonomy allowed the development ofan evolutionary framework [2,3]. Boundaries for speciesidentification and a species definition were set on thebasis of extensive empirical data [4]. A bacterial species isdefined as a group of strains (including the type strain),having > 70% DDH similarity, < 5°C ΔTm, < 5% mol G+Cdifference of total genomic DNA, > 97% 16S rRNA iden-tity [4,5].
The bacterial species definition is pragmatic and opera-tional, aiming at the establishment of a rapid, reliable,reproducible, and useful taxonomic framework, based onmicrobial evolution, for a variety of applications (e.g.medicine and agriculture) [6]. This polyphasic definitionis a consensus in microbiology, although it is not basedon a concept (i.e. the biological processes behind specia-tion and species). It is crucial to highlight that the currentpolyphasic framework does not question if this definitioncorresponds to a biological reality [7]. Within the frame-work of polyphasic taxonomy, strains of the same specieshave similar phenotypes (e.g. expression of different typesof enzymes, ability to using different types of compoundsas energy source, and growth in different temperaturesand concentrations of acid and salt), genotypes (e.g. rep-PCR and AFLP), and chemotaxonomic features (e.g. FAMEand polyamines), forming distinguishable tight groups[7]. Ideally, these groups should be readily identifiableand differentiated from closely related species. However,currently there is not a consensus on the definition of abacterial genus [7].
The most recent ideas on the species concepts corroboratepolyphasic taxonomy [8]. According to these authors, abacterial species concept is a framework that explains howbacterial strains share common features and how they
maintain genomic cohesion. The cohesion is observed asrecurrent patterns or groups of strains that are recognizedin nature and are termed species for practical reasons.However, the biological process giving rise and maintain-ing cohesion of these groups is what matters in a speciesconcept. Homologous recombination appears to be amajor force leading to genomic cohesion of strains of thesame species. It is more frequent between strains of thesame species than between strains of different species sim-ply because this genetic process depends on sequence sim-ilarity. Horizontal gene transfer (HGT) between unrelatedstrains would cause an increase in phenotypic variation,but would not be frequent enough to hamper the forma-tion and recognition of species. An alternative speciesconcept is the stable ecotype in which cohesion of bacte-rial strains of a given species is maintained by accumula-tion of advantageous mutations and periodic purging ofallelic variability [9]. In contrast with the polyphasic spe-cies definition which is widely accepted, there is not a con-sensus on a bacterial species concept. It is of coursepossible that one single concept is not sufficient to explainthe complexity of bacterial diversity. In addition, muta-tion, homologous recombination and HGT may bedetected at varying levels in a single strain, making the sce-nario even more complex.
Whole microbial genome sequencing studies launchedmicrobial taxonomy into a new era, with the possibility ofestablishing sistematics on the basis of complete genomes[10]. How does one go about using whole genomesequences (WGS) for establishing a genomic taxonomy?And more specifically, how can one taxonomically defineand identify species by means of WGS? WGS may containtaxonomic information in the form of gene content,genome wide signatures, phylogenetic markers, aminoacid identity and overall genetic composition that mightbe useful for building novel taxonomic schemes [11]. Pio-neer computational and mathematical studies performedin the 1990s suggested that genomes contain species-spe-cific signatures [12]. Genome signature is a compositionalparameter reflecting the dinucleotide relative abundance,which is similar between closely related species, and dis-similar between non-related species. Genome signaturesappear to allow the identification of isolates and metage-nomes into known species [13,14]. Whole genomesequences also permit the reconstruction of more robusttaxonomic trees (i.e. supertrees) based on all genes of thecore genome [15-17]. A good congruence was obtained bythe traditional 16S rRNA based trees and the novel super-tree methods [18] proposed that the average amino acididentity (AAI) could be used to distinguish closely relatedsister species. Subsequently, a close relationship betweenDDH and AAI was shown [19]. Some studies have sug-gested that the effective number of codons (Nc) could alsobe a species-specific marker [20].
Page 2 of 16(page number not for citation purposes)
In Vibrios, the birth of the genomic taxonomy occurredwith a series of papers that attempted to use multilocussequence analysis (MLSA) [21-26]. These studies allowedthe establishment of rapid and powerful identificationsystems through the internet. Currently there are MLSAschemes for most of the human pathogens available forfree access in the internet. Establishing a universal MLSAwill not be possible though. Studies accomplished so farhave shown that the resolution of different markers variesaccording to the taxonomic groups. For instance, the recAgene is very useful to differentiate closely related species ofBurkholderia [27], but it is not appropriate for vibrios [24].Clearly, genes have different molecular clocks in differentmicrobes, indicating the need of a multigene approach.With the advent of ultra-rapid genome sequencing, it isnow possible to sequence one almost complete microbialgenome in less than a day [28,29]. The new generation ofDNA sequencers will enable sequencing of more than adozen prokaryotic genomes in less than an hour, possiblymaking it cheaper and faster to sequence a whole genomethan several genes for MLSA. In future, MLSA might beused simply as a rapid screen methodology [30].
Vibrios are an excellent test model for genomic taxonomybecause they are ubiquitous in the marine environment,associated with a wide range of marine life (some speciessuch as V. cholerae, V. parahaemolyticus and V. vulnificuscause serious disease in man) and experiencing a varietyof environmental conditions and selection forces, leadingto high genomic plasticity [31,32]. Consequently, differ-entiation of sister species becomes very difficult. Forinstance, V. cholerae and V. mimicus have nearly indistin-guishable phenotypes. Among the phenotypic tests usedin the Bergey's manual, only sucrose fermentation andlipase activity may discriminate the two species. Accord-ing to the most recent version of the Bergey's manual, aVibrio species is defined as a group of strains formingsmall (0.5-0.8 × 1.4-2.6 μm) comma-shapped rods withpolar flagella enclosed in a sheath, facultative anaerobicmetabolism, capable of fermenting D-glucose and growthat 20°C [33]. Primarily aquatic, most species are oxidasepositive, reduce nitrate to nitrite, require Na+ for growth,and ferment D-frutose, maltose, and glycerol. Each vibriospecies is further identified by an array of over 100 pheno-typic tests. There is not an operational definition for gen-era within the vibrios [33]. In our hands, vibrio speciesmay be better defined on the basis of amplified fragmentlength polymorphism (AFLP) and MLSA [21,22,25,34].Strains of the same species (including the type strain)share more than 60% mutual AFLP band pattern similar-ity and more than 95% similarity in MLSA (using the locirpoA, recA, pyrH, ftsZ, topA, mreB gyrB and gapA). Moreimportantly, strains of the same species and species of thesame genus will form monophyletic groups on the basis
of MLSA. This was the main argument used to propose thenewly described genus Aliivibrio [35].
In order to test the feasibility of the genomic taxonomy invibrios, several markers were analysed in a collection of 32genomes, including four newly pyrosequenced genomes.Several Vibrio strains had the genome completelysequenced and are available on the web. Eleven V. choleraeand two V. mimicus genomes formed an ideal test case fortaxonomy because of their close relatedness as sister spe-cies. These sister species have nearly identical 16S rRNAsequences and around 70% DDH. Disclosing species-spe-cific patterns for the different genome-wide markerswould reinforce their usefulness in prokaryotic taxonomy.The aim of this study was to extract taxonomic informa-tion from vibrio genome sequences by means of a detailedanalysis of MLSA, supertree, Nc, AAI, genomic signatures,Genome BLAST atlas and pangenome plot that wouldallow species identification.
MethodsGenome sequence dataWe used 32 genomes of vibrios in this study unless other-wise stated. The genomic sequences of 28 vibrios wereobtained from the National Center for BiotechnologyInformation (NCBI) (Table 1). We have sequenced thegenome of V. alginolyticus 40B, V. harveyi-like 1DA3, andV. mimicus strains VM573 and VM603. V. alginolyticus 40Band V. harveyi-like 1DA3 were isolated from Brazilian cor-als (Mussismilia hispida and Phyllogorgia dilatata in 2007 atthe Abrolhos reef bank, respectively). V. mimicus VM573(CT and TCP positive) was isolated from a patient withdiarrhea in 1990s in the US, whereas V. mimicus VM603was isolated from riverine water in the Brazilian Amazo-nia region in 1990s. These genomes were sequenced bythe Roche-454 pyrosequencing method. Genomic DNAwas extracted using the method of Pitcher [36]. The pyro-sequencing technique was performed according to [37].Briefly, genomic DNA was randomly sheared to smallfragments and ligated to common adaptors. Single frag-ments were attached to beads in an emulsion. Amplifica-tion by PCR was done in the emulsion and produced ~107
copies of the fragments per bead. After removal of theemulsion, the beads were deposited on a fiber optic slide.The DNAs were sequenced using a pyrosequencing proto-col. Sequencing of V. mimicus VM603 genome was per-formed on the prototype Roche 454 Genome Sequencer20™ system, whereas sequencing of V. alginolyticus 40B, V.mimicus VM573 and V. harveyi-like 1DA3 genomes wasperformed on a Roche 454 Genome Sequencer FLX™ sys-tem. The reads were assembled using the Newbler soft-ware of the 454/Pyrosequencing. These genomes wereannotated automatically using the software SABIÁ [38]and have been deposited at DDBJ/EMBL/GenBank underthe project accession number [GenBank:ACZB00000000]
Page 3 of 16(page number not for citation purposes)
Chromosome I AE016795 3281944 46 2915 83 53Chromosome II AE016796 1844853 47 1557 86
Vibrio vulnificus YJ016 BA000037 3354505 46 87 53Chromosome I BA000038 1857073 47 3259 89Chromosome II 1696
The genomes sequenced by this study are in bold. +Vibrio angustum and Vibrio fischeri were reclassified as Photobacterium angustum [67] and Aliivibrio fischeri [35], respectively. *calculated using concatenated chromosome sequences.
(V. alginolyticus 40B), [GenBank:ACZC00000000] (V. har-veyi-like 1DA3), [GenBank:ACYV00000000] (V. mimicusVM573) and [GenBank:ACYU00000000] (V. mimicusVM603). The version described in this paper is the firstversion. The genomes are also available online http://www.vibrio.lncc.br. The DNA G+C content of V. alginolyti-cus 40B, V. mimicus VM573 and V. harveyi-like 1DA3genomes was calculated using MEGA version 4.0 [39]. Weused concatenated genomic sequences of the two chromo-somes of vibrios for our analyses.
Genome BLAST Atlas, proteome matrix, and pangenome plotThe BlastAtlas plots were constructed as described previ-ously [40,41]. The pangenome plot, and proteome matrixwere constructed as described [42]. For building the atlas,the genomes were automatically annotated and werecompared to the reference chromosome (V. cholera strainN16961 in this case). The BLAST matrix perl script per-forms an all-against-all BLAST comparison of genomesfrom multiple organisms. For every combination, a pro-tein blast is carried out, finding all homologous proteins.For our purposes, we use the "50-50 rule", which requiresboth of the following characteristics: 1.) at least 50% ofthe query protein must overlap in the alignment, and 2.)at least 50% of the residues within the alignment must beidentical. After the homologous proteins are identified,the proteins are clustered into protein families and thenumber of families containing proteins from both strainsare counted. The fraction of these shared families out ofthe total number of families is the number reported in theBLAST matrix. Since the direction of comparison of thetwo organisms will give identical results under these con-ditions, one redundant half of the square matrix plot isleft out. Thus, we use a triangular shaped diagram wherethe hypotenuse corresponds to the paralogs (red), whichare the internal homologous proteins (e.g., repeatedgenes). Since this is a comparison of all the proteins in agenome, compared to the pan-genome, it is possible tosee related organisms, in terms of their similar composi-tion of gene families.
16S rRNA tree, Multilocus Sequence Analysis (MLSA) and Supertree approachMLSA and supertree approach were based on the concate-nated sequences of house-keeping genes [15,21]. The 16SrRNA gene sequences, the gene sequences used for MLSA(i.e. ftsZ, gyrB, mreB, pyrH, recA, rpoA and topA) and thegene sequences used for supertree (i.e. aminopeptidase P,alaS, aspS, ftsZ, gltX, gyrB, hisS, ileS, infB, metG, mreB, pntA,pheT, pyrH, recA, rpoA, rpoB, rpsH, signal recognition parti-cle protein, threonyl-tRNA synthetase, topA, valS and 30Sribosomal protein S11) were obtained from the NCBI.The concatenated sequences were aligned by CLUSTALX.Phylogenetic analyses were conducted using MEGA ver-
sion 4.0 [39] and PAUP version 4.0b10 [43]. The phyloge-netic inference was based on the maximum-parsimonycharacter method (MP), the neighbour-joining geneticdistance method (NJ) [44], and the maximum likelihoodmethod (ML). Distance estimations were obtainedaccording to the Kimura-2-parameter for 16S rRNA geneand Jukes-Cantor [45] for MLSA and supertree for NJ. Theprogram Modeltest was used to select the GTR+I+G as themodel for MLSA and supertree and Tamura-Nei+I+G asthe model for 16S rRNA in the ML analysis. The reliabilityof each tree topology was checked by 2000 bootstrap rep-lications [46].
Average amino acid identity (AAI)The AAI was calculated according to [18]. Genes con-served between a pair of genomes were determined bywhole-genome pairwise sequence comparisons using theBLAST algorithm release 2.2.5 [47]. For these compari-sons, all protein-coding sequences (CDSs) from onegenome were searched against the genomic sequence ofthe other genome. CDSs that had a BLAST match of atleast 40% identity at the amino acid level and an alignableregion with more than 70% of the length of the queryCDS were considered as conserved genes [48]. This cutoffis above the twilight zone of similarity searches, whereinference of homology is error prone due to low similaritybetween aligned sequences. Thus, query CDSs were pre-sumably homologous to their matches. The genetic relat-edness between a pair of genomes was measured by theaverage amino acid identity of all conserved genesbetween the two genomes as computed by the BLASTalgorithm.
Codon usageCodon usage bias was calculated for each genome. Theeffective number of codons used in a sequence (Nc) [20],was calculated using CHIPS (EMBOSS). Nc values rangefrom 20 (in an extremely biased genome where only onecodon is used per amino acid) to 61 (all synonymouscodons are used with equal probability) [20]. The roseplot of codon usage was constructed as described previ-ously [42].
Determination of dinucleotide relative abundance valuesWe determined the dinucleotide relative abundance valuefor each genome. Sequences were concatenated with theirinverted complementary sequence using REVSEQ, YANKand UNION (EMBOSS). Mononucleotide and dinucle-otide frequencies were calculated using COMPSEQ(EMBOSS). Dinucleotide relative abundances (ρ*XY) werecalculated using the equation ρ*XY = fXY/fXfY where fXYdenotes the frequency of dinucleotide XY, and fX and fYdenote the frequencies of X and Y, respectively [12]. Sta-tistical theory and data from previous studies [12,49] indi-cate that the normal range of ρ*XY is between 0.78 and
Page 5 of 16(page number not for citation purposes)
1.23. The difference in genome signature between twosequences is expressed by the genomic dissimilarity (δ*),which is the average absolute dinucleotide of relativeabundance difference between two sequences. The dis-similarities in relative abundance of dinucleotidesbetween both sequences were calculated using the equa-tion described by [12]: δ*(f,g) = 1/16Σ|ρ*XY (f) - ρ*XY (g)|(multiplied by 1000 for convenience), where the sumextends over all dinucleotides.
ResultsGeneral features of the sequenced genomesThe new genomic sequences generated in this study for V.alginolyticus 40B (ACZB00000000), V. harveyi-like 1DA3(ACZC00000000), V. mimicus strains VM573(ACYV00000000), and VM603 (ACYU00000000), had290, 229, 82 and 488 contigs with a total length ofapproximately 5,234,286, 5,989,646, 4,373,300 and4,321,792 bp, respectively. The estimated coverage depthwas 18, 22, 24 and 20×, respectively. The average GC con-tent for the draft genomes were 45%, 46%, 46%, and
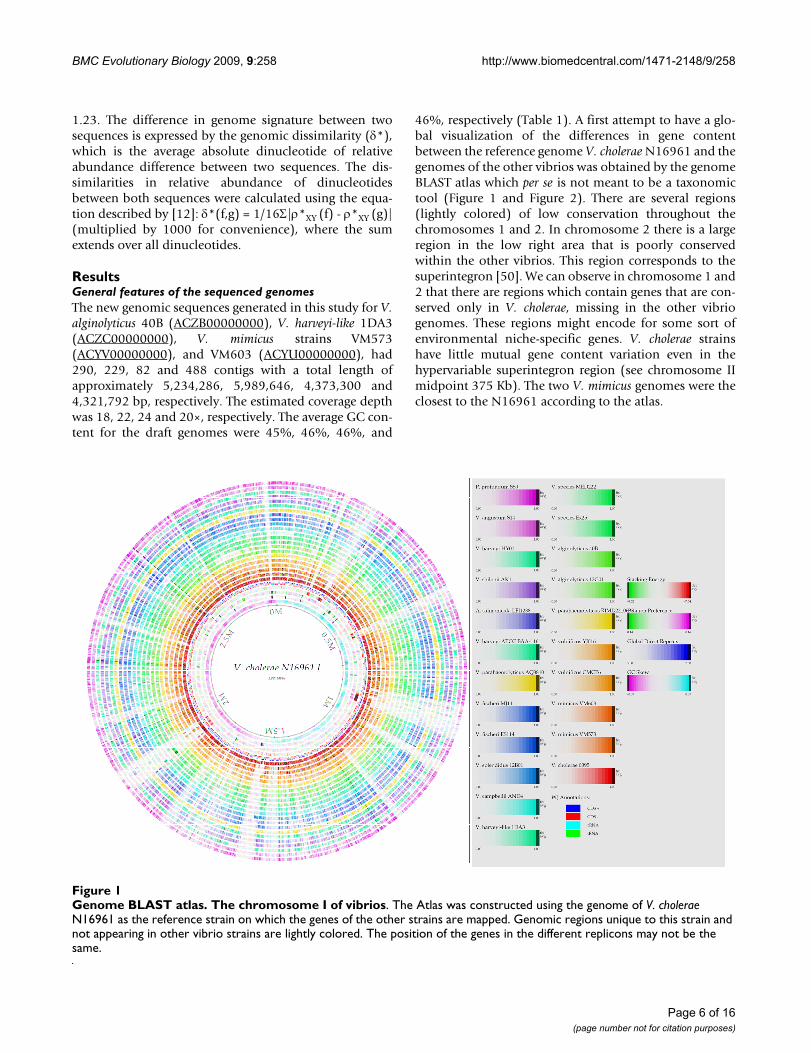
46%, respectively (Table 1). A first attempt to have a glo-bal visualization of the differences in gene contentbetween the reference genome V. cholerae N16961 and thegenomes of the other vibrios was obtained by the genomeBLAST atlas which per se is not meant to be a taxonomictool (Figure 1 and Figure 2). There are several regions(lightly colored) of low conservation throughout thechromosomes 1 and 2. In chromosome 2 there is a largeregion in the low right area that is poorly conservedwithin the other vibrios. This region corresponds to thesuperintegron [50]. We can observe in chromosome 1 and2 that there are regions which contain genes that are con-served only in V. cholerae, missing in the other vibriogenomes. These regions might encode for some sort ofenvironmental niche-specific genes. V. cholerae strainshave little mutual gene content variation even in thehypervariable superintegron region (see chromosome IImidpoint 375 Kb). The two V. mimicus genomes were theclosest to the N16961 according to the atlas.
Genome BLAST atlas. The chromosome I of vibriosFigure 1Genome BLAST atlas. The chromosome I of vibrios. The Atlas was constructed using the genome of V. cholerae N16961 as the reference strain on which the genes of the other strains are mapped. Genomic regions unique to this strain and not appearing in other vibrio strains are lightly colored. The position of the genes in the different replicons may not be the same.
Page 6 of 16(page number not for citation purposes)
Proteome BLASTThe BLAST proteome for all vibrio strains varied between23.1% (V. harveyi-P. profundum) and 79.8% (V. mimicus-V.mimicus) similarity, whereas the percentage of paralogsvaried between 1.8% (V. mimicus-V. mimicus) to 9.3% (V.parahaemolyticus-V. parahaemolyticus). The BLAST compar-ison indicated that V. cholerae genomes had mutual pro-teome identity at minimum 61.8% and at maximum78.4% (Figure 3 and see Additional file 1; Table S1). Theintraspecific proteome identity in V. cholerae variedbetween 61.8% and 78.3%, whereas the paralogs in V.cholerae genomes varied from 2.8% (99 proteins) to 3.8%(130 proteins). The sister species V. cholerae-V. mimicus, V.parahaemolyticus-V. alginolyticus and V. harveyi-V. campbel-lii had proteome identity at maximum 65.7%, 64.4% and45%, respectively. The maximum proteome identitybetween the genera Vibrio and Aliivibrio was 38.6% (i.e. V.splendidus and A. fischeri), whereas the identity betweenVibrio and Photobacterium was 31.8% (i.e. V. splendidus and
P. angustum). Aliivibrio and Photobacterium had at maxi-mum 32.3% identity.
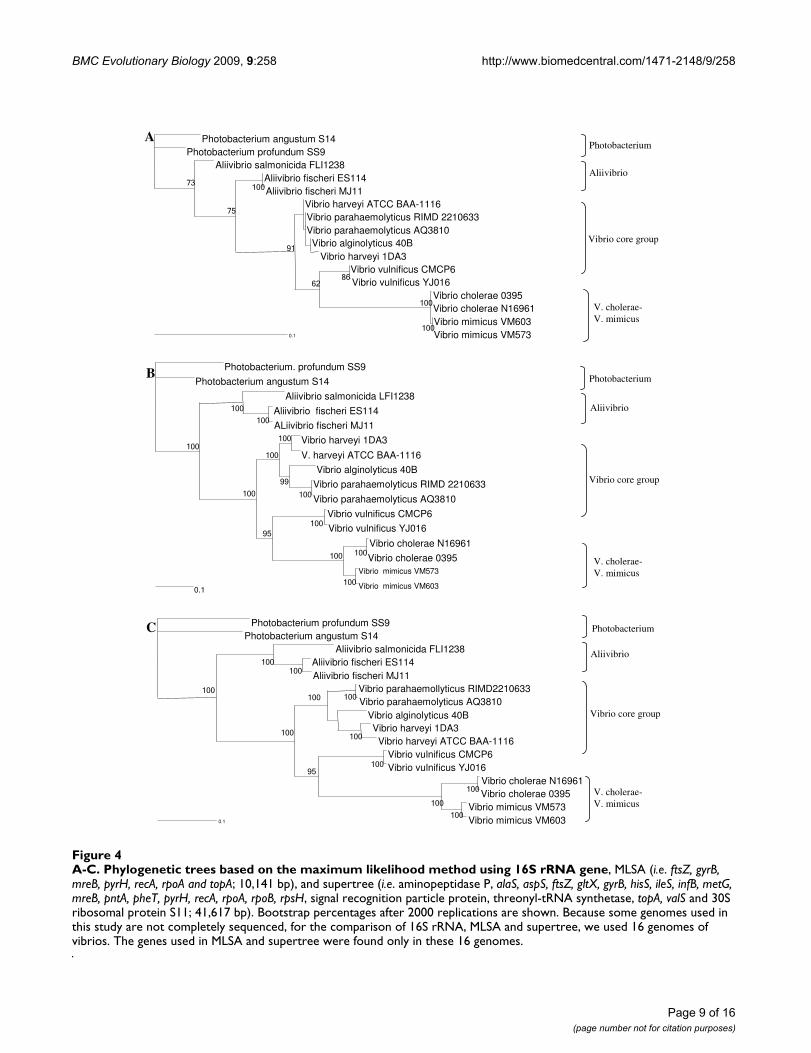
Phylogenetic reconstructions by 16S rRNA, MLSA and supertreeWe selected both conserved and variable single copy genesbelonging to different functional groups, from both chro-mosomes of vibrios and that have been used in severaltaxonomic studies [15,21,22,24,25,51]. Phylogenetictrees based on 16S rRNA gene sequences, MLSA and thesupertree approach were constructed using the ML (Figure4), MP (see Additional file 2; Figure S1) and NJ methods(see Additional file 3; Figure S2). The trees based on 16SrRNA gene sequences, MLSA and supertree showed simi-lar topology in the three methods. Bootstrap analysis indi-cated that, most branches were highly significant. Thephylogenetic reconstruction indicated a clear separationof groups (i.e. genera) within the vibrio clade. The generaPhotobacterium and Aliivibrio were clearly separated fromthe genus Vibrio. The sister species of vibrios, V. cholerae-
Genome BLAST atlas. The chromosome II of vibriosFigure 2Genome BLAST atlas. The chromosome II of vibrios. The Atlas was constructed using the genome of V. cholerae N16961 as the reference strain on which the genes of the other strains are mapped. Genomic regions unique to this strain and not appearing in other vibrio strains are lightly colored. Notice the hyper-variable region (midpoint at 375 K) in the chromo-some II of vibrios (the super-integron), corresponding to 1/6 of this replicon. The position of the genes in the different repli-cons may not be the same.
Page 7 of 16(page number not for citation purposes)
V. mimicus, V. parahaemolyticus-V. alginolyticus were sepa-rated from each other in the MLSA and supertreeapproaches in all three phylogenetic methods. These pairsof species had almost identical 16S rRNA gene sequences(≥ 99% sequence identity) though. Slight grouping differ-ences were observed. V. alginolyticus appeared to be at theoutskirts of the V. parahaemolyticus branch in the MLSAtree while in the supertree V. alginolyticus appeared at theoutskirts of the V. harveyi branch in the three phylogeneticmethods, simply because the number of genes used foreach analysis was different. The difference may be due todifferent molecular clocks of the different genes. In the MLanalysis, V. vulnificus appeared between V. cholerae andthe vibrio core group. In all three phylogenetic methods,MLSA and supertree had the same taxonomic resolutionto discriminate between species.
Average amino acid identity (AAI)The percentage of identity of putative orthologous pro-tein-encoding genes detected in the pairwise comparisonis shown in Figure 3 (and see Additional file 4; Table S2).
The identity of protein-encoding genes between differentgenera of vibrios varied considerably. The mutual AAI forthe pairs Vibrio and Photobacterium, Vibrio and Aliivibrio,and Photobacterium and Aliivibrio were at most 67%, 70%and 68%, respectively. The AAI within the genus Phobacte-rium (represented by P. angustum S14 and P. profundumSS9) was only 73%, whereas the AAI within the genus Ali-ivibrio was 85%. The AAI within the genus Vibrio variedbetween 70 and 91%. The Vibrio core group (i.e. V. algino-lyticus, V. campbellii, V. harveyi and V. parahaemolyticus)shared at most 75% of their protein-encoding genes. Thewider range of variation is explained by the highernumber of representatives in the latter genus. The sisterspecies V. cholerae-V. mimicus, V. harveyi-V. campbellii, V.parahaemolyticus-V. alginolyticus shared 90-91% AAI,whereas the intra-species AAI in V. cholerae varied between98 and 99.5%. Vibrio sp. EX25 and V. alginolyticus 40B had95% identity, suggesting that EX25 belongs to the speciesV. alginolyticus. The rather low AAI within the species V.harveyi (i.e. 90%) may be due to the incomplete genomesequences and to unresolved taxonomic issues. V. harveyi-
Taxonomic resolution of AAI, BLAST proteome and genome dissimilarity [δ*(f,g)] of vibriosFigure 3Taxonomic resolution of AAI, BLAST proteome and genome dissimilarity [δ*(f,g)] of vibrios. Mean and standard deviations. Red = AAI; Green = proteome; yellow = [δ*(f,g)]. The taxonomic resolution of AAI is down to the intergenera level, whereas [δ*(f,g)] has a resolution at interspecies level. The dashed lines delimit (p < 0.001) the different taxonomic levels for AAI and [δ*(f,g)] but not for the proteome. The proteome did not completely fit this figure (and dashed lines limits), show-ing some noise signal for V. harveyi-V.harveyi.
0
25
50
75
100
chol
erae
-cho
lera
eal
gino
lytic
us-a
lgin
olyt
icus
fisch
eri-f
isch
eri
mim
icus
-mim
icus
para
haem
olyt
icus
-par
ahae
mol
ytic
usvu
lnifi
cus-
vuln
ificu
sha
rvey
i-har
veyi
chol
erae
-mim
icus
cam
pbel
lii-ha
rvey
ial
gino
lytic
us-p
arah
aem
olyt
icus
algi
noly
ticus
-har
veyi
fisch
eri-s
alm
onic
ida
algi
noly
ticus
-vul
nific
usha
rvey
i-vul
nific
usch
oler
ae-v
ulni
ficus
mim
icus
-vul
nific
uspa
raha
emol
ytic
us-m
imic
usal
gino
lytic
us-m
imic
usch
oler
ae-p
arah
aem
olyt
icus
algi
noly
ticus
-cho
lera
eha
rvey
i-mim
icus
angu
stum
-pro
fund
umch
oler
ae-h
arve
yial
gino
lytic
us-s
alm
onic
ida
para
haem
olyt
icus
-sal
mon
icid
aal
gino
lytic
us-f
isch
eri
para
haem
olyt
icus
-fis
cher
ich
oler
ae-f
isch
eri
chol
erae
-sal
mon
icid
am
imic
us-s
alm
onic
ida
vuln
ificu
s-fis
cher
ivu
lnifi
cus-
salm
onic
ida
harv
eyi-f
isch
eri
angu
stum
-fis
cher
ipr
ofun
dum
-fis
cher
iha
rvey
i-sal
mon
icid
am
imic
us-f
isch
eri
angu
stum
-sal
mon
icid
apr
ofun
dum
-sal
mon
icid
aal
gino
lytic
us-a
ngus
tum
algi
noly
ticus
-pro
fund
umch
oler
ae-a
ngus
tum
harv
eyi-a
ngus
tum
mim
icus
-ang
ustu
mpa
raha
emol
ytic
us-a
ngus
tum
para
haem
olyt
icus
-pro
fund
umvu
lnifi
cus-
angu
stum
vuln
ificu
s-pr
ofun
dum
chol
erae
-pro
fund
umha
rvey
i-pro
fund
umm
imic
us-p
rofu
ndum
Species
Interspecies
Intergenera
Species
Interspecies
Vibrio species
% (
AA
I and
prot
eom
e)
[�*(
f,g)]
(gen
ome
diss
imila
rity)
Page 8 of 16(page number not for citation purposes)
Page 9 of 16(page number not for citation purposes)
A-C. Phylogenetic trees based on the maximum likelihood method using 16S rRNA geneFigure 4A-C. Phylogenetic trees based on the maximum likelihood method using 16S rRNA gene, MLSA (i.e. ftsZ, gyrB, mreB, pyrH, recA, rpoA and topA; 10,141 bp), and supertree (i.e. aminopeptidase P, alaS, aspS, ftsZ, gltX, gyrB, hisS, ileS, infB, metG, mreB, pntA, pheT, pyrH, recA, rpoA, rpoB, rpsH, signal recognition particle protein, threonyl-tRNA synthetase, topA, valS and 30S ribosomal protein S11; 41,617 bp). Bootstrap percentages after 2000 replications are shown. Because some genomes used in this study are not completely sequenced, for the comparison of 16S rRNA, MLSA and supertree, we used 16 genomes of vibrios. The genes used in MLSA and supertree were found only in these 16 genomes.
like 1DA3 had 70% DDH in previous experiments andformed a separate genomic group on the basis of molecu-lar fingerprinting [52].
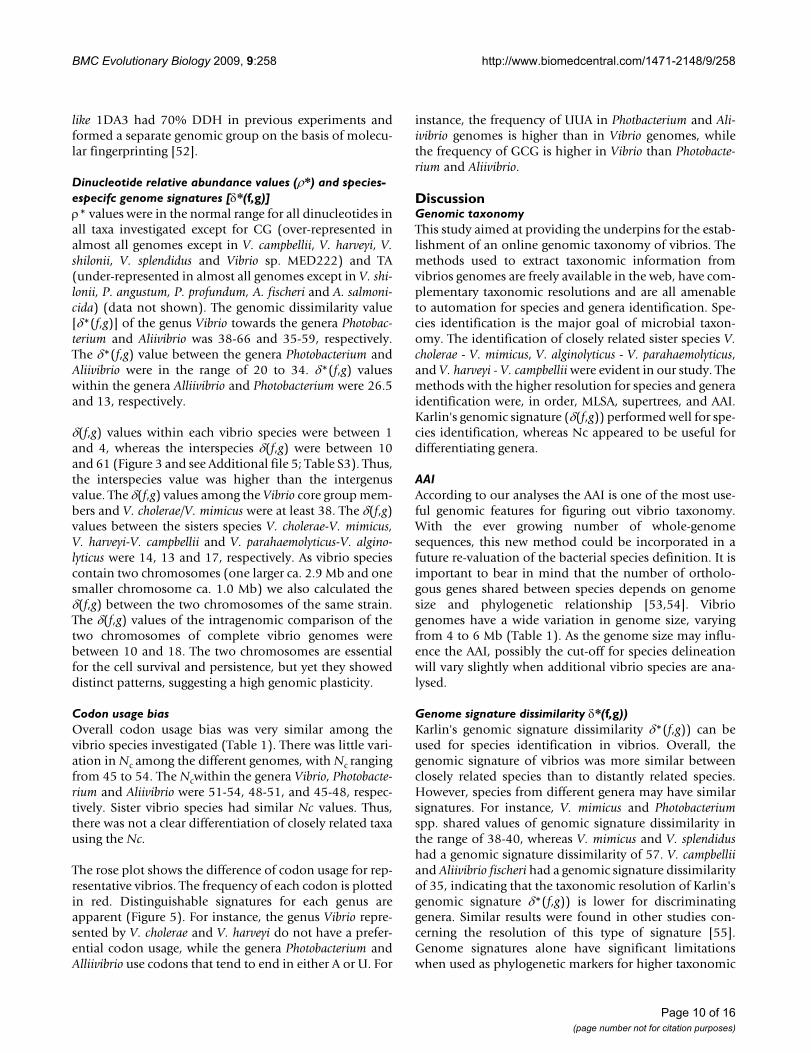
Dinucleotide relative abundance values (ρ*) and species-especifc genome signatures [δ*(f,g)]ρ* values were in the normal range for all dinucleotides inall taxa investigated except for CG (over-represented inalmost all genomes except in V. campbellii, V. harveyi, V.shilonii, V. splendidus and Vibrio sp. MED222) and TA(under-represented in almost all genomes except in V. shi-lonii, P. angustum, P. profundum, A. fischeri and A. salmoni-cida) (data not shown). The genomic dissimilarity value[δ*(f,g)] of the genus Vibrio towards the genera Photobac-terium and Aliivibrio was 38-66 and 35-59, respectively.The δ*(f,g) value between the genera Photobacterium andAliivibrio were in the range of 20 to 34. δ*(f,g) valueswithin the genera Alliivibrio and Photobacterium were 26.5and 13, respectively.
δ(f,g) values within each vibrio species were between 1and 4, whereas the interspecies δ(f,g) were between 10and 61 (Figure 3 and see Additional file 5; Table S3). Thus,the interspecies value was higher than the intergenusvalue. The δ(f,g) values among the Vibrio core group mem-bers and V. cholerae/V. mimicus were at least 38. The δ(f,g)values between the sisters species V. cholerae-V. mimicus,V. harveyi-V. campbellii and V. parahaemolyticus-V. algino-lyticus were 14, 13 and 17, respectively. As vibrio speciescontain two chromosomes (one larger ca. 2.9 Mb and onesmaller chromosome ca. 1.0 Mb) we also calculated theδ(f,g) between the two chromosomes of the same strain.The δ(f,g) values of the intragenomic comparison of thetwo chromosomes of complete vibrio genomes werebetween 10 and 18. The two chromosomes are essentialfor the cell survival and persistence, but yet they showeddistinct patterns, suggesting a high genomic plasticity.
Codon usage biasOverall codon usage bias was very similar among thevibrio species investigated (Table 1). There was little vari-ation in Nc among the different genomes, with Nc rangingfrom 45 to 54. The Ncwithin the genera Vibrio, Photobacte-rium and Aliivibrio were 51-54, 48-51, and 45-48, respec-tively. Sister vibrio species had similar Nc values. Thus,there was not a clear differentiation of closely related taxausing the Nc.
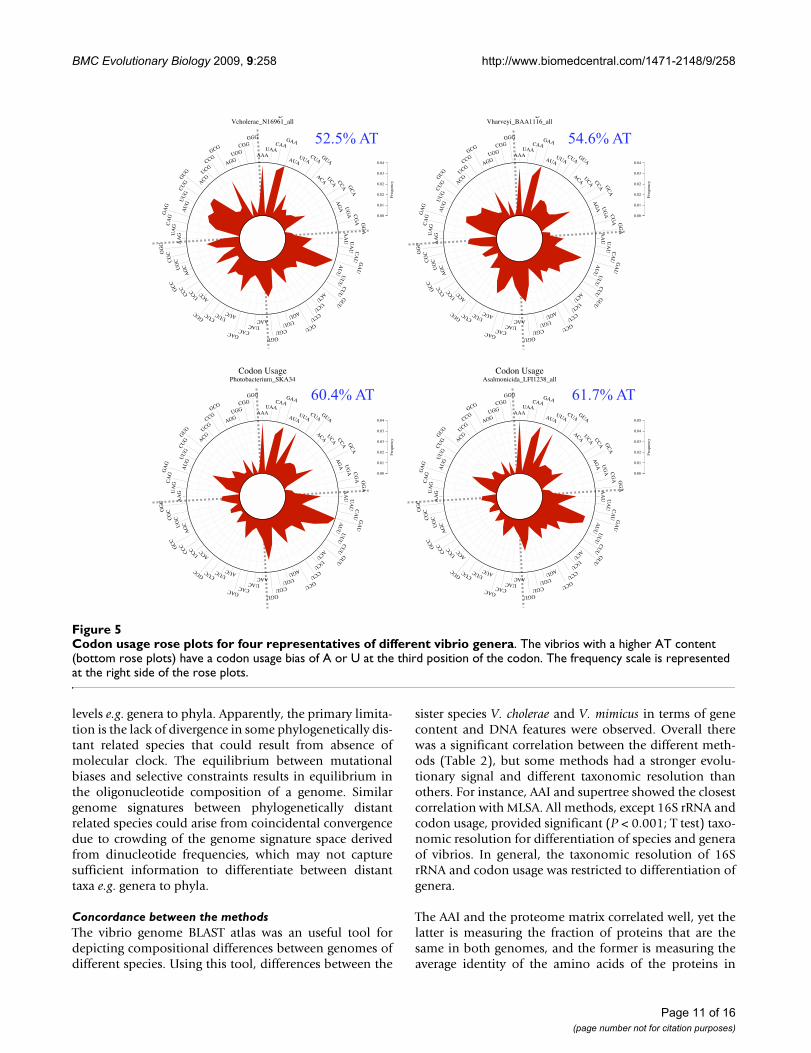
The rose plot shows the difference of codon usage for rep-resentative vibrios. The frequency of each codon is plottedin red. Distinguishable signatures for each genus areapparent (Figure 5). For instance, the genus Vibrio repre-sented by V. cholerae and V. harveyi do not have a prefer-ential codon usage, while the genera Photobacterium andAlliivibrio use codons that tend to end in either A or U. For
instance, the frequency of UUA in Photbacterium and Ali-ivibrio genomes is higher than in Vibrio genomes, whilethe frequency of GCG is higher in Vibrio than Photobacte-rium and Aliivibrio.
DiscussionGenomic taxonomyThis study aimed at providing the underpins for the estab-lishment of an online genomic taxonomy of vibrios. Themethods used to extract taxonomic information fromvibrios genomes are freely available in the web, have com-plementary taxonomic resolutions and are all amenableto automation for species and genera identification. Spe-cies identification is the major goal of microbial taxon-omy. The identification of closely related sister species V.cholerae - V. mimicus, V. alginolyticus - V. parahaemolyticus,and V. harveyi - V. campbellii were evident in our study. Themethods with the higher resolution for species and generaidentification were, in order, MLSA, supertrees, and AAI.Karlin's genomic signature (δ(f,g)) performed well for spe-cies identification, whereas Nc appeared to be useful fordifferentiating genera.
AAIAccording to our analyses the AAI is one of the most use-ful genomic features for figuring out vibrio taxonomy.With the ever growing number of whole-genomesequences, this new method could be incorporated in afuture re-valuation of the bacterial species definition. It isimportant to bear in mind that the number of ortholo-gous genes shared between species depends on genomesize and phylogenetic relationship [53,54]. Vibriogenomes have a wide variation in genome size, varyingfrom 4 to 6 Mb (Table 1). As the genome size may influ-ence the AAI, possibly the cut-off for species delineationwill vary slightly when additional vibrio species are ana-lysed.
Genome signature dissimilarity δ*(f,g))Karlin's genomic signature dissimilarity δ*(f,g)) can beused for species identification in vibrios. Overall, thegenomic signature of vibrios was more similar betweenclosely related species than to distantly related species.However, species from different genera may have similarsignatures. For instance, V. mimicus and Photobacteriumspp. shared values of genomic signature dissimilarity inthe range of 38-40, whereas V. mimicus and V. splendidushad a genomic signature dissimilarity of 57. V. campbelliiand Aliivibrio fischeri had a genomic signature dissimilarityof 35, indicating that the taxonomic resolution of Karlin'sgenomic signature δ*(f,g)) is lower for discriminatinggenera. Similar results were found in other studies con-cerning the resolution of this type of signature [55].Genome signatures alone have significant limitationswhen used as phylogenetic markers for higher taxonomic
Page 10 of 16(page number not for citation purposes)
levels e.g. genera to phyla. Apparently, the primary limita-tion is the lack of divergence in some phylogenetically dis-tant related species that could result from absence ofmolecular clock. The equilibrium between mutationalbiases and selective constraints results in equilibrium inthe oligonucleotide composition of a genome. Similargenome signatures between phylogenetically distantrelated species could arise from coincidental convergencedue to crowding of the genome signature space derivedfrom dinucleotide frequencies, which may not capturesufficient information to differentiate between distanttaxa e.g. genera to phyla.
Concordance between the methodsThe vibrio genome BLAST atlas was an useful tool fordepicting compositional differences between genomes ofdifferent species. Using this tool, differences between the
sister species V. cholerae and V. mimicus in terms of genecontent and DNA features were observed. Overall therewas a significant correlation between the different meth-ods (Table 2), but some methods had a stronger evolu-tionary signal and different taxonomic resolution thanothers. For instance, AAI and supertree showed the closestcorrelation with MLSA. All methods, except 16S rRNA andcodon usage, provided significant (P < 0.001; T test) taxo-nomic resolution for differentiation of species and generaof vibrios. In general, the taxonomic resolution of 16SrRNA and codon usage was restricted to differentiation ofgenera.
The AAI and the proteome matrix correlated well, yet thelatter is measuring the fraction of proteins that are thesame in both genomes, and the former is measuring theaverage identity of the amino acids of the proteins in
Codon usage rose plots for four representatives of different vibrio generaFigure 5Codon usage rose plots for four representatives of different vibrio genera. The vibrios with a higher AT content (bottom rose plots) have a codon usage bias of A or U at the third position of the codon. The frequency scale is represented at the right side of the rose plots.
AAAUAA
CAAGAA
AUAUUA
CUAGUA
ACAUCA CCA G
CA
AG
A UG
A CG
A GG
AAA
U UA
U CA
UG
AU
AU
UU
UU
CU
UG
UU
ACUUCU
CCUGCU
AGUUGU
CGUGGU
AACUAC
CACGAC
AUCUUC
CUCGUC
ACCUCCCCCG
CC
AG
CUG
CCG
CGG
C AA
GUA
GCA
GG
AG
AU
GU
UG
CU
GG
UG
ACGUCG
CCGGCG
AGGUGG
CGGGGG
Codon UsageVcholerae_N16961_all
0.00
0.01
0.02
0.02
0.03
0.04
Freq
uenc
y
AAAUAA
CAAGAA
AUAUUA
CUAGUA
ACAUCA CCA G
CA
AG
A UG
A CG
A GG
AAA
U UA
U CA
UG
AU
AU
UU
UU
CU
UG
UU
ACUUCU
CCUGCU
AGUUGU
CGUGGU
AACUAC
CACGAC
AUCUUC
CUCGUC
ACCUCCCCCG
CC
AG
CUG
CCG
CGG
C AA
GUA
GCA
GG
AG
AU
GU
UG
CU
GG
UG
ACGUCG
CCGGCG
AGGUGG
CGGGGG
Codo UsageVharveyi_BAA1116_all
0.00
0.01
0.02
0.02
0.03
0.04
Freq
uenc
y
AAAUAA
CAAGAA
AUAUUA
CUAGUA
ACAUCA CCA G
CA
AG
A UG
A CG
A GG
AAA
U UA
U CA
UG
AU
AU
UU
UU
CU
UG
UU
ACUUCU
CCUGCU
AGUUGU
CGUGGU
AACUAC
CACGAC
AUCUUC
CUCGUC
ACCUCCCCCG
CC
AG
CUG
CCG
CGG
C AA
GUA
GCA
GG
AG
AU
GU
UG
CU
GG
UG
ACGUCG
CCGGCG
AGGUGG
CGGGGG
Codon UsagePhotobacterium_SKA34
0.00
0.01
0.02
0.03
0.03
0.04
Freq
uenc
y
AAAUAA
CAAGAA
AUAUUA
CUAGUA
ACAUCA CCA G
CA
AG
A UG
A CG
A GG
AAA
U UA
U CA
UG
AU
AU
UU
UU
CU
UG
UU
ACUUCU
CCUGCU
AGUUGU
CGUGGU
AACUAC
CACGAC
AUCUUC
CUCGUC
ACCUCCCCCG
CC
AG
CUG
CCG
CGG
C AA
GUA
GCA
GG
AG
AU
GU
UG
CU
GG
UG
ACGUCG
CCGGCG
AGGUGG
CGGGGG
Codon UsageAsalmonicida_LFI1238_all
0.00
0.01
0.02
0.03
0.04
0.05
Freq
uenc
y
54.6% AT52.5% AT
61.7% AT60.4% AT
Page 11 of 16(page number not for citation purposes)
those matches. In addition, AAI uses 40% amino acididentity and > 70% of the aligned length of a proteinwhich is stricter than the settings used (50% identity-50%length) to construct the proteome matrix. Because the Kar-lin's genomic signature dissimilarity indexes genomewide variation, its phylogenetic resolution is distinct ofindividual genetic marker genes. In addition, this signa-ture considers variation in both coding and non codinggenomic regions. This may explain why the correlationbetween the signature and the gene sequence based meth-ods obtained in this study is slightly lower.
Towards a new species definition in vibriosA new species definition is mandatory if one aims toestablish an automatic identification of vibrios through aweb-based server. So far, the 16S rRNA gene analysis hasbeen applied for species definition and identification [2].Its value for these purposes in vibrios is limited because ofits low taxonomic resolution. This study showed enoughWGS-based evidence to propose a new species definitionin vibrios. In our hands, a vibrio species is defined as agroup of strains that share > 95% DNA identity in MLSAand supertree gene sequence, > 96% AAI, ≤ 10 genomesignature dissimilarity, and > 61% proteome identity.Strains of the same species and species of the same genuswill form monophyletic groups on the basis of MLSA andsupertree.
Ecology and genomic featuresEach Vibrio species appear to have a specific ecologicniche. Genomes exhibit diverse patterns of species-spe-cific compositional bias, i.e GC content, GC and AT skews,codon bias, and mutation bias. The exact mechanismsthat generate and maintain the genome signatures arecomplex, but possibly involve differences in species-spe-cific properties of DNA replication and repair machineries[49,56]. In Borrelia burgdoferi, there is a bias related to thespeed of the replication [57], whereas in Proteobacteria,DNA repair enzymes co-evolve with the genome signature[58]. The evolutionary distances between DNA repair andrecombination orthologous enzymes (mainly thoseinvolved in the nucleotide excision repair system) werehighly correlated with genome signature distances. On theother hand, there was a significantly lower correlation
between the evolutionary distances of the structural andmetabolic enzymes and genome signature.
Environmental temperature and oxygen appear to influ-ence the GC content of bacteria [59]. The frequencies ofAA, TA, and TT dinucleotides were higher than the fre-quencies of AT, GC, and CG dinucleotides in the vaccinestrain of Pasteurella multocida compared to the virulentstrain. Although the vaccine strain is cultured at highertemperature, its GC content is lower than the virulentstrain. The AA + TT dinucleotide increased significantly inthe vaccine strain, which may represent an adaptation toincreased culturing temperature because AA/TT dinucle-otides are conformationally very stable. Higher culturingtemperature increases spontaneous hydrolytic deamina-tion of cytosine and 5-methylcytosine which, in turn, tendto decrease GC content [60,61]. Deamination and meth-ylation favour nucleotide changes from G and C to A andT in a variety of microbial genomes [62].
Horizontal gene transfer may influence the genomic fea-tures of vibrios. The three genetic processes that mediateHGT often occur in vibrios and may cause phenotypic var-iation [63,64]. Such variation may confound a phenotypebased identification. Another interesting feature of vibriosgenomes is the presence of two chromosomes. Theintragenomic dissimilarity between the two chromo-somes of each vibrio strain is higher than the genomic dis-similarity between chromosome I of two strains of thesame species. For instance, V. cholerae N16961 chromo-ssomes I and II genomic dissimilarity δ(f,g)) was 12 andV. cholerae N16961 chromossome I and V. cholerae O395chromossome I was 1. The fact that the two chromosomesof vibrios are dissimilar, with chromosome II less con-served than the chromosome I might support the hypoth-esis that the chromosome II was acquired by horizontalgene transfer [50]. The chromosome II has only a fewessential housekeeping protein coding genes. This chro-mosome might have been a megaplasmid acquired by anancestor prior diversification of the vibrios. Nearly 1/6 ofthe chromosome II (ca. 150 Kb) corresponds to a super-integron, a rapidly evolving region specialized in captureand loss of genes, and gene expression [65]. It is impor-tant to highlight that the fact that the two chromosomes
Table 2: Pearson correlation coefficient (expressed as percentage) between different methods
of the same strain are more dissimilar than the chromo-somes of different strains does not hamper the use ofgenome signatures for identification. Chromosomes I ofV. cholerae and V. mimicus have signature dissimilarityhigher than the signature dissimilarity between chromo-some I of two V. cholerae strains. The same holds true forthe chromosome II.
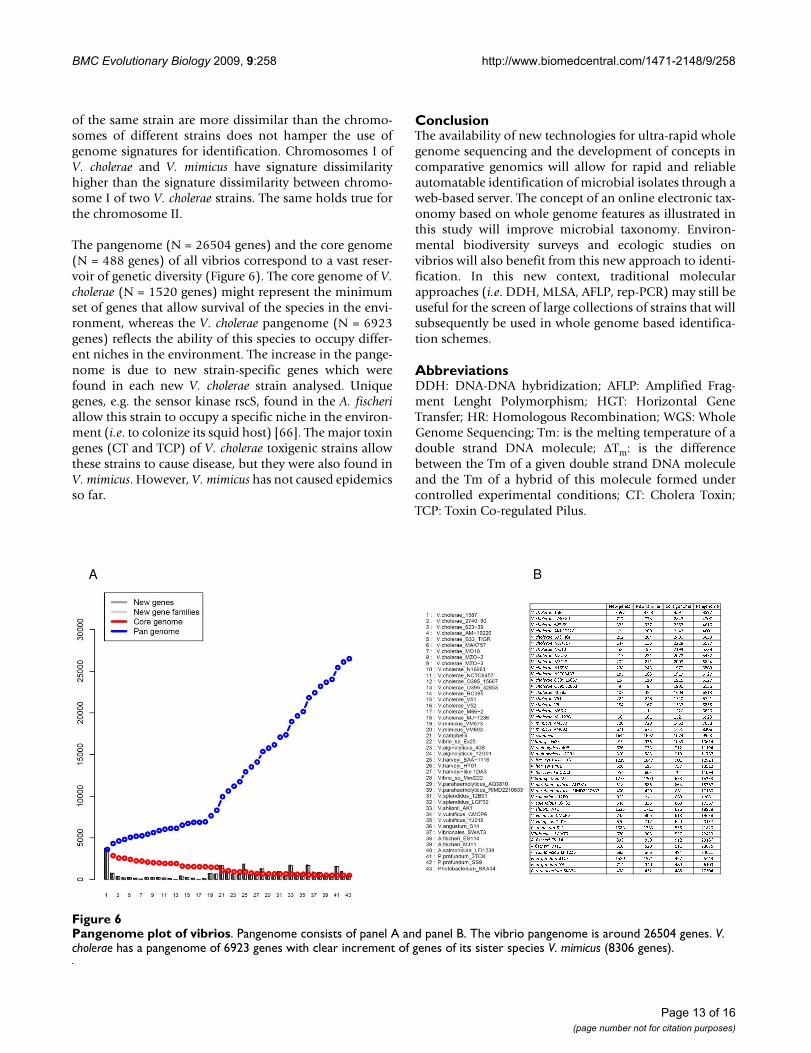
The pangenome (N = 26504 genes) and the core genome(N = 488 genes) of all vibrios correspond to a vast reser-voir of genetic diversity (Figure 6). The core genome of V.cholerae (N = 1520 genes) might represent the minimumset of genes that allow survival of the species in the envi-ronment, whereas the V. cholerae pangenome (N = 6923genes) reflects the ability of this species to occupy differ-ent niches in the environment. The increase in the pange-nome is due to new strain-specific genes which werefound in each new V. cholerae strain analysed. Uniquegenes, e.g. the sensor kinase rscS, found in the A. fischeriallow this strain to occupy a specific niche in the environ-ment (i.e. to colonize its squid host) [66]. The major toxingenes (CT and TCP) of V. cholerae toxigenic strains allowthese strains to cause disease, but they were also found inV. mimicus. However, V. mimicus has not caused epidemicsso far.
ConclusionThe availability of new technologies for ultra-rapid wholegenome sequencing and the development of concepts incomparative genomics will allow for rapid and reliableautomatable identification of microbial isolates through aweb-based server. The concept of an online electronic tax-onomy based on whole genome features as illustrated inthis study will improve microbial taxonomy. Environ-mental biodiversity surveys and ecologic studies onvibrios will also benefit from this new approach to identi-fication. In this new context, traditional molecularapproaches (i.e. DDH, MLSA, AFLP, rep-PCR) may still beuseful for the screen of large collections of strains that willsubsequently be used in whole genome based identifica-tion schemes.
AbbreviationsDDH: DNA-DNA hybridization; AFLP: Amplified Frag-ment Lenght Polymorphism; HGT: Horizontal GeneTransfer; HR: Homologous Recombination; WGS: WholeGenome Sequencing; Tm: is the melting temperature of adouble strand DNA molecule; ΔTm: is the differencebetween the Tm of a given double strand DNA moleculeand the Tm of a hybrid of this molecule formed undercontrolled experimental conditions; CT: Cholera Toxin;TCP: Toxin Co-regulated Pilus.
Pangenome plot of vibriosFigure 6Pangenome plot of vibrios. Pangenome consists of panel A and panel B. The vibrio pangenome is around 26504 genes. V. cholerae has a pangenome of 6923 genes with clear increment of genes of its sister species V. mimicus (8306 genes).
Authors' contributionsCCT carried out the computational analyses, phylogeneticand statistical analyses, analysed the results and wrote themanuscript. ACPV participated in the discussion and inthe draft of the manuscript. RS and ATRV participated inthe database construction and genomic anotation. TI car-ried out the pyrosequencing of the V. mimicus VM603genome and helped writing the paper. NAJr obtained thevibrio samples and carried out the preliminary taxonomicidentification of the genomes. DU carried out the pyrose-quencing of the V. alginolyticus 40B, V. harveyi-like 1DA3and V. mimicus VM573 genomes. DU and TV performedthe BLAST atlas and matrix and the pangenome plot, anddrafted the manuscript. FLT conceived the study, analysedthe data and wrote the manuscript. All the authors haveread and approved the final manuscript.
Additional material
AcknowledgementsCCT acknowledges a PhD scholarship of CNPq. FLT acknowledges grants of CNPq (Pro-Abrolhos), FAPERJ, IFS, and FUJB. ACPV and ATRV acknowl-edge grants of CNPq. NAJr acknowledges the scholarship of CNPq. The authors thank Bruno Sergio de O. Silva, Rodrigo L. de Moura, Ronaldo Francini Filho (UEPA) and Clovis B. Castro (MN-UFRJ) for help with sam-pling of the two brazilian coral vibrio strains, and Lena Sá with sampling of the VM603. The authors thank partial support of Genoprot/Finep. DWU acknowledges support from the Danish Center for Scientific Computing. The authors thank the comments of the referees. The authors dedicate this paper to Professor Jean Swings.
References1. Colwell RR: Polyphasic taxonomy of the genus vibrio: numer-
ical taxonomy of Vibrio cholerae, Vibrio parahaemolyticus,and related Vibrio species. J Bacteriol 1970, 104(1):410-433.
2. Wang Q, Garrity GM, Tiedje JM, Cole JR: Naive Bayesian classifierfor rapid assignment of rRNA sequences into the new bacte-rial taxonomy. Appl Environ Microbiol 2007, 73(16):5261-5267.
3. Woese CR, Fox GE: Phylogenetic structure of the prokaryoticdomain: the primary kingdoms. Proc Natl Acad Sci USA 1977,74(11):5088-5090.
4. Stackebrandt E, Goebel BM: A place for DNA-DNA reassocia-tion and 16S ribosomal-RNA sequence analysis in thepresent species definition in bacteriology. Int J Syst Bacteriol1994, 49:846-849.
5. Wayne LG, Brenner DJ, Colwell RR, Grimont PAD, Kandler O,Krichevsky MI, Moore LH, Moore WEC, Murray RGE, Stackebrandt
Additional file 1Table S1. BLAST matrix. The matrix lists the identity between proteomes of different strains of vibrios. The number of proteins and gene families in each genome are shown directly beneath the strain number. The hypote-nuse (red) corresponds to the paralogs. The data provided the identity between proteomes of different strains of vibrios. The number of proteins and gene families in each genome are shown directly beneath the strain number. The hypotenuse (red) corresponds to the paralogs.Click here for file[http://www.biomedcentral.com/content/supplementary/1471-2148-9-258-S1.PDF]
Additional file 2Figure S1A-C. Phylogenetic trees based on the maximum parsimony method using 16S rRNA gene, MLSA (i.e. ftsZ, gyrB, mreB, pyrH, recA, rpoA and topA; 10,141 bp), and supertree (i.e. aminopeptidase P, alaS, aspS, ftsZ, gltX, gyrB, hisS, ileS, infB, metG, mreB, pntA, pheT, pyrH, recA, rpoA, rpoB, rpsH, signal recognition particle protein, threonyl-tRNA synthetase, topA, valS and 30S ribosomal protein S11; 41,617 bp). Bootstrap percentages after 2000 replications are shown. Because some genomes used in this study are not completely sequenced, for the comparison of 16S rRNA, MLSA and supertree, we used 16 genomes of vibrios. The genes used in MLSA and supertree were found only in these 16 genomes. The data provided the phylogenetic relationship between vibrio strainsClick here for file[http://www.biomedcentral.com/content/supplementary/1471-2148-9-258-S2.PPT]
Additional file 3Figure S2A-C. Phylogenetic trees based on the neighbour-joining method using 16S rRNA gene, MLSA (i.e. ftsZ, gyrB, mreB, pyrH, recA, rpoA and topA; 10,141 bp), and supertree (i.e. aminopeptidase P, alaS, aspS, ftsZ, gltX, gyrB, hisS, ileS, infB, metG, mreB, pntA, pheT, pyrH, recA, rpoA, rpoB, rpsH, signal recognition particle protein, threonyl-tRNA synthetase, topA, valS and 30S ribosomal protein S11; 41,617 bp). Boot-strap percentages after 2000 replications are shown. Because some genomes used in this study are not completely sequenced, for the compar-ison of 16S rRNA, MLSA and supertree, we used 16 genomes of vibrios. The genes used in MLSA and supertree were found only in these 16 genomes. The data provided the phylogenetic relationship between vibrio strainsClick here for file[http://www.biomedcentral.com/content/supplementary/1471-2148-9-258-S3.PPT]
Additional file 4Table S2. Percentage of average amino acid identity (AAI) between vibrio species. Representative genomes were used for the calculations. The data provided the percentage of average amino acid identity (AAI) between vibrio species.Click here for file[http://www.biomedcentral.com/content/supplementary/1471-2148-9-258-S4.DOC]
Additional file 5Table S3. Genomic dissimilarity [δ(f,g)] values between vibrio especies. Representative genomes were used for the calculations. The data provided the genomic dissimilarity [δ(f,g)] values between vibrio species.Click here for file[http://www.biomedcentral.com/content/supplementary/1471-2148-9-258-S5.DOC]
Page 14 of 16(page number not for citation purposes)
E, et al.: Report of the ad hoc committee on reconciliation ofapproaches to bacterial systematics. Int J Syst Bacteriol 1987,37:463-464.
6. Gevers D, Cohan FM, Lawrence JG, Spratt BG, Coenye T, Feil EJ,Stackebrandt E, Peer Y Van de, Vandamme P, Thompson FL, et al.:Opinion: Re-evaluating prokaryotic species. Nat Rev Microbiol2005, 3(9):733-739.
7. Gillis M, Vandamme P, De Vos P, Swings J, Kersters K: Polyphasictaxonomy. In Bergey's Manual of Systematic Bacteriology: The Proteo-bacteria: Introductory Essays Volume 2. Edited by: Brenner DJ, Krieg NR,Staley JT, Garrity GM. New york: Springer; 2005:43-48.
8. Lawrence JG, Retchless AC: The interplay of homologousrecombination and horizontal gene transfer in bacterial spe-ciation. Methods Mol Biol 2009, 532:29-53.
9. Cohan FM, Koeppel AF: The origins of ecological diversity inprokaryotes. Curr Biol 2008, 18:1024-1034.
10. Coenye T, Gevers D, Peer Y Van de, Vandamme P, Swings J:Towards a prokaryotic genomic taxonomy. FEMS Microbiol Rev2005, 29(2):147-167.
11. Coenye T, Vandamme P: Extracting phylogenetic informationfrom whole-genome sequencing projects: the lactic acid bac-teria as a test case. Microbiology 2003, 149(Pt 12):3507-3517.
12. Karlin S, Mrazek J, Campbell AM: Compositional biases of bacte-rial genomes and evolutionary implications. J Bacteriol 1997,179(12):3899-3913.
13. Phillippy AM, Mason JA, Ayanbule K, Sommer DD, Taviani E, Huq A,Colwell RR, Knight IT, Salzberg SL: Comprehensive DNA signa-ture discovery and validation. PLoS Comput Biol 2007, 3(5):e98.
14. van Passel MWJ, Kuramae EE, Luyf ACM, Bart A, Boekhout T: Thereach of the genome signature in prokaryotes. BMC Evol Biol2006, 6(84):.
15. Brown JR, Douady CJ, Italia MJ, Marshall WE, Stanhope MJ: Univer-sal trees based on large combined protein sequence datasets. Nat Genet 2001, 28(3):281-285.
17. Wolf YI, Rogozin IB, Grishin NV, Tatusov RL, Koonin EV: Genometrees constructed using five different approaches suggestnew major bacterial clades. BMC Evol Biol 2001, 1:8.
18. Konstantinidis KT, Tiedje JM: Towards a genome-based taxon-omy for prokaryotes. J Bacteriol 2005, 187(18):6258-6264.
19. Goris J, Konstantinidis KT, Klappenbach JA, Coenye T, Vandamme P,Tiedje JM: DNA-DNA hybridization values and their relation-ship to whole-genome sequence similarities. Int J Syst EvolMicrobiol 2007, 57(Pt 1):81-91.
20. Wright F: The 'effective number of codons' used in a gene.Gene 1990, 87(1):23-29.
21. Sawabe T, Kita-Tsukamoto K, Thompson FL: Inferring the evolu-tionary history of vibrios by means of multilocus sequenceanalysis. J Bacteriol 2007, 189(21):7932-7936.
22. Thompson FL, Gevers D, Thompson CC, Dawyndt P, Naser S, HosteB, Munn CB, Swings J: Phylogeny and molecular identification ofvibrios on the basis of multilocus sequence analysis. Appl Envi-ron Microbiol 2005, 71(9):5107-5115.
23. Thompson CC, Thompson FL, Vicente AC, Swings J: Phylogeneticanalysis of vibrios and related species by means of atpA genesequences. Int J Syst Evol Microbiol 2007, 57(Pt 11):2480-2484.
24. Thompson FL, Gomez-Gil B, Vasconcelos AT, Sawabe T: Multilocussequence analysis reveals that Vibrio harveyi and V. camp-bellii are distinct species. Appl Environ Microbiol 2007,73(13):4279-4285.
25. Thompson CC, Thompson FL, Vicente AC: Identification of vibriocholerae and vibrio mimicus by multilocus sequence analysis(MLSA). Int J Syst Evol Microbiol 2008, 58(Pt 3):617-621.
26. Thompson FL, Austin B, Swings J: The biology of vibrios. Wash-ington: ASM; 2006.
27. Payne GW, Vandamme P, Morgan SH, Lipuma JJ, Coenye T, Weight-man AJ, Jones TH, Mahenthiralingam E: Development of a recAgene-based identification approach for the entire Burkholde-ria genus. Appl Environ Microbiol 2005, 71(7):3917-3927.
28. Andersson AF, Lindberg M, Jakobsson H, Backhed F, Nyren P, Eng-strand L: Comparative analysis of human gut microbiota bybarcoded pyrosequencing. PLoS ONE 2008, 3(7):e2836.
29. Eid J, Fehr A, Gray J, Luong K, Lyle J, Otto G, Peluso P, Rank D, Bay-bayan P, Bettman B, et al.: Real-time DNA sequencing from sin-gle polymerase molecules. Science 2009, 323(5910):133-138.
30. Mahenthiralingam E, Baldwin A, Drevinek P, Vanlaere E, Vandamme P,LiPuma JJ, Dowson CG: Multilocus sequence typing breatheslife into a microbial metagenome. PLoS ONE 2006, 1:e17.
31. Hunt DE, David LA, Gevers D, Preheim SP, Alm EJ, Polz MF:Resource partitioning and sympatric differentiation amongclosely related bacterioplankton. Science 2008,320(5879):1081-1085.
32. Thompson FL, Klose KE: Vibrio the First International Confer-ence on the Biology of Vibrios. J Bacteriol 2005,188(13):4592-4596.
33. Farmer JJ III, Janda M, Brenner FW, Cameron DN, Birkhead KM:Genus I. Vibrio Pacini 1854. In Bergey's Manual of Systematic Bacte-riology: The Proteobacteria: The Gamma-Proteobacteria Volume 2. Editedby: Brenner DJ, Krieg NR, Staley JT, Garrity GM. New York: Springer;2005:494-545.
34. Thompson FL, Iida T, Swings J: Biodiversity of vibrios. MicrobiolMol Biol Rev 2004, 68(3):403-431. table of contents
44. Saitou N, Nei M: The Neighbor-Joining Method - a NewMethod for Reconstructing Phylogenetic Trees. Japanese Jour-nal of Genetics 1986, 61(6):611-611.
45. Jukes TH, Cantor CR: Evolution of protein molecules. In Mam-malian protein metabolism Edited by: Munro HN. New York: AcademicPress; 1996:21-132.
46. Felsenstein J: Confidence limits on phylogenies: An approachusing the bootstrap. Evolution 1985, 39:783-791.
47. Altschul SF, Madden TL, Schaffer AA, Zhang J, Zhang Z, Miller W, Lip-man DJ: Gapped BLAST and PSI-BLAST: a new generation ofprotein database search programs. Nucleic Acids Res 1997,25(17):3389-3402.
48. Rost B: Twilight zone of protein sequence alignments. ProteinEng 1999, 12(2):85-94.
49. Karlin S: Global dinucleotide signatures and analysis ofgenomic heterogeneity. Curr Opin Microbiol 1998, 1(5):598-610.
50. Heidelberg JF, Eisen JA, Nelson WC, Clayton RA, Gwinn ML, DodsonRJ, Haft DH, Hickey EK, Peterson JD, Umayam L, et al.: DNAsequence of both chromosomes of the cholera pathogenVibrio cholerae. Nature 2000, 406(6795):477-483.
51. Gonzalez-Escalona N, Martinez-Urtaza J, Romero J, Espejo RT, JaykusLA, DePaola A: Determination of molecular phylogenetics ofVibrio parahaemolyticus strains by multilocus sequence typ-ing. J Bacteriol 2008, 190(8):2831-2840.
52. Thompson FL, Hoste B, Vandemeulebroecke K, Swings J: Genomicdiversity amongst Vibrio isolates from different sources
Page 15 of 16(page number not for citation purposes)
54. Snel B, Bork P, Huynen MA: Genome phylogeny based on genecontent. Nat Genet 1999, 21(1):108-110.
55. Mrazek J: Phylogenetic Signals in DNA Composition: Limita-tions and Prospects. Mol Biol Evol 2009, 26(5):1163-1169.
56. Foerstner KU, von Mering C, Hooper SD, Bork P: Environmentsshape the nucleotide composition of genomes. EMBO Rep2005, 6(12):1208-1213.
57. Vetsigian K, Goldenfeld N: Genome rhetoric and the emer-gence of compositional bias. Proc Natl Acad Sci USA 2009,106(1):215-220.
58. Paz A, Kirzhner V, Nevo E, Korol A: Coevolution of DNA-inter-acting proteins and genome "dialect". Mol Biol Evol 2006,23(1):56-64.
59. Xia X, Wei T, Xie Z, Danchin A: Genomic changes in nucleotideand dinucleotide frequencies in Pasteurella multocida cul-tured under high temperature. Genetics 2002,161(4):1385-1394.
60. Horst JP, Fritz HJ: Counteracting the mutagenic effect ofhydrolytic deamination of DNA 5-methylcytosine residuesat high temperature: DNA mismatch N-glycosylase Mig.Mthof the thermophilic archaeon Methanobacterium thermoau-totrophicum THF. EMBO J 1996, 15(19):5459-5469.
61. Lindahl T: Instability and decay of the primary structure ofDNA. Nature 1993, 362(6422):709-715.
62. Wang RF, Campbell W, Cao WW, Summage C, Steele RS, CernigliaCE: Detection of Pasteurella pneumotropica in laboratorymice and rats by polymerase chain reaction. Lab Anim Sci 1996,46(1):81-85.
63. Meibom KL, Blokesch M, Dolganov NA, Wu CY, Schoolnik GK: Chi-tin induces natural competence in Vibrio cholerae. Science2005, 310(5755):1824-1827.
64. Vidgen M, Carson J, Higgins M, Owens L: Changes to the pheno-typic profile of Vibrio harveyi when infected with the Vibrioharveyi myovirus-like (VHML) bacteriophage. J Appl Microbiol2006, 100(3):481-487.
66. Mandel MJ, Wollenberg MS, Stabb EV, Visick KL, Ruby EG: A singleregulatory gene is sufficient to alter bacterial host range.Nature 2009, 458(7235):215-218.
67. Reichelt JL, Baumann P, Baumann L: Study of genetic relationshipsamong marine species of the genera Beneckea and Photo-bacterium by means of in vitro DNA/DNA hybridization.Arch Microbiol 1976, 110(1):101-120.
Page 16 of 16(page number not for citation purposes)