31
Genotypic variability in colour, pungency and antioxidant activity among chilli genotypes Dr. V. K. Rao Indian Institute of Horticultural Research, Bangalore, India
| Date post: | 13-Dec-2015 |
| Category: |
Documents |
| Upload: | bernadette-barbara-harvey |
| View: | 219 times |
| Download: | 1 times |
Genotypic variability in colour, pungency and antioxidant activity among chilli genotypes
Dr. V. K. RaoIndian Institute of Horticultural Research,
Bangalore, India

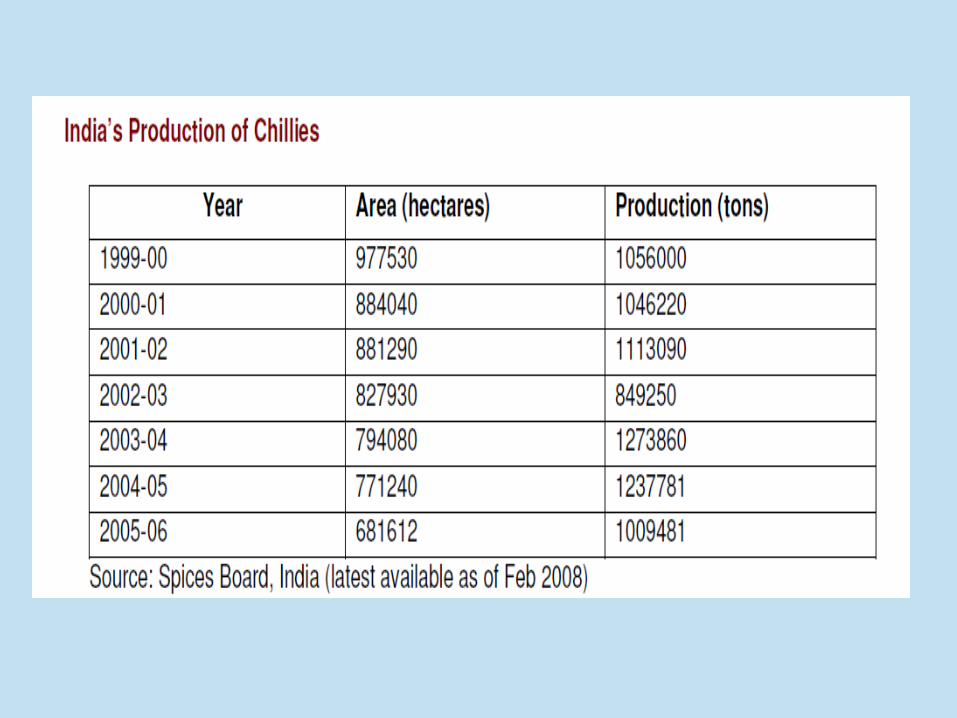
Introduction1. It is a major spice crop in India and some other countries2. It is used for its pungency, flavour and colour.3. India – worlds largest producer, consumer and exporter of
chillies4. Apart from India, other major countries producing chillies
are South Africa, China, Pakistan and Mexico. 5. It is grown in almost all parts of India under various
climatic conditions.6. Different types of chillies are grown to be used for
different purposes. High pungent, low pungent, high colour value ones etc. 7. India exports chillies in the form of dry chillies, dry
powder, pickled chillies and chilli oleoresins.

Usage1. It is used in fresh green state, fermented state, dry red powder.2. Other products include pickles, sauce and paste3. Paprika color – natural red colour - colouring substance in food industry4. Oleoresin – For flavour and colour in food industry

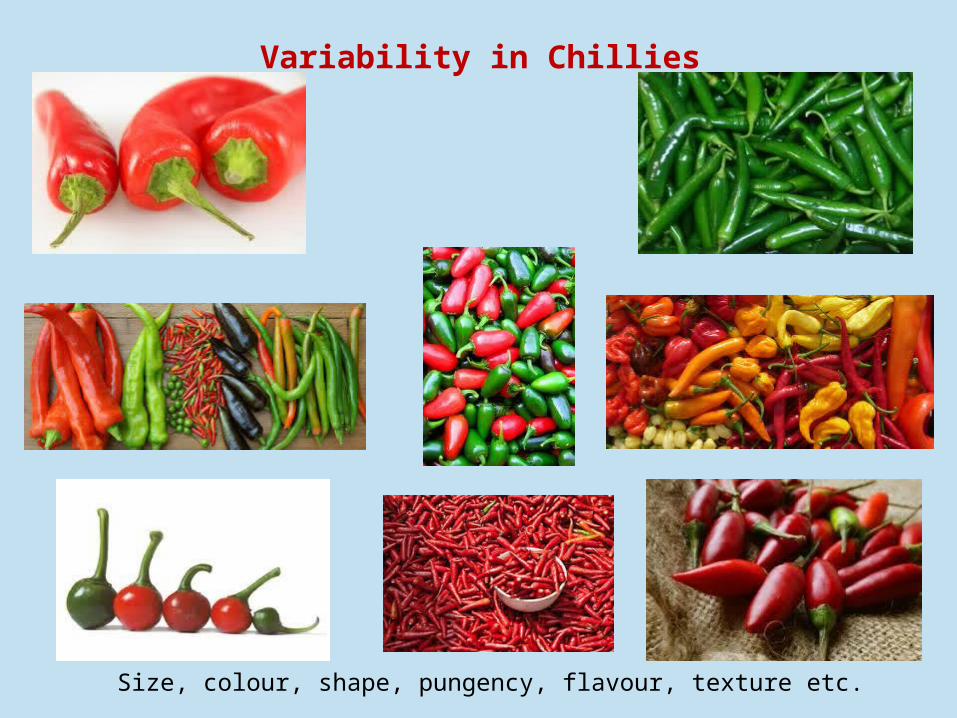
Variability in Chillies
Size, colour, shape, pungency, flavour, texture etc.

1. To study the extent of variability in pungency, colour, antioxidant activity, vitamin C and total phenols among hybrids / varieties developed at IIHR as well as in different varieties collected from other places.
2. To know the relation between pungency and other parameters in chilli hybrids / varieties.
3. To know the extent of contribution of each parameter towards variability through principal component analysis.
4. To know the extent of variability among the samples analyzed through hierarchical clustering.
Objectives
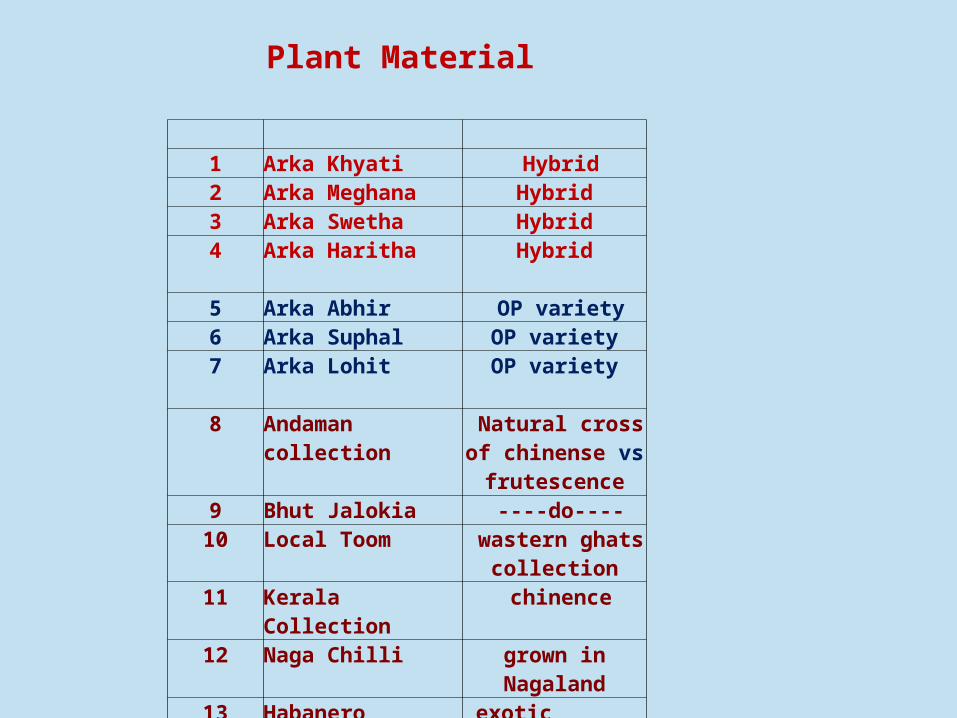
1 Arka Khyati Hybrid2 Arka Meghana Hybrid3 Arka Swetha Hybrid4 Arka Haritha Hybrid
5 Arka Abhir OP variety6 Arka Suphal OP variety7 Arka Lohit OP variety
8 Andaman collection
Natural cross of chinense vs frutescence
9 Bhut Jalokia ----do----10 Local Toom wastern ghats
collection11 Kerala Collection chinence
12 Naga Chilli grown in Nagaland
13 Habanero exotic variety
Plant Material

Parameters studied
1. Pungency – by estimating capsaicinoids by HPLC (SHU units obtained by multiplication with 16.1 million)
2. ASTA colour value – Spectrophometric method
3. Vitamin C – Titrimetric method by using 2,6-dichlorophenol indophenol
4. Total phenols - spectrophotometric assay
5. DPPH radical scavenging assay – spectrophotometric assay
6. FRAP antioxidant capacity assay - spectrophotometric assay

HPLC method for capsaicinoids analysis
1. Column : Onyx monolithic C18, 100 x 4.6 mm2. Method: Gradient3. Mobile phase: Water :Acetonitrile4. Detection: 205 nm5. Flow: 1.8 ml/min6.Injection: 20 µl7. Std levels: 78. LOD: 0.01 µg9. LOQ: 0.03 µg
S. No.
Time Acetonitrile %
1 0 – 8 minutes 30 % to 78 %
2 8.01 – 12 minutes
78 %

Chromatogram of capsaicinoid standards

Capsaicinoids – pungency compounds
Capsaicin, Dihydrocapsaicin – account for 90-96 % of capsaicinoids
S. No. Variety Total capsaicinoids
mg/g
SHU Capsaicin %
Dihydrocapsaicin
%
CP/DC
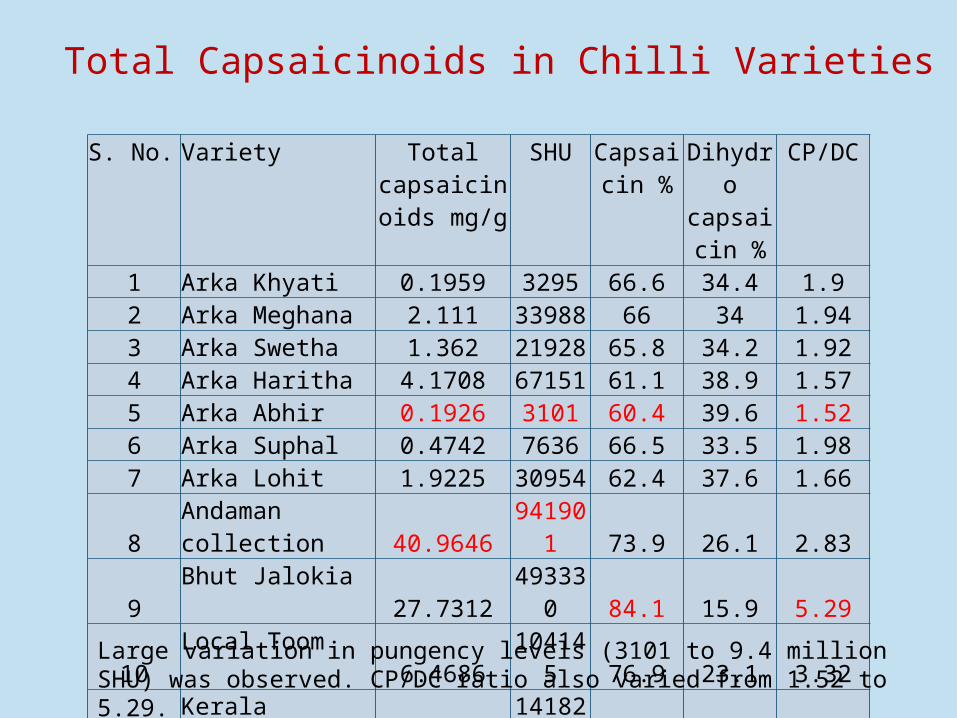
1 Arka Khyati 0.1959 3295 66.6 34.4 1.92 Arka Meghana 2.111 33988 66 34 1.943 Arka Swetha 1.362 21928 65.8 34.2 1.924 Arka Haritha 4.1708 67151 61.1 38.9 1.575 Arka Abhir 0.1926 3101 60.4 39.6 1.526 Arka Suphal 0.4742 7636 66.5 33.5 1.987 Arka Lohit 1.9225 30954 62.4 37.6 1.668 Andaman collection 40.9646 941901 73.9 26.1 2.839 Bhut Jalokia 27.7312 493330 84.1 15.9 5.29
10 Local Toom 6.4686 104145 76.9 23.1 3.3211 Kerala Collection 8.5754 141821 73.1 26.9 2.7212 Naga Chilli 29.0245 623269 77.8 22.4 3.5113 Habanero 11.6403 243932 74.9 25.1 2.98
Total Capsaicinoids in Chilli Varieties
Large variation in pungency levels (3101 to 9.4 million SHU) was observed. CP/DC ratio also varied from 1.52 to 5.29.
0 100000 200000 300000 400000 500000 600000 700000 800000 900000 10000000
1
2
3
4
5
6
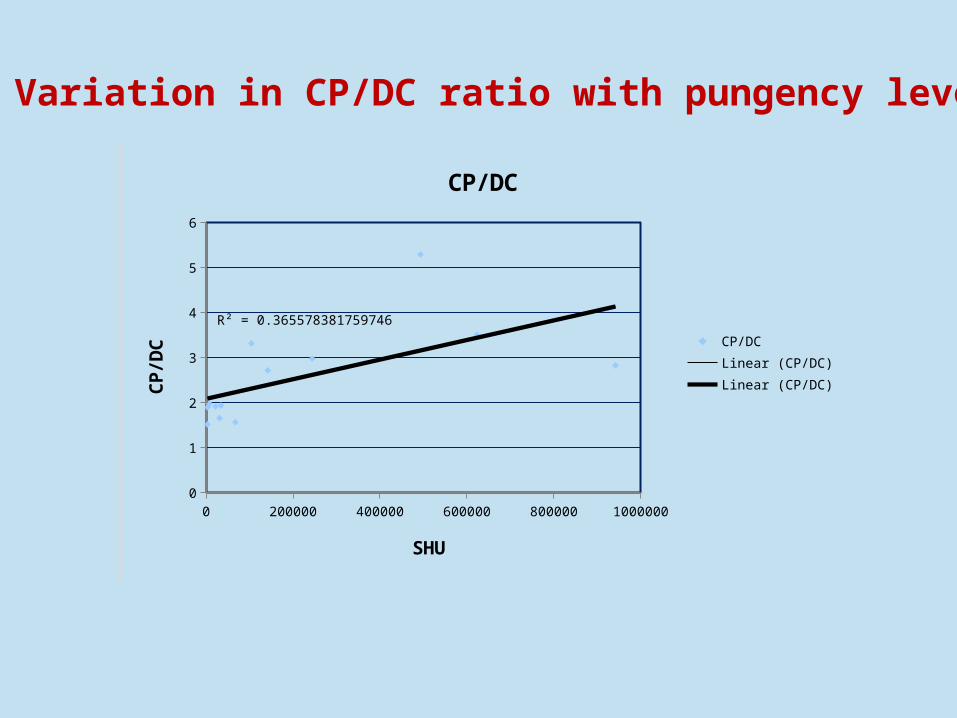
R² = 0.365578381759746
CP/DC
CP/DCLinear (CP/DC)Linear (CP/DC)
SHU
CP/D
C
Variation in CP/DC ratio with pungency level
S. No Variety Pungency (SHU) Total phenols (mg/g)
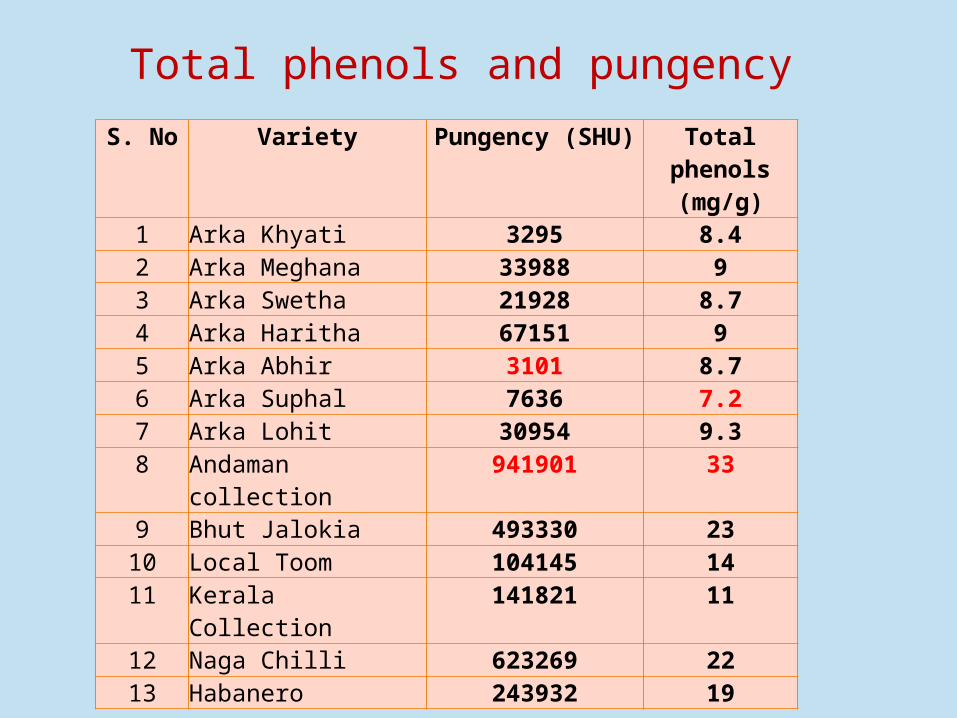
1 Arka Khyati 3295 8.42 Arka Meghana 33988 93 Arka Swetha 21928 8.74 Arka Haritha 67151 95 Arka Abhir 3101 8.76 Arka Suphal 7636 7.27 Arka Lohit 30954 9.38 Andaman collection 941901 33
9 Bhut Jalokia 493330 2310 Local Toom 104145 1411 Kerala Collection 141821 11
12 Naga Chilli 623269 2213 Habanero 243932 19
Total phenols and pungency

0
100000
200000
300000
400000
500000
600000
700000
800000
900000
10000000
5
10
15
20
25
30
35
R² = 0.946383859329383
SHU
Tota
l phe
nols
mg/
g
Total phenols and pungency

Free radicals in human body
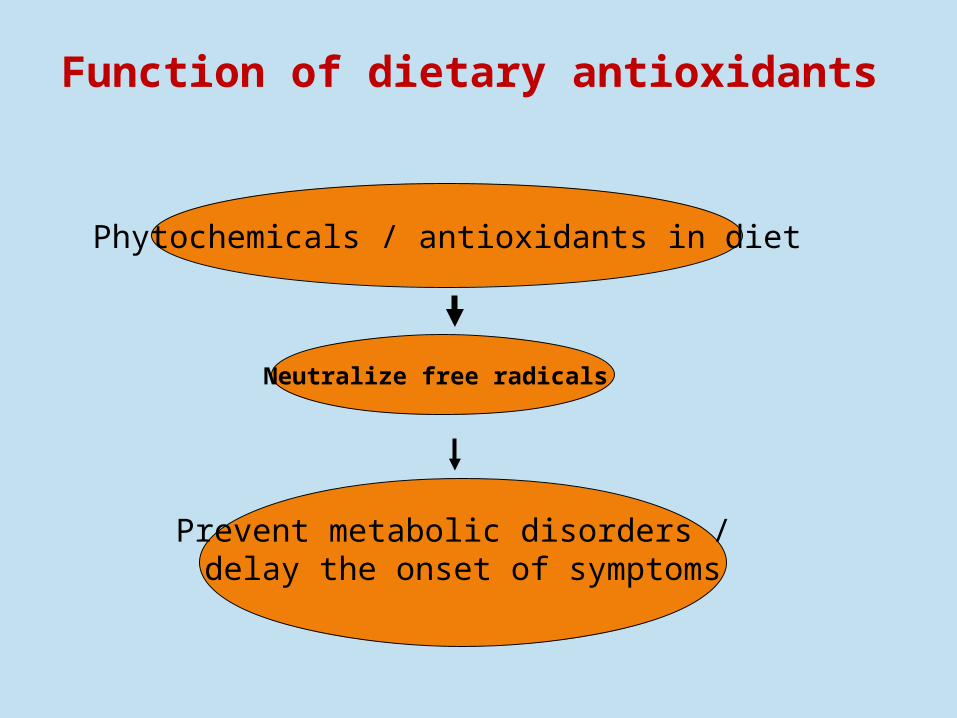
Neutralize free radicals
Phytochemicals / antioxidants in diet
Prevent metabolic disorders / delay the onset of symptoms
Function of dietary antioxidants
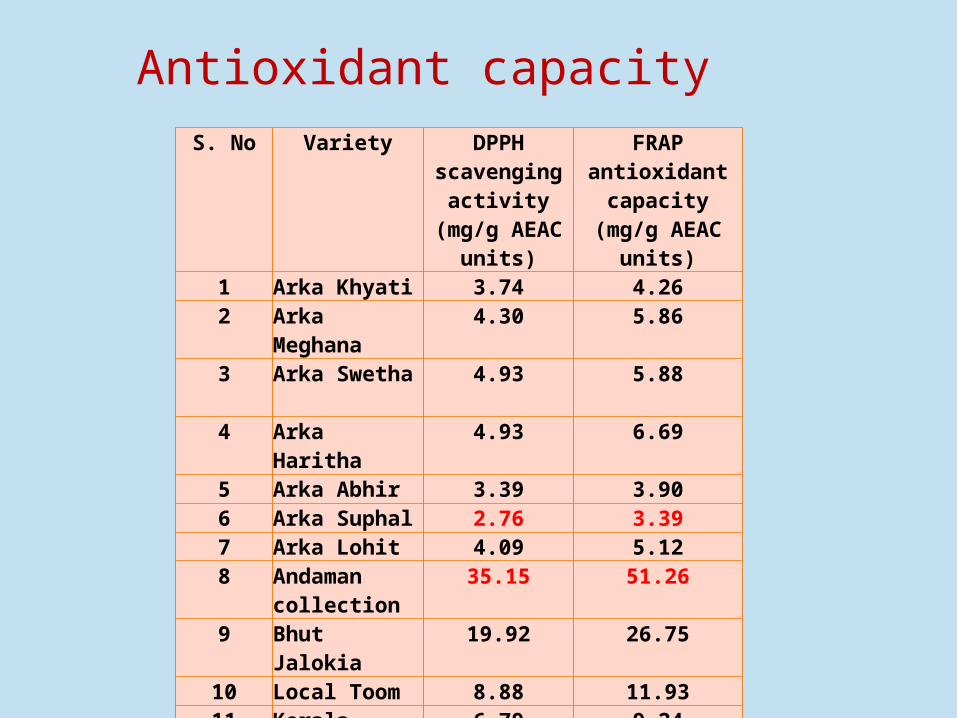
S. No Variety DPPH scavenging activity (mg/g
AEAC units)
FRAP antioxidant capacity (mg/g
AEAC units)
1 Arka Khyati 3.74 4.262 Arka Meghana 4.30 5.863 Arka Swetha 4.93 5.884 Arka Haritha 4.93 6.695 Arka Abhir 3.39 3.906 Arka Suphal 2.76 3.397 Arka Lohit 4.09 5.128 Andaman
collection35.15 51.26
9 Bhut Jalokia 19.92 26.7510 Local Toom 8.88 11.9311 Kerala Collection 6.79 9.24
12 Naga Chilli 24.39 32.7113 Habanero 13.35 31.86
Antioxidant capacity
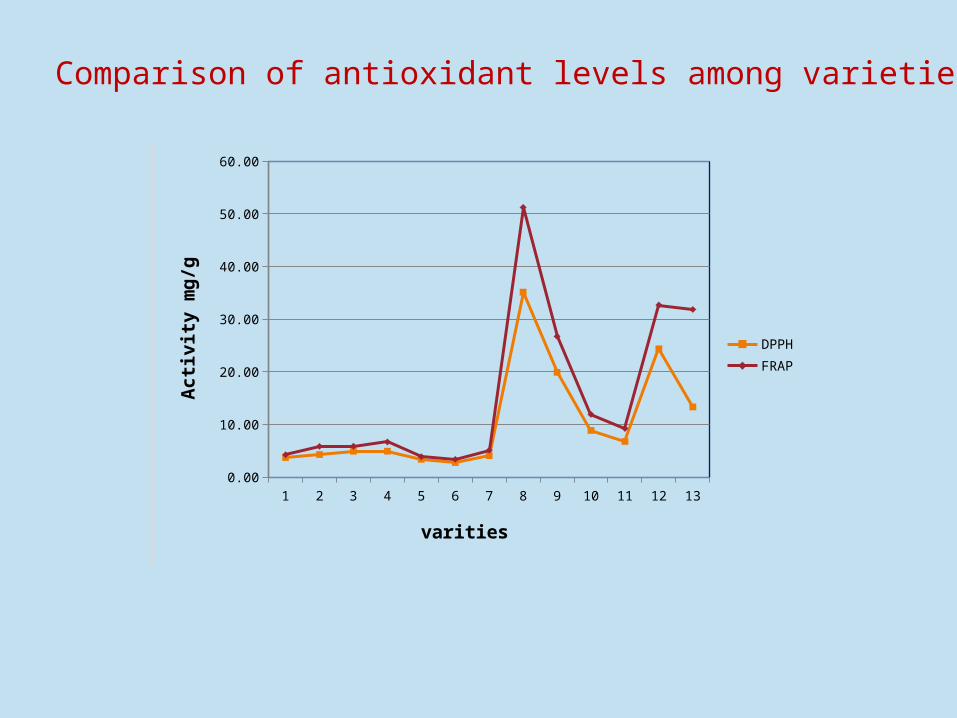
1 2 3 4 5 6 7 8 9 10 11 12 130.00
10.00
20.00
30.00
40.00
50.00
60.00
DPPH FRAP
varities
Acti
vity
mg/
g
Comparison of antioxidant levels among varieties

Carotenoid pigments in chillies
capsanthin
capsorubin
A. Red carotenoids

B. Yellow carotenoids
zeaxanthin
antheraxanthin
mutatoxanthin
Β-cryptoxanthin

S. No. Variety Red carotenoids (mg/100 g)
yellow carotenoids (mg/100 g)
Total corotenoids
mg/100 g
Ratio(Red/Yellow)
1 Arka Khyati 147.0 109.7 256.7 1.32 Arka Meghana 119.6 94.9 214.5 1.33 Arka Swetha 130.8 145.7 276.4 0.94 Arka Haritha 80.7 65.5 146.1 1.25 Arka Abhir 154.8 113.1 267.9 1.46 Arka Suphal 125.7 98.7 227.8 1.37 Arka Lohit 87.3 38.8 126.2 2.2
8Andaman collection 45.9 28.8 74.7 1.6
9 Bhut Jalokia 45.9 30.0 75.9 1.510 Local Toom 40.8 94.7 135.5 0.4
11 Kerala Collection 46.2 36.2 82.4 1.312 Naga Chilli 56.4 33.3 89.8 1.713 Habanero 4.1 2.7 6.9 1.5
Distribution of red and yellow carotenoids

1 2 3 4 5 6 7 8 9 10 11 12 130.0
20.0
40.0
60.0
80.0
100.0
120.0
140.0
160.0
180.0
Red carotenoids (mg/100 g)
yellow carotenoids (mg/100 g)
Varieties
Comparative levels of red and yellow carotenoids
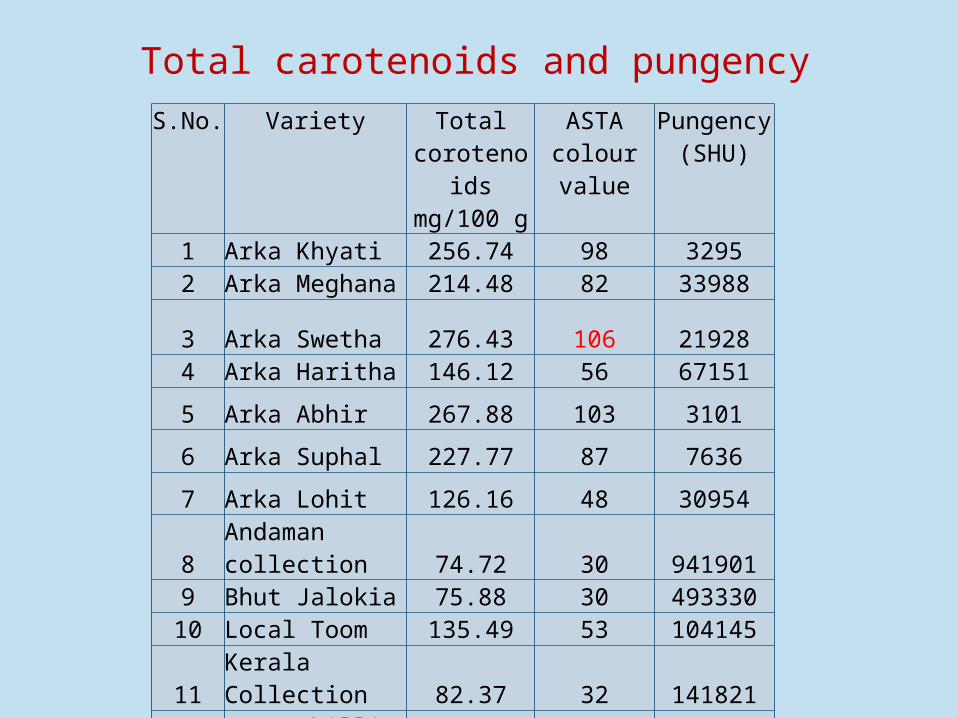
S.No. Variety Total corotenoids
mg/100 g
ASTA colour value
Pungency (SHU)
1 Arka Khyati 256.74 98 32952 Arka Meghana 214.48 82 33988
3 Arka Swetha 276.43 106 219284 Arka Haritha 146.12 56 67151
5 Arka Abhir 267.88 103 3101
6 Arka Suphal 227.77 87 7636
7 Arka Lohit 126.16 48 30954
8Andaman collection 74.72 30 941901
9 Bhut Jalokia 75.88 30 49333010 Local Toom 135.49 53 10414511 Kerala Collection 82.37 32 14182112 Naga Chilli 89.77 35 62326913 Habanero 6.87 3 243932
Total carotenoids and pungency

0 50 100 150 200 250 3000
100000
200000
300000
400000
500000
600000
700000
800000
900000
1000000
Pungency (S...
Total Carotenoids mg/100 g
SHU
Relation between total carotenoids and pungency

S. No. Variety Vitamin C mg/100 g
FW
Pungency SHU
1 Arka Khyati 77 3295
2Arka Meghana 89.5 33988
3 Arka Swetha 113 219284 Arka Haritha 100 671515 Arka Abhir 172 31016 Arka Suphal 94 76367 Arka Lohit 179.5 30954
60 80 100 120 140 160 180 2000
10000
20000
30000
40000
50000
60000
70000
80000
Vitamin C mg / 100 gPu
ngen
cy S
HU
Pungency VS vitamin C
Vitamin C in Chilli varieties
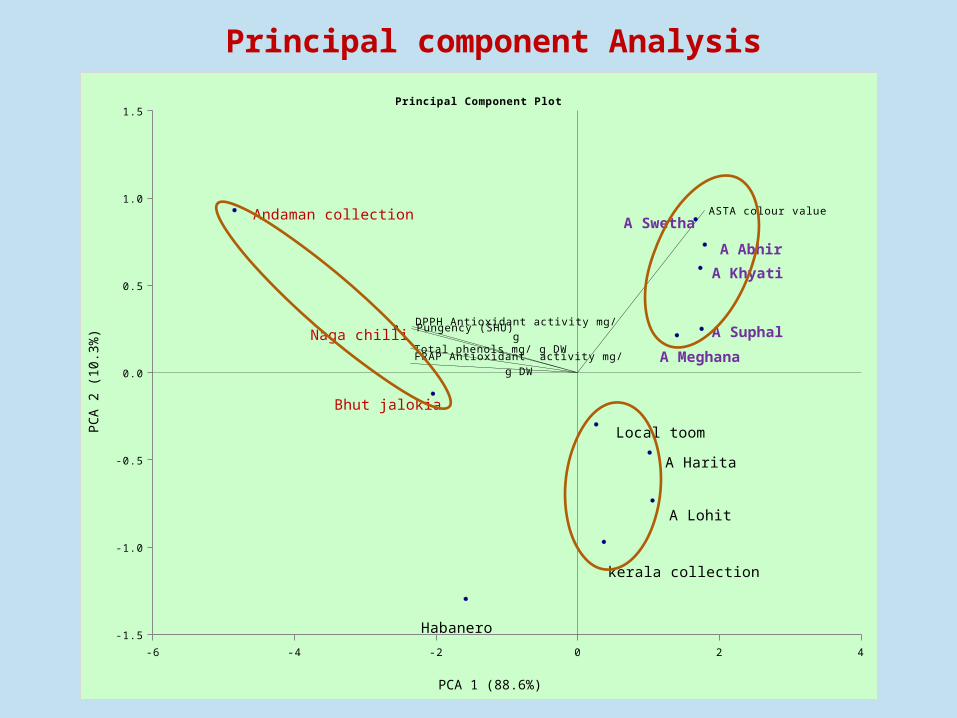
-6 -4 -2 0 2 4
-1.5
-1.0
-0.5
0.0
0.5
1.0
1.5
ASTA colour value
Pungency (SHU)
FRAP Antioxidant activity mg/ g DW
DPPH Antioxidant activity mg/ g
Total phenols mg/ g DW
Principal Component Plot
PCA 1 (88.6%)
PC
A 2
(10
.3%
)
Habanero
kerala collection
A Lohit
A Harita
Local toom
Bhut jalokia
Andaman collection
Naga chilli
A Meghana
A Suphal
A Khyati
A Abhir
A Swetha
Principal component Analysis

0 111685399953
Andaman collection
Naga Chilli
Bhut Jalokia
Habanero
Kerala Collection
Local Toom
Arka Haritha
Arka Swetha
Arka Suphal
Arka Lohit
Arka Meghana
Arka Abhir
Arka Khyati
Hierarchical Clustering
Distance/Similarity Measure = Squared Euclidean DistanceCluster Method = Nearest Neighbour
Hierarchical Clustering
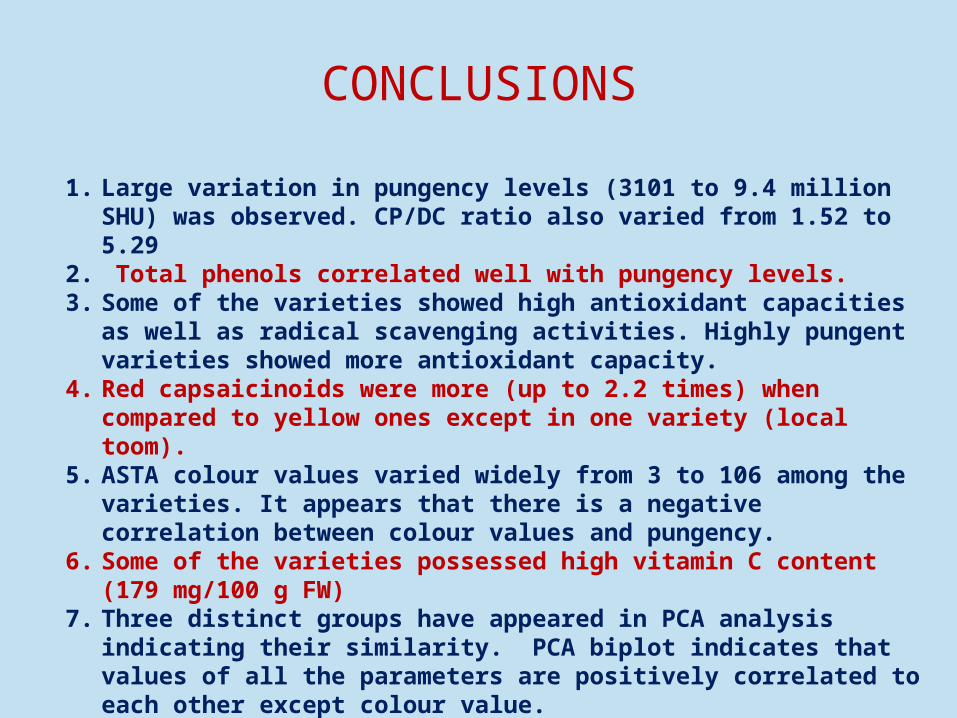
CONCLUSIONS
1. Large variation in pungency levels (3101 to 9.4 million SHU) was observed. CP/DC ratio also varied from 1.52 to 5.29
2. Total phenols correlated well with pungency levels.3. Some of the varieties showed high antioxidant capacities as well as radical
scavenging activities. Highly pungent varieties showed more antioxidant capacity.4. Red capsaicinoids were more (up to 2.2 times) when compared to yellow ones
except in one variety (local toom). 5. ASTA colour values varied widely from 3 to 106 among the varieties. It appears that
there is a negative correlation between colour values and pungency. 6. Some of the varieties possessed high vitamin C content (179 mg/100 g FW)7. Three distinct groups have appeared in PCA analysis indicating their similarity. PCA
biplot indicates that values of all the parameters are positively correlated to each other except colour value.
8. Heirarchical clustering indicated that andaman collection is chemically different from all other varieties.

THANK YOU


