55
Management’s Discussion and Analysis For the year ended December 31, 2017 Genworth MI Canada Inc.
Management’s Discussion and Analysis
For the year ended December 31, 2017
Genworth MI Canada Inc.

Genworth MI Canada Inc. Q4’17 MD&A
Page 2 of 55
Interpretation
The current and prior-period comparative results for Genworth MI Canada Inc. (“Genworth Canada” or the “Company”) reflect the consolidation of the Company and its subsidiaries, including Genworth Financial Mortgage Insurance Company Canada (the “Insurance Subsidiary”). The Insurance Subsidiary is engaged in the provision of mortgage insurance in Canada and is regulated by the Office of the Superintendent of Financial Institutions (“OSFI”) as well as financial services regulators in each province.
The following Management’s Discussion and Analysis (“MD&A”) of the financial condition and results of operations as approved by the Company’s board of directors (the “Board”) on February 6, 2018 is prepared for the three and twelve months ended December 31, 2017. The audited consolidated financial statements of the Company were prepared in accordance with International Financial Reporting Standards (“IFRS”). This MD&A should be read in conjunction with the Company’s financial statements.
Unless the context otherwise requires, all references in this MD&A to “Genworth Canada” or the “Company” refer to Genworth MI Canada Inc. and its subsidiaries.
Unless the context otherwise requires, all financial information is presented on an IFRS basis.
Caution regarding forward-looking information and statements
Certain statements made in this MD&A contain forward-looking information within the meaning of applicable securities laws (“forward-looking statements”). When used in this MD&A, the words “may”, “would”, “could”, “will”, “intend”, “plan”, “anticipate”, “believe”, “seek”, “propose”, “estimate”, “expect”, and similar expressions, as they relate to the Company are intended to identify forward-looking statements. Specific forward-looking statements in this document include, but are not limited to, statements with respect to the impact of guideline changes by OSFI and legislation introduced in connection with the Protection of Residential Mortgage or Hypothecary Insurance Act (“PRMHIA”); the effect of changes to the mortgage insurance rules, including government guarantee mortgage eligibility rules and Ontario’s Fair Housing Plan; and the Company’s beliefs as to housing demand and home price appreciation, key macroeconomic factors, unemployment rates; the Company’s future operating and financial results; the operating range for the Company’s expense ratio; sales expectations regarding premiums written; capital expenditure plans, dividend policy and the ability to execute on its future operating, investing and financial strategies.
The forward-looking statements contained herein are based on certain factors and assumptions, certain of which appear proximate to the applicable forward-looking statements contained herein. Inherent in the forward-looking statements are known and unknown risks, uncertainties and other factors beyond the Company’s ability to control or predict, that may cause the actual results, performance or achievements of the Company, or developments in the Company’s business or in its industry, to differ materially from the anticipated results, performance, achievements or developments expressed or implied by such forward-looking statements. Actual results or developments may differ materially from those contemplated by the forward-looking statements.
The Company’s actual results and performance could differ materially from those anticipated in these forward-looking statements as a result of both known and unknown risks, including: the continued availability of the Canadian government’s guarantee of private mortgage insurance on terms satisfactory to the Company; the Company’s expectations regarding its revenues, expenses and operations; the Company’s plans to implement its strategy and operate its business; the Company’s expectations regarding the compensation of directors and officers; the Company’s anticipated cash needs and its estimates regarding its capital expenditures, capital requirements, reserves and its needs for additional financing; the Company’s plans for and timing of expansion of service and products; the Company’s ability to accurately assess and manage risks associated with the policies that are written; the Company’s ability to accurately manage market, interest and credit risks; the Company’s ability to maintain ratings, which may be affected by the ratings of its majority shareholder, Genworth Financial, Inc.; interest rate fluctuations; a decrease in the volume of high loan-to-value mortgage originations; the cyclical nature of the mortgage insurance industry; changes in government regulations and laws mandating mortgage insurance; the acceptance by the Company’s lenders of new technologies and products; the Company’s ability to attract lenders and develop and maintain lender relationships; the Company’s competitive position and its expectations regarding competition from other providers of mortgage insurance in Canada; anticipated trends and challenges in the Company’s business and the markets in which it operates; changes in the global or Canadian economies; a decline in the Company’s regulatory capital or an increase in its regulatory capital requirements; loss of members of the Company’s senior management team; potential legal, tax and regulatory investigations and actions; the failure of the Company’s computer systems; potential conflicts of interest between the
Genworth MI Canada Inc. Q4’17 MD&A
Page 3 of 55
Company and its majority shareholder, Genworth Financial, Inc.; and Genworth Financial Inc. closing or failing to execute on a merger agreement with subsidiaries of China Oceanwide Holdings Group Co., Ltd. more fully described on Page 16 “Genworth Financial, Inc. transaction.”
This is not an exhaustive list of the factors that may affect any of the Company’s forward-looking statements. Some of these and other factors are discussed in more detail in the Company’s Annual Information Form (the “AIF”) dated March 15, 2017. Investors and others should carefully consider these and other factors and not place undue reliance on the forward-looking statements. Further information regarding these and other risk factors is included in the Company’s public filings with provincial and territorial securities regulatory authorities (including the Company’s AIF) and can be found on the System for Electronic Document Analysis and Retrieval (“SEDAR”) website at www.sedar.com. The forward-looking statements contained in this MD&A represent the Company’s views only as of the date hereof. Forward-looking statements contained in this MD&A are based on management’s current plans, estimates, projections, beliefs and opinions and the assumptions related to these plans, estimates, projections, beliefs and opinions may change, and are presented for the purpose of assisting the Company’s security holders in understanding management’s current views regarding those future outcomes and may not be appropriate for other purposes. While the Company anticipates that subsequent events and developments may cause the Company’s views to change, the Company does not undertake to update any forward-looking statements, except to the extent required by applicable securities laws.
Non-IFRS financial measures
To supplement the Company’s consolidated financial statements, which are prepared in accordance with IFRS, the Company uses non-IFRS financial measures to analyze performance. The Company’s key performance indicators and certain other information included in this MD&A include non-IFRS financial measures. Such non-IFRS financial measures used by the Company to analyze performance include, among others, interest and dividend income, net of investment expenses, net operating income, operating earnings per common share (basic) and operating earnings per common share (diluted).
Other non-IFRS financial measures used by the Company to analyze performance for which no comparable IFRS measure is available include, among others, insurance in-force, new insurance written, loss ratio, expense ratio, combined ratio, operating return on equity, investment yield, Minimum Capital Test (“MCT”) ratio. The Company believes that these non-IFRS financial measures provide meaningful supplemental information regarding its performance and may be useful to investors because they allow for greater transparency with respect to key metrics used by management in its financial and operational decision making. Non-IFRS financial measures do not have standardized meanings and are unlikely to be comparable to any similar measures presented by other companies.
See the “Non-IFRS financial measures” section at the end of this MD&A for a reconciliation of net operating income to net income, investment income to interest and dividend income, net of investment expenses, operating earnings per common share (basic) to earnings per common share (basic) and operating earnings per common share (diluted) to earnings per common share (diluted).
Definitions of key non-IFRS financial measures and explanations of why these measures are useful to investors and management can be found in the Company’s “Non-IFRS financials measures glossary”, in the “Non-IFRS financial measures” section at the end of this MD&A.

Genworth MI Canada Inc. Q4’17 MD&A
Page 4 of 55
Table of contents
Business profile ........................................................................................................................................................................................ 5 Overview .................................................................................................................................................................................................. 6
Fourth quarter financial highlights...................................................................................................................................................... 6 Performance against strategic priorities ............................................................................................................................................. 9 Recent business and regulatory developments ................................................................................................................................ 12 Economic environment ..................................................................................................................................................................... 17 2018 objectives ................................................................................................................................................................................. 18 Fourth Quarter Review ..................................................................................................................................................................... 20 Summary of annual information ....................................................................................................................................................... 26 Summary of quarterly results ........................................................................................................................................................... 28 Reserve development analysis .......................................................................................................................................................... 29
Financial condition ................................................................................................................................................................................. 30 Financial instruments ........................................................................................................................................................................ 30 Liquidity ............................................................................................................................................................................................. 33 Capital expenditures ......................................................................................................................................................................... 35
Capital management .............................................................................................................................................................................. 35 Minimum capital test ........................................................................................................................................................................ 35 Debt ................................................................................................................................................................................................... 36 Credit facility ..................................................................................................................................................................................... 36 Financial strength ratings .................................................................................................................................................................. 37 Capital transactions........................................................................................................................................................................... 37 Restrictions on dividends and capital transactions ........................................................................................................................... 38 Outstanding share data ..................................................................................................................................................................... 38
Risk management .................................................................................................................................................................................. 39 Enterprise risk management framework .......................................................................................................................................... 39 Governance framework .................................................................................................................................................................... 39 Risk appetite framework ................................................................................................................................................................... 40 Risk controls ...................................................................................................................................................................................... 41 Risk categories .................................................................................................................................................................................. 41
Financial reporting controls and accounting disclosures ....................................................................................................................... 44 Disclosure controls and procedures and internal controls over financial reporting......................................................................... 44 Significant estimates and judgments ................................................................................................................................................ 47
Non-IFRS financial measures.................................................................................................................................................................. 50 Non-IFRS financial measures glossary ............................................................................................................................................... 51
Other Glossary ....................................................................................................................................................................................... 52
Genworth MI Canada Inc. Q4’17 MD&A
Page 5 of 55
Business profile
Business background
Genworth Canada is the largest private-sector residential mortgage insurer in Canada and has been providing mortgage default insurance in the country since 1995. The Company has built a broad underwriting and distribution platform across the country that provides customer-focused products and support services to the vast majority of Canada’s residential mortgage lenders and originators. Genworth Canada underwrites mortgage insurance for residential properties in all provinces and territories of Canada and has the leading market share among private mortgage insurers. The Canada Mortgage and Housing Corporation (“CMHC”), a crown corporation, is the Company’s main competitor.
The Company offers both transactional and portfolio mortgage insurance.
Federally regulated lenders are required to purchase transactional mortgage insurance in respect of a residential mortgage loan whenever the loan-to-value ratio exceeds 80%. The Company’s transactional mortgage insurance covers default risk on mortgage loans secured by residential properties to protect lenders from any resulting losses on claims. By offering insurance for transactional mortgages, the Company plays a significant role in providing access to homeownership for Canadian residents. Homebuyers who can only afford to make a smaller down payment can, through the benefits provided by mortgage insurers such as Genworth Canada, obtain mortgages at rates comparable to buyers with more substantial down payments.
The Company also provides portfolio mortgage insurance to lenders for loans with loan-to-value ratios of 80% or less. Portfolio mortgage insurance is beneficial to lenders as they provide the ability to manage capital and funding requirements and mitigate risk. The Company views portfolio mortgage insurance as an extension of its relationship with existing transactional customers. Therefore, the Company carefully manages the level of its portfolio mortgage insurance relative to its overall mortgage insurance business. Premium rates on portfolio mortgage insurance have historically been lower than those on transactional mortgage insurance due to the lower risk profile associated with portfolio loans.
Seasonality
The transactional mortgage insurance business is seasonal. Premiums written vary each quarter, while premiums earned, investment income, underwriting and administrative expenses tend to be relatively stable from quarter to quarter. The variations in premiums written are driven by mortgage origination activity and associated transactional new insurance written, which typically peak in the spring and summer months. Losses on claims vary from quarter to quarter, primarily as the result of prevailing economic conditions, changes in employment levels and characteristics of the insurance in-force portfolio, such as size, age, seasonality and geographic mix of delinquencies. Typically, losses on claims increase during the winter months, due primarily to an increase in new delinquencies, and decrease during the spring and summer months.
The Company’s new insurance written from portfolio mortgage insurance varies from period to period based on a number of factors including: the amount of portfolio mortgages lenders seek to insure; the competitiveness of the Company’s pricing, underwriting guidelines and credit enhancement for portfolio insurance; and the Company’s risk appetite for such mortgage insurance.
Distribution and marketing
The Company works with lenders, mortgage brokers and real estate agents across Canada to make homeownership more accessible for first-time homebuyers. Mortgage insurance customers consist of originators of residential mortgage loans, such as banks, mortgage loan and trust companies, credit unions and other lenders. These lenders typically determine which mortgage insurer they will use for the placement of mortgage insurance written on loans originated by them. The five largest Canadian chartered banks have been the largest mortgage originators in Canada and provide the majority of financing for residential mortgages.

Genworth MI Canada Inc. Q4’17 MD&A
Page 6 of 55
Overview Fourth quarter financial highlights Table 1: Selected financial information
Fourth Quarter Full Year
(in millions of dollars, unless otherwise specified) 2017 2016 2017 2016
Premiums written Transactional 157 149 602 619 Portfolio Insurance 7 22 60 140
Total Premiums written $ 164 $ 171 $ 663 $ 760
Premiums earned $ 171 $ 164 $ 676 $ 638 Losses on claims 15 29 69 139 Expenses 34 33 133 124
Total losses on claims and expenses 49 62 202 263
Net underwriting income 121 103 474 375
Interest and dividend income, net of investment expenses 48 46 182 176
Net investment gains 17 47 83 38
Investment income 64 93 265 214
Interest expense 6 6 24 23 Income before income taxes 180 190 716 566
Net income $ 132 $ 140 $ 528 $ 417
Net operating income 1 $ 121 $ 105 $ 467 $ 388
Weighted average number of common shares outstanding Basic 90,942,040 91,856,165 91,583,907 91,828,701 Diluted 2 90,965,574 92,266,264 91,625,024 91,874,244
Earnings per common share Earnings per common share (basic) $ 1.45 $ 1.52 $ 5.76 $ 4.54 Earnings per common share (diluted) 2 $ 1.45 $ 1.52 $ 5.76 $ 4.54 Selected non-IFRS financial measures 1 Operating earnings per common share (basic) $ 1.33 $ 1.15 $ 5.10 $ 4.23
Operating earnings per common share (diluted) 2 $ 1.33 $ 1.14 $ 5.09 $ 4.23 Insurance in-force (original insured amount) $ 491,795 $ 464,291 $ 491,795 $ 464,291 Outstanding insured mortgage balances 3 $ 218,000 $ 223,000 $ 218,000 $ 223,000 Transactional new insurance written $ 4,516 $ 5,120 $ 18,187 $ 21,171 Portfolio new insurance written $ 913 $ 4,918 $ 13,381 $ 41,881 Loss ratio 9% 18% 10% 22% Expense ratio 20% 20% 20% 19% Combined ratio 29% 38% 30% 41%
Operating return on equity 13% 12% 13% 11% 2017 Internal MCT target/2016 MCT holding target 4 157% 220% 157% 220% MCT ratio 5 168% 245% 168% 245%
Delinquency ratio 6 0.08% 0.10% 0.08% 0.10% Note: Amounts may not total due to rounding. 1 These financial measures are not calculated based on IFRS. See the “Non-IFRS financial measures” section at the end of this MD&A for additional information. 2 The difference between basic and diluted number of common shares outstanding, basic and diluted earnings per common share, and basic and diluted operating earnings per common share is caused by the potentially dilutive impact of share-based compensation awards. 3This estimate is based on the amounts reported by lenders to the Company which represents the vast majority of outstanding insured mortgage balances.
4Effective January 1, 2017, the 2016 holding target MCT ratio of 220% was recalibrated to the OSFI Supervisory MCT ratio target of 150% and the minimum MCT ratio under PRMHIA was reduced to 150%. 5Company estimate at December 31, 2017. 6 Based on original insured loans in-force for which coverage terms have not expired and excludes delinquencies that have been incurred but not reported.
Genworth MI Canada Inc. Q4’17 MD&A
Page 7 of 55
Key fourth quarter of 2017 financial results:
The Company reported net income of $132 million and net operating income of $121 million in the fourth quarter of 2017, as compared to $140 million and $105 million, respectively, in the same quarter in the prior year.
Premiums written of $164 million decreased by $7 million, or 4%, compared to the same quarter in the prior year. Premiums written from transactional insurance were $157 million. This represents an increase of $8 million, over the same quarter in the prior year, primarily due to a 19% higher average premium rate resulting from the March 17, 2017 premium rate increase, which was partially offset by a smaller high loan-to-value origination market following the introduction by the Canadian federal government of an insured mortgage rate stress test effective November 30, 2016.
Premiums written from portfolio insurance were $7 million, representing a decrease of $15 million compared to the same quarter in the prior year primarily due to lower demand for portfolio insurance, partially offset by an 80% higher average premium rate as a result of higher regulatory capital requirements.
Premiums earned of $171 million were $6 million, or 4%, higher than the same quarter in the prior year due to the relatively larger contributions from premiums written in recent years.
Losses on claims of $15 million were $14 million, or 48%, lower than the same quarter in the prior year primarily due to fewer new reported delinquencies, net of cures and a lower average reserve per delinquency as a result of strong or stable economic conditions. The loss ratio was 9% for the quarter as compared to 18% in the same quarter in the prior year.
Expenses of $34 million were $1 million, or 4%, higher than the same quarter in the prior year, primarily due to higher share based compensation expense. The expense ratio for the quarter was 20%, consistent with the same quarter in the prior year and within the Company’s expected operating range of 18% to 20%.
Investment income, excluding net investment gains, of $48 million was $2 million higher compared to the same quarter in the prior year primarily due to an increase in the amount of invested assets.
Net investment gains of $17 million, primarily from net gains on derivatives and foreign exchange, were $31 million lower than the same quarter in the prior year. The increase in the market value of the Company’s interest rate swaps used to hedge interest rate risk in the quarter was lower than the increase in the same quarter in the prior year.
Key 2017 financial results:
The Company reported net income of $528 million and net operating income of $467 million in 2017, as compared to $417 million and $388 million, respectively, in the prior year.
Premiums written of $663 million decreased by $97 million, or 13%, as compared to the prior year. Premiums written from transactional insurance were $602 million. This represents a decrease of $17 million, or 3%, from the prior year, primarily due to a smaller high loan-to-value origination market resulting primarily from the introduction of an insured mortgage rate stress test in the fourth quarter of 2016 which was partially offset by a 13% higher average premium rate resulting from the March 17, 2017 premium rate increase.
Premiums written from portfolio insurance were $60 million. This represents a decrease of $80 million, or 57%, compared to the prior year, primarily due to lower demand for portfolio insurance, partially offset by a 34% higher average premium rate in response to higher regulatory capital requirements. The prior year results include $57 million of premiums written from a $20 billion portfolio insurance transaction with a large bank that is not likely to recur.
Premiums earned were $676 million, representing an increase of $38 million, or 6%, when compared to the prior year, due to
the relatively larger contributions from premiums written in recent years.
Genworth MI Canada Inc. Q4’17 MD&A
Page 8 of 55
Losses on claims of $69 million were $70 million, or 50%, lower than the prior year, primarily due to fewer new reported delinquencies, net of cures, a lower average reserve per delinquency and favourable loss reserve development. The loss ratio was 10% compared to 22% in the prior year.
Expenses of $133 million were $9 million, or 7%, higher than the prior year, primarily due to higher amortization of previously deferred policy acquisition costs consistent with higher premiums earned and an increase in regulatory supervisory fee related to a change in the regulatory allocation methodology. The expense ratio was 20%, consistent with the prior year and within the Company’s expected operating range of 18% to 20%.
Investment income, excluding net investment gains, of $182 million was $7 million, or 4%, higher than the prior year, primarily due to an increase in the amount of invested assets.
Net investment gains of $83 million, primarily from net gains on derivatives and foreign exchange, were $44 million higher than the prior year. The increase in the market value of the Company’s interest rate swaps used to hedge interest rate risk in the year was higher than the increase in the prior year.
The Company’s investment portfolio had a market value of $6.4 billion and a duration of 3.9 years as at December 31, 2017. The portfolio had an investment yield of 3.2% in 2017, relatively unchanged from the prior year. The regulatory capital ratio or MCT ratio was approximately 168%, 11 percentage points higher than the internal MCT ratio target of 157% and 18 percentage points higher than the OSFI Supervisory MCT target of 150%.
Genworth MI Canada Inc. Q4’17 MD&A
Page 9 of 55
Performance against strategic priorities
The Company met or exceeded the majority of its key strategic priorities for the year ended December 31, 2017 highlighted by the following accomplishments:
Maintained strong insurance portfolio quality with an average transactional credit score of 746;
Grew net operating income by 20%; and
Achieved an operating return on equity of 13%. The following table summarizes the Company’s performance in comparison to the objectives:
2017 Objective Performance
Premiums Written and Premiums Earned
Moderate decline in premiums written despite expected higher premium rates: The Company expects that the transactional market size and its transactional new insurance written in 2017 may decline by approximately 15% to 25% Portfolio insurance premiums written are expected to be significantly lower compared to 2016
Total premiums written decline: 13% Total premiums written decreased by 13% year-over-year due to a 3% decrease in premiums written from transactional insurance and a 57% decrease in premiums written from portfolio insurance. A smaller transactional market was partially offset by the price increase on transactional insurance premium rates for homebuyers which took effect March 17, 2017 and contributed approximately $70 million to premiums written. Transactional new insurance written decline: 14% Transactional premiums written decline: 3% New insurance written from transactional insurance declined by 14%, primarily due to a smaller high loan-to-value mortgage originations market resulting primarily from the introduction of an insured mortgage rate stress test in the fourth quarter of 2016, which was partially offset by an increase in the Company’s market share. The Company experienced a 20% decline in applications and believes the market size declined by approximately 15% to 20% in 2017, as compared to the prior year. Portfolio premiums written decline: 57% New insurance written and premiums written from portfolio insurance declined by 68% and 57%, respectively, primarily due to lower demand for portfolio insurance as a result of the introduction of purpose test rules on July 1, 2016, the prohibition of portfolio insurance on refinance transactions originated by lenders after November 30, 2016, and a substantial increase in portfolio insurance premium rates on mortgage applications received after December 31, 2016 in response to higher regulatory capital requirements. The average premium rate for portfolio insurance increased by 80% to 81 basis points in the fourth quarter of 2017 from 45 basis points in the same quarter in the prior year’s period and this premium rate increase partially offset the impact of the decline in new insurance written.
Genworth MI Canada Inc. Q4’17 MD&A
Page 10 of 55
2017 Objective Performance
Premiums Written and Premiums Earned (cont.)
Modest increase in premiums earned due to seasoning of recent books of business:
Premiums earned growth: 6%
The Company realized $676 million of premiums earned in 2017, an increase of 6% as compared to the prior year, due to relatively larger contributions from premiums written in recent years. Given the single upfront premium model, the Company is generally able to reliably estimate the proportion of unearned premiums that will be earned into revenues as premiums earned over the next 12 to 18 months as long as there are no significant changes to the Company’s current premiums recognition curve.
Losses on Claims
Proactive risk management and focused loss mitigation strategies:
Loss ratio range of 25% to 35%
Workout penetration rate greater than 55%
Loss ratio: 10% The Company’s loss ratio of 10% was below the Company’s original anticipated range of 25% to 35% for 2017 and was at the lower end of the revised range of 10% to 20% included in the third quarter 2017 MD&A. The loss ratio performance was favorably impacted by improving or strong home price appreciation, stable or improving unemployment throughout Canada especially in Québec, Ontario, Alberta and the Pacific region and continued strong underwriting discipline that has contributed to fewer new reported delinquencies and a consistent number of cures. Workout penetration rate: 54% The workout penetration rate of 54% in 2017 was in line with expectations.
Portfolio Quality and Risk Management
Maintain a high quality insurance portfolio through prudent underwriting guidelines, proactive risk management and disciplined underwriting:
Average transactional credit score of greater than 735
Average transactional credit score below 660 of less than 5%
Average transactional credit score: 746 Average transactional credit score below 660: 3% The Company originated a high quality insurance portfolio in 2017 with an average credit score of 746 primarily due to continued underwriting discipline.
Genworth MI Canada Inc. Q4’17 MD&A
Page 11 of 55
2017 Objective Performance
Capital Management
Prudently manage capital to balance capital strength, flexibility and efficiency:
Ordinary dividend payout ratio of 35% to 45%
Debt-to-total capital ratio of less than or equal to 15%
MCT ratio of 160% to 165%
Ordinary dividend payout ratio: 35% Debt-to-total capital ratio as at December 31, 2017: 10% MCT ratio as at December 31, 2017: 168% The Company maintained a strong and efficient capital base with an MCT ratio of approximately 168%, 11 percentage points above the internal target, an ordinary dividend payout ratio of 35% and capital flexibility through $156 million in short-term liquid investments held outside of the Insurance Subsidiary and a $200 million undrawn credit facility.
Investment Management
Optimize investment portfolio to maximize investment yield while maintaining a high quality investment portfolio to minimize the correlation of risk with our insurance in-force:
Investment income expected to be modestly higher as a result of higher average assets
The Company maintained a high quality investment portfolio, with 92% of its holdings in cash and investment grade bonds and debentures and 8% in preferred shares. Overall, the Company achieved an investment yield of 3.2% for the year. Investment income, excluding gains and losses, of $182 million in 2017 was $7 million, or 4%, higher than the prior year, primarily due to higher invested assets and higher dividend income. The net investment gains of $83 million were primarily related to an increase in the market value of the Company’s interest rate swaps used to hedge interest rate risk.
Genworth MI Canada Inc. Q4’17 MD&A
Page 12 of 55
Recent business and regulatory developments
Guideline B-20
On October 17, 2017, OSFI released the final version of Guideline B-20 “Residential Mortgage Underwriting Practices and Procedures” which sets out OSFI’s expectations for prudent residential mortgage underwriting by Federally Regulated Financial Institutions (“FRFI”). The Guideline is applicable to all federally-regulated financial institutions that are engaged in residential mortgage underwriting and/or the acquisition of residential mortgage loan assets in Canada. The Guideline, which came into effect January 1, 2018, clarifies and strengthens expectations in a number of specific areas, including;
requiring qualifying debt service ratios to be established by FRFIs
for all uninsured mortgages, at a minimum, using the greater of the five-year benchmark rate published by the Bank of Canada or the contract mortgage rate plus 2%;
requiring that loan-to-value measurements and limits remain dynamic and adjust for market conditions and be regularly monitored, reviewed and updated; and
expressly prohibiting arrangements (e.g., co-lending or bundling mortgages) that are designed, or appear to be designed, to circumvent regulatory requirements.
The B-20 Guideline does not directly impact the regulatory requirements for the Company which is governed by OSFI’s Guideline B-21 “Residential Mortgage Insurance Underwriting Practices and Procedures”. Based on an analysis of applications for portfolio insurance received in 2016 and the first half of 2017 and potential changes in borrower behavior, the Company believes that the Guideline may reduce total mortgage originations in 2018 by 5 to 10% as compared to 2017 levels. The Company believes the Guideline will not have a material impact on the transactional mortgage insurance market size in 2018, given that qualifying uninsured mortgages have been subject to a mortgage rate stress test starting November 30, 2016. Overall, it is still too early to determine the exact impact of this change and its ultimate effect on the mortgage and housing markets.
Ontario Government Fair Housing Plan
On April 20, 2017, the Ontario Government released its “Ontario’s Fair Housing Plan” which includes the introduction of a 15% Non-Resident Speculation Tax on the price of homes in the Greater Toronto Area (the “GTA”) and surrounding regions purchased by individuals who are not citizens or permanent residents of Canada or by foreign corporations. The plan consists of 16 strategies addressing housing demand including consumer protection for renters and buyers; rent control measures; expediting new housing supply; and actions to increase information sharing between governments and external stakeholders. Genworth Canada welcomes the measures aimed at addressing the affordability of homeownership and expediting access to affordable housing stock for aspiring first time homebuyers.
Price increase
The Company reviews its underwriting, pricing and risk selection strategies on an annual basis to ensure that its products remain competitive and consistent with its marketing and profitability objectives. The Company's pricing approach takes into consideration long-term historical loss experience on loans with similar loan-to-value ratios, terms and types of mortgages, borrower credit histories and capital required to support the product.
On January 17, 2017, the Company announced an increase on its transactional mortgage insurance premium rates for homebuyers effective March 17, 2017. The new pricing is a reflection of higher regulatory capital requirements that came into effect on January 1, 2017 and supports the long-term safety and sustainability of the Canadian housing finance system.

Genworth MI Canada Inc. Q4’17 MD&A
Page 13 of 55
The new premium rates on transactional new insurance written for standard owner-occupied purchase applications submitted on or after March 17, 2017 are as follows:
Transactional New Insurance Written Loan-to-Value Ratio
Standard Premium (Prior to March 17, 2017)
Standard Premium (Effective March 17, 2017)
Up to and including 65% 0.60% 0.60% Up to and including 75% 0.75% 1.70% Up to and including 80% 1.25% 2.40% Up to and including 85% 1.80% 2.80% Up to and including 90% 2.40% 3.10% Up to and including 95% 3.60% 4.00% 90.01% to 95% (Non-Traditional Payment Program)
3.85% 4.50%
The average transactional premium rate in the fourth quarter of 2017 of 348 basis points was 19% higher than the same period in the prior year. This increase contributed approximately $25 million of additional premiums written as compared to the same period in the prior year. The average transactional premium rate for 2017 of 331 basis points was 13% higher than the prior year, with this increase contributing approximately $70 million of additional premiums written as compared to the prior year. The average transactional premium rate in 2018 is expected to be 345 to 350 basis points with a full year price increase of approximately 18% to 20% as compared to 2016. Since the price increase in 2017 was in effect for only a part of the year, comparison to the 2016 price levels is more meaningful. The Company believes the new premium rates adequately reflect the increased capital requirements and allow the Company to earn the targeted operating return of equity of 13% on new transactional business over an economic cycle.
Similarly, the Company increased its premium rates for portfolio insurance as a result of the higher regulatory capital requirements that came into effect on January 1, 2017. There was a one-time increase in portfolio insurance volumes in the first quarter of 2017, as the Company closed several large transactions on portfolio insurance applications received in the fourth quarter of 2016. The portfolio insurance volumes declined significantly for the remainder of 2017 and the average premium rate increased from 36 basis points in the first quarter of 2017 to 81 basis points in the fourth quarter of 2017.
Changes to the mortgage insurance rules
Applying a Mortgage Rate Stress Test to All Insured Mortgages Effective October 17, 2016, all insured homebuyers must qualify for mortgage insurance at an interest rate that is the greater of their contract mortgage rate or the Bank of Canada's conventional five-year fixed posted rate, which is currently 5.14% as at February 5, 2018. These changes came into effect on November 30, 2016 for insured mortgages with a loan-to-value ratio less than or equal to 80%. This requirement was already in place for high loan-to-value ratio insured mortgages with variable interest rates or fixed interest rates with terms less than five years. To qualify for mortgage insurance, borrower debt-servicing ratios cannot exceed the maximum allowable levels of 39% and 44%, for gross debt service ratio and total debt service ratio, respectively. Changes to Low-Ratio Mortgage Insurance Eligibility Requirements In addition to the qualifying rate changes, effective November 30, 2016, for insured mortgages with a loan-to-value ratio less than or equal to 80%, the following mortgage insurance criteria applies to both transactional mortgage insurance loans and portfolio mortgage insurance loans:
1. A loan whose purpose includes the purchase of a property or subsequent renewal of such a loan; 2. A maximum amortization length of 25 years commencing from when the loan was originally made; 3. A property value below $1 million; 4. For variable-rate loans that allow fluctuations in the amortization period, loan payments that are recalculated at least once
every five years to conform to the established amortization schedule; 5. A minimum credit score of 600 at the time the loan is approved; 6. A maximum gross debt service ratio of 39% and a maximum total debt service ratio of 44% at the time the loan is approved,
calculated by applying the greater of the mortgage contract rate or the Bank of Canada conventional five-year fixed posted mortgage interest rate; and
Genworth MI Canada Inc. Q4’17 MD&A
Page 14 of 55
7. If the property is a single unit, it must be owner-occupied. Impact of Changes Related to Mortgage Rate Stress Tests and Low-Ratio Mortgage Insurance Eligibility Requirements
Based on the Company’s review of the mortgage insurance eligibility rule changes announced October 3, 2016, it expected the transactional market size and its transactional new insurance written in 2017 to decline by approximately 15% to 25%, reflecting changes to borrower home buying patterns, including the purchase of lower-priced properties and/or larger down payments. The Company experienced a 20% decline in applications for 2017 compared to the prior year. In addition, the Company believes the market size declined by approximately 15% to 20% for 2017 compared to the prior year. New insurance written from transactional insurance was $18.2 billion, a decrease of $3.0 billion, or 14%, compared to the prior year.
The new mortgage rules prohibit insuring low loan-to-value refinances and most investor mortgages originated by lenders on or after November 30, 2016. In addition, the higher portfolio insurance premium rates as a result of higher regulatory capital requirements significantly reduced demand. New insurance written from portfolio insurance on low loan-to-value mortgages was $13.4 billion, a decrease of $28.5 billion compared to the prior year, the size of which exceeded the expected impact of the product restrictions.
Consultation on Lender Risk Sharing
On October 21, 2016, the federal government launched a public consultation on a policy option that would require mortgage lenders to manage a portion of loan losses on insured mortgages that default, known as “lender risk sharing”. This could transfer some risk borne by mortgage insurers to lenders. The comment period for this consultation ended on February 28, 2017 and the Company participated in the consultation. Although the examination of lender risk sharing continues, the Company believes it is premature to determine the potential impact of this process and its ultimate outcome.
Changes to the regulatory capital framework
On January 1, 2017, the capital advisory titled “Capital Requirements for Federally Regulated Mortgage Insurers” came into effect, replacing OSFI’s advisory, “Interim Capital Requirements for Mortgage Insurance Companies”, which had been in place since January 2015. This advisory provides a new standard framework for determining the capital requirements for residential mortgage insurance companies. The new framework is more risk sensitive and incorporates additional risk attributes, including credit score, remaining amortization and outstanding loan balance. The advisory focuses on capital requirements for insurance risk, which consists primarily of:
i. A base requirement that applies to all insured mortgages at all times; plus
ii. A supplementary requirement that applies only to mortgages originated during periods when the housing market for the region that corresponds to the mortgage has a house price-to-income ratio that exceeds a specified threshold (with this supplementary requirement not applying to mortgages insured prior to January 1, 2017); less
iii. Premium liabilities, consisting of unearned premiums reserve and the reserve for incurred but not reported (IBNR) claims. The advisory states that:
i. By using outstanding loan balance as the exposure measure, a mortgage’s actual pay down rate is captured and capital is only held against insured mortgages that are still outstanding;
ii. By using a modified loan-to-value ratio (outstanding loan balance/original property value), the borrower’s equity position in the property is better captured;
iii. Differentiating requirements by borrower credit score ensures that more capital is held for borrowers who have a greater risk of default; and
iv. Differentiating requirements by remaining amortization recognizes the importance of the expected future pay-down rate and progression of the borrower’s equity position.
Supplementary capital will be tied to the behaviour of property prices, both in terms of recent housing price trends and the behaviour of housing prices relative to household incomes. The Supplementary Capital Requirement Indicators (“SCRIs”), based primarily on the ratio of the Teranet – National Bank House Price IndexTM (“Teranet Index”) for a metropolitan area to the national per capita income, is compared to a prescribed threshold value for that particular area. For a mortgage loan originated in any period

Genworth MI Canada Inc. Q4’17 MD&A
Page 15 of 55
after January 1, 2017, where the SCRI exceeds the threshold value for a metropolitan area, supplementary capital applies for the life of that mortgage. SCRI thresholds are calculated on a one quarter lag based on availability of national household disposable income.
The Company has observed that Calgary, Edmonton, Hamilton, Toronto, Vancouver, and Victoria are breaching their SCRI thresholds, as prescribed by OSFI, at the end of the fourth quarter of 2017. These metropolitan areas represented approximately 35% of transactional new insurance written in the fourth quarter of 2017.
The advisory also includes a phase-in period to allow for a smooth transition to the new standard framework. For the segments of Genworth Canada’s insurance in-force listed below, these transitional arrangements will keep the required capital unchanged using the 2016 MCT guideline level at 220% MCT ratio at December 31, 2016 until such time as the required capital under the new standard framework at the OSFI Supervisory MCT target of 150% is less than the aforementioned required capital. The segments subject to this transitional arrangement are as follows:
Transactional insured mortgages originated prior to December 31, 2016 with original amortizations greater than 25 years; and
Portfolio insured mortgages for which the application for portfolio insurance was received prior to December 31, 2016 and the effective date of insurance is prior to March 31, 2017.
Additionally, the advisory provides for a three year phase-in period of the rising impact on capital required for operational risk. It is important to note that further changes to the new standard framework may be made by OSFI as a result of comments and input it receives. The Company continues to work with OSFI to further refine this new standard framework in specific areas, including the proposed, but deferred, requirement to update credit scores during the life of a loan. Under the new capital framework, the OSFI Supervisory MCT Target is 150% and the minimum MCT under PRMHIA is 150%.
Financial strength ratings
On July 21, 2017, DBRS confirmed the Insurance Subsidiary’s AA financial strength rating and the Company’s A (high) rating with stable trends citing “the Company’s solid market position, high-quality insurance portfolio and advanced risk analytics, as well as its strong capital position relative to the capital required to meet insurance claims obligations.” 1 On August 15, 2017, S&P affirmed the Insurance Subsidiary’s A+ rating with a stable outlook and the Company’s BBB+ rating with a stable outlook. S&P noted that the Company had a strong competitive position, low industry risk due to the Company's strong portfolio quality, tight regulation, extremely strong earnings and capitalization and adequate financial flexibility with a moderate risk due to monoline focus in a sector prone to capital and earnings volatility.
Credit Facility
On September 29, 2017, the Company entered into a $200 million senior unsecured revolving syndicated credit facility, which matures on September 29, 2022. Any borrowings under the syndicated credit facility will either be discounted at a rate per annum equal to either a one, two, three or six month (as selected by the Company from time to time) banker’s acceptance discount rate or will bear interest at a variable rate based on a spread over the agent bank’s prime rate. The Company also pays a standby fee based on the unused amount of the commitment which is recorded in interest expense in the consolidated statements of income. The syndicated credit facility includes customary representations, warranties, covenants, terms and conditions for transactions of this type. This syndicated credit facility replaced an existing $100 million previous unsecured revolving credit facility which was cancelled on September 29, 2017. As at December 31, 2017 there was no amount outstanding under the credit facility and all of the covenants were met.
1 DBRS August 18, 2017 press release: DBRS Confirms Ratings on Genworth Financial Mortgage Insurance Co. Canada at AA and Genworth MI Canada Inc. at A (high), stable trends.
Genworth MI Canada Inc. Q4’17 MD&A
Page 16 of 55
Dividends
On November 30, 2017, the Company paid a quarterly dividend of $0.47 per common share.
Share repurchase
In the year ended December 31, 2017, the Company received approval by the Toronto Stock Exchange for the Company to undertake a normal course issuer bid (“NCIB”). Pursuant to the NCIB, the Company can purchase, for cancellation, up to 4,597,385 shares representing approximately 5% of its outstanding common shares. Purchases of common shares under the NCIB may commence on or after May 5, 2017 and will conclude on the earlier of May 4, 2018 and the date on which the Company has purchased the maximum number of shares under the NCIB.
There were no shares repurchased in the three months ended December 31, 2017. During 2017, under the terms of the NCIB, the Company purchased 1,114,260 of its own common shares for cancellation, for an aggregate purchase price of $40 million. The Company’s majority shareholder, Genworth Financial Inc., through its subsidiaries, participated proportionately in the share purchase transaction.
Own Risk and Solvency Assessment (“ORSA”)
On July 14, 2017, OSFI released for public consultation revised versions of Guideline E-19: Own Risk and Solvency Assessment (“ORSA”) and the ORSA Key Metrics Report which provides a summary of the results of the insurer's ORSA process for determining own capital needs and internal targets, per OSFI’s expectations outlined in Guideline E-19. The comment period for the draft ended on August 17, 2017. The Company does not foresee any material impact from the revised versions that went into effect on January 1, 2018.
Maximum outstanding insured exposure for all private insured mortgages
The Company estimates that its outstanding insured mortgage balances as at December 31, 2017 was $218 billion, or 44% of the original insured amount. The maximum outstanding insured exposure for all private insured mortgages permitted by PRMHIA is $350 billion. The outstanding insured mortgage balances for all privately insured mortgages was estimated at $288 billion as at September 30, 2017.
Genworth Financial, Inc. transaction
On October 21, 2016, Genworth Financial, Inc. (“Genworth Financial”) entered into an agreement and plan of merger (the “Merger Agreement”) with Asia Pacific Global Capital Co., Ltd. (“the Parent”), a limited liability company incorporated in the People’s Republic of China, and Asia Pacific Global Capital USA Corporation (“Merger Sub”), a Delaware corporation and an indirect, wholly-owned subsidiary of the Parent. Subject to the terms and conditions of the Merger Agreement, including the satisfaction or waiver of certain conditions, Merger Sub would merge with and into Genworth Financial with Genworth Financial surviving the merger as an indirect, wholly-owned subsidiary of the Parent. The Parent is a newly formed subsidiary of China Oceanwide Holdings Group Co., Ltd. (together with its affiliates, “China Oceanwide”).
At a special meeting held on March 7, 2017, Genworth Financial’s stockholders voted on and approved a proposal to adopt the Merger Agreement. The transaction remains subject to closing conditions, including the receipt of required regulatory approvals in the U.S., China, and other international jurisdictions. Requisite regulatory approvals include that of the Committee on Foreign Investment in the United States (“CFIUS”). On November 29, 2017, Genworth Financial, the Parent and Merger Sub entered into a Waiver and Agreement pursuant to which Genworth Financial and the Parent each agreed to waive until April 1, 2018, its right to terminate the Merger Agreement and abandon the merger in accordance with the terms of the Merger Agreement due to a failure of the merger to have been completed on or before August 31, 2017. This was the second waiver and agreement extension, which extended the previous deadline of November 30, 2017, and allows additional time for regulatory reviews of the transaction. Due to the delay in the timing of the closing of the transaction, Genworth Financial is currently pursuing a secured indebtedness transaction to address upcoming debt maturities.
Genworth MI Canada Inc. Q4’17 MD&A
Page 17 of 55
Economic environment
The mortgage insurance business is influenced by macroeconomic conditions. Specifically, the level of premiums written is influenced by economic growth, interest rates, unemployment, housing activity, home prices and government policy among other factors. Losses on claims are primarily impacted by unemployment rates, home prices and housing activity.
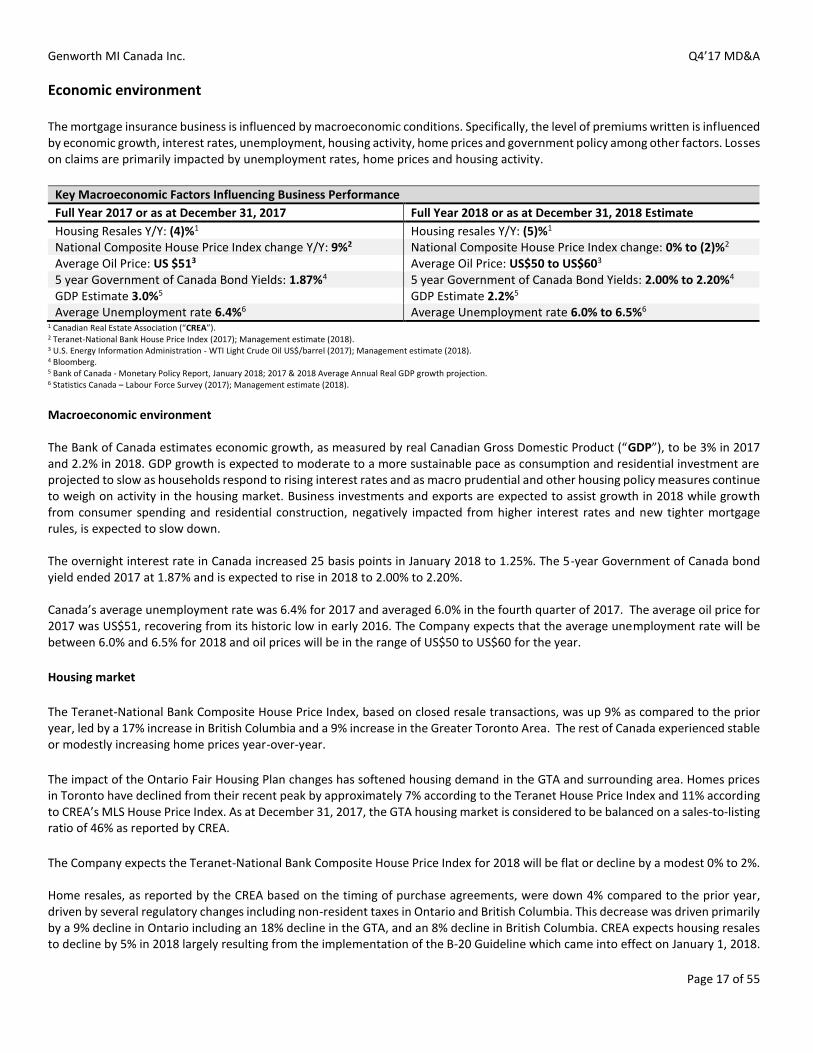
Key Macroeconomic Factors Influencing Business Performance
Full Year 2017 or as at December 31, 2017 Full Year 2018 or as at December 31, 2018 Estimate
Housing Resales Y/Y: (4)%1 Housing resales Y/Y: (5)%1
National Composite House Price Index change Y/Y: 9%2 National Composite House Price Index change: 0% to (2)%2
Average Oil Price: US $513 Average Oil Price: US$50 to US$603
5 year Government of Canada Bond Yields: 1.87%4 5 year Government of Canada Bond Yields: 2.00% to 2.20%4
GDP Estimate 3.0%5 GDP Estimate 2.2%5 Average Unemployment rate 6.4%6 Average Unemployment rate 6.0% to 6.5%6
1 Canadian Real Estate Association (“CREA”). 2 Teranet-National Bank House Price Index (2017); Management estimate (2018). 3 U.S. Energy Information Administration - WTI Light Crude Oil US$/barrel (2017); Management estimate (2018). 4 Bloomberg. 5 Bank of Canada - Monetary Policy Report, January 2018; 2017 & 2018 Average Annual Real GDP growth projection. 6 Statistics Canada – Labour Force Survey (2017); Management estimate (2018). Macroeconomic environment The Bank of Canada estimates economic growth, as measured by real Canadian Gross Domestic Product (“GDP”), to be 3% in 2017 and 2.2% in 2018. GDP growth is expected to moderate to a more sustainable pace as consumption and residential investment are projected to slow as households respond to rising interest rates and as macro prudential and other housing policy measures continue to weigh on activity in the housing market. Business investments and exports are expected to assist growth in 2018 while growth from consumer spending and residential construction, negatively impacted from higher interest rates and new tighter mortgage rules, is expected to slow down. The overnight interest rate in Canada increased 25 basis points in January 2018 to 1.25%. The 5-year Government of Canada bond yield ended 2017 at 1.87% and is expected to rise in 2018 to 2.00% to 2.20%. Canada’s average unemployment rate was 6.4% for 2017 and averaged 6.0% in the fourth quarter of 2017. The average oil price for 2017 was US$51, recovering from its historic low in early 2016. The Company expects that the average unemployment rate will be between 6.0% and 6.5% for 2018 and oil prices will be in the range of US$50 to US$60 for the year.
Housing market
The Teranet-National Bank Composite House Price Index, based on closed resale transactions, was up 9% as compared to the prior year, led by a 17% increase in British Columbia and a 9% increase in the Greater Toronto Area. The rest of Canada experienced stable or modestly increasing home prices year-over-year.
The impact of the Ontario Fair Housing Plan changes has softened housing demand in the GTA and surrounding area. Homes prices in Toronto have declined from their recent peak by approximately 7% according to the Teranet House Price Index and 11% according to CREA’s MLS House Price Index. As at December 31, 2017, the GTA housing market is considered to be balanced on a sales-to-listing ratio of 46% as reported by CREA.
The Company expects the Teranet-National Bank Composite House Price Index for 2018 will be flat or decline by a modest 0% to 2%. Home resales, as reported by the CREA based on the timing of purchase agreements, were down 4% compared to the prior year, driven by several regulatory changes including non-resident taxes in Ontario and British Columbia. This decrease was driven primarily by a 9% decline in Ontario including an 18% decline in the GTA, and an 8% decline in British Columbia. CREA expects housing resales to decline by 5% in 2018 largely resulting from the implementation of the B-20 Guideline which came into effect on January 1, 2018.
Genworth MI Canada Inc. Q4’17 MD&A
Page 18 of 55
2018 objectives
In pursuit of being Canada’s mortgage insurer of choice, the Company seeks to enhance stakeholder value through working with its lender partners, regulators and influencers to:
• Maintain strong claim paying ability and financial strength; • Help Canadians responsibly achieve and maintain homeownership; • Promote strong and sustainable communities across Canada; and • Advance prudent risk management practices to enhance the safety and soundness of the mortgage finance system.
The Company’s long term objective is to enhance shareholder value by achieving a return on equity that exceeds its cost of capital and by increasing net income over time. The Company’s priorities to achieve its long-term objective are identified below:
2018 Objectives
Premiums Written and Premiums Earned
Modestly higher premiums written:
The Company expects modestly higher transactional new insurance written in 2018 compared to the prior year due to a modest increase in market share in a flat to modestly larger transactional insurance market. The expected increase in the transactional insurance market size is primarily due to an improvement in the first time homebuyer participation rate, partially offset by the impact of reduced housing affordability related to an expected increase in interest rates.
Transactional premiums written are expected to be moderately higher primarily as a result of the impact of a full year average transactional premium rate of approximately 345 to 350 basis points for 2018 as compared to 331 basis points for 2017 and higher new insurance written.
Portfolio insurance new insurance written is expected to be lower in 2018 compared to 2017 in line with the recent volume trend of approximately $1 billion in each of the third and fourth quarters of 2017. This is due to reduced demand in response to the significant increase in premium rates in response to the new capital framework that took effect on January 1, 2017.
Portfolio insurance premiums written are expected to be lower as a result of the lower volume of new insurance written, partially offset by a higher average premium rate of approximately 70 to 80 basis points assuming a similar loan-to-value mix. The average premium rate in the fourth quarter of 2017 was 81 basis points.
Premiums earned relatively unchanged due to lower premiums written in 2017:
The Company expects premiums earned to remain relatively flat or increase modestly from the prior year as premiums earned contributions from the relatively higher premiums written in 2015 and 2016 will be offset by the lower contribution from the relatively smaller 2017 book of business. The unearned premiums reserve of $2.1 billion as at December 31, 2017 is expected to contribute between $620 and $630 million, in addition to premiums earned from premiums written in 2018. Given the single upfront premium model, the Company is generally able to reliably estimate the proportion of unearned premiums that will be earned into revenues as premiums earned as long as there are no significant changes to the Company’s current premiums recognition curve.
Losses on Claims
Proactive risk management and focused loss mitigation strategies:
The Company expects a loss ratio range of 15% to 25% in 2018 as the loss ratio is expected to normalize towards more sustainable levels from the relatively low loss ratio of 10% experienced in 2017. Based on the consensus economic forecast, the Company expects relatively stable economic conditions in Canada and the strong credit quality of the insurance portfolio will favorably influence losses on claims.
The Company expects a workout penetration rate of 55% or greater.
Portfolio Quality and Risk Management
Maintain a high quality insurance portfolio through prudent underwriting guidelines, proactive risk management and disciplined underwriting:
Average transactional credit score of greater than 730
Average transactional credit score below 660 of less than 5%

Genworth MI Canada Inc. Q4’17 MD&A
Page 19 of 55
Capital Management
Prudently manage capital to balance capital strength, flexibility and efficiency:
Ordinary dividend payout ratio of 35% to 45%
Debt-to-total capital ratio of less than or equal to 15%
MCT ratio expected to remain above the targeted operating range of 160% to 165% as the Company is expected to continue to benefit from the transitional relief provisions related to the new regulatory capital framework implemented in 2017
Holding Company cash and liquid investments greater than or equal to $100 million
Investment Management
Optimize investment portfolio to maximize investment yield while maintaining a high quality investment portfolio to minimize the correlation of risk with our insurance in-force:
Investment income expected to be moderately higher inclusive of favorable new cash flows from the $3.5 billion portfolio of fixed for floating interest rate swaps used to hedge interest rate risk. Under this hedging program, the Company pays a fixed rate that averages 117 basis points and receives the 90 day Canadian Deposit Overnight Rate (“CDOR”) which is currently 168 basis points2
2 Bloomberg as at February 2, 2018
Genworth MI Canada Inc. Q4’17 MD&A
Page 20 of 55
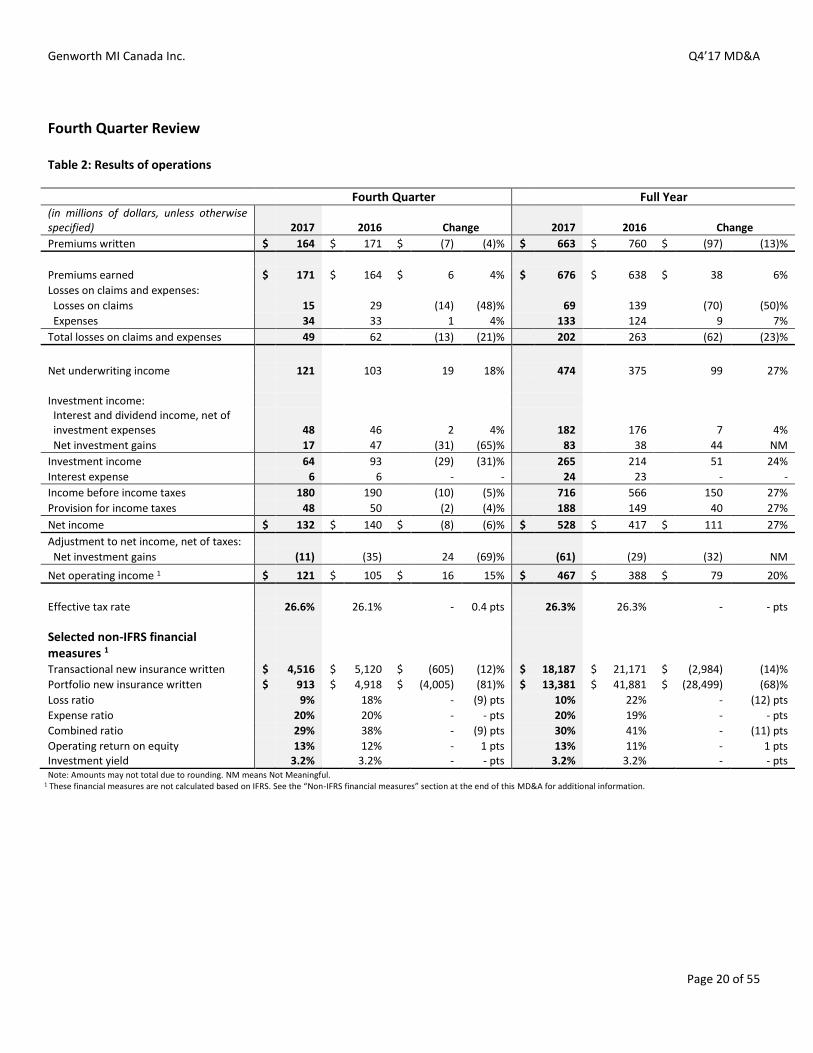
Fourth Quarter Review
Table 2: Results of operations
Fourth Quarter Full Year (in millions of dollars, unless otherwise specified) 2017 2016 Change 2017 2016 Change
Premiums written $ 164 $ 171 $ (7) (4)% $ 663 $ 760 $ (97) (13)%
Premiums earned $ 171 $ 164 $ 6 4% $ 676 $ 638 $ 38 6%
Losses on claims and expenses: Losses on claims 15 29 (14) (48)% 69 139 (70) (50)%
Expenses 34 33 1 4% 133 124 9 7%
Total losses on claims and expenses 49 62 (13) (21)% 202 263 (62) (23)%
Net underwriting income 121 103 19 18% 474 375 99 27%
Investment income: Interest and dividend income, net of investment expenses 48 46 2 4% 182 176 7 4%
Net investment gains 17 47 (31) (65)% 83 38 44 NM
Investment income 64 93 (29) (31)% 265 214 51 24%
Interest expense 6 6 - - 24 23 - -
Income before income taxes 180 190 (10) (5)% 716 566 150 27%
Provision for income taxes 48 50 (2) (4)% 188 149 40 27%
Net income $ 132 $ 140 $ (8) (6)% $ 528 $ 417 $ 111 27%
Adjustment to net income, net of taxes: Net investment gains (11) (35) 24 (69)% (61) (29) (32) NM
Net operating income 1 $ 121 $ 105 $ 16 15% $ 467 $ 388 $ 79 20%
Effective tax rate 26.6% 26.1% - 0.4 pts 26.3% 26.3% - - pts
Selected non-IFRS financial measures 1 Transactional new insurance written $ 4,516 $ 5,120 $ (605) (12)% $ 18,187 $ 21,171 $ (2,984) (14)%
Portfolio new insurance written $ 913 $ 4,918 $ (4,005) (81)% $ 13,381 $ 41,881 $ (28,499) (68)%
Loss ratio 9% 18% - (9) pts 10% 22% - (12) pts
Expense ratio 20% 20% - - pts 20% 19% - - pts
Combined ratio 29% 38% - (9) pts 30% 41% - (11) pts
Operating return on equity 13% 12% - 1 pts 13% 11% - 1 pts Investment yield 3.2% 3.2% - - pts 3.2% 3.2% - - pts Note: Amounts may not total due to rounding. NM means Not Meaningful.
1 These financial measures are not calculated based on IFRS. See the “Non-IFRS financial measures” section at the end of this MD&A for additional information.

Genworth MI Canada Inc. Q4’17 MD&A
Page 21 of 55
Table 3: New insurance written, premiums written and premiums earned
Fourth Quarter Full Year
(in millions of dollars, unless otherwise specified) 2017 2016 Change 2017 2016 Change
New insurance written Transactional $ 4,516 $ 5,120 $ (605) (12)% $ 18,187 $ 21,171 $ (2,984) (14)% Portfolio 913 4,918 (4,005) (81)% 13,381 41,881 (28,499) (68)%
Total $ 5,428 $ 10,038 $ (4,610) (46)% $ 31,568 $ 63,051 $ (31,483) (50)%
Premiums written
Transactional 157 149 8 5% 602 619 (17) (3)% Portfolio 7 22 (15) (67)% 60 140 (80) (57)%
Total $ 164 $ 171 $ (7) (4)% $ 663 $ 760 $ (97) (13)%
Average premium rate (in basis points)
Transactional 348 292 56 19% 331 293 39 13% Portfolio 81 45 36 80% 45 34 11 34%
Total 303 171 132 77% 210 121 89 74%
Premiums earned $ 171 $ 164 $ 6 4% $ 676 $ 638 $ 38 6%
Note: Amounts may not total due to rounding. NM means not meaningful.
Current quarter Transactional new insurance written was $4.5 billion in the fourth quarter of 2017, representing a decrease of $0.6 billion, or 12%, compared to the same quarter in the prior year. This decrease was primarily due to a smaller high loan-to-value mortgage originations market resulting primarily from the introduction of an insured mortgage rate stress test in the fourth quarter of 2016 which was partially offset by an increase in the Company’s market share. New insurance written from portfolio insurance was $0.9 billion in the fourth quarter of 2017, as compared to $4.9 billion in the same quarter in the prior year. This decrease resulted from the introduction of the 2016 government guarantee low-ratio eligibility restrictions and the substantial increase in portfolio insurance premium rates on mortgage applications received after December 31, 2016 in response to higher regulatory capital requirements under the new capital framework. Premiums written from transactional insurance were $157 million in the fourth quarter of 2017, an increase of $8 million, or 5%, compared to the same quarter in the prior year. This increase was primarily due to a 19%, or 56 basis point, increase in the average premium rate as a result of the March 17, 2017 premium rate increase, which resulted in additional premiums written of $25 million which were partially offset by a decrease of $18 million from lower transactional insurance volumes. Premiums written from portfolio insurance were $7 million in the fourth quarter of 2017, a decrease of $15 million, primarily due to a decrease in new insurance written. The average premium rate of 81 basis points in the fourth quarter of 2017 reflects an 80% increase in portfolio premium rates in response to higher regulatory capital requirements. Premiums earned increased by $6 million, or 4%, to $171 million in the fourth quarter of 2017, as compared to the same quarter in the prior year, due to the relatively larger contributions from premiums written in recent years.
Full year
Transactional new insurance written in 2017, was $18.2 billion, a decrease of $3.0 billion, or 14%, compared to the prior year. This decrease was primarily due to a smaller high loan-to-value mortgage originations market resulting primarily from the introduction of an insured mortgage rate stress test in the fourth quarter of 2016, which was partially offset by an increase in the Company’s market share. New insurance written from portfolio insurance was $13.4 billion in 2017, compared to $41.9 billion in the prior year, primarily due to a $20 billion portfolio insurance transaction with a large bank included in the prior year. Furthermore, lower demand for portfolio insurance in 2017 was the result of the introduction of the 2016 government guarantee low-ratio eligibility restrictions and the substantial increase in portfolio insurance premium rates on mortgage applications received after December 31, 2016 in response to higher regulatory capital requirements under the new capital framework.

Genworth MI Canada Inc. Q4’17 MD&A
Page 22 of 55
Premiums written from transactional insurance were $602 million in 2017, a decrease of $17 million, or 3%, compared to the prior year. This decrease was primarily due to $87 million from lower volumes of transactional insurance business which was largely offset by a 13%, or 39 basis point, increase in the average premium rate from the March 17, 2017 premium rate increase which contributed an additional $70 million of premiums written. Premiums written from portfolio insurance were $60 million in 2017, a decrease of $80 million, primarily due to the decrease in new insurance written.
Premiums earned increased by $38 million, or 6%, to $676 million in 2017, compared to the prior year due to the relatively larger contributions from premiums written in recent years.
Table 4: Losses on claims
Fourth Quarter Full Year
2017 2016 Change 2017 2016 Change
New delinquencies 984 1,228 (244) (20)% 4,170 4,940 (770) (16)% Cures 638 792 (154) (19)% 2,841 3,091 (250) (8)%
New delinquencies, net of cures 346 436 (90) (21)% 1,329 1,849 (520) (28)%
Average reserve per delinquency (in thousands of dollars) $ 69 $ 79 $ (10) (12)% $ 69 $ 79 $ (10) (12)%
Losses on claims (in millions of dollars) $ 15 $ 29 $ (14) (48)% $ 69 $ 139 $ (70) (50)% Loss ratio 9% 18% - (9) pts 10% 22% - (12)pts
Current quarter
Losses on claims of $15 million were lower by $14 million, primarily due to fewer new reported delinquencies, net of cures, lower average reserve per delinquency. Losses on claims included $16 million of favourable development from the prior quarter’s loss reserve which was relatively consistent to the favourable development in the same quarter in the prior year. This favourable loss reserve development in the current quarter was primarily due to fewer new reported delinquencies in Ontario, Alberta and Québec as compared to the incurred, but not reported, reserve as at September 30, 2017.
New reported delinquencies, net of cures, of 346 were 90 lower than in the same quarter in the prior year led by decreases in Québec (77), Ontario (35) and the Pacific region (10), consistent with strong or improving economic conditions in these regions.
The average reserve per delinquency decreased by approximately $10 thousand primarily due to strong or improving home prices in most regions and a favourable shift in regional mix due to the decrease in the number of outstanding delinquencies in Alberta and Québec, which have typically had a higher average reserve amount in recent years compared to other regions.
The resulting loss ratio was 9% in the fourth quarter of 2017, 9 percentage points lower than the same period in the prior year due to lower losses on claims and higher earned premiums.
Full year
Losses on claims of $69 million were lower by $70 million, primarily due to fewer new reported delinquencies, net of cures, lower average reserve per delinquency and $37 million of favourable development from the loss reserves as at December 31, 2016. This favourable loss reserve development was primarily due to fewer new reported delinquencies in most regions.
New reported delinquencies, net of cures, of 1,329 were 520 lower than the prior year primarily due to decreases in Alberta (193), Québec (130), Ontario (124), the Pacific region (56) and the Atlantic region (17), which was consistent with strong or improving economic conditions in these regions.

Genworth MI Canada Inc. Q4’17 MD&A
Page 23 of 55
The average reserve per delinquency decreased by approximately $10 thousand primarily due strong or improving home prices in all regions and a favourable shift in regional mix due to the decrease in the number of outstanding delinquencies in Alberta and Québec, which have typically had a higher average reserve amount in recent years compared to other regions.
The resulting loss ratio was 10% in 2017, 12 percentage points lower than the prior year due to lower losses on claims and higher earned premiums.
Table 5: Expenses
Fourth Quarter Full Year
(in millions of dollars, unless otherwise specified) 2017 2016 Change 2017 2016 Change
Expenses Premium taxes and underwriting fees $ 12 $ 13 $ (1) (6)% $ 51 $ 58 $ (8) (13)% Employee compensation 13 12 1 7% 50 49 - - Other 9 9 - - 34 30 4 12%
Expenses before net change in deferred policy acquisition costs 34 34 - - 134 138 (4) (3)% Deferral of policy acquisition costs (17) (17) 1 (3)% (68) (77) 9 (11)% Amortization of deferred policy acquisition costs 17 16 1 4% 67 63 4 6%
Total $ 34 $ 33 $ 1 4% $ 133 $ 124 $ 9 7%
Expense ratio 20% 20% - - pts 20% 19% - - pts
Note: Amounts may not total due to rounding.
Current quarter
Expenses before net change in deferred policy acquisition costs remained unchanged at $34 million in the fourth quarter of 2017 compared to the same quarter in the prior year. An increase in employee compensation, primarily due to share based compensation, of $1 million in the fourth quarter of 2017 was offset by a decrease in premiums taxes and underwriting fees, related to lower levels of premiums written. Amortization of previously deferred policy acquisition costs increased by $1 million, consistent with higher premiums earned.
Total expenses increased by $1 million and the expense ratio of 20% was relatively unchanged as compared to the same quarter in the prior year.
Full Year
Expenses before net change in deferred policy acquisition costs decreased by $4 million, or 3%, to $134 million in 2017 compared to the prior year. The decrease was primarily due to an $8 million decrease in premium taxes and underwriting fees, related to lower levels of premiums written, partially offset by a $4 million increase in other expenses primarily related to an increase in the regulatory supervisory fee. Amortization of previously deferred policy acquisition costs increased by $4 million consistent with higher premiums earned.
Total expenses increased by $9 million and the expense ratio of 20% was relatively unchanged compared to the prior year.
Genworth MI Canada Inc. Q4’17 MD&A
Page 24 of 55
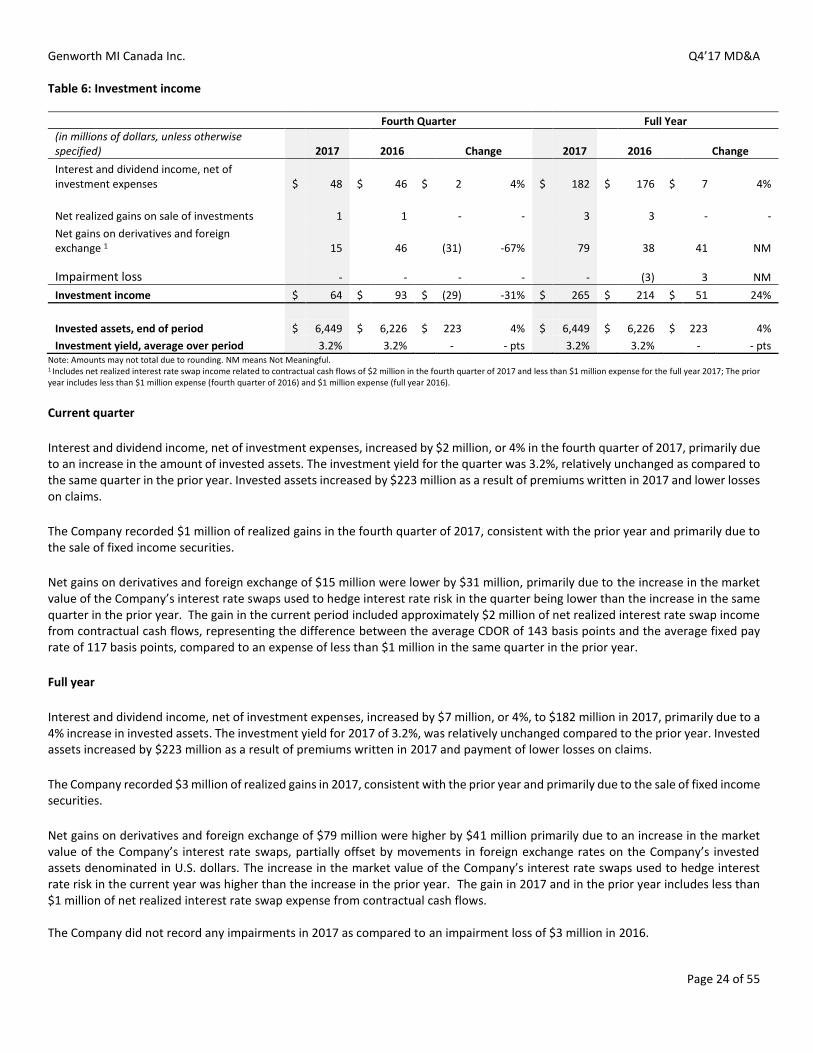
Table 6: Investment income
Fourth Quarter Full Year
(in millions of dollars, unless otherwise specified) 2017 2016 Change 2017 2016 Change
Interest and dividend income, net of investment expenses $ 48 $ 46 $ 2 4% $ 182 $ 176 $ 7 4%
Net realized gains on sale of investments 1 1 - - 3 3 - -
Net gains on derivatives and foreign exchange 1 15 46 (31) -67% 79 38 41 NM
Impairment loss - - - - - (3)
3 NM
Investment income $ 64 $ 93 $ (29) -31% $ 265 $ 214 $ 51 24%
Invested assets, end of period $ 6,449 $ 6,226 $ 223 4% $ 6,449 $ 6,226 $ 223 4%
Investment yield, average over period 3.2% 3.2% - - pts 3.2% 3.2% - - pts Note: Amounts may not total due to rounding. NM means Not Meaningful. 1 Includes net realized interest rate swap income related to contractual cash flows of $2 million in the fourth quarter of 2017 and less than $1 million expense for the full year 2017; The prior year includes less than $1 million expense (fourth quarter of 2016) and $1 million expense (full year 2016). Current quarter
Interest and dividend income, net of investment expenses, increased by $2 million, or 4% in the fourth quarter of 2017, primarily due to an increase in the amount of invested assets. The investment yield for the quarter was 3.2%, relatively unchanged as compared to the same quarter in the prior year. Invested assets increased by $223 million as a result of premiums written in 2017 and lower losses on claims.
The Company recorded $1 million of realized gains in the fourth quarter of 2017, consistent with the prior year and primarily due to the sale of fixed income securities.
Net gains on derivatives and foreign exchange of $15 million were lower by $31 million, primarily due to the increase in the market value of the Company’s interest rate swaps used to hedge interest rate risk in the quarter being lower than the increase in the same quarter in the prior year. The gain in the current period included approximately $2 million of net realized interest rate swap income from contractual cash flows, representing the difference between the average CDOR of 143 basis points and the average fixed pay rate of 117 basis points, compared to an expense of less than $1 million in the same quarter in the prior year.
Full year
Interest and dividend income, net of investment expenses, increased by $7 million, or 4%, to $182 million in 2017, primarily due to a 4% increase in invested assets. The investment yield for 2017 of 3.2%, was relatively unchanged compared to the prior year. Invested assets increased by $223 million as a result of premiums written in 2017 and payment of lower losses on claims.
The Company recorded $3 million of realized gains in 2017, consistent with the prior year and primarily due to the sale of fixed income securities.
Net gains on derivatives and foreign exchange of $79 million were higher by $41 million primarily due to an increase in the market value of the Company’s interest rate swaps, partially offset by movements in foreign exchange rates on the Company’s invested assets denominated in U.S. dollars. The increase in the market value of the Company’s interest rate swaps used to hedge interest rate risk in the current year was higher than the increase in the prior year. The gain in 2017 and in the prior year includes less than $1 million of net realized interest rate swap expense from contractual cash flows.
The Company did not record any impairments in 2017 as compared to an impairment loss of $3 million in 2016.
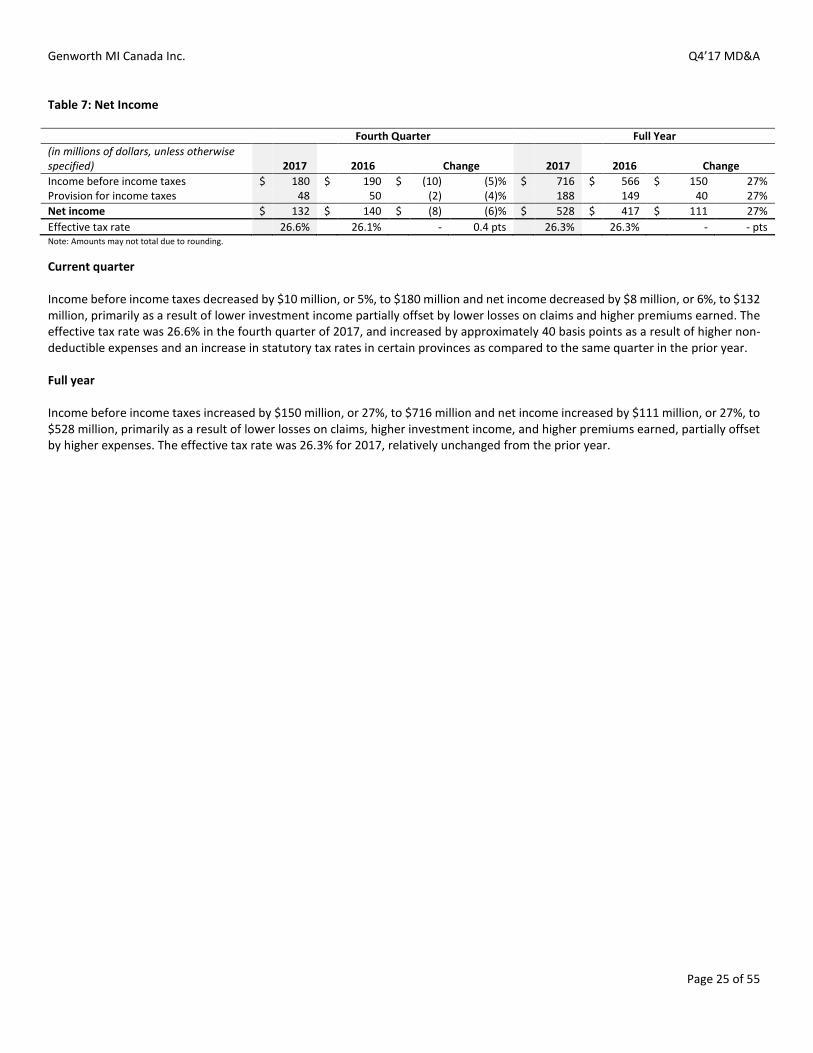
Genworth MI Canada Inc. Q4’17 MD&A
Page 25 of 55
Table 7: Net Income
Fourth Quarter Full Year
(in millions of dollars, unless otherwise specified) 2017 2016 Change 2017 2016 Change
Income before income taxes $ 180 $ 190 $ (10) (5)% $ 716 $ 566 $ 150 27% Provision for income taxes 48 50 (2) (4)% 188 149 40 27%
Net income $ 132 $ 140 $ (8) (6)% $ 528 $ 417 $ 111 27%
Effective tax rate 26.6% 26.1% - 0.4 pts 26.3% 26.3% - - pts Note: Amounts may not total due to rounding.
Current quarter Income before income taxes decreased by $10 million, or 5%, to $180 million and net income decreased by $8 million, or 6%, to $132 million, primarily as a result of lower investment income partially offset by lower losses on claims and higher premiums earned. The effective tax rate was 26.6% in the fourth quarter of 2017, and increased by approximately 40 basis points as a result of higher non-deductible expenses and an increase in statutory tax rates in certain provinces as compared to the same quarter in the prior year. Full year Income before income taxes increased by $150 million, or 27%, to $716 million and net income increased by $111 million, or 27%, to $528 million, primarily as a result of lower losses on claims, higher investment income, and higher premiums earned, partially offset by higher expenses. The effective tax rate was 26.3% for 2017, relatively unchanged from the prior year.

Genworth MI Canada Inc. Q4’17 MD&A
Page 26 of 55
Summary of annual information
Table 8 presents select income statement line items and certain key performance indicators for the last three years.
Table 8: Summary of Annual Information
(in millions of dollars, unless otherwise specified) 2017 2016 2015
Premiums written $ 663 $ 760 $ 809
Premiums earned 676 638 586
Losses on claims 69 139 122
Expenses 133 124 108
Net underwriting income 474 375 356
Investment income 265 214 201
Net income $ 528 $ 417 $ 398
Adjustment to net income net of taxes:
Net investment gains (61) (29) (23)
Net operating income1 $ 467 $ 388 $ 375
Earnings per common share:
Earnings per common share (basic) $5.76 $4.54 $4.32
Earnings per common share (diluted)2 $5.76 $4.54 $4.22
Selected non-IFRS financial measures1
Loss ratio 10% 22% 21%
Expense ratio 20% 19% 18%
Combined ratio 30% 41% 39%
Operating earnings per common share (basic) $5.10 $4.23 $4.07
Operating earnings per common share (diluted)2 $5.09 $4.23 $4.05
Operating return on equity 13% 11% 12% Note: Amounts may not total due to rounding 1The financial measures are not calculated based on IFRS. See the “Non-IFRS financial measures” section at the end of this MD&A for additional information. 2The difference between basic and diluted earnings per common share and basic and diluted operating earnings per common share is caused by the potentially dilutive impact of share-based compensation awards.
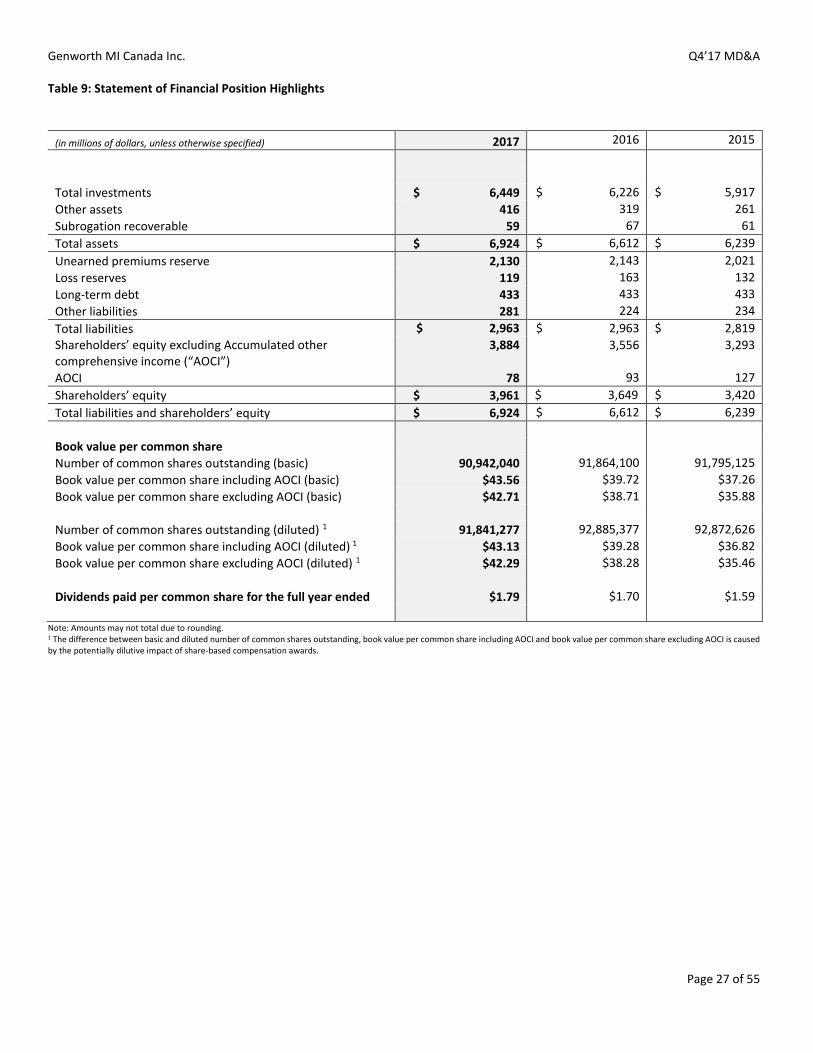
Genworth MI Canada Inc. Q4’17 MD&A
Page 27 of 55
Table 9: Statement of Financial Position Highlights
(in millions of dollars, unless otherwise specified) 2017 2016 2015
Total investments $ 6,449 $ 6,226 $ 5,917
Other assets 416 319 261
Subrogation recoverable 59 67 61
Total assets $ 6,924 $ 6,612 $ 6,239
Unearned premiums reserve 2,130 2,143 2,021
Loss reserves 119 163 132
Long-term debt 433 433 433
Other liabilities 281 224 234
Total liabilities $ 2,963 $ 2,963 $ 2,819
Shareholders’ equity excluding Accumulated other comprehensive income (“AOCI”)
3,884 3,556 3,293
AOCI 78 93 127
Shareholders’ equity $ 3,961 $ 3,649 $ 3,420
Total liabilities and shareholders’ equity $ 6,924 $ 6,612 $ 6,239
Book value per common share
Number of common shares outstanding (basic) 90,942,040 91,864,100 91,795,125
Book value per common share including AOCI (basic) $43.56 $39.72 $37.26
Book value per common share excluding AOCI (basic) $42.71 $38.71 $35.88
Number of common shares outstanding (diluted) 1 91,841,277 92,885,377 92,872,626
Book value per common share including AOCI (diluted) 1 $43.13 $39.28 $36.82
Book value per common share excluding AOCI (diluted) 1 $42.29 $38.28 $35.46
Dividends paid per common share for the full year ended $1.79 $1.70 $1.59
Note: Amounts may not total due to rounding. 1 The difference between basic and diluted number of common shares outstanding, book value per common share including AOCI and book value per common share excluding AOCI is caused by the potentially dilutive impact of share-based compensation awards.
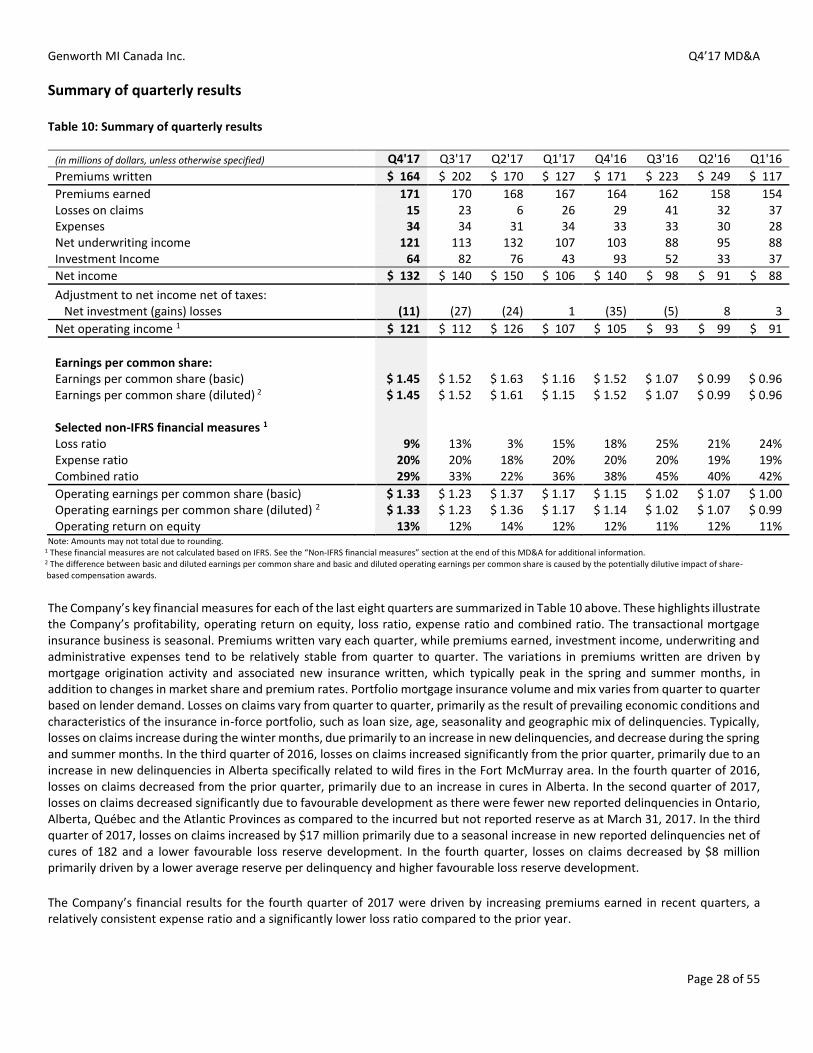
Genworth MI Canada Inc. Q4’17 MD&A
Page 28 of 55
Summary of quarterly results
Table 10: Summary of quarterly results
(in millions of dollars, unless otherwise specified) Q4'17 Q3'17 Q2'17 Q1'17 Q4'16 Q3'16 Q2'16 Q1'16
Premiums written $ 164 $ 202 $ 170 $ 127 $ 171 $ 223 $ 249 $ 117
Premiums earned 171 170 168 167 164 162 158 154 Losses on claims 15 23 6 26 29 41 32 37 Expenses 34 34 31 34 33 33 30 28 Net underwriting income 121 113 132 107 103 88 95 88 Investment Income 64 82 76 43 93 52 33 37
Net income $ 132 $ 140 $ 150 $ 106 $ 140 $ 98 $ 91 $ 88
Adjustment to net income net of taxes: Net investment (gains) losses (11) (27) (24) 1 (35) (5) 8 3
Net operating income 1 $ 121 $ 112 $ 126 $ 107 $ 105 $ 93 $ 99 $ 91
Earnings per common share: Earnings per common share (basic) $ 1.45 $ 1.52 $ 1.63 $ 1.16 $ 1.52 $ 1.07 $ 0.99 $ 0.96 Earnings per common share (diluted) 2 $ 1.45 $ 1.52 $ 1.61 $ 1.15 $ 1.52 $ 1.07 $ 0.99 $ 0.96
Selected non-IFRS financial measures 1 Loss ratio 9% 13% 3% 15% 18% 25% 21% 24% Expense ratio 20% 20% 18% 20% 20% 20% 19% 19% Combined ratio 29% 33% 22% 36% 38% 45% 40% 42%
Operating earnings per common share (basic) $ 1.33 $ 1.23 $ 1.37 $ 1.17 $ 1.15 $ 1.02 $ 1.07 $ 1.00 Operating earnings per common share (diluted) 2 $ 1.33 $ 1.23 $ 1.36 $ 1.17 $ 1.14 $ 1.02 $ 1.07 $ 0.99 Operating return on equity 13% 12% 14% 12% 12% 11% 12% 11%
Note: Amounts may not total due to rounding. 1 These financial measures are not calculated based on IFRS. See the “Non-IFRS financial measures” section at the end of this MD&A for additional information. 2 The difference between basic and diluted earnings per common share and basic and diluted operating earnings per common share is caused by the potentially dilutive impact of share- based compensation awards.
The Company’s key financial measures for each of the last eight quarters are summarized in Table 10 above. These highlights illustrate the Company’s profitability, operating return on equity, loss ratio, expense ratio and combined ratio. The transactional mortgage insurance business is seasonal. Premiums written vary each quarter, while premiums earned, investment income, underwriting and administrative expenses tend to be relatively stable from quarter to quarter. The variations in premiums written are driven by mortgage origination activity and associated new insurance written, which typically peak in the spring and summer months, in addition to changes in market share and premium rates. Portfolio mortgage insurance volume and mix varies from quarter to quarter based on lender demand. Losses on claims vary from quarter to quarter, primarily as the result of prevailing economic conditions and characteristics of the insurance in-force portfolio, such as loan size, age, seasonality and geographic mix of delinquencies. Typically, losses on claims increase during the winter months, due primarily to an increase in new delinquencies, and decrease during the spring and summer months. In the third quarter of 2016, losses on claims increased significantly from the prior quarter, primarily due to an increase in new delinquencies in Alberta specifically related to wild fires in the Fort McMurray area. In the fourth quarter of 2016, losses on claims decreased from the prior quarter, primarily due to an increase in cures in Alberta. In the second quarter of 2017, losses on claims decreased significantly due to favourable development as there were fewer new reported delinquencies in Ontario, Alberta, Québec and the Atlantic Provinces as compared to the incurred but not reported reserve as at March 31, 2017. In the third quarter of 2017, losses on claims increased by $17 million primarily due to a seasonal increase in new reported delinquencies net of cures of 182 and a lower favourable loss reserve development. In the fourth quarter, losses on claims decreased by $8 million primarily driven by a lower average reserve per delinquency and higher favourable loss reserve development.
The Company’s financial results for the fourth quarter of 2017 were driven by increasing premiums earned in recent quarters, a relatively consistent expense ratio and a significantly lower loss ratio compared to the prior year.
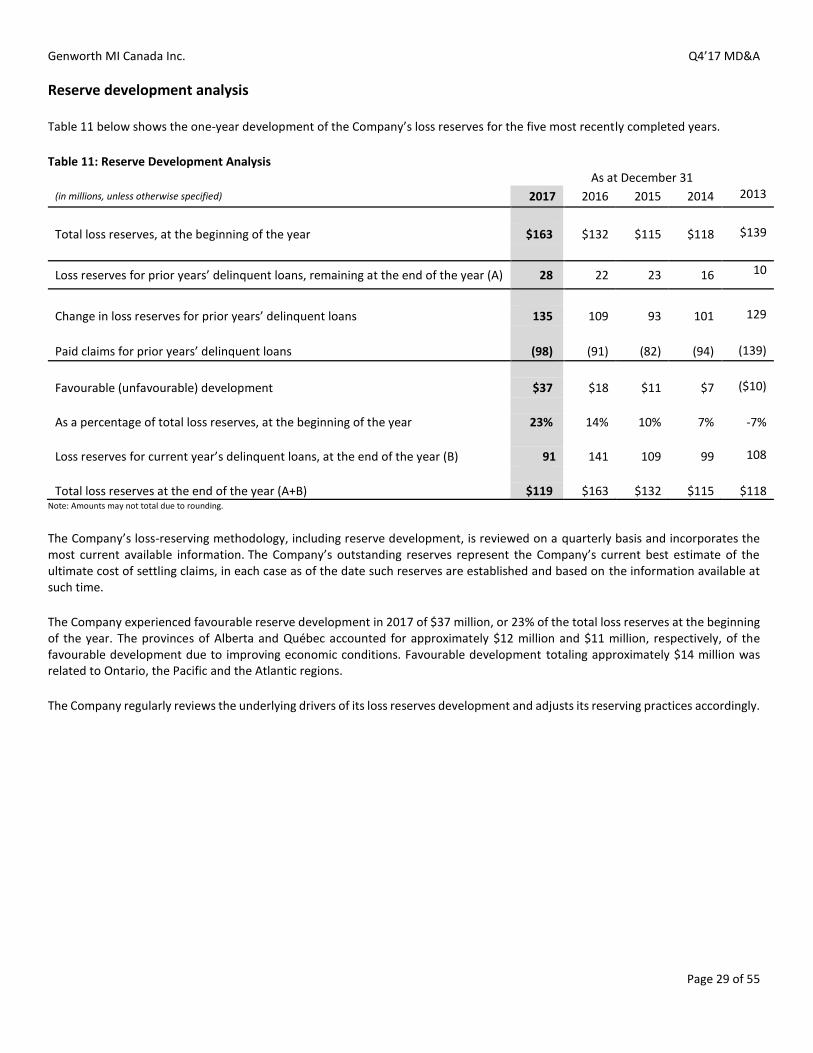
Genworth MI Canada Inc. Q4’17 MD&A
Page 29 of 55
Reserve development analysis
Table 11 below shows the one-year development of the Company’s loss reserves for the five most recently completed years.
Table 11: Reserve Development Analysis As at December 31
(in millions, unless otherwise specified) 2017 2016 2015 2014 2013
Total loss reserves, at the beginning of the year $163 $132 $115 $118 $139
Loss reserves for prior years’ delinquent loans, remaining at the end of the year (A) 28 22 23 16 10
Change in loss reserves for prior years’ delinquent loans 135 109 93 101 129
Paid claims for prior years’ delinquent loans (98) (91) (82) (94) (139)
Favourable (unfavourable) development $37 $18 $11 $7 ($10)
As a percentage of total loss reserves, at the beginning of the year 23% 14% 10% 7% -7%
Loss reserves for current year’s delinquent loans, at the end of the year (B) 91 141 109 99 108
Total loss reserves at the end of the year (A+B) $119 $163 $132 $115 $118 Note: Amounts may not total due to rounding.
The Company’s loss-reserving methodology, including reserve development, is reviewed on a quarterly basis and incorporates the most current available information. The Company’s outstanding reserves represent the Company’s current best estimate of the ultimate cost of settling claims, in each case as of the date such reserves are established and based on the information available at such time.
The Company experienced favourable reserve development in 2017 of $37 million, or 23% of the total loss reserves at the beginning of the year. The provinces of Alberta and Québec accounted for approximately $12 million and $11 million, respectively, of the favourable development due to improving economic conditions. Favourable development totaling approximately $14 million was related to Ontario, the Pacific and the Atlantic regions.
The Company regularly reviews the underlying drivers of its loss reserves development and adjusts its reserving practices accordingly.

Genworth MI Canada Inc. Q4’17 MD&A
Page 30 of 55
Financial condition
Financial instruments
As at December 31, 2017, the Company had total cash and cash equivalents and invested assets of $6.4 billion in its investment portfolio. All of the Company’s invested assets are classified as available-for-sale (“AFS”) with the exception of cash and cash equivalents, and accrued investment income and other receivables which are classified as loans and receivables, and derivative financial instruments which are classified as Fair Value through Profit and Loss. Fair value measurements for AFS securities are based on quoted market prices for identical assets when available. In the event an active market does not exist, estimated fair values are obtained primarily from industry-standard pricing sources using market observable information and through processes such as benchmark curves, benchmarking of like securities and quotes from market participants.
Table 12: Invested assets by asset class for the portfolio
Asset Class As at December 31, 2017 As at December 31, 2016
(in millions of dollars, unless otherwise specified)
Fair value %
Unrealized gains 3
(losses) Fair
value %
Unrealized gains 3
(losses)
Collateralized loan obligations $ 357 6% $ (16) $ 207 3% $ 27
Corporate bonds and debentures: Financial 843 13% 3 910 15% 24 Energy 349 5% 13 356 6% 19 Infrastructure 98 2% 4 101 2% 5 All other sectors 893 14% 25 930 15% 56
Total corporate bonds and debentures 2,184 34% 45 2,297 37% 105
Short-term investments: Canadian federal government treasury bills 1 221 3% - 206 3% -
Total short term investments 221 3% - 206 3% -
Government bonds and debentures: Canadian federal government 1 1,907 30% 16 1,976 32% 45 Canadian provincial and municipal governments 946 15% 39 988 16% 55
Total government bonds and debentures 2,853 44% 55 2,964 48% 100
Preferred shares: Financial 329 5% 11 247 4% (16) Energy 99 2% 7 80 1% 1 All other sectors 119 2% 7 99 2% (4)
Total preferred shares 547 8% 24 426 7% (19)
Total invested assets $ 6,162 96% $ 109 $ 6,100 98% $ 212 Cash and cash equivalents 2 287 4% 0 126 2% -
Total investments $ 6,449 100% $ 109 $ 6,226 100% $ 212
Accrued investment income and other receivables 32 - - 47 - - Derivative financial instruments (asset net of liability and cash collateral) 2 92 - 92 (4) - (4)
Total Invested assets, accrued investment income and other receivables $ 6,573 - $ 200 $ 6,269 - $
208
Note: Amounts may not total due to rounding. 1 Canadian federal government bonds and treasury bills does not include any collateral (December 31, 2016 – $13 million) posted for the benefit of the Company's counterparties to its derivative financial instrument contracts. 2 Cash and cash equivalents includes cash collateral of $38 million pledged to the benefit of the Company from its derivative counterparties with a corresponding liability to return the collateral included in derivative financial instruments. 3 As at December 31, 2017, unrealized gains include unrealized foreign exchange losses of $3 million (December 31, 2016 – unrealized foreign exchange gains of $79 million).
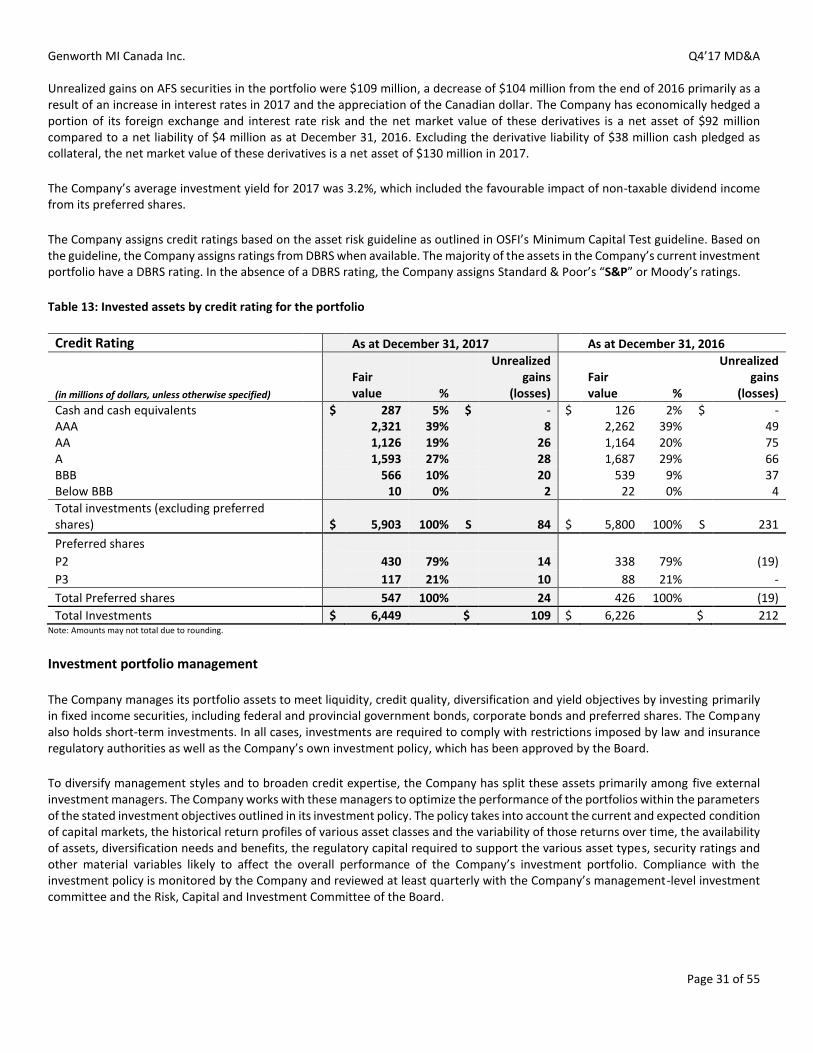
Genworth MI Canada Inc. Q4’17 MD&A
Page 31 of 55
Unrealized gains on AFS securities in the portfolio were $109 million, a decrease of $104 million from the end of 2016 primarily as a result of an increase in interest rates in 2017 and the appreciation of the Canadian dollar. The Company has economically hedged a portion of its foreign exchange and interest rate risk and the net market value of these derivatives is a net asset of $92 million compared to a net liability of $4 million as at December 31, 2016. Excluding the derivative liability of $38 million cash pledged as collateral, the net market value of these derivatives is a net asset of $130 million in 2017.
The Company’s average investment yield for 2017 was 3.2%, which included the favourable impact of non-taxable dividend income from its preferred shares.
The Company assigns credit ratings based on the asset risk guideline as outlined in OSFI’s Minimum Capital Test guideline. Based on the guideline, the Company assigns ratings from DBRS when available. The majority of the assets in the Company’s current investment portfolio have a DBRS rating. In the absence of a DBRS rating, the Company assigns Standard & Poor’s “S&P” or Moody’s ratings.
Table 13: Invested assets by credit rating for the portfolio
Credit Rating As at December 31, 2017 As at December 31, 2016
(in millions of dollars, unless otherwise specified)
Fair value %
Unrealized gains
(losses)
Fair value %
Unrealized gains
(losses)
Cash and cash equivalents $ 287 5% $ - $ 126 2% $ - AAA 2,321 39% 8 2,262 39% 49 AA 1,126 19% 26 1,164 20% 75 A 1,593 27% 28 1,687 29% 66 BBB 566 10% 20 539 9% 37 Below BBB 10 0% 2 22 0% 4
Total investments (excluding preferred shares) $ 5,903 100% S 84 $ 5,800 100% S 231
Preferred shares P2 430 79% 14 338 79% (19)
P3 117 21% 10 88 21% -
Total Preferred shares 547 100% 24 426 100% (19)
Total Investments $ 6,449 $ 109 $ 6,226 $ 212 Note: Amounts may not total due to rounding.
Investment portfolio management
The Company manages its portfolio assets to meet liquidity, credit quality, diversification and yield objectives by investing primarily in fixed income securities, including federal and provincial government bonds, corporate bonds and preferred shares. The Company also holds short-term investments. In all cases, investments are required to comply with restrictions imposed by law and insurance regulatory authorities as well as the Company’s own investment policy, which has been approved by the Board.
To diversify management styles and to broaden credit expertise, the Company has split these assets primarily among five external investment managers. The Company works with these managers to optimize the performance of the portfolios within the parameters of the stated investment objectives outlined in its investment policy. The policy takes into account the current and expected condition of capital markets, the historical return profiles of various asset classes and the variability of those returns over time, the availability of assets, diversification needs and benefits, the regulatory capital required to support the various asset types, security ratings and other material variables likely to affect the overall performance of the Company’s investment portfolio. Compliance with the investment policy is monitored by the Company and reviewed at least quarterly with the Company’s management-level investment committee and the Risk, Capital and Investment Committee of the Board.
Genworth MI Canada Inc. Q4’17 MD&A
Page 32 of 55
Collateralized loan obligations
The Company held $357 million in collateralized loan obligations as of December 31, 2017, up from $207 million as of December 31, 2016. These securities are floating rate collateralized loan obligations denominated in U.S. dollars, of which 90% are rated AA and above and 10% are rated A.
Corporate bonds and debentures
As of December 31, 2017, approximately 34% of the investment portfolio was held in corporate bonds and debentures, down from 37% at December 31, 2016. The investment policy limits the percentage of the portfolio that can be invested in any single issuer or group of related issuers. Financial sector exposure through corporate bonds and debentures represents 13% of the investment portfolio, or approximately 39% of the corporate bonds and debentures. The Company continuously monitors and repositions its exposure to the financial sector, which represents a significant proportion of the corporate issuances of fixed income securities in the Canadian marketplace. The Company is mindful of correlation risk and looks for opportunities to diversify the portfolio outside of Canada to sectors and issuers that have a lower correlated risk to Canada. Energy sector exposure through corporate bonds and debentures represents $349 million or 5% of the investment portfolio.
Securities rated BBB and below were $576 million, or 9% of invested assets, as of December 31, 2017.
Government bonds and debentures
The Company’s investment policy requires that a minimum of 30% of the investment portfolio be invested in sovereign fixed income securities. As of December 31, 2017, 44% of the investment portfolio was invested in sovereign fixed income securities, consisting of 30% in federal fixed income securities and 15% in provincial fixed income securities, relatively unchanged from December 31, 2016.
Canadian federal government treasury bills held by the Company consist primarily of short-term investments with original maturities greater than 90 days and less than 365 days. The Company held $221 million in Canadian federal government short-term treasury bills in the investment portfolio as of December 31, 2017, an increase of $15 million as of December 31, 2016 and the Company increased its cash and cash equivalents.
Preferred shares
As of December 31, 2017, the Company held $547 million of preferred shares, of which the financial sector represented 60%. The Company believes that preferred shares have a comparable dividend yield to common shares and offer a more attractive risk and capital adjusted return profile to that of common shares under the current MCT guidelines. As primarily a result of an increase in interest rates and demand in the second half of 2017, the preferred shares are in an unrealized gain position of $24 million compared to an unrealized loss of $19 million at December 31, 2016. Energy sector exposure through preferred shares represents $99 million or 2% of the investment portfolio.
Cash and cash equivalents
Cash and cash equivalents consist primarily of cash in bank accounts and government treasury bills with original maturities of 90 days or less. The Company determines its target cash holdings based on near-term liquidity needs, market conditions and perceived favourable future investment opportunities. The Company’s cash holdings in the investment portfolio were $287 million as of December 31, 2017, an increase of $161 million from the $126 million in cash holdings as of December 31, 2016 as a result of the Company’s anticipation of a rising interest rate environment in 2018.
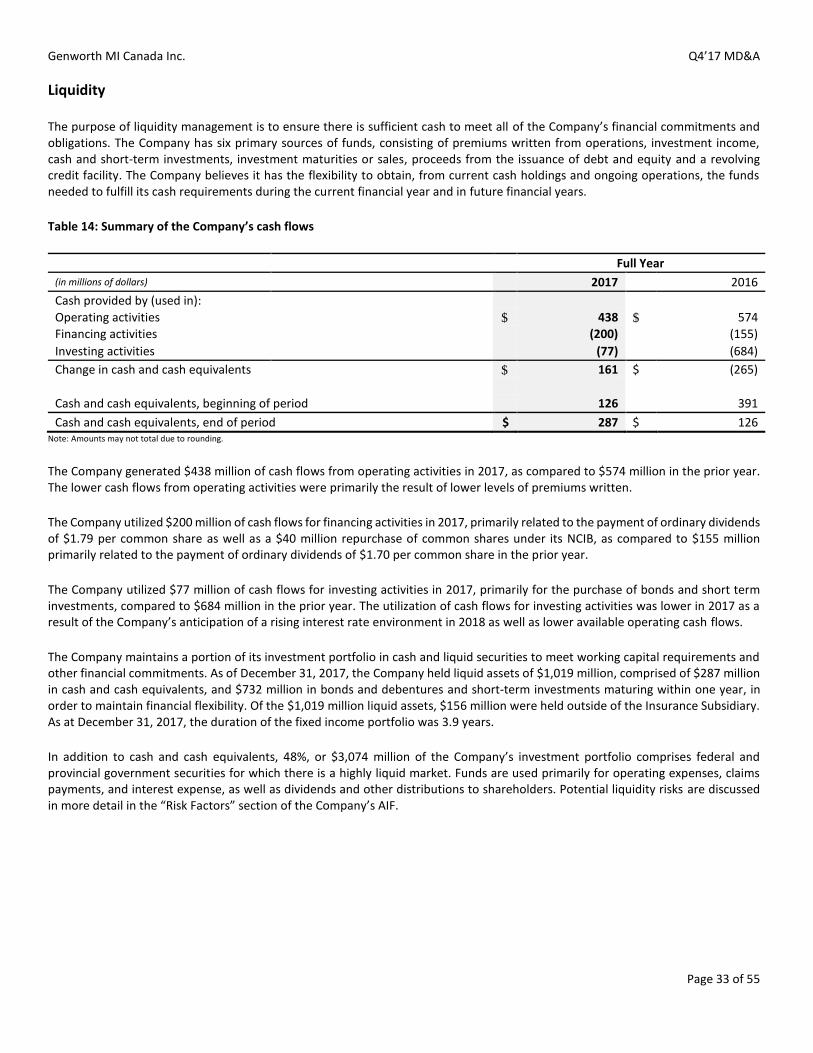
Genworth MI Canada Inc. Q4’17 MD&A
Page 33 of 55
Liquidity
The purpose of liquidity management is to ensure there is sufficient cash to meet all of the Company’s financial commitments and obligations. The Company has six primary sources of funds, consisting of premiums written from operations, investment income, cash and short-term investments, investment maturities or sales, proceeds from the issuance of debt and equity and a revolving credit facility. The Company believes it has the flexibility to obtain, from current cash holdings and ongoing operations, the funds needed to fulfill its cash requirements during the current financial year and in future financial years.
Table 14: Summary of the Company’s cash flows
Full Year
(in millions of dollars) 2017 2016
Cash provided by (used in): Operating activities $ 438 $ 574
Financing activities (200) (155)
Investing activities (77) (684)
Change in cash and cash equivalents $ 161 $ (265)
Cash and cash equivalents, beginning of period 126 391
Cash and cash equivalents, end of period $ 287 $ 126 Note: Amounts may not total due to rounding.
The Company generated $438 million of cash flows from operating activities in 2017, as compared to $574 million in the prior year. The lower cash flows from operating activities were primarily the result of lower levels of premiums written.
The Company utilized $200 million of cash flows for financing activities in 2017, primarily related to the payment of ordinary dividends of $1.79 per common share as well as a $40 million repurchase of common shares under its NCIB, as compared to $155 million primarily related to the payment of ordinary dividends of $1.70 per common share in the prior year.
The Company utilized $77 million of cash flows for investing activities in 2017, primarily for the purchase of bonds and short term investments, compared to $684 million in the prior year. The utilization of cash flows for investing activities was lower in 2017 as a result of the Company’s anticipation of a rising interest rate environment in 2018 as well as lower available operating cash flows.
The Company maintains a portion of its investment portfolio in cash and liquid securities to meet working capital requirements and other financial commitments. As of December 31, 2017, the Company held liquid assets of $1,019 million, comprised of $287 million in cash and cash equivalents, and $732 million in bonds and debentures and short-term investments maturing within one year, in order to maintain financial flexibility. Of the $1,019 million liquid assets, $156 million were held outside of the Insurance Subsidiary. As at December 31, 2017, the duration of the fixed income portfolio was 3.9 years.
In addition to cash and cash equivalents, 48%, or $3,074 million of the Company’s investment portfolio comprises federal and provincial government securities for which there is a highly liquid market. Funds are used primarily for operating expenses, claims payments, and interest expense, as well as dividends and other distributions to shareholders. Potential liquidity risks are discussed in more detail in the “Risk Factors” section of the Company’s AIF.
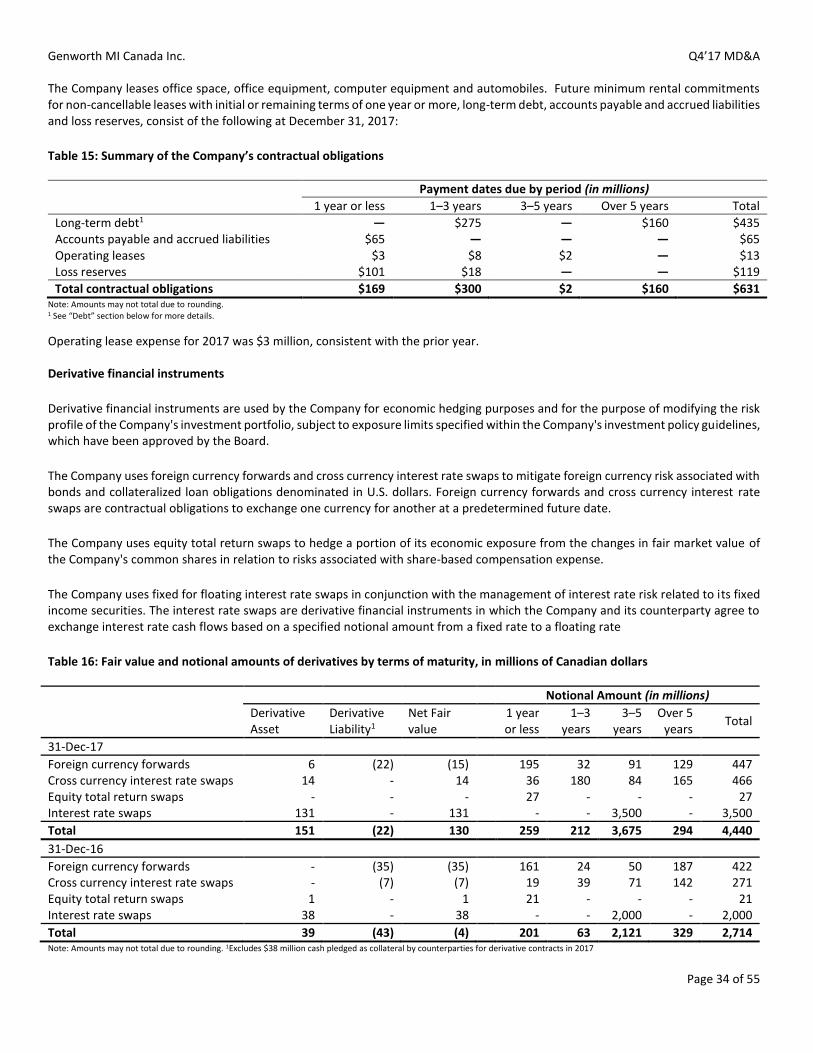
Genworth MI Canada Inc. Q4’17 MD&A
Page 34 of 55
The Company leases office space, office equipment, computer equipment and automobiles. Future minimum rental commitments for non-cancellable leases with initial or remaining terms of one year or more, long-term debt, accounts payable and accrued liabilities and loss reserves, consist of the following at December 31, 2017:
Table 15: Summary of the Company’s contractual obligations
Payment dates due by period (in millions)
1 year or less 1–3 years 3–5 years Over 5 years Total
Long-term debt1 — $275 — $160 $435 Accounts payable and accrued liabilities $65 — — — $65 Operating leases $3 $8 $2 — $13 Loss reserves $101 $18 — — $119
Total contractual obligations $169 $300 $2 $160 $631 Note: Amounts may not total due to rounding. 1 See “Debt” section below for more details.
Operating lease expense for 2017 was $3 million, consistent with the prior year. Derivative financial instruments
Derivative financial instruments are used by the Company for economic hedging purposes and for the purpose of modifying the risk profile of the Company's investment portfolio, subject to exposure limits specified within the Company's investment policy guidelines, which have been approved by the Board.
The Company uses foreign currency forwards and cross currency interest rate swaps to mitigate foreign currency risk associated with bonds and collateralized loan obligations denominated in U.S. dollars. Foreign currency forwards and cross currency interest rate swaps are contractual obligations to exchange one currency for another at a predetermined future date.
The Company uses equity total return swaps to hedge a portion of its economic exposure from the changes in fair market value of the Company's common shares in relation to risks associated with share-based compensation expense.
The Company uses fixed for floating interest rate swaps in conjunction with the management of interest rate risk related to its fixed income securities. The interest rate swaps are derivative financial instruments in which the Company and its counterparty agree to exchange interest rate cash flows based on a specified notional amount from a fixed rate to a floating rate
Table 16: Fair value and notional amounts of derivatives by terms of maturity, in millions of Canadian dollars
Notional Amount (in millions)
Derivative Asset
Derivative Liability1
Net Fair value
1 year or less
1–3 years
3–5 years
Over 5 years
Total
31-Dec-17
Foreign currency forwards 6 (22) (15) 195 32 91 129 447 Cross currency interest rate swaps 14 - 14 36 180 84 165 466 Equity total return swaps - - - 27 - - - 27 Interest rate swaps 131 - 131 - - 3,500 - 3,500
Total 151 (22) 130 259 212 3,675 294 4,440
31-Dec-16
Foreign currency forwards - (35) (35) 161 24 50 187 422 Cross currency interest rate swaps - (7) (7) 19 39 71 142 271 Equity total return swaps 1 - 1 21 - - - 21 Interest rate swaps 38 - 38 - - 2,000 - 2,000
Total 39 (43) (4) 201 63 2,121 329 2,714 Note: Amounts may not total due to rounding. 1Excludes $38 million cash pledged as collateral by counterparties for derivative contracts in 2017
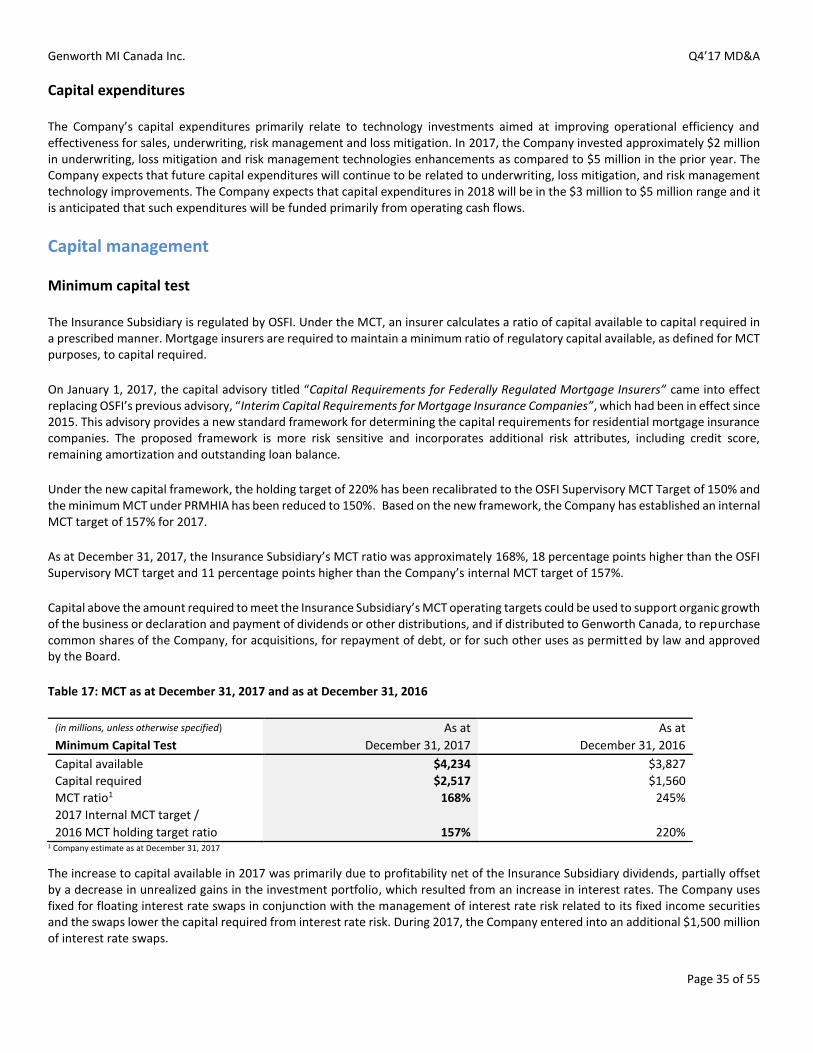
Genworth MI Canada Inc. Q4’17 MD&A
Page 35 of 55
Capital expenditures
The Company’s capital expenditures primarily relate to technology investments aimed at improving operational efficiency and effectiveness for sales, underwriting, risk management and loss mitigation. In 2017, the Company invested approximately $2 million in underwriting, loss mitigation and risk management technologies enhancements as compared to $5 million in the prior year. The Company expects that future capital expenditures will continue to be related to underwriting, loss mitigation, and risk management technology improvements. The Company expects that capital expenditures in 2018 will be in the $3 million to $5 million range and it is anticipated that such expenditures will be funded primarily from operating cash flows.
Capital management
Minimum capital test
The Insurance Subsidiary is regulated by OSFI. Under the MCT, an insurer calculates a ratio of capital available to capital required in a prescribed manner. Mortgage insurers are required to maintain a minimum ratio of regulatory capital available, as defined for MCT purposes, to capital required.
On January 1, 2017, the capital advisory titled “Capital Requirements for Federally Regulated Mortgage Insurers” came into effect replacing OSFI’s previous advisory, “Interim Capital Requirements for Mortgage Insurance Companies”, which had been in effect since 2015. This advisory provides a new standard framework for determining the capital requirements for residential mortgage insurance companies. The proposed framework is more risk sensitive and incorporates additional risk attributes, including credit score, remaining amortization and outstanding loan balance.
Under the new capital framework, the holding target of 220% has been recalibrated to the OSFI Supervisory MCT Target of 150% and the minimum MCT under PRMHIA has been reduced to 150%. Based on the new framework, the Company has established an internal MCT target of 157% for 2017.
As at December 31, 2017, the Insurance Subsidiary’s MCT ratio was approximately 168%, 18 percentage points higher than the OSFI Supervisory MCT target and 11 percentage points higher than the Company’s internal MCT target of 157%.
Capital above the amount required to meet the Insurance Subsidiary’s MCT operating targets could be used to support organic growth of the business or declaration and payment of dividends or other distributions, and if distributed to Genworth Canada, to repurchase common shares of the Company, for acquisitions, for repayment of debt, or for such other uses as permitted by law and approved by the Board.
Table 17: MCT as at December 31, 2017 and as at December 31, 2016
(in millions, unless otherwise specified) As at As at
Minimum Capital Test December 31, 2017 December 31, 2016
Capital available $4,234 $3,827
Capital required $2,517 $1,560
MCT ratio1 168% 245%
2017 Internal MCT target /
2016 MCT holding target ratio 157% 220% 1 Company estimate as at December 31, 2017
The increase to capital available in 2017 was primarily due to profitability net of the Insurance Subsidiary dividends, partially offset by a decrease in unrealized gains in the investment portfolio, which resulted from an increase in interest rates. The Company uses fixed for floating interest rate swaps in conjunction with the management of interest rate risk related to its fixed income securities and the swaps lower the capital required from interest rate risk. During 2017, the Company entered into an additional $1,500 million of interest rate swaps.
Genworth MI Canada Inc. Q4’17 MD&A
Page 36 of 55
Debt
The Company proactively manages capital to balance capital strength, flexibility and efficiency. The Company currently has $435 million in long-term debt, issued in two series, with a debt-to-capital ratio as at December 31, 2017 of 10%.
Table 18: Details of the Company’s long-term debt
(in millions unless otherwise specified)
Series Series 1 Series 3
Timing of maturity 1–3 years After 5 years
Principal amount outstanding $275 $160
Date issued June 29, 2010 April 1, 2014
Maturity date June 15, 2020 April 1, 2024
Fixed annual rate 5.68% 4.242%
Semi-annual interest payments due each year on June 15, December 15 October 1, April 1
Debenture Ratings
S&P1 BBB+ BBB+
DBRS1 A (High), Stable A (High), Stable 1 See “Financial Strength Rating” section of this MD&A for additional information.
The principal debt covenants associated with the debentures are summarized as follows:
A negative pledge under which the Company will not assume or create any security interest (other than permitted encumbrances) unless the debentures are secured equally and ratably with (or prior to) such obligation;
The Company will not, nor will it permit any of its subsidiaries to, amalgamate, consolidate or merge with or into any other person or liquidate, wind-up or dissolve itself unless (a) the Company or one of its wholly-owned subsidiaries is the continuing or successor company or (b) if the successor company is not a wholly-owned subsidiary, at the time of, and after giving effect to, such transaction, no event of default and no event that, after notice or lapse of time, or both, would become an event of default shall have happened and be continuing under the trust indenture, in each case subject to certain exceptions and limitations set forth in the trust indenture; and
The Company will not request that the rating agencies withdraw their ratings of the debentures.
In the case of certain events of default under the terms of the debentures issued by the Company in 2010 and 2014, the aggregate unpaid principal amount of such debentures, together with all accrued and unpaid interest thereon and any other amounts owing with respect thereto, shall become immediately due and payable. The events of default that would trigger such an acceleration of payment include if the Company takes certain voluntary insolvency actions, such as instituting proceedings for its winding up, liquidation or dissolution, or consents to the filing of such proceedings against it; or if involuntary insolvency proceedings go uncontested by the Company or are not dismissed within a specified time period, or the final order sought in such proceedings is granted against the Company.
The above summarized details will not include all details relating to the Company’s debentures. For all pertinent details on the terms and conditions of the Company’s debentures, please see the relevant prospectus, copies of which are available on the SEDAR website at www.sedar.com.
Credit facility
On September 29, 2017, the Company entered into a $200 million senior unsecured revolving syndicated credit facility, which matures on September 29, 2022. Any borrowings under the syndicated credit facility will either be discounted at a rate per annum equal to either a one, two, three or six month (as selected by the Company from time to time) banker’s acceptance or will bear interest at a variable rate based on a spread over the agent bank’s prime rate. The Company also pays a standby fee based on the unused amount of the commitment which is recorded in interest expense in the condensed consolidated interim statements of

Genworth MI Canada Inc. Q4’17 MD&A
Page 37 of 55
income. The syndicated credit facility includes customary representations, warranties, covenants, terms and conditions for transactions of this type.
This syndicated credit facility replaced an existing $100 million previous unsecured revolving credit facility which was cancelled on September 29, 2017.
As at December 31, 2017, there was no amount outstanding under the syndicated credit facility and all of the covenants were fully met.
Financial strength ratings
The Insurance Subsidiary has financial strength ratings from both S&P and DBRS. Although the Insurance Subsidiary is not required to have ratings to conduct its business, ratings may influence the confidence in an insurer and its products.
On July 21, 2017, DBRS confirmed the Insurance Subsidiary’s AA financial strength rating and the Company’s A (high) rating with stable trends citing “the Company’s solid market position, high-quality insurance portfolio and advanced risk analytics, as well as its strong capital position relative to the capital required to meet insurance claims obligations.” 3 On August 15, 2017, S&P affirmed the Insurance Subsidiary’s A+ rating with a stable outlook and the Company’s BBB+ rating with a stable outlook. S&P noted that the Company had a strong competitive position, low industry risk due to the Company's strong portfolio quality, tight regulation, extremely strong earnings and capitalization and adequate financial flexibility with a moderate risk due to monoline focus in a sector prone to capital and earnings volatility.
Ratings Summary S&P DBRS
Issuer Rating
Company BBB+, Stable A (High), Stable
Financial Strength
Insurance Subsidiary A+, Stable AA, Stable
Senior Unsecured Debentures
Company BBB+ A (High), Stable
Capital transactions
Share repurchase
On May 2, 2017, the Company received approval by the Toronto Stock Exchange for the Company to undertake a NCIB. Pursuant to the NCIB, the Company can purchase, for cancellation, up to 4,597,385 shares representing approximately 5% of its outstanding common shares. Purchases of common shares under the NCIB may commence on or after May 5, 2017 and will conclude on the earlier of May 4, 2018 and the date on which the Company has purchased the maximum number of shares under the NCIB. In 2017, under the terms of the NCIB, the Company purchased 1,114,260 of its own common shares for cancellation, for an aggregate purchase price of $40 million. The Company’s majority shareholder, Genworth Financial Inc., through its subsidiaries, participated proportionately in the share purchase transaction.
3 DBRS August 18, 2017 press release: DBRS Confirms Ratings on Genworth Financial Mortgage Insurance Co. Canada at AA and Genworth MI Canada Inc. at A (high), stable trends.

Genworth MI Canada Inc. Q4’17 MD&A
Page 38 of 55
Restrictions on dividends and capital transactions
The Insurance Subsidiary is subject to certain restrictions with respect to dividend and capital transactions. The Insurance Companies Act (“ICA”) prohibits directors from declaring or paying any dividend on shares of an insurance company if there are reasonable grounds for believing that the company is, or the payment of the dividend would cause the company to be, in contravention of applicable requirements to maintain adequate capital, liquidity and assets. The ICA also requires an insurance company to notify OSFI of the declaration of a dividend at least 15 days prior to the date fixed for its payment. Similarly, the ICA prohibits the purchase for cancellation of any shares issued by an insurance company or the redemption of any redeemable shares or other similar capital transactions if there are reasonable grounds for believing that the company is, or the payment would cause the company to be, in contravention of applicable requirements to maintain adequate capital, liquidity and assets. Share cancellation or redemption would also require the prior approval of OSFI. Finally, OSFI has broad authority to take actions that could restrict the ability of an insurance company to pay dividends.
Outstanding share data
Table 19: Changes in the number of common shares outstanding at December 31, 2017 and December 31, 2016
December 31, 2017 December 31, 2016
Common shares, beginning of period 91,864,100 91,795,125 Effect of share repurchase (1,114,260) - Common shares issued in connection with share-based compensation plans 192,200 68,975
Common shares, end of period 90,942,040 91,864,100
At December 31, 2017, Genworth Financial, Inc. beneficially owned 51,925,742 common shares of the Company, or approximately 57.1% of the Company’s outstanding common shares, through its wholly-owned subsidiaries, Genworth Financial International Holdings LLC, Genworth Mortgage Insurance Corporation and Genworth Mortgage Insurance Corporation of North Carolina which held approximately 40.6%, 14.8% and 1.7% of the common shares of the Company, respectively.
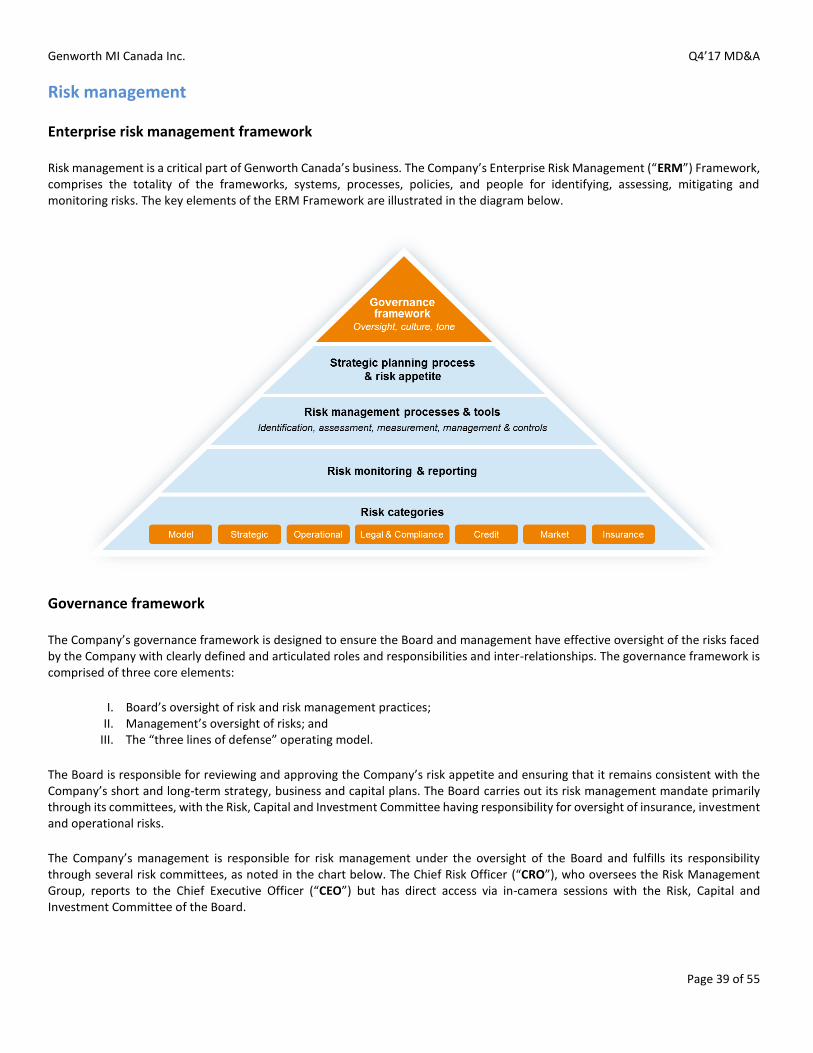
Genworth MI Canada Inc. Q4’17 MD&A
Page 39 of 55
Risk management
Enterprise risk management framework
Risk management is a critical part of Genworth Canada’s business. The Company’s Enterprise Risk Management (“ERM”) Framework, comprises the totality of the frameworks, systems, processes, policies, and people for identifying, assessing, mitigating and monitoring risks. The key elements of the ERM Framework are illustrated in the diagram below.
Governance framework
The Company’s governance framework is designed to ensure the Board and management have effective oversight of the risks faced by the Company with clearly defined and articulated roles and responsibilities and inter-relationships. The governance framework is comprised of three core elements:
I. Board’s oversight of risk and risk management practices; II. Management’s oversight of risks; and
III. The “three lines of defense” operating model.
The Board is responsible for reviewing and approving the Company’s risk appetite and ensuring that it remains consistent with the Company’s short and long-term strategy, business and capital plans. The Board carries out its risk management mandate primarily through its committees, with the Risk, Capital and Investment Committee having responsibility for oversight of insurance, investment and operational risks.
The Company’s management is responsible for risk management under the oversight of the Board and fulfills its responsibility through several risk committees, as noted in the chart below. The Chief Risk Officer (“CRO”), who oversees the Risk Management Group, reports to the Chief Executive Officer (“CEO”) but has direct access via in-camera sessions with the Risk, Capital and Investment Committee of the Board.
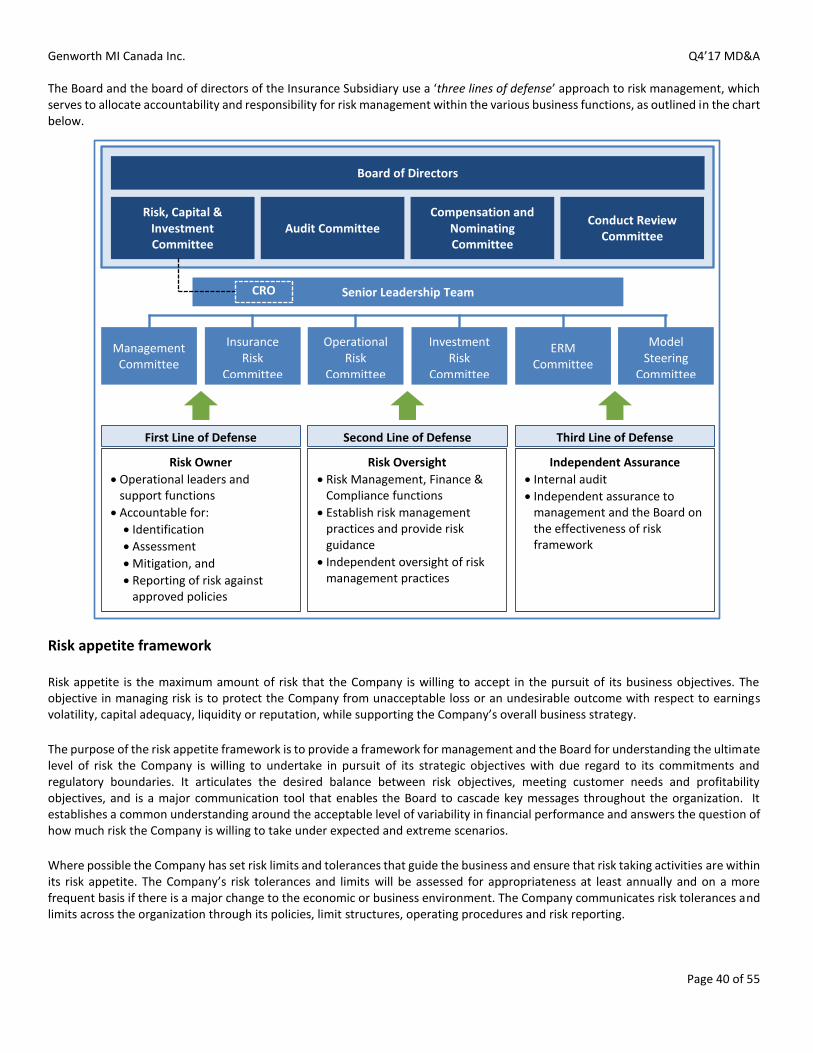
Genworth MI Canada Inc. Q4’17 MD&A
Page 40 of 55
The Board and the board of directors of the Insurance Subsidiary use a ‘three lines of defense’ approach to risk management, which serves to allocate accountability and responsibility for risk management within the various business functions, as outlined in the chart below.
Risk appetite framework
Risk appetite is the maximum amount of risk that the Company is willing to accept in the pursuit of its business objectives. The objective in managing risk is to protect the Company from unacceptable loss or an undesirable outcome with respect to earnings volatility, capital adequacy, liquidity or reputation, while supporting the Company’s overall business strategy.
The purpose of the risk appetite framework is to provide a framework for management and the Board for understanding the ultimate level of risk the Company is willing to undertake in pursuit of its strategic objectives with due regard to its commitments and regulatory boundaries. It articulates the desired balance between risk objectives, meeting customer needs and profitability objectives, and is a major communication tool that enables the Board to cascade key messages throughout the organization. It establishes a common understanding around the acceptable level of variability in financial performance and answers the question of how much risk the Company is willing to take under expected and extreme scenarios.
Where possible the Company has set risk limits and tolerances that guide the business and ensure that risk taking activities are within its risk appetite. The Company’s risk tolerances and limits will be assessed for appropriateness at least annually and on a more frequent basis if there is a major change to the economic or business environment. The Company communicates risk tolerances and limits across the organization through its policies, limit structures, operating procedures and risk reporting.
Board of Directors
Risk, Capital & Investment Committee
Audit Committee Compensation and
Nominating Committee
Conduct Review Committee
Senior Leadership Team
Management Committee
Insurance Risk
Committee
Operational Risk
Committee
Investment Risk
Committee
ERM Committee
Model Steering
Committee
First Line of Defense Second Line of Defense Third Line of Defense
Risk Owner
Operational leaders and support functions
Accountable for:
Identification
Assessment
Mitigation, and
Reporting of risk against approved policies
Risk Oversight
Risk Management, Finance & Compliance functions
Establish risk management practices and provide risk guidance
Independent oversight of risk management practices
Independent Assurance
Internal audit
Independent assurance to management and the Board on the effectiveness of risk framework
CRO

Genworth MI Canada Inc. Q4’17 MD&A
Page 41 of 55
Where possible, the Company’s risk appetite is subject to stress and scenario testing and can be expressed as the tolerance w ith respect to acceptable variances for earnings, liquidity and capital to deviate from their target levels under a variety of different scenarios.
Risk principles
The Company employs the following methods of managing risk that originate from the business objectives of the Company:
Ensure the expected outcomes of risk taking activities are consistent with the Company’s strategies and risk appetite;
Ensure there is an appropriate balance between risk, return, capital, and liquidity in order to meet policyholder obligations and maximize shareholder value throughout economic cycles;
Ensure business decisions are based on an understanding of risk;
Ensure a deep understanding of risk drivers as they relate to our key objectives;
Employ a “Three Lines of Defense” risk governance model, which ensures that a responsibility for risk management is shared across the business;
Proactively address emerging risks as they arise; and
Ensure strict adherence to legal, compliance and regulatory requirements.
The Company’s ERM framework and internal control procedures are designed to reduce the level of volatility in its financial results. The Company’s ERM framework is linked to its business strategy and decision making framework. One of the key tools is the Own Risk and Solvency Assessment (“ORSA”) framework. The key elements and considerations of ORSA include: the comprehensive identification and assessment of risks and the adequacy of the Company’s risk management; the assessment of the Company’s current and likely future capital needs and solvency positions in light of its risk assessments; the distinguishing of Board oversight and management responsibility for such processes; detailing related monitoring and reporting requirements; and detailing the Company’s internal controls and objective review process and procedures for such risk assessments. The Company’s ORSA is forward- looking and is undertaken in conjunction with the Company’s business and strategic planning.
Risk controls
The Company’s ERM approach is supported by a comprehensive set of risk controls. The controls are embedded through its ERM framework and risk-specific frameworks. These frameworks lay the foundation for the development and communication of management -approved policies and the establishment of formal review and approval processes. The Company’s risk management framework and policies are organized as follows:
ERM Framework: provides an overview of the enterprise-wide program for identifying, measuring, controlling and reporting of material risks the Company faces;
Risk-Specific Frameworks: provides an overview of the Company’s program for identifying, measuring, controlling and reporting for each of its material risks; and
Company-wide Policies and Procedures: governs activities such as product risk review and approval, project initiatives, stress testing, risk limits and risk approval authorities.
Risk categories
Insurance risk
Genworth Canada’s mortgage insurance risk management involves actively managing its borrower credit quality, product and geographic exposures. The Company carefully monitors portfolio concentrations by borrower credit quality, product and geography against pre-determined risk tolerances, taking into account the conditions of the housing market and economy in each region of Canada. The Company continues to originate a high quality insurance portfolio with an average credit score of 746 primarily due to continued underwriting diligence. The average home price for transactional insurance originations has remained relatively stable at

Genworth MI Canada Inc. Q4’17 MD&A
Page 42 of 55
$327,000 representing an increase of less than 1%, over the prior year’s period. The average gross debt service ratio for the fourth quarter of 2017 was stable at 24%, and is below the new mortgage stress test threshold of 26%.
To the extent that home prices appreciate over time and/or the principal amount of the loan is paid down, the effective loan-to-value of the Company’s insurance written in a given year decreases.
Table 20: Estimated effective loan-to-value % of the Company’s outstanding mortgage insurance balances1 by book of business
As at December 31, 2017 As at December 31, 2016
Transactional Portfolio Total Transactional Portfolio Total
2009 & prior 37 18 29 44 21 41 2010 53 26 42 61 27 55 2011 57 28 41 65 34 59 2012 62 34 46 70 34 53 2013 65 36 46 74 39 56 2014 71 42 52 79 44 62 2015 75 45 53 84 50 64 2016 81 50 62 90 53 64 2017 91 60 84 - - -
Total 64 39 49 69 46 58 1 This estimate is based on the amounts reported by lenders to the Company, which represents the vast majority of insurance in-force.
Genworth Canada’s extensive historical database and innovative information technology systems are important tools in its approach to risk management. The Company utilizes its proprietary transactional insurance performance database to build and improve its mortgage scoring model. This mortgage scoring model employs a number of evaluation criteria to assign a score to each insured mortgage loan which is an indicator of the likelihood of a future claim. This evaluation criteria includes borrower credit score, loan type and amount, total debt service ratio, property type and loan-to-value. The Company believes these factors, as well as other considerations, significantly enhance the ability of the mortgage scoring model to predict the likelihood of a borrower default, as compared to reliance solely on borrower credit score. The Company also utilizes internally developed stochastic modelling to estimate projected losses on claims and to measure the severity of loss and delinquency rate sensitivity to both changes in the economic environment as well as individual loan or borrower attributes.
The Company’s mortgage portfolio risk management function is organized into three primary groups: portfolio analysis, underwriting policies and guidelines, and risk technology and actuarial modeling. The risk management team analyzes and summarizes mortgage portfolio performance, risk concentrations, emerging trends and remedial actions which are reviewed with the Company’s management-level Risk Committee on a monthly basis. The Company closely monitors the delinquency performance as a key indicator of insurance portfolio performance.
The Company also employs a quality assurance team to ensure that policies and guidelines established by the Company’s mortgage portfolio risk management function are adhered to both internally within the Company and by lenders submitting applications to the Company. The quality assurance team conducts daily reviews of a random sample of loans adjudicated by the Company’s underwriters. Similarly, external lender audits are conducted on a routine basis, using a statistically relevant sample of approved loans. In addition, the quality assurance team also reviews the Company’s loss reserving and mitigation functions to ensure compliance with relevant Company policies and accounting standards. Audit results of all three areas are reviewed by management on a monthly basis.
Genworth MI Canada Inc. Q4’17 MD&A
Page 43 of 55
Market and credit risk
The Company monitors and manages the credit risk, liquidity risk and market risk, including interest rate risk, equity price risk, currency risk, emerging markets risk and counterparty risk of its investment portfolio.
Credit risk
Credit risk is the risk that one party to a financial instrument fails to discharge an obligation and causes financial loss to another party. The Company is exposed to credit risk principally through its investment assets. The Company's investment management strategy is to invest primarily in debt instruments of Canadian government agencies and other high credit quality issuers and to limit the amount of credit exposure with respect to any one issuer, business sector, or credit rating category, as specified in its investment policy. Credit quality of financial instrument issuers is assessed based on ratings supplied by rating agencies DBRS, S&P and Moody’s and credit analysis completed by the Company and its investment managers.
Credit risk from derivative transactions reflects the potential for the counterparty to default on its contractual obligations when one or more transactions have a positive market value to the Company. Therefore, derivative-related credit risk is represented by the positive fair value of the instrument and is normally a small fraction of the contract’s notional amount. To mitigate credit risk related to derivative counterparties, the Company has adopted a policy whereby, upon signing the derivative contract, the counterparty is required to have a minimum credit rating of A- and to collateralize its derivative obligations.
Liquidity risk
Liquidity risk is the risk of having insufficient cash resources to meet policy obligations and other financial commitments as they fall due without raising funds at unfavourable rates or selling assets on a forced basis. To ensure liquidity requirements are met, the Company holds a portion of investment assets in liquid securities. Adverse capital and credit market conditions and the MCT requirements of the Insurance Subsidiary may significantly affect the Company’s access to capital and may affect its ability to meet liquidity or debt refinancing requirements in the future. Potential liquidity risks are discussed in more detail in the “Risk Factors” section of the Company’s AIF and the “Liquidity” section in this MD&A.
Market risk
Market risk is the risk of loss arising from adverse changes in market rates and prices, such as interest rates, equity market fluctuations, foreign currency exchange rates and other relevant market rate or price changes. Market risk is directly influenced by the volatility and liquidity in the markets in which the related underlying assets are traded. The market risks to which the Company is exposed are interest rate risk, equity price risk, currency risk, emerging markets risk and counterparty risk.
Interest rate risk
Fluctuations in interest rates have a direct impact on the market valuation of the Company's fixed income investment portfolio. Short-term interest rate fluctuations will generally create unrealized gains or losses. Generally, the Company's interest income will be reduced during sustained periods of lower interest rates as higher-yielding fixed income investments are called, mature or are sold and the proceeds are reinvested at lower rates, and this will likely result in unrealized gains in the value of fixed income investments the Company continues to hold, as well as realized gains to the extent that the relevant investments are sold. During periods of rising interest rates, the market value of the Company's existing fixed income investments will generally decrease and gains on fixed income investments will likely be reduced or become losses. To mitigate interest rate risk, the Company uses fixed for floating interest rate swaps to hedge a portion of the interest rate risk.
Equity price risk
Equity price risk is the risk that the fair values of equities will decrease as a result of changes in the levels of equity indices and the values of individual stocks. Equity price risk exposure arises from investment in common shares. The Company did not hold any common shares as at December 31, 2017 and 2016.
Genworth MI Canada Inc. Q4’17 MD&A
Page 44 of 55
Currency risk
Currency risk is the risk that the fair value of future cash flows of a financial instrument will fluctuate because of changes in foreign exchange rates. The Company is exposed to currency risk arising from investments denominated in U.S. dollars. The Company uses foreign exchange forward contracts and cross-currency interest rate swaps to mitigate currency risk.
Emerging markets risk
Emerging markets risk relates to emerging market investment grade bond holdings which are exposed to greater market volatility, have less availability of reliable financial information, carry higher transactional and custody costs, are subject to taxation by foreign governments, have decreased market liquidity and may be exposed to political instability.
Counterparty risk
Counterparty risk relates to the risk that a counterparty will fail to discharge its obligation related to a bond, derivative contract or other trade or transaction.
Financial reporting controls and accounting disclosures
Disclosure controls and procedures and internal controls over financial reporting
As required by National Instrument 52-109, the Company has in place disclosure controls and procedures and internal controls over financial reporting, designed under the Committee of Sponsoring Organizations of the Treadway Commission (Framework (2013)) to ensure the disclosure of all material information or changes relating to the Company to all members of the public in a fair and timely manner. Such controls and procedures ensure that all relevant material is gathered and reported to senior management (including the CEO, CFO and General Counsel) and the Company’s management-level disclosure committee on a timely basis so that appropriate decisions can be made regarding public disclosure. An evaluation and certification of the Company’s disclosure controls and procedures and internal controls over financial reporting is done regularly under supervision by the Company’s CEO and CFO in accordance with the requirements of National Instrument 52-109 of the Canadian Securities Administrators, and such certifications are available with the Company’s filings on the SEDAR website at www.sedar.com. The certifications filed in connection with certain interim and annual financial disclosure documents, confirm that the CEO and CFO have concluded that the design and operation of the disclosure controls and procedures and internal controls over financial reporting were effective, for such periods. There were no changes in the Company’s internal controls over financial reporting during the quarter ending December 31, 2017 that have materially affected, or are reasonably likely to materially affect, the Company’s controls over financial reporting.
Genworth MI Canada Inc. Q4’17 MD&A
Page 45 of 55
Changes in accounting standards and future accounting standards
The following amendments to existing standards have been issued by the International Accounting Standards Board (“IASB”) and are effective for annual periods beginning on or after January 1, 2017. Amendments to IAS 7 – Disclosure initiative (“IAS 7”) Amendments to IAS 7 were published in January 2016. The amendments add disclosure requirements that enable users of financial statements to evaluate changes in liabilities arising from financing activities, including both changes arising from cash flow and non-cash changes. The amendments are effective for annual periods beginning on or after January 1, 2017. The Company has provided additional disclosure in relation to the changes in liabilities arising from financing activities in its financial statements. Amendments to IAS 12 – Recognition of deferred tax assets for unrealized losses (“IAS 12”) Amendments to IAS 12 that were published in January 2016, clarify that the existence of a deductible temporary difference depends solely on a comparison of the carrying amount of an asset and its tax base at the end of the reporting period, and is not affected by future changes in the carrying amount or the expected manner of recovery of the asset. The amendments also clarify the methodology to determine the future taxable profits used for assessing the utilization of deductible temporary differences. The amendments apply retrospectively for annual periods beginning on or after January 1, 2017. The amendments had no impact on the Company’s financial statements.
Future accounting standards
The following new standards, amendments to existing standards or new interpretations have been issued by the IASB and became effective as of December 31, 2017.
IFRS 17 - Insurance contracts
In May 2017, the IASB issued IFRS 17. IFRS 17 a comprehensive standard that establishes principles for the recognition, measurement,
presentation and disclosure of insurance contracts. The measurement approach under IFRS 17 is based on the following:
(i) A current, unbiased probability-weighted estimate of future cash flows expected to arise as the insurer fulfills the contract; (ii) The effect of the time value of money; (iii) A risk adjustment that measures the effects of uncertainty about the amount and timing of future cash flows; and (iv) A contractual service margin which represents the unearned profit in a contract and that is recognized as the insurer fulfills
its performance obligations under the contract. Estimates are required to be re-measured each reporting period.
Certain types of contracts, typically short-duration contracts, will be permitted to use a simplified measurement approach.
Additionally, for contracts in which the cash flows are linked to underlying items, the liability value will reflect that linkage. There
will also be new financial statement presentation for insurance contracts and additional disclosure requirements.
IFRS 17 is effective for annual periods beginning on or after January 1, 2021. IFRS 17 will replace IFRS 4.
The Company is currently assessing the impact of IFRS 17. The extent of the impact of adoption of the standard has not yet been determined.
Genworth MI Canada Inc. Q4’17 MD&A
Page 46 of 55
IFRS 9 - Financial instruments
In July 2014, the IASB published the final version of IFRS 9, which replaces IAS 39 - Financial instruments: recognition and measurement, and includes guidance on the classification and measurement of financial instruments, impairment of financial assets, and a new general hedge accounting model. Financial asset classification is based on the cash flow characteristics and the business model in which an asset is held. The classification determines how a financial instrument is accounted for and measured. IFRS 9 also introduces a single impairment model for financial instruments not measured at Fair Value through Profit or Loss that requires recognition of expected credit losses at initial recognition of a financial instrument and the recognition of lifetime expected credit losses if certain criteria are met. The new model for hedge accounting aligns hedge accounting with risk management activities.
IFRS 9 is generally effective for years beginning on or after January 1, 2018. In September 2016, the IASB issued an amendment to IFRS 4: Insurance contracts ("IFRS 4") which provides optional relief to eligible insurers in respect of IFRS 9. The options permit entities whose predominant activity is issuing insurance contracts within the scope of IFRS 4 (a) a temporary exemption to defer the implementation of IFRS 9 or alternatively (b) the option to remove from income the incremental volatility caused by changes in the measurement of specified financial assets upon application of IFRS 9. Entities that apply either of the options will be required to adopt IFRS 9 on annual periods beginning on or after January 1, 2021. Additional financial statement disclosures will be required for entities that apply either of the options. The Company has analyzed this amendment and has concluded that it is an eligible insurer that qualifies for the transitional relief. The Company has elected to apply the optional transitional relief that permits the deferral of the adoption of IFRS 9 for eligible insurers. The Company will not apply IFRS 9 as at January 1, 2018. The Company will continue to apply IAS 39 until January 1, 2021, the date at which implementation of IFRS 9 is mandatory.
IFRS 16 - Leases
In January 2016, the IASB issued IFRS 16 which sets out the principles for the recognition, measurement, presentation and disclosure of leases. The new standard removes the current requirement of classifying leases as finance or operating leases by introducing a single lessee accounting model. Under the new model, the lessee will be required to recognize a right of use asset and a lease liability for the lease component of future payments. Lessees will also be required to replace operating lease expenses with the depreciation expense for the right of use assets and interest expense on lease liabilities in the statement of income. There are recognition exemptions for short-term leases and leases of low value items. There are no significant changes to lessor accounting requirements. IFRS 16 is effective for annual periods beginning on or after January 1, 2019, with retrospective application and some practical expedients available on adoption. The Company is currently assessing the impact of IFRS 16. The Company expects that IFRS 16 will result in leases being recorded on the Company’s statement of financial position, including those currently classified as operating leases, except leases with low value of the underlying asset. On transition, the Company expects to apply practical expedients available whereby the Company will not need to reassess whether a contract is, or contains, a lease for transactions recognized prior to the date of initial application.
Amendments to IFRS 2 – Share-based payments (“IFRS 2”)
Amendments to IFRS 2 were published in June 2016, which clarify how to account for certain types of share-based payment transactions. The amendments provide requirements on the accounting for:
(i) The effects of vesting and non-vesting conditions on the measurement of cash-settled share-based payments; (ii) Share-based payment transactions with a net settlement feature for withholding tax obligations; and (iii) the effect of a modification to the terms and conditions of a share-based payment that changes the classification of the
transaction from cash-settled to equity-settled.
The amendments are effective for annual periods beginning on or after January 1, 2018, with early adoption permitted if information is available without the use of hindsight.
Genworth MI Canada Inc. Q4’17 MD&A
Page 47 of 55
The Company expects the amendments to IFRS 2 to have no impact on the Company’s financial statements.
IFRIC Interpretation 22 – Foreign currency transactions and advance consideration (“IFRIC 22”)
In December 2016, the IASB issued IFRIC 22 which provides guidance on the exchange rate to use in transactions that involve advance consideration paid or received in a foreign currency. The interpretation is effective for annual periods beginning on or after January 1, 2018, with early adoption permitted. The Company expects IFRIC 22 to have no impact on the Company’s financial statements.
IFRIC Interpretation 23 – Uncertainty over income tax treatments (“IFRIC 23”)
In June 2017, the IASB issued IFRIC 23 which clarifies how to apply the recognition and measurement requirement in IAS 12 when there is uncertainty over income tax treatments. An entity is required to recognize and measure its taxable profit (taxable loss), tax bases, unused tax losses, unused tax credits and tax rates applying this interpretation. IFRIC 23 is effective for annual periods beginning on or after January 1, 2019, with early adoption permitted. The interpretation requires retrospective application, with some practical expedients available on adoption.
The Company is evaluating the impact of IFRIC 23 on the Company’s financial statements.
Significant estimates and judgments
The preparation of consolidated financial statements in accordance with IFRS requires management to make estimates and judgments that affect the reported amounts of assets and liabilities at the date of the consolidated financial statements and the reported amounts of revenue and expenses during the reporting periods covered by the financial statements. The principal financial statement components subject to measurement uncertainty are outlined below as accounting estimates and judgments. Actual results may differ from the estimates used, and such differences may be material.
Accounting estimates
Information about assumptions and estimation uncertainties that have a risk of resulting in material adjustment within the next 12 months are as follows:
Premiums earned
Mortgage insurance premiums are deferred and then taken into underwriting revenues over the terms of the related policies. The rates or formulae under which premiums are earned relate to the loss emergence pattern in each year of coverage. In order to match premiums earned to losses on claims, premiums written are recognized as premiums earned using a factor-based premium recognition curve. In constructing the premium recognition curve, the Company applies actuarial forecasting techniques to historical loss data to determine expected loss development and the related loss emergence pattern.
Loss reserves
Loss reserves represent the amount needed to provide for the expected ultimate net cost of settling claims including adjustment expenses related to defaults by borrowers (both reported and unreported) that have occurred on or before the reporting date. Loss reserves are discounted to take into account the time value of money and include a supplemental provision for adverse deviation. In determining the ultimate claim amount, the Company estimates the expected recovery from the property securing the insured loan and the legal, property maintenance and other loss adjustment expenses incurred in the claim settlement process. Loss reserves consist of individual case reserves, Incurred But Not Reported ("IBNR") reserves and supplemental loss reserves for potential adverse deviation.
Genworth MI Canada Inc. Q4’17 MD&A
Page 48 of 55
For the purpose of quantifying case reserves, the Company analyzes each reported delinquent loan on a case-by-case basis and establishes a case reserve based on the expected loss, if any. The ultimate expected claim amount is influenced significantly by housing market conditions, changes in property values, and the condition of properties in default. IBNR is the Company's best estimate of losses that have been incurred but not reported from the time the first scheduled mortgage payment has been missed by a mortgage borrower. The Company establishes reserves for IBNR based on the reporting lag from the date of first missed payment to the reporting date for mortgages in default that have not been reported to the Company. IBNR is calculated using estimates of expected claim frequency and claim severity based on the most current available historical loss data, adjusted for seasonality. In order to discount loss reserves to present value, the Company's appointed actuary determines a discount rate based on the market yield of the Company's investment portfolio. The Company recognizes a provision for adverse deviation based on assessment of the adequacy of the Company's loss reserves and with reference to the current and future expected condition of the Canadian housing market and its impact on the expected development of losses. The process for the establishment of loss reserves relies on the judgment and opinions of a number of individuals, on historical precedent and trends, on prevailing legal and economic trends and on expectations as to future developments. This process involves risks that actual results will deviate, perhaps substantially, from the best estimates made. These risks vary in proportion to the length of the estimation period and the volatility of each component comprising the liability.
Subrogation recoverable
The Company estimates the fair value of subrogation rights related to real estate included in subrogation recoverable based on third party property appraisals or other types of third party valuations deemed to be more appropriate for a particular property. The Company estimates borrower recoveries related to claims paid and loss reserves included in subrogation recoverable based on historical recovery experience. Borrower recoveries are discounted to present value and include an actuarial margin for adverse deviation.
Deferred policy acquisition costs
Deferred policy acquisition costs are comprised of premium taxes, appraisal costs, risk fee, certain employee compensation, and other expenses that relate directly to acquisition of new mortgage insurance business. Deferred policy acquisition costs are deferred and expensed in proportion to and over the periods in which premiums are earned.
The Company estimates expenses eligible for deferral based on the nature of expenses incurred and results of time and activity studies performed to identify the portion of time the Company's employees incur in the acquisition of new mortgage insurance business.
Accounting judgments
Objective evidence of impairment of AFS financial assets
As of each reporting date, the Company evaluates AFS financial assets for objective evidence of impairment. For investments in bonds and preferred shares, evaluation of whether impairment has occurred is based on the Company’s assessment that a loss event has occurred and the Company’s best estimate of the cash flows to be collected at the individual investment level. The Company considers all available information relevant to the collectability of the investment, including information about past events, current conditions, and reasonable and supportable forecasts. Impairment assessment is a qualitative and quantitative process that incorporates information received from third party sources along with certain internal assumptions
Genworth MI Canada Inc. Q4’17 MD&A
Page 49 of 55
and judgments regarding the future performance of any underlying collateral for asset-backed investments. Impairment for bonds and preferred shares is deemed to exist when the Company does not expect full recovery of the amortized cost of the investment based on the estimate of cash flows to be collected or when the Company intends to sell the investment prior to recovery from its unrealized loss position. For common shares, the Company recognizes an impairment loss in the period in which it is determined that an investment has experienced significant or prolonged losses.
Transactions with related parties
Services The Company enters into related party transactions with Genworth Financial, Inc. and its subsidiaries. Services rendered by Genworth Financial, Inc. and subsidiaries consist of information technology, finance, human resources, legal and compliance, and other specified services. The services rendered by the Company and the Insurance Subsidiary relate mainly to financial reporting and tax compliance support services. These transactions are in the normal course of business and are at terms and conditions no less favourable than market. Balances owing for service transactions are non-interest bearing and are settled on a quarterly basis. The Company incurred net related party charges of approximately $6 million in 2017, consistent with the prior year.
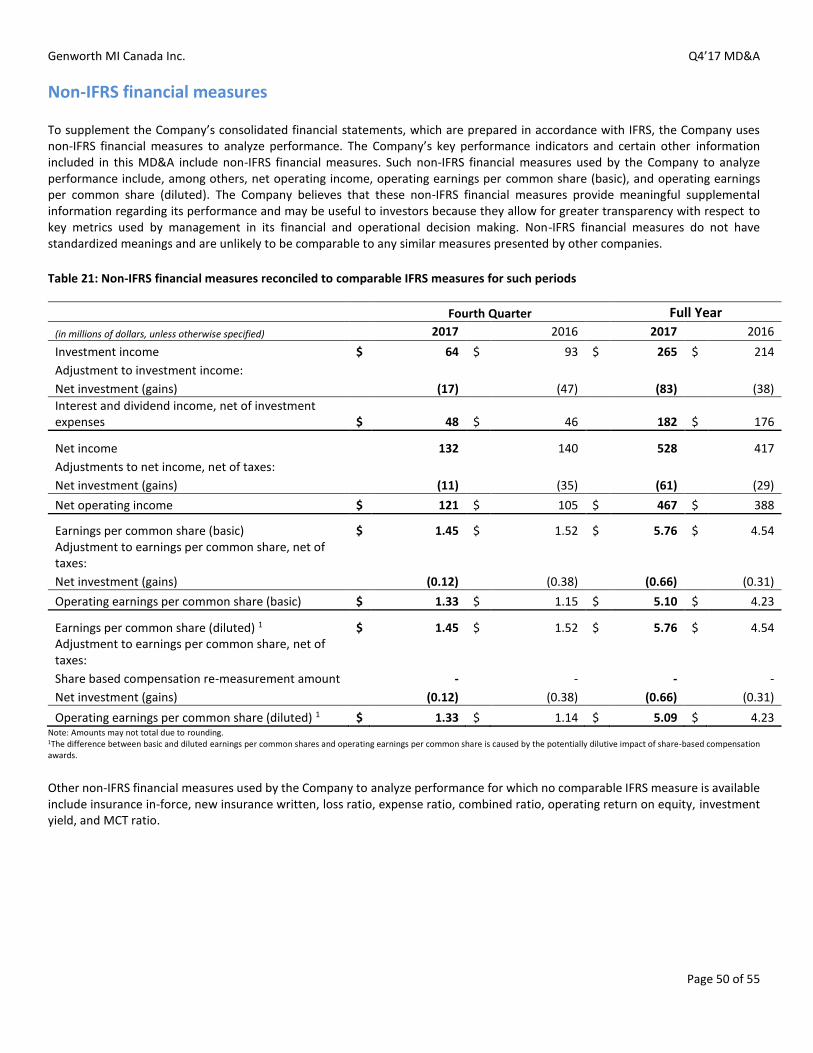
Genworth MI Canada Inc. Q4’17 MD&A
Page 50 of 55
Non-IFRS financial measures
To supplement the Company’s consolidated financial statements, which are prepared in accordance with IFRS, the Company uses non-IFRS financial measures to analyze performance. The Company’s key performance indicators and certain other information included in this MD&A include non-IFRS financial measures. Such non-IFRS financial measures used by the Company to analyze performance include, among others, net operating income, operating earnings per common share (basic), and operating earnings per common share (diluted). The Company believes that these non-IFRS financial measures provide meaningful supplemental information regarding its performance and may be useful to investors because they allow for greater transparency with respect to key metrics used by management in its financial and operational decision making. Non-IFRS financial measures do not have standardized meanings and are unlikely to be comparable to any similar measures presented by other companies.
Table 21: Non-IFRS financial measures reconciled to comparable IFRS measures for such periods
Fourth Quarter Full Year
(in millions of dollars, unless otherwise specified) 2017 2016 2017 2016
Investment income $ 64 $ 93 $ 265 $ 214
Adjustment to investment income: Net investment (gains) (17) (47) (83) (38)
Interest and dividend income, net of investment expenses $ 48 $ 46 182 $ 176
Net income 132 140 528 417
Adjustments to net income, net of taxes: Net investment (gains) (11) (35) (61) (29)
Net operating income $ 121 $ 105 $ 467 $ 388
Earnings per common share (basic) $ 1.45 $ 1.52 $ 5.76 $ 4.54 Adjustment to earnings per common share, net of taxes: Net investment (gains) (0.12) (0.38) (0.66) (0.31)
Operating earnings per common share (basic) $ 1.33 $ 1.15 $ 5.10 $ 4.23
Earnings per common share (diluted) 1 $ 1.45 $ 1.52 $ 5.76 $ 4.54 Adjustment to earnings per common share, net of taxes: Share based compensation re-measurement amount - - - -
Net investment (gains) (0.12) (0.38) (0.66) (0.31)
Operating earnings per common share (diluted) 1 $ 1.33 $ 1.14 $ 5.09 $ 4.23 Note: Amounts may not total due to rounding. 1The difference between basic and diluted earnings per common shares and operating earnings per common share is caused by the potentially dilutive impact of share-based compensation awards.
Other non-IFRS financial measures used by the Company to analyze performance for which no comparable IFRS measure is available include insurance in-force, new insurance written, loss ratio, expense ratio, combined ratio, operating return on equity, investment yield, and MCT ratio.

Genworth MI Canada Inc. Q4’17 MD&A
Page 51 of 55
Table 22: Non-IFRS financial measures for which no comparable IFRS measure is available
For a more meaningful description of the measure, refer to the “Non-IFRS financial measures glossary”.
Fourth Quarter Full Year
(in millions of dollars, unless otherwise specified) 2017 2016 2017 2016
Selected non-IFRS financial measures Insurance in force 1 $ 491,795 $ 464,291 $ 491,795 $ 464,291 New insurance written $ 5,428 $ 10,038 $ 31,568 $ 63,051 Transactional new insurance written $ 4,516 5,120 $ 18,187 21,171 Portfolio new insurance written $ 913 4,918 $ 13,381 41,881 Loss ratio 9% 18% 10% 22% Expense ratio 20% 20% 20% 19% Combined ratio 29% 38% 30% 41% Operating return on equity 13% 12% 13% 11% Investment yield 3.2% 3.2% 3.2% 3.2%
MCT ratio 2 168% 245% 168% 245% 1 This estimate is based on amounts reported to the Company by lenders which represent the vast majority of outstanding insured mortgage balances. 2 Company estimate at December 31, 2017.
Non-IFRS financial measures glossary
“combined ratio” means the sum of the loss ratio and the expense ratio. The combined ratio measures the proportion of the Company’s total cost to its premium earned and is used to assess the profitability of the Company’s insurance underwriting activities.
“expense ratio” means the ratio (expressed as a percentage) of sales, underwriting and administrative expenses to premiums earned for a specified period. The expense ratio measures the operational efficiency of the Company and is a useful comparison to industry benchmarks and internal targets.
“insurance in-force” means the amount of all mortgage insurance policies in effect at a specified date, based on the original principal balance of mortgages covered by such insurance policies, including any capitalized premiums. Insurance in-force measures the maximum potential total risk exposure under insurance contracts at any given time and is used to assess potential losses on claims.
“interest and dividend income, net of investment expenses” means the total net investment income excluding investment gains (losses). This measure is an indicator of the core operating performance of the investment portfolio.
“investment yield” means the annualized investment income before investment fees and excluding net investment gains (losses) tax affected for dividends for such period divided by the average of the beginning and ending investments book value, for such period. For quarterly results, the investment yield is the annualized investment income using the average of beginning and ending investments book value, for such quarter.
“loss ratio” means the ratio (expressed as a percentage) of the total amount of losses on claims associated with insurance policies incurred during a specified period to premiums earned during such period. The loss ratio is a key measure of underwriting profitability and the quality of the insurance portfolio and is used for comparisons to industry benchmarks and internal targets.
“Minimum Capital Test” or “MCT” means the minimum capital test for certain federally regulated insurance companies established by OSFI (as defined herein). Under MCT, companies calculate an MCT ratio of regulatory capital available to regulatory capital required using a defined methodology prescribed by OSFI in monitoring the adequacy of a company’s capital. The MCT ratio is a key metric of the adequacy of the Company’s capital in comparison to regulatory requirements and is used for comparisons to other mortgage insurers and internal targets.
“net operating income” means net income excluding after-tax net realized gains (losses) on sale of investments, unrealized gains (losses) on FVTPL securities and including the net cost or benefit related to the interest rate swaps as represented by the difference

Genworth MI Canada Inc. Q4’17 MD&A
Page 52 of 55
between the fixed rate and floating rate. Net operating income estimates the recurring after-tax earnings from core business activities and is an indicator of core operating performance.
“portfolio new insurance written” means the original principal balance of mortgages, insured during a specified period as part of a portfolio of mortgages that have a loan-to-value ratio equal to or less than 80% at the time the loan is insured. New insurance written measures the maximum potential risk exposure under insurance contracts added during a specific time period and is used to determine potential loss exposure.
“operating earnings per common share (basic)” means the net operating income divided by the basic average common shares outstanding during the period.
“operating earnings per common share (diluted)” means the net operating income divided by the diluted average common shares outstanding during the period. The Company excludes the impact of the share based compensation re-measurement amount from operating earnings per share (diluted) as it believes this results is a better indicator of core operating performance.
“operating return on equity” means the net operating income for a period divided by the average of the beginning and ending shareholders’ equity, excluding AOCI, for such period. For quarterly results, the operating return is the annualized operating return on equity using the average of beginning and ending shareholders’ equity, excluding AOCI, for such quarter. Operating return on equity is an indicator of return on invested capital in the core business activities.
“outstanding insured mortgage balances” means the amount of all mortgage insurance policies in effect at a specified date, based on the current balance of mortgages covered by such insurance policies, including any capitalized premiums. Outstanding insured mortgage balances measures the current total risk exposure under insurance contracts at any given time and is used to assess potential losses on claims.
“transactional new insurance written” means the original principal balance of mortgages, including any capitalized premiums, insured during a specified period predominantly on mortgages with a loan-to-value ratio of greater than 80% at the time the loan is originated. New insurance written measures the maximum potential risk exposure under insurance contracts added during a specific time period and is used to determine potential loss exposure.
Other Glossary
“accumulated other comprehensive income” or “AOCI” is a component of shareholders’ equity and reflects the unrealized gains and losses, net of taxes, related to available-for-sale assets. Unrealized gains and losses on assets classified as available-for-sale are recorded in the consolidated statement of comprehensive income and included in accumulated other comprehensive income until recognized in the consolidated statement of income.
“available-for-sale” or “AFS” means investments recorded at fair value on the balance sheet, using quoted market prices, with changes in the fair value of these investments included in AOCI.
“average reserve per delinquency” means the average reserve per delinquent loan calculated by total loss reserves in dollars divided by the number of outstanding delinquent loans reported by lenders. Average reserve per delinquency measures the potential size of the average loss, including delinquent loans with no expected loss, and is used for trending purposes and comparisons against internal targets.
“average premium rate” means the average premiums written collected divided by the new insurance written
“book value per common share” is a measure of the carrying value of each individual share of the Company and is a key metric used in assessing the market value of the Company.
“book value per common share excluding AOCI (basic)” means the per common share amount of shareholders’ equity excluding AOCI to the number of basic common shares outstanding at a specified date.
Genworth MI Canada Inc. Q4’17 MD&A
Page 53 of 55
“book value per common share excluding AOCI (diluted)” means the per common share amount of shareholders’ equity excluding AOCI to the number of diluted common shares outstanding at a specified date. Diluted common shares outstanding takes into account all of the outstanding dilutive securities that could potentially be exercised.
“book value per common share including AOCI (basic)” means the per common share amount of shareholders’ equity including AOCI to the number of basic common shares outstanding at a specified date.
“book value per common share including AOCI (diluted)” means the per common share amount of shareholders’ equity including AOCI to the number of diluted common shares outstanding at a specified date. Diluted common shares outstanding takes into account all of the outstanding dilutive securities that could potentially be exercised.
“case reserves” means the expected losses associated with reported delinquent loans. Lenders report delinquent loans to the Company on a monthly basis. The Company analyzes reported delinquent files on a case-by-case basis and derives an estimate of the expected loss. Case reserve estimates incorporate the amount expected to be recovered from the ultimate sale of the residential property securing the insured mortgage.
“claim” means the amount demanded under a policy of insurance arising from the loss relating to an insured event.
“common shares” means the issued and outstanding common shares of the Company.
“credit score” means the lowest average credit score of all borrowers on a mortgage insurance application. Average credit scores are calculated by averaging the score obtained from both Equifax and TransUnion for each borrower on the application. This is a key measure of household financial health.
“cures” means previously reported delinquent loans where the borrower has made all scheduled mortgage payments or a successful workout has been completed and the loan is no longer considered a delinquent loan.
“debt-to-capital ratio” means the ratio (expressed as a percentage) of debt to total capital (the sum of debt and equity). This is a measure of financial leverage that the Company considers in capital management planning.
“deferred policy acquisition costs” means the expenses incurred in the acquisition of new business, comprised of premium taxes and other expenses that relate directly to the acquisition of new business. Policy acquisition costs are only deferred to the extent that they are in excess of the service fees and can be expected to be recovered from unearned premium reserves. Deferred policy acquisition costs are amortized into income in proportion to and over the periods in which premiums are earned.
“delinquency ratio” means the ratio (expressed as a percentage) of the total number of delinquent loans to the total original number of policies in-force at a specified date. The delinquency ratio is an indicator of the emergence of losses on claims and the quality of the insurance portfolio and is a useful comparison to industry benchmarks and internal targets.
“delinquent loans” means loans where the borrowers have failed to make scheduled mortgage payments under the terms of the mortgage and where the cumulative amount of mortgage payments missed exceeds the scheduled payments due in a three-month period.
“dividends paid per common share” means the portion of the Company’s profits distributed to shareholders during a specified period and measures the total amount distributed by the Company to shareholders.
“effective loan-to-value” means a Company estimate based on the estimated balance of loans insured divided by the estimated fair market value of the mortgaged property using the Teranet - National Bank Home Price Index Composite 11.
“effective tax rate” means the ratio (expressed as a percentage) of provision for income taxes to income before income taxes for a specified period. The effective tax rate measures the actual amount of pre-tax income the Company pays in taxes and is a useful comparison to industry benchmarks and prior periods.
Genworth MI Canada Inc. Q4’17 MD&A
Page 54 of 55
“Fair Value through Profit or Loss” or “FVTPL” means investments recorded at fair value on the statement of financial position with changes in the fair value of these investments recorded in income.
“gross debt service ratio” or “GDSR” means the percentage of borrowers’ total monthly debt servicing costs, in respect of the debt in question, as a percentage of borrowers monthly gross income. This is a key measure of household financial health.
“incurred but not reported” or “IBNR” reserves means the estimated losses on claims for delinquencies that have occurred prior to a specified date, but have not been reported to the Company.
“investment portfolio” means invested assets (including cash and cash equivalents, short-term investments, bonds or other fixed income securities and equity investments).
“loan-to-value ratio” means the original balance of a mortgage loan divided by the original value of the mortgaged property.
“loss adjustment expenses” means all costs and expenses incurred by the Company in the investigation, adjustment and settlement of claims. Loss adjustment expenses include third-party costs as well as the Company’s internal expenses, including salaries and expenses of loss management personnel and certain administrative costs.
“losses on claims” means the estimated amount payable under mortgage insurance policies during a specified period. A portion of reported losses on claims represents estimates of costs of pending claims that are still open during the reporting period, as well as estimates of losses associated with claims that have yet to be reported and the cost of investigating, adjusting and settling claims.
“loss reserves” means case reserves based on delinquencies reported to the Company, an estimate for losses on claims based on delinquencies that are IBNR, supplemental loss reserves for potential adverse developments related to claim severity and loss adjustment expenses representing an estimate for the administrative costs of investigating, adjusting and settling claims. Loss reserves are discounted to take into account the time value of money.
“market share” or “share” of a mortgage insurer means the insurer’s gross premiums written as a percentage of the reported gross premiums written of the Canadian mortgage insurance industry.
“net investment gains or losses” means the sum of net realized gains or losses on sales of investments, net gains or losses on derivatives and foreign exchanges and impairment losses.
“net underwriting income” means the sum of premiums earned and fees and other income, less losses and sales, underwriting and administrative expenses during a specified period.
“ordinary dividend payout ratio” means the ratio (expressed as a percentage) of the dollar amount of ordinary dividends paid during a specified period to shareholders as a percentage of net operating income over the same period. This is a measure of the proportion of net operating income returned to shareholders in the form of ordinary dividends.
“portfolio insurance” means mortgage insurance covering an individual mortgage that is underwritten as part of a portfolio of mortgages that have a loan-to-value ratio equal to or less than 80% at the time the loan is insured.
“premium tax” means a tax paid by insurance companies to provincial and territorial governments calculated as a percentage of gross premiums written.
“premium written” means gross payments received from insurance policies issued during a specified period.
“sales, underwriting and administrative expenses” means the cost of marketing and underwriting new mortgage insurance policies and other general and administrative expenses, including premium taxes, risk fee and net of the change in deferred policy acquisition costs.

Genworth MI Canada Inc. Q4’17 MD&A
Page 55 of 55
“severity” means the dollar amount of losses on claims.
“share based compensation re-measurement amount” means the impact of revaluation of stock option liability as required under IFRS due to the cash settlement option. The Company believes that excluding this impact from operating earnings per share (diluted) is a better indicator of core operating performance.
“total debt service ratio” or “TDSR” means the borrowers’ monthly debt servicing costs as a percentage of borrowers’ monthly gross income.
“transactional insurance” means mortgage insurance covering an individual mortgage that typically has been underwritten individually, and which is predominantly a mortgage with a loan-to-value ratio of greater than 80% at the time the loan is originated.
“underwriter” means an individual who examines and accepts or rejects mortgage insurance risks based on the Company’s approved underwriting policies and guidelines.
“unearned premiums reserve” or “UPR” means that portion of premiums written that has not yet been recognized as revenue. Unearned premium reserves are recognized as revenue over the policy life in accordance with the expected pattern of loss emergence as derived from actuarial analysis of historical loss development.
“workout penetration rate” means the ratio (expressed as a percentage) of the number of total workouts approved, including shortfall sales, over total workout opportunities. Total workout opportunities include all new and re-delinquencies reported plus total workouts approved over the same period. Workout penetration rate measures the number of workouts performed relative to the number of existing workout opportunities and is used to assess the success of the loss mitigation Homeowner Assistance Program.
The Company’s full glossary is posted on the Company’s website at http://investor.genworthmicanada.ca and can be accessed by clicking on the link under the Investor Resources heading on the bottom navigation bar.


