July - September 2014 Vol : 8 Issue : 3 Esri India Magazine FOR PRIVATE CIRCULATION, NOT FOR SALE www.esriindia.com Geo-enabling Digital India Geo-enabling Digital India Technical Article Technical Article Esri Brings Analytics to Urban Modeling for Smarter City Planning Esri Brings Analytics to Urban Modeling for Smarter City Planning Application Article Application Article Cover Stroy Cover Stroy State GIS: An Integrated & Collaborative Platform for Geo-enabling Governance State GIS: An Integrated & Collaborative Platform for Geo-enabling Governance Geo-enabling Digital India Geo-enabling Digital India 2014
Transcript
July - September 2014 Vol : 8 Issue : 3
Esri India Magazine
FOR PRIVATE CIRCULATION, NOT FOR SALE
w w w . e s r i i n d i a . c o m
Geo-enabling Digital IndiaGeo-enabling Digital India
Technical ArticleTechnical Article
Esri Brings Analytics to Urban Modeling for
Smarter City Planning
Esri Brings Analytics to Urban Modeling for
Smarter City Planning
Application ArticleApplication Article
Cover StroyCover Stroy
State GIS:
An Integrated & Collaborative
Platform for Geo-enabling
Governance
State GIS:
An Integrated & Collaborative
Platform for Geo-enabling
Governance
Geo-enabling Digital IndiaGeo-enabling Digital India
• Good knowledge on Administration of Oracle Enterprise server
• Good Knowledge on Administration of ArcGIS Server
• Plus point if worked on ArcFM Server also
• Should have experience in Publishing and Managing data and data services
• Good knowledge on Spatial data and formats of ESRI
• Awareness on Data security
• Good communication skills
Primary Skill
Location
Jaipur
3 - 8 years
Primary Skill
1. Senior Tech Support Executive Role:
Experience
Qualification
1
Requirement
Graduate/ Post Graduate
• Linux, ArcGIS Engine and Server (Javascript) development skill
• Excellent written and Speaking skills
Location
Hyderabad
• Knowledge of GIS technologies
Desired Skill
3 - 7 years
FR
OM
PR
ES
IDE
NT’S
DE
SK
03
The announcement of the ‘Digital India’ initiative by the Government is an important step in reforming the governance through the use of information technology with an aim to transform India into a digitally empowered society and knowledge economy. Digital India program,that spans across ministries and departments will enable electronic delivery of services to the citizens and will become the platform for the engagement between the government and the citizens.
Geographic Information System (GIS) provides a ‘Location Platform’. Location is an important parameter in virtually every aspect of governance – from identifying areas for investment, project planning, decision making, implementation-monitoring and citizen engagement. This makes GIS a key component of governance and service delivery. GIS will play an important role in the roll-out of the Digital India vision.
Government also announced the vision to create 100 Smart Cities in the country.It is likely that some Smart Cities may be built by converting present cities, some by building satellite towns and some by building new cities. In all situations GIS will play an important role. Facets of Smart Cities like smart traffic management, smart security, intelligent lighting systems, smart utilities etc. will all require data collection devices like sensors; the number of sensors that a city may have may run into hundreds of thousands, if not in millions. The data captured through these sensors will have to be processed in near-real time and that makes it a Big-Data application. The integration of GIS with Big-Data will also be a key requirement in the management of smart cities.
Various ministries and departments are being encouraged to use Geo-spatial or GIS technology in their programs for planning, implementation and monitoring of the execution. GIS enables geo-graphical visualization of the information to support more informed and quick decision-making.This necessitates the need to set up a National GIS which would geo-enable Digital India. National GIS will enable the central and state governments to take a holistic view of the issues and help them in planning and monitoring of implementation. It will enable the government to deploy this technology to form the basis of all future planning and monitoring activities. National GIS will be the platform for implementation of various government programs and monitoring of the flow of the benefits to the targeted recipients.
In-line with the current vision of the government, we are aligning our 15th edition of Esri India User Conference with the theme “Geo-Enabling Digital India” The key objective at the conference is to explore how GIS has a very significant role to play in full-service orientation and become a core component in this digital infrastructure enabling the process of governance, planning, and nation building.
I extend my special invitation to the Esri India User Conferencewhich is being held in Delhi from 10th to 11th December, 2014. The conference has a track on Smart Cities as well. Esri India team looks forward to welcoming you to this conference.
Page No. 2Inner Front Cover
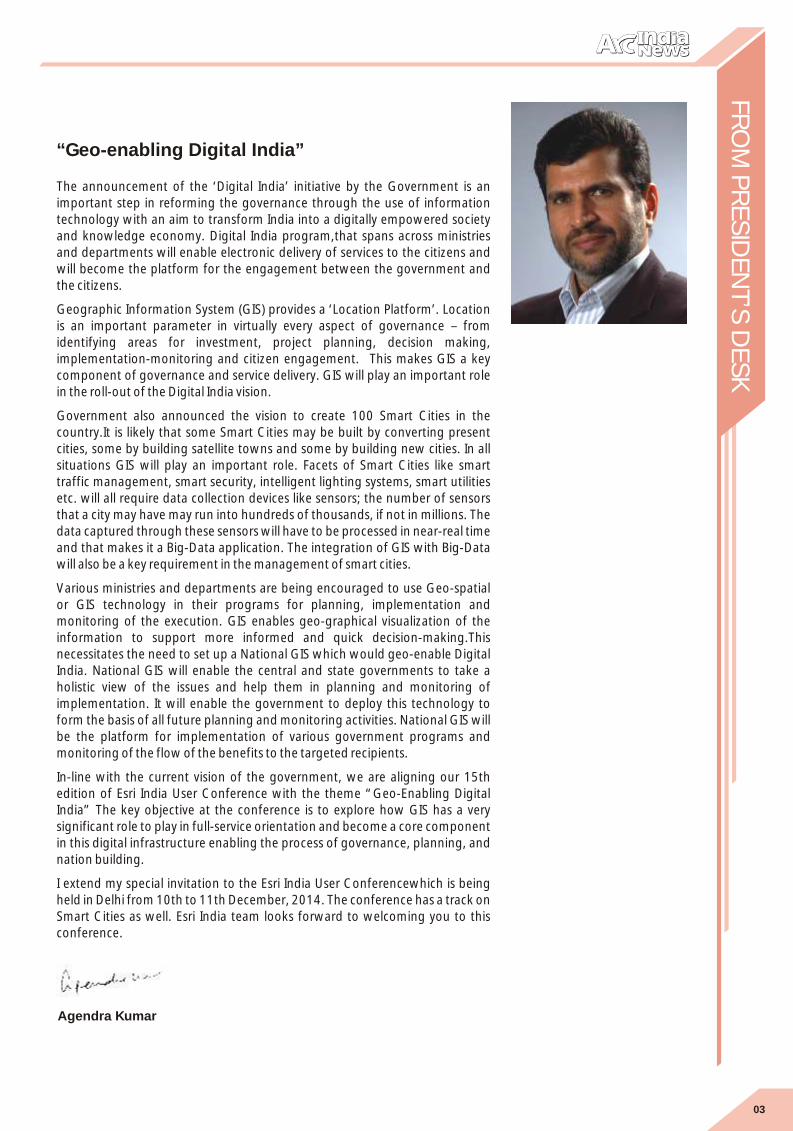
Agendra Kumar
“Geo-enabling Digital India”
NE
WS
Designed by:
Editorial and Content Coordination: Esri India Team
ISRO's Mars Orbiter Mission (MOM) is a resounding success, making India the first Asian country to be successful on its maiden Mars mission. We are also proud that our ENVI and ArcGIS have proven track record to process different planetary data including Mars, Moon and Mercury. Scientists from JPL NASA, ESA, DLR, USGS are using the high end image processing and mapping capacities of ENVI and ArcGIS for their day to day research.
European Space Agency is using ENVI and ArcGIS for the general workflow for planetary geological mapping of Mars for processing the data, including georeferencing.
JPL NASA uses ENVI/IDL combination to view and analyze this imagery, looking specifically for subtle differences in the way light is reflected off rocks to help explain Martian mineraology. Using ENVI, the spectral data being transmitted from the MastCam, perform PCAs, decorrelation stretches, extraction of reflectance spectra, radiometric and atmospheric calibration. Planetary geologists from Paris’ Institute of Physique of the Earth used ENVI for most of their image processing needs, including:
• Extracting raw data and presenting models of Martian surface features
• Creating image mosaics - compilations of multiple images
• Creating classified maps categorizing different types of land cover
• Creating DEMs (Digital Elevation Models), which provide spatially accurate, 3-D representations
Researchers are able to use remotely sensed data and create accurate representations and analyses to understand the topography of Mars, in turn understanding more about the Earth.ENVI is easily customized using IDL - the team has built in functionality available and flexibility to create custom functionality in the same package.Scientists from many different disciplines working on the project can collaborate and use the same tools - IDL and ENVI - for their analyses
Esri India speaks to India Infoline about the
growing GIS Industry
Speaking with Yash Ved of India Info Line, Agendra Kumar, President, Esri India says that the GIS industry is expected to grow in 9-10% range. We expect better than the industry growth for the current fiscal for our company.
Looking at the fresh moves from the new government, he mentioned, the new government has spoken about the smart cities. We are focused on smart cities. With this step, more investment will come into areas like Smart Utilities -electricity, water and gas; Traffic management; roads and highways; public safety etc. Government is also encouraging the use of GIS and Geospatial technology in policy implementation, governance and in providing better service to the citizens.
Directing towards the key trends driving the growth
for GIS sector, Agendra Kumar said GIS being an enabling technology is making inroads into newer application areas. For example telecommunication, banking and insurance, retail and real estate companies are looking to use GIS for analytics and improved decision-making. GIS is now available through the web and through the mobile devices like tablets and smart phones. These advancements make it possible for the people to use their GIS systems from any device, from anywhere and at any time. This is transforming the way we work.
GIS as an enterprise technology platform: All departments in an organization deal with location data. They use different enterprise applications that have location data. GIS integrates with theose enterprise applications and enables to do more with the data they
already have. Web Availability: GIS is now available through the web. People can build their GIS applications, carry on with their work on the web and share it across the organization. Web GIS is making it possible for non-GIS professionals also to build simple GIS applications in an
easy and cost effective manner. GIS systems are getting
bigger: They are holding and managing more information, supporting more applications, and results in leveraging the investments already made in the data and provide more benefits within organizations.
The volume of geospatial data that's coming from different sources is growing exponentially. Apart from the data that comes from satellites and airborne digital cameras, LIDAR, photogrammetry etc., there are data streams that come from social networks like Twitter, Facebook etc. that can be analysed in real time and presented as part of GIS systems. Seeing these upcoming
trends the current GIS market in India is expected to grow at a CAGR of 8.19% during year 2012-2016
Esri, a market leader in geographic information system (GIS) mapping technology, sees a big opportunity in India as Narendra Modi-led government embarks on its plan to develop 100 smart cities on the lines of developed countries.
While the US giant hopes to expand its operations in both public and private sectors, it believes that GIS technology and applications can help at every stage of development — planning, designing, decision making, network analysis and monitoring to create better infrastructure, modern residential colonies, 24*7 power and water distribution, organised law enforcement, eco-friendly industrial development, intelligent traffic management, effective water conservation, disaster management and quality health facilities.
Esri global president Jack Dangermond said, "In India, many customers are building their geographic knowledge base. There is a larger realization with the people talking about GIS as a platform across government agencies. Our job is to support these agencies and government by providing them best technology and help them in their vision of building a better India"
Esri Brings Analytics to Urban Modeling for Smarter City
Planning
TE
CH
NO
LOG
Y U
PD
ATE
06
sri brings together the power of GIS Eanalytics and the
beauty of 3D urban modeling in its latest release of CityEngine. Now urban designers and architects can create 3 D m o d e l s w i t h CityEngine and export parts of the model into Esri ArcGIS software for spatial analysis. This provides urban planners, designers, and citizens easy to understand i n t e l l i g e n c e f o r improving their cities.
ArcGIS provides deep insight into an urban scenario while CityEngine creates realistic digital 3D models. Now designers can create a shape on a CityEngine model, export that shape into ArcGIS, and then use powerful analytical tools to evaluate the impact the proposed building will have on the city.
ArcGIS allows planners to see how the building would cast its shadow at different times of the day throughout the year. They can study the view of the building within the context of other nearby structures and measure the amount of sky that can still be seen. They can also analyze solar exposure for solar energy or locate potential heat corridors.
Designers can easily share their models online with stakeholders or the public by creating CityEngine web scenes. A web scene is an interactive 3D version of a web map. It is
Designers Can Better Analyze CityEngine Models in ArcGIS sri updated its ArcGIS Runtime Software Deve lopment K i ts (SDKs) wi th Eimprovements that will help increase
your productivity. ArcGIS Runtime SDKs run on all major platforms and now have offline functionality. These SDKs provide tools for developers to embed mapping into existing applications or build native, focused client applications for desktop and mobile.
For easier access, developers can now download ArcGIS Runtime SDKs from one central location at the ArcGIS for Developers site. The site hosts ArcGIS for Runtime for a variety of platforms, including iOS, Android, Java, Mac OS X, Windows Presentation Foundation (WPF), and Qt. A beta version of the ArcGIS Runtime SDK for .NET is also available.
Offline functionality is now available in ArcGIS Runtime SDKs. This includes working with content like basemaps and operational data locally on your device when network connectivity is poor or nonexistent. Developers can implement offline capabilities in their custom apps for searching, feature editing, geocoding, routing, syncing, and downloading basemap tiles.
Significant documentation improvements have also been made in the latest release. Esri created easier browsing pathways and added new topics to its redesigned documentation. All help information is in one place, making it easier to find answers to all your questions.
sent with a web viewer so the end user does not need additional software. The designer uploads the web scene to the Esri ArcGIS Online platform or to a proprietary server and then shares the URL with anyone.
CityEngine web scenes are very helpful for proposing structures and encouraging community feedback. Anyone with a WebGL-enabled browser can immediately interact with the web scene. End users can fly around a 3D city, through streets, around buildings, and overhead to see the scenario from every angle. They can also turn on and off scene layers to see a proposed building, a street with or without trees, and more. A sunlight impact tool shows where a proposed building will cast a shadow at what time of year, during different times of the day, and for how long. Esri ArcGIS analytic tools and CityEngine bring vision to planning
Esri CityEngine Increases the Power of Virtual Design
Architects, planners, and urban designers can make better decisions by using CityEngine to create more realistic city models and share them on the web with decision makers and the public.The design tool integrates with the ArcGIS platform. A greater level of interoperability has been built into the latest version, which increases design potential. Developers have also strengthened the product's stability, enhanced street creation functions, and added an open-space tool for more accurate architectural design.
Among the new features in CityEngine is the library of design rules for facades, buildings, and streets. These preconfigured rules make it possible for users to spend more time designing
models and less time coding the rules for them. To add another level of realism to the model, developers can use CityEngine SDK sample plug-ins to interact with the popular game engine Unity or other 3D software such as Maya. Developers can find these samples and download the CityEngine SDK at GitHub.
Finally, the CityEngine web viewer makes it easier to share and study 3D designs. Users can see urban features up close and from every angle to better understand how proposed buildings and landscapes will impact citizens and neighborhoods
For more information on CityEngine, visit esri.com/cityengine.
ArcGIS Runtime SDKs Increase Productivity
Build Custom Apps That Let Users Work Offline
sri recently released a web app called GeoPlanner for ArcGIS that brings Ethe power of geodesign to land-
based planning. GeoPlanner for ArcGIS is a JavaScript-based application that requires no plug-ins and has been designed to run in web browsers on both desktop and standard-sized tablet devices supporting a minimum 1024 x 768 resolution.
GeoPlanner for ArcGIS incorporates each aspect of a complete p lanning workflow—project creation, data identification, comparative analysis, and reporting—into a single web-based application. The app helps planners from a wide range of industries create and report on alternative planning scenarios to make geographically informed decisions. GeoPlanner for ArcGIS comes with several ready-to-use planning templates for land-use planning, special event planning, and more, and it can be easily configured
Developers can get their app to market quickly using the same development and deployment model across all the Runtime SDKs with unified licensing. You can download any of the Runtime SDKs at no cost and will have access to Basic and Standard functionality for development and testing purposes. To deploy your app for offline use, you must license your application at the Standard level.
For more information on ArcGIS Runtime SDKs, visit esri.com/runtime
GeoPlanner for ArcGIS Enables Resilient Design
Create and Share Plans Easily with EsriGeodesign Application
Esri's latest 3D GIS Design Software Makes Working with Complex 3D Urban Environments Easier and Faster
using ArcGIS for Desktop to meet the needs of your specific industry or organization
TE
CH
NO
LOG
Y U
PD
ATE
07
Esri Brings Analytics to Urban Modeling for Smarter City
Planning
TE
CH
NO
LOG
Y U
PD
ATE
06
sri brings together the power of GIS Eanalytics and the
beauty of 3D urban modeling in its latest release of CityEngine. Now urban designers and architects can create 3 D m o d e l s w i t h CityEngine and export parts of the model into Esri ArcGIS software for spatial analysis. This provides urban planners, designers, and citizens easy to understand i n t e l l i g e n c e f o r improving their cities.
ArcGIS provides deep insight into an urban scenario while CityEngine creates realistic digital 3D models. Now designers can create a shape on a CityEngine model, export that shape into ArcGIS, and then use powerful analytical tools to evaluate the impact the proposed building will have on the city.
ArcGIS allows planners to see how the building would cast its shadow at different times of the day throughout the year. They can study the view of the building within the context of other nearby structures and measure the amount of sky that can still be seen. They can also analyze solar exposure for solar energy or locate potential heat corridors.
Designers can easily share their models online with stakeholders or the public by creating CityEngine web scenes. A web scene is an interactive 3D version of a web map. It is
Designers Can Better Analyze CityEngine Models in ArcGIS sri updated its ArcGIS Runtime Software Deve lopment K i ts (SDKs) wi th Eimprovements that will help increase
your productivity. ArcGIS Runtime SDKs run on all major platforms and now have offline functionality. These SDKs provide tools for developers to embed mapping into existing applications or build native, focused client applications for desktop and mobile.
For easier access, developers can now download ArcGIS Runtime SDKs from one central location at the ArcGIS for Developers site. The site hosts ArcGIS for Runtime for a variety of platforms, including iOS, Android, Java, Mac OS X, Windows Presentation Foundation (WPF), and Qt. A beta version of the ArcGIS Runtime SDK for .NET is also available.
Offline functionality is now available in ArcGIS Runtime SDKs. This includes working with content like basemaps and operational data locally on your device when network connectivity is poor or nonexistent. Developers can implement offline capabilities in their custom apps for searching, feature editing, geocoding, routing, syncing, and downloading basemap tiles.
Significant documentation improvements have also been made in the latest release. Esri created easier browsing pathways and added new topics to its redesigned documentation. All help information is in one place, making it easier to find answers to all your questions.
sent with a web viewer so the end user does not need additional software. The designer uploads the web scene to the Esri ArcGIS Online platform or to a proprietary server and then shares the URL with anyone.
CityEngine web scenes are very helpful for proposing structures and encouraging community feedback. Anyone with a WebGL-enabled browser can immediately interact with the web scene. End users can fly around a 3D city, through streets, around buildings, and overhead to see the scenario from every angle. They can also turn on and off scene layers to see a proposed building, a street with or without trees, and more. A sunlight impact tool shows where a proposed building will cast a shadow at what time of year, during different times of the day, and for how long. Esri ArcGIS analytic tools and CityEngine bring vision to planning
Esri CityEngine Increases the Power of Virtual Design
Architects, planners, and urban designers can make better decisions by using CityEngine to create more realistic city models and share them on the web with decision makers and the public.The design tool integrates with the ArcGIS platform. A greater level of interoperability has been built into the latest version, which increases design potential. Developers have also strengthened the product's stability, enhanced street creation functions, and added an open-space tool for more accurate architectural design.
Among the new features in CityEngine is the library of design rules for facades, buildings, and streets. These preconfigured rules make it possible for users to spend more time designing
models and less time coding the rules for them. To add another level of realism to the model, developers can use CityEngine SDK sample plug-ins to interact with the popular game engine Unity or other 3D software such as Maya. Developers can find these samples and download the CityEngine SDK at GitHub.
Finally, the CityEngine web viewer makes it easier to share and study 3D designs. Users can see urban features up close and from every angle to better understand how proposed buildings and landscapes will impact citizens and neighborhoods
For more information on CityEngine, visit esri.com/cityengine.
ArcGIS Runtime SDKs Increase Productivity
Build Custom Apps That Let Users Work Offline
sri recently released a web app called GeoPlanner for ArcGIS that brings Ethe power of geodesign to land-
based planning. GeoPlanner for ArcGIS is a JavaScript-based application that requires no plug-ins and has been designed to run in web browsers on both desktop and standard-sized tablet devices supporting a minimum 1024 x 768 resolution.
GeoPlanner for ArcGIS incorporates each aspect of a complete p lanning workflow—project creation, data identification, comparative analysis, and reporting—into a single web-based application. The app helps planners from a wide range of industries create and report on alternative planning scenarios to make geographically informed decisions. GeoPlanner for ArcGIS comes with several ready-to-use planning templates for land-use planning, special event planning, and more, and it can be easily configured
Developers can get their app to market quickly using the same development and deployment model across all the Runtime SDKs with unified licensing. You can download any of the Runtime SDKs at no cost and will have access to Basic and Standard functionality for development and testing purposes. To deploy your app for offline use, you must license your application at the Standard level.
For more information on ArcGIS Runtime SDKs, visit esri.com/runtime
GeoPlanner for ArcGIS Enables Resilient Design
Create and Share Plans Easily with EsriGeodesign Application
Esri's latest 3D GIS Design Software Makes Working with Complex 3D Urban Environments Easier and Faster
using ArcGIS for Desktop to meet the needs of your specific industry or organization
PR
OD
UC
T R
EV
IEW
Esri MapStudio
08
PR
OD
UC
T R
EV
IEW
sri MapStudio is a web-based mapping application that provides the data and GIS tools that allow you to create presentation- and publication-quality maps without E
having to maintain the data or load GIS software onto your system. Esri's MapStudio takes the guesswork out of creating high-quality, quick turnaround maps for news media, advertising, direct marketing, publishing, and organizations that want to add maps to their literature.
GIS is becoming an integral way to convey the context and meaning of the news.
GIS provides:
• Unbiased reporting that lets you display patterns and trends with clear infographics.
• Geospatial analysis to investigate stories. Quickly explore demographic data to provide human context to other data.
• Localized news makes the news personal by reporting on information from a neighborhood level.
Esri MapStudio allows media outlets to create maps related to breaking news stories anywhere in the world. Esri MapStudio provides access to terabytes of worldwide data, and you can easily integrate your own data.
Journalists and editors use GIS in a number of ways:
• Creating valuable graphic images that help tell compelling
stories.
• Researching in-depth information for articles.
• Managing distribution networks targeted advertising campaigns, and customer analytics.
Maps created with Esri MapStudio can be edited in standard illustration software such as Adobe Illustrator, Adobe Photoshop, or Macromedia FreeHand, as well as ArcGIS Desktop software. Custom icons or unique symbols can also be uploaded to further customize the look of your maps.
Esri MapStudio helps you quickly create detailed, data rich maps to illustrate and supplement stories.
Designed for large and small media outlets, Esri MapStudio helps provide a geographic framework to tell a more compelling, engaging story.
Esri MapStudio provides extensive geographic and demographic data combined with leading mapping technology. An easy-to-use web-based interface lets you find locations, add markups, choose layers, refine maps, and output editable files for use in illustration software. With Esri
MapStudio, you will create great looking maps your readers will love.
Leading Online Mapping Technology
• Esri MapStudio is built on the ArcGIS Online platform and combines leading, easy-to-use, Web based mapping software with high-quality content.
• Search for and find, geocode, or zoom into locations.
• The place finder in Esri MapStudio recognizes millions of place names. A built-in geocoder means Esri MapStudio can locate addresses or intersections anywhere in the country.
• Create your own markup.
• Whether you want to track crimes in your community or maintain a list of local gas prices, you can create those points, lines, polygons, or text using Esri MapStudio and store them so others in your organization can access them.
Extensive Selection of Data and Content
• Esri MapStudio includes an abundance of information about geography and people.
• Population, income, election data, and other types of content are available.
• Map layers not only include basic political boundaries, roads, and waterways but also contain topographic relief, satellite images, and vegetation maps.
Crop, Project, Design, and Export
• Layers chosen in Esri MapStudio can become independent
graphic layers in your illustration software.
• Hundreds of projection options are available.
• Maps can be cropped to a specific size.
• Support for the output of multiple graphic file formats including EPS and Al for use in illustration software such as Adobe Illustrator.
How Esri MapStudio Works
1. Find a Place
Find millions of places by entering a keyword search or address, or by simply zooming and panning around the map interface.
2. Choose Layers
Once you land on the area of interest, turn on and off data layers showing different levels of detail or thematic maps such as weather, terrain, or demographics.
3. Create Markups
Create your own markup layers in Esri MapStudio and store them for future use such as restaurants reviewed or crimes reported.
e te s to rL t r Edito sDear Readers,
This section of Letters to Editors has been an important section of Arc India News and your comments/suggestions are valuable
to us. We would like to have the opinion and feedback of all our readers with respect to the content being published and how its
has been useful to them in day to day GIS advancement. You may also let us know what you expect to see in terms of application
and technology in the magazine.
Letters to Editors may be edited for length and/or clarity and may be published or republished by us in any format or medium
and /or licensed to others for publication. If we publish your letter, we may attribute it to you and may include your name and
city, unless you expressly request that you remain anonymous. Please share your thoughts with us at [email protected].
Editorial Board
4. Refine and Output
When your map is ready, you can modify colors, type styles, and choose different projections and crop.
Esri MapStudio supports the output of multiple graphic file formats including EPS and AI that can be opened in illustration software such as Adobe Illustrator
PR
OD
UC
T R
EV
IEW
Esri MapStudio
08
PR
OD
UC
T R
EV
IEW
sri MapStudio is a web-based mapping application that provides the data and GIS tools that allow you to create presentation- and publication-quality maps without E
having to maintain the data or load GIS software onto your system. Esri's MapStudio takes the guesswork out of creating high-quality, quick turnaround maps for news media, advertising, direct marketing, publishing, and organizations that want to add maps to their literature.
GIS is becoming an integral way to convey the context and meaning of the news.
GIS provides:
• Unbiased reporting that lets you display patterns and trends with clear infographics.
• Geospatial analysis to investigate stories. Quickly explore demographic data to provide human context to other data.
• Localized news makes the news personal by reporting on information from a neighborhood level.
Esri MapStudio allows media outlets to create maps related to breaking news stories anywhere in the world. Esri MapStudio provides access to terabytes of worldwide data, and you can easily integrate your own data.
Journalists and editors use GIS in a number of ways:
• Creating valuable graphic images that help tell compelling
stories.
• Researching in-depth information for articles.
• Managing distribution networks targeted advertising campaigns, and customer analytics.
Maps created with Esri MapStudio can be edited in standard illustration software such as Adobe Illustrator, Adobe Photoshop, or Macromedia FreeHand, as well as ArcGIS Desktop software. Custom icons or unique symbols can also be uploaded to further customize the look of your maps.
Esri MapStudio helps you quickly create detailed, data rich maps to illustrate and supplement stories.
Designed for large and small media outlets, Esri MapStudio helps provide a geographic framework to tell a more compelling, engaging story.
Esri MapStudio provides extensive geographic and demographic data combined with leading mapping technology. An easy-to-use web-based interface lets you find locations, add markups, choose layers, refine maps, and output editable files for use in illustration software. With Esri
MapStudio, you will create great looking maps your readers will love.
Leading Online Mapping Technology
• Esri MapStudio is built on the ArcGIS Online platform and combines leading, easy-to-use, Web based mapping software with high-quality content.
• Search for and find, geocode, or zoom into locations.
• The place finder in Esri MapStudio recognizes millions of place names. A built-in geocoder means Esri MapStudio can locate addresses or intersections anywhere in the country.
• Create your own markup.
• Whether you want to track crimes in your community or maintain a list of local gas prices, you can create those points, lines, polygons, or text using Esri MapStudio and store them so others in your organization can access them.
Extensive Selection of Data and Content
• Esri MapStudio includes an abundance of information about geography and people.
• Population, income, election data, and other types of content are available.
• Map layers not only include basic political boundaries, roads, and waterways but also contain topographic relief, satellite images, and vegetation maps.
Crop, Project, Design, and Export
• Layers chosen in Esri MapStudio can become independent
graphic layers in your illustration software.
• Hundreds of projection options are available.
• Maps can be cropped to a specific size.
• Support for the output of multiple graphic file formats including EPS and Al for use in illustration software such as Adobe Illustrator.
How Esri MapStudio Works
1. Find a Place
Find millions of places by entering a keyword search or address, or by simply zooming and panning around the map interface.
2. Choose Layers
Once you land on the area of interest, turn on and off data layers showing different levels of detail or thematic maps such as weather, terrain, or demographics.
3. Create Markups
Create your own markup layers in Esri MapStudio and store them for future use such as restaurants reviewed or crimes reported.
e te s to rL t r Edito sDear Readers,
This section of Letters to Editors has been an important section of Arc India News and your comments/suggestions are valuable
to us. We would like to have the opinion and feedback of all our readers with respect to the content being published and how its
has been useful to them in day to day GIS advancement. You may also let us know what you expect to see in terms of application
and technology in the magazine.
Letters to Editors may be edited for length and/or clarity and may be published or republished by us in any format or medium
and /or licensed to others for publication. If we publish your letter, we may attribute it to you and may include your name and
city, unless you expressly request that you remain anonymous. Please share your thoughts with us at [email protected].
Editorial Board
4. Refine and Output
When your map is ready, you can modify colors, type styles, and choose different projections and crop.
Esri MapStudio supports the output of multiple graphic file formats including EPS and AI that can be opened in illustration software such as Adobe Illustrator
11
CO
VE
R S
TO
RY
CO
VE
R S
TO
RY
10
he Digital India initiative by the Government aims at reforming Government through technology and provides Electronic Delivery of Services (EDS). Digital T
India will transform India into a digitally empowered society and knowledge economy. It will transform the entire ecosystem of public services through the use of information technology. Digital India covers multiple government ministries and departments. It weaves together a large number of ideas and thoughts into a single, comprehensive vision so that each of them forms a part of a larger goal. It will make technology the vehicle to enable change.
According to Department of Electronics and Information Technology, Government of India, Digital India is centred on three key areas:
• Digital Infrastructure as a utility to every citizen
• Governance and services on demand
• Digital empowerment of citizens
Digital India will be coordinated by Department of Electronics & Information Technology and implemented by the entire government.
Geo-enabling Digital India
Geographic Information Systems are becoming a catalyst for several transformational changes in the world; primarily in natural resource management, planning, decision making, governance and citizen engagement. Location is an important parameter in virtually every aspect of the functioning of the government and hence GIS would always be a critical component of most of the mission mode projects conceptualized and implemented by the government. While e-governance is the current paradigm, the future lies in embedding GIS in governance and service delivery. GIS forms an important component of the Digital India project and should be leveraged for decision support systems and development.
Application of GIS can play key role in implementation of various government programs and build an effective review and monitoring mechanism. It will provide a new paradigm in decision making by enabling geographical visualization and representation of information. GIS based decision making is an important component of electronic service delivery. It will
help the bureaucrats in taking more informed decisions leading to:
• Strengthening of governance
• Enhanced transparency
• Improvement in citizen services
GIS has been in use in India for more than two decades and forms the core of several mission critical projects in the government and private sector. However, the deployment has been at departmental level with minimal integration resulting in creation of silos and restricting the benefits. Some of the issues with the current scenario are:
• Very little collaboration and sharing of data between departments leading to duplication in data creation. This results in not only cost escalation but also delays in project implementation
• Lack of standards because of which data cannot be shared between various users
• Absence of a common data model to facilitate scalability and extensibility
• Some of the data available with data creators is not GIS ready and needs to be reengineered before it is deployed in GIS projects
• Absence of a platform to disseminate data and services
• Shortage of skilled GIS manpower which constraints adoption of GIS by the user departments
Now is the opportunity for the country to consolidate the work already done and build a comprehensive system that will enable g-governance and bring wide ranging benefits.
Keeping in mind the importance of geospatial content in achieving the growth objectives of the country, there is a need to set up a National GIS which would geo-enable Digital India. National GIS will enable the central and state governments to take a more integrated view of the issues and challenges and build comprehensive plans to deal with them. It will enable the government to deploy this technology to form the basis of all future planning and monitoring activities. National GIS will be the platform for integration of various programs and will facilitate a more holistic view of the developmental projects.
Key Attributes of National GIS
The mission of National GIS should be to embed GIS into various electronic services extended to citizens under the Digital India project. It should provide a platform to enable consumption of spatial data by various e-governance applications thereby bringing in geographic dimension in decision making and service delivery. It should also provide a decision support system which will integrate geospatial content into various business processes of the government. State government should be an active partner by way of State GIS which should be seamlessly integrated with the National GIS.
The core of National GIS will be a Cloud based service delivery platform which will host:
• GIS ready data sets – vector maps with attribute data, geo-referenced satellite imagery for visualization, thematic maps products, et al
• A host of applications for rendering various services to the citizens
• Decision support systems to enable more informed decision making by bureaucrats
• APIs to integrate external applications
National GIS should also encourage private sector to enrich the existing data sets by creating value added products and hosting them on the National GIS platform. Citizen engagement by way of crowd sourcing of both content and applications will further strengthen the platform. State GIS, which would be an integral part of the federated system, should participate both by contributing state level data as well as consume baseline data hosted on the National GIS platform. This approach will also leverage the enormous work done by the state governments in building state level data and also developing applications and deploying them.
We should also build a mechanism to access and integrate the spatial data created by various projects like R APDRP, NUIS, WRIS, NLRMP, et al. We should also access the rich data created by the industry and bring it into the National GIS infrastructure. The existing data sets may have to be reengineered to facilitate migration to the National GIS framework and geodatabase. In addition, existing business processes of various government departments will have to be reengineered in order to embed GIS into them and also their hosting on the National GIS platform. Further, instead of reinventing the wheel we should review the existing GIS based applications developed by states and central government users and extend their usage to others after carrying out the necessary enhancement to web enable them. This way we would be able to leverage the best practices developed across the country.
Virtually every department of the central and state governments would leverage the power of GIS by accessing and consuming the services hosted on it. Some of the major users would include Watershed Management, Land, Roads & Highways, Health, Education, Urban Local Bodies, Disaster Management, Utilities, Mining, Water Resources, Panchayati
Raj, Rural Development, et al.
The Vision document developed by the Interim Core Group created by the Planning Commission under the chairmanship of Secretary, Ministry of Earth Sciences provides a good direction for the vision and mission for National GIS. It may be reviewed and amended keeping in mind the objectives of Digital India and also the advancements in technology. We should also have a look at the work being done in other countries which are developing similar programs.
Roadmap to National GIS:
Some of the immediate steps would be:
• Creation of National GIS framework and common data model for all the GIS assets
• Development and publishing of various standards for adoption by all the stakeholders
• Reengineering of the existing data sets available with National Mapping Agencies to comply with the requirements of the National GIS
• Creation of necessary regulatory framework to enable:
• Collaboration and sharing of data
• Dissemination of data and services from the Cloud
• Maintenance of data sets by designated agencies
• Crowd sourcing for content and applications
• Creation of institutional framework to operationalize and manage National GIS
• Conduct a pilot project to demonstrate NGIS platform concept. It should include not more than three central government ministries and three states. The pilot will involve setting up the platform, getting sample data GIS ready and building applications to embed GIS into existing processes
• On successful completion of the pilot extend it to other ministries and states.
• Engage with academic institutions to build capacity in user organisations and make them ready for National GIS
Of course, the starting point would be to induct a visionary leader to lead this extremely important project.
In conclusion, National GIS will be a critical component of the transformational Digital India project. By geo-enabling the e-governance projects. It will embed geographic dimension into various services being delivered by the government to the citizens. It will also introduce location as an important parameter in the decision making process thereby making it more comprehensive and holistic. It will be a system of systems which will consolidate the work already done by the states and central government in establishing GIS at ministry and departmental level and align it to the larger goal of transforming India into digitally empowered society and knowledge economy
Rajesh C Mathur, Esri India
Author:
CO
VE
R S
TO
RY
16 13
State GIS: An Integrated & Collaborative Platformfor Geo-enabling Governance
tate Governments have identified IT as a major thrust area for the growth and development of the state. State SGovernments are taking all possible measures for
implementing e-Governancethroughout the state, covering all the sectors with a view to provide hassle free, transparent and efficient service to the common man (both in Urban and Rural areas).As part of the goal for adopting good Governance, State Governments have introduced a number of initiatives including Geo-enabling Departments for effective Governance.
GIS is a powerful platform that facilitates all requirements of effective Decision Support Systems.
Key Challenges
Although, Geo-spatial technology is in use at various levels in different departments but potential of the Geospatial technology has not yet been explored in public administration & governance for planning and effective decision support owing to following challenges:
• Non availability of any standard state policy with regard to use of geo-data
• Lack of awareness among the stakeholders regarding the use of geo-spatial data
• Lack of qualified and trained manpower having expertise in Geospatial system
• Non availability of structured data
• GIS initiatives are only visible in silos and are not extended in a collaborative and pervasive way
• Collating and validating data is a cumbersome activity
• Restrictions imposed by various line departments does not allow public usage of Geospatial data / information
• Effort duplication and lack of transparency
• Non availability of high resolution maps in the state departments
• No standard mechanism for data integrity and updation
• Lack of a collaborative and integrated Geo-Spatial Platform
The objective of State Governments is to overcome/address these challenges by way of a new paradigm for sustainable development as well as to support a new model of g-Governance through a comprehensive GIS based Decision Support Systems (DSS) as State GIS. It would be crucial that the new implementation extends the characteristics of being
integratable, collaborative, open and scalable in order to meet the current GIS aspirations of the state as well as
amenable to new paradigm of computation such as cloud.
State GIS: A Technology Vision
State GIS is expected to provide a single gateway for integrated view of information across all state agencies for local level planning. This will facilitate a single window service to citizens to increase the efficiency and productivity of all department/agencies such as Agriculture, Medical & Health, Law Order & Police, Energy & Utilities, Revenue & Commercial
Introduction
UN
IQU
E A
PP
LIC
ATIO
N
12
UN
IQU
E A
PP
LIC
ATIO
N
Taxes, Water & Waste water, Environment & Forestry. It will further support to develop and maintain up-to-date geospatial and non-geospatial data sets for dissemination of right information to the right people (including govt. agencies, NGOs, RWAs, private sector and citizens) at right time for faster analysis and decision making. The system needs to be designed with open standards & work flows to facilitate interoperability with existing applications.
The primary objective of the State-GIS is to establish and implement a web based single gateway integrated GIS platform to access, acquire, process, store, distribute and improve the utilization of geospatial information through:
• Intelligent Web Services being generated and published by various agencies
• Advanced Tools for GIS based analysis
• Web & Mobile Maps & Apps
• Segment Specific Solution Templates
• Executive Dashboards and
• Spatial Information for further integration with other enterprise applications and empowering citizens.
In the way of building the state-wide platform for State-GIS, we have to assess various components such as satellite imagery, thematic maps, geo-tagged socio-economic data etc. which are already available with state agencies (different departments), and require to be brought up to a seamless, integrated standard.
Hence, the establishment of “State-GIS” is envisaged for the State to:
• Leverage Geo-Spatial technology to support the accelerated implementation & monitoring of projects through implementation of Enterprise GIS solutions for efficient DSS and help aligning their objectives for national development
• Standardize geospatial datasets for national use, published via standard web services
• Implement Geo-enabled Decision Support Systems aligned with objectives of national development
• To be a major support to GOVERNANCE by embedding GISin all aspects of planning and development at national/ district / local levels; bringing transparency and geo-spatial information support in decision-making; enable a sound process of monitoring development and identifying “gaps in development”; make GIS data available at all levels –that helps bringing accountability and responsibility in governance
• Create a portfolio of GIS projects to improve services at reduced costs
• Reforming the government to increase effectiveness of flagship programs and in achieving the objective of greater performance and productivity
• Facilitate collaboration and knowledge sharing among departments
• Serve the basic needs of citizens by providing access to
nation-wide maps / image / geo-spatial information; geo-enabling governance and public services and also enabling a “crowd sourced” interactive process of citizen involvement in providing feed-back/ inputs
State – GIS: Key Elements
The major elements / pillars of the State GIS, includes specific activities. All these activities will be equally important for a holistic development and establishment of the State-wide GIS.
Following depicts the key Elements of State-GIS :
State-GIS Infrastructure
It comprise of GIS Platform and the computing and
networking infrastructure for the State GIS. The State-GIS platform is expected to be developed, hosted and maintained at State Data Centre.
State-GIS Assets
These are the seamless, state-wide GIS digital content layers equivalent to1:10,000 scale and better including maps and geo-tagged attributes/tabular data on demographics, natural resources, planning and development activities, infrastructurea nd other sectorial datasets. It is also proposed to allow crowd-sourced geo-taggeddata content into the State-GIS as an additional “citizen-layer” where citizens can populate their datasets/grievance-points etc on the GIS frame.
In addition to integration of existing Spatial & Legacy Data, access to a large number of Base maps, Web Services, Live Feeds are also required to be integrated.
State-GIS Portal and DSS Applications
It will provide a Single Gateway access and a Service
Platform to different State line departments in government; target groups in private enterprises and also for citizens. The State GIS DSS would also be integrated with the proposed National-GIS framework.
State-GIS will be implemented as a Single Gateway
Platform to
• Access Spatial data/Web services generated and published by various agencies
• Access and use tools for GIS based analysis
• Create Web Maps, Web Applications & Mobile Applications
• Associate / Build Solutions using Templates
• Host Executive Dashboards and
• ShareSpatial information with agencies for further integration with various applications.
Possible applications are as
follows:• Geo - Planning - for Planning
Department and the State Planning Board for supporting the planning, monitoring and reviewing plans and development.
• Geo-Rural Development - for various rural development programmes of the Department of Rural Development.
• Geo-Urban Development - service to planning, management and development of different urban areas for departments of Urban Development bodies.
• Geo-Policing –for geo-enabling Law Enforcement and supporting Law & Order agencies.
• Geo-Transportation- for hosting PWD Services of Road
Information, Rails, Airways, Waterways etc. For information on Transport Planning, Routing & local commuting.
• Geo-Water Resources - to support identification of water authorities in identification of drinkable water and managing its supply and distribution.
• Geo-Disaster Management & Emergency Response - for supporting management of disasters at state level through SDMC / SDMA
• Geo-Agriculture –to support Department of Agriculture and Farm sector
• Geo-Irrigation –to support water resources department
• Geo-Horticulture- for Department of Horticulture for Horticulture crops and suitability analysis
• Geo-Forestry- to support & integrate applications implemented at Department of Forests
• Geo-Health– to support Health departmentin manage Health facilities
• Geo-Security– to support Police & Law Enforcement departmentsin enforcing Law & Order in the State
• Geo-Education–to support the Education department in
14
UN
IQU
E A
PP
LIC
ATIO
N
UN
IQU
E A
PP
LIC
ATIO
N
managing Education facilities
• Geo-Panchayats- to support PanchayatiState department
• Geo-Industry- for Industrial development and planning support, inputs, and cluster analysis and other decision support
• Provision for private sector GIS applications to be hosted and published on State-GIS
• Citizen access to State-GIS would be enabled through simple GIS Applications and integrated e-services.
• As part of the State-GIS, it is also planned to implement State-GIS Dashboards for key dignitaries such as CM Office (CMO) and Chief Secretary for high-level reviews / meets etc. and promote the GIS usage to key dignitary-Levels.
State-GIS Capacity building
Under Capacity Building, the State-GIS will ensure that benefits of GIS technologies are easily accessible and affordable to diverse users in governance, enterprises and citizens. Hence, a series of Trainings in Geo-Spatial Technologies will be required at different levels.
State GIS: Platform Overview
State GIS will act as Single gateway to facilitate and coordinate the exchange and sharing of geospatial data between stakeholders from various jurisdictional levels in the spatial data community such as medical and health, police, commercial taxes, utilities, water resource department, security agencies, forestry etc. With simple to use GUI, platform will be
implemented as a Single Gateway Access for accessing and sharing GIS contents & web services, spatial data, tools, templates, solution templates and web applications for Decision Support. The Platform will have capabilities of integrating information (spatial & non-spatial) from multiple sources (different departments), perform analysis and aid the concerned authorities in quick and effective decision making for State Government.
The sample snapshot of State GIS portal is shown below:
The solution will be developed over industry standard RDBMS solution, which will be a powerful, reliable support for an organization’s mission-critical applications of State-GIS along with flexible Internet deployment architecture, object capabilities, and robust data management utilities that ensure data integrity, data recovery, and data security.
State GIS Portal will provide a collaborative platform for sharing geo-spatial data and tools for publishing Web Apps behind organization's firewall and ensuring highly secured data sharing environment.
High Level Solution Architecture
State GIS Solution is recommended to be based on ArcGIS
Platform -Hybrid In-Premises Cloud, aSoA based distributed server architecture which supports creation, access, sharing & dissemination of Geo-Spatial Information i.e. web maps, apps, tools & services through a simple to use common platform.
This ArcGIS platform—combined not only with the government’s authoritative data but also its high-quality
maps, visualizations, spatial analysis, models, and other rich applications made available as geoservices — would lead to the creation
o f g o v e r n m e n t - t o -
citizen,government-to-
business, government-
t o - e d u c a t i o n , a n d
g o v e r n m e n t t o -
government applications that would integrate all levels of government and support open access, c o l l a b o r a t i o n , a n d transparency.
The proposed architecture i s a h igh-ava i lab i l i ty solution that will mask the
effects of the hardware or software failure and will maintain the availability of applications so that the perceived downtime for users can be minimized.
Solution Challenges & Key Benefits
Challenges
The government has to bring all user departments in consensus along with bureaucratic and political system to make this a success. The data layers are to be procured from various departments along with attributes sensitive for the efficient functioning of the geo-enabled services. The spatial and attribute data updation is very critical to maintain the authenticity and application usability which is critical for any geo-enabled application.
Key Benefits
• Standardized state-wise geospatial datasets, Geospatial web services, Geospatial data exchange formats, Geospatial data quality and Metadata
• A Geospatial Platform with a gallery of standardized datasets to allow state-wide use, published via standard
\ web services so that government and private sector entities and citizens at large have the same state level view of GIS data
• Collaborative platform for accessing & publishing contents in a secured way, utilize tools and solution templates for building segment specific solutions & dashboards.
• Seamless integration of standardized data warehouse covering spatial / non spatial information required by various levels of state and district administration. All organizations will benefit as it will save time, money, and eliminate duplication of efforts.
• Standardized modular GIS applications for planning, management, analyzing data repository for GIS based Decision Support System
• User friendly data capturing and update mechanism for improved accuracy and validity
• Promote "virtual geographic information" and transactional workflows that allow department users to remotely update and add content to designated layers.
• Inclusive access to State-wise GIS and its GIS-DSS by private enterprise and citizens – bringing the state onto a single GIS frame and oriented to an all-inclusive support to development activities;
• A designated State-wise entity to drive the effort, a g-data based governance model, an oversight board, providing accountability and transparency to the process, and institutionalized relationship with other government departments, private enterprise and citizens.
• Capacity building & empowering departments by development of expert level resources through structured trainings at various levels
16
INTE
RV
IEW
INTE
RV
IEW
17
1.Today nation needs a GIS based decision support for
governance, enterprises and citizens. Would you like to
elaborate on this?
2.How is State GIS going to be different from National
GIS?
GIS today is the need of the hour. ‘Digital India’ is one of the important programs of the government with a vision to transform the entire ecosystem through the use of latest Information Technology, into a digitally empowered society and knowledge economy. There has been special emphasis from the Prime Minister’s office to use space based technologies such as GIS, GPS etc for various e governance programs which are currently not part of decision making process.Worldover GIS has been seen as a nerve system of planning and many innovative applications have been aligned using GIS for the purpose of governance, enterprises and citizen. The concept of GIS, though well appreciated, its deployment or use has not yet taken off in India.There is need to have a robust spatial information support infrastructure to aid decision making process for planning and implementation for various egovernance programs. In absence of such infrastructure, the source of spatial data is from Google, Microsoft, ESRIetc.These products provide rich satellite view andmap content, however of these for governance requirements is a big question. I, therefore, feel that Digital India Program has rightly emphasized on need of GIS around which decision support systems can be built.
Over the years India has created a good knowledge-base for adoption of GIS technology. This knowledge exists in pockets. For example we have spatial data policies, satellite image portal from DOS, Maps from NIC , SOI, GSI along with large number of MIS systems functional in different domains at national and state levels. A functional GIS however emphasizes on need of a common framework from which government professionals and citizens can better understand the complex workings of their nation and take informed action. A single large system to emerge may take long time. The initiative should be from state and national level to standardize and harmonize the process in due course of time while we talk about national GIS.
The potential of GIS for decision-support for planners, governance-process, decision-makers, citizens and many others is infinite. Some of the initiatives have certainly been successful to prove GIS application potentials through specific objectives but GIS is yet to get assimilated and become a part of the process of governance, planning and nation-building in a significant manner
Dr. Vandana Sharma, Deputy Director GeneralHead, Remote Sensing & GIS Division, NIC
For successful implementation of national GIS, it is very important to understand the complete ecosystem. When we talk about spatial data, the base map and satellite images of matching scale are two primary components that must be made available as data infrastructure in any country around which spatial data to be enriched using other technologies . Survey of India, is the prime agency which has mandate to provide the base maps and satellite images are provided from Deptt. of Space. The major gap is that availability of satellite images and maps do not match in scale. Images available today are with much higher resolution in comparison to the maps and are seen as much advanced component in GIS. For this reason, all around efforts are to update various data sets using satellite imageries only. Apart from there are many gap areas e.g non availability of a data sharing platform, standards and policies which need to be in place to avail the benefit of concepts.
PM’s Digital India program while emphasizes on use of space based technologies, this means to work in conjunction with other related technologies as well e.g. GPS devices, mobile, total workstation, aerial photography including recently developing Drone systems and MIS data bases.
To discuss the national and state level GIS, it is important to understand the evolving GIS scenarios at these levels. The vision of National GIS has focus from whole to part, which means that we need to address the problems of the nation as a whole. The spatial data development at most of the central Govt organizations e.gDeptt of Space, DST, MOES, NIC, Water Resources etc is based on maps provided from Survey of India. In view of complex policy framework or not very clear policy directives, each of the national organizations have defined their own stand for publishing spatial data, however, all these have a whole to part approach. At state level, handling the policy issues seems to be much complex and hence most of the states where GIS has taken off have initiated work in reverse way means development of spatial data from part to whole. Our objective and standards should be national driven in order to adoption of the International Standards. Both the national and the state GIS have to merge at some point in terms of standards for holistic development of the nation.
Today we also have the data centres available with the concept of cloud that are operational in cyberspace, which will narrow down the challenges over period of time.
GIS has definitely made an impact and is a differentiator for decision making at all levels of governance and nation building be it in government , in enterprise or by citizens, be it central, state or local body level or be it for long term planning or for immediate decisions. Hence the priorities at the National level will differ the GIS Vision with that of state level priorities.
India is changing and has visualized that GIS is not just
3.How State Government departments are responding
to the concept of State GIS?
essential but is now an urgent necessity—so as to empower the citizens and bring an inclusive economic growth and prosperity to the people. We at NIC have created a national level of village level information system, where 600,000 + villages can be addressed across India.This village level information is mapped in conjunction and linked with standard RGI census codes. This village level information system has been a major bench mark and received an immense popularity in the past with respect to the information displayed by the system. The displays of various village level thematic maps are on various parameters such as literacy, health, population variation, sex ratio modality, etc. NIC is providing network backbone and e-Governance support to all the states by their State NIC Centres. In view of implementing and building GIS across nation, as far as NIC is concerned the major activities at the state level, State NIC Centers are not processing any spatial data, though they have been provided with all the necessary products and capacity building at state level. We do have State GIS coordinators in each state that facilitatesthese GIS initiatives. Some states initiatives is evident from Bihar GIS portal, Madhya Pradesh has led many GIS initiatives such as PMGSY has many awards to its creditand Tamil Nadu for GIS platform. All these efforts are scattered and has progressed as per the need by the user department.
As mentioned along with the spatial data in an information system which is developed as GIS (geographical information system) it gives equal emphasis and importance to other datasets as well. The spatial datasets such as satellite imageries/thematic maps/GPS data/Aerial photography along with MIS dataset that needs to be integrated representing the dynamic system. A system developed exclusively on spatial data it has a role to play for citizen and governance services, in this whole system the dynamic component comes from the MIS dataset. Wherever we have a matured MIS, GIS has done very well in a sector, because when you a flash a map the base map is of no use without any dynamic content information
Looking at this States are definitely responding to the concept of making itself GIS ready in a niche way. It’s a long way ahead yet for a State GIS to achieve it full momentum.
As a democracy, India is constantly dealing with ways and means to comprehend social and economic challenges and bring a good quality of life to all its citizenry and visualizing State GIS as important—to understand the complex interplay of social order and economic growth. It hopes to reap demographic dividends, expedite development, and reduce disparity—thereby bringing more equity among its people.
There are many challenges that go hand in hand while implementing State GIS with National GIS, one such challenge are Data standards and formats adopted while creating GIS and integration of data from state to national level. Standardizations of data and formats from the national level to state level needs to be followed when the data is called from village to district so that data is integrated seamlessly. This is all possibly by first organizing the data of the same sector and then adoption to standard is a simpler task, aligning them with system, identifying the databases and ultimately putting the data service to use by the citizens
More so the National GIS vision is ultimately required for the priorities at National level, though the priorities at State level may be different. So the way GIS initiated at the State level
4.What challenges do you think our State Government
will come across in implementing State GIS along with
National GIS?
can be different. Though both National GIS and State GIS are same activity but have to merge at some point together fulfilling the national interests. Another biggest challenge today being faced is cadastral mapping. As per the mandate from the Ministry of Rural Development today we have both digitized khasra maps from the year 2000 and computerization of land records from the latest space based technologies. These both datasets needs to be integrated seamlessly. Technically both can be overlaid though both have different projection system which can be done by using some rubber sheeting method and bringing into same projection and georeferrenced and thus seamlessly integrated. This has to be done at state level where national level groups cannot harp into it.
Some of the states haverecently initiated for undertaking such tasks of overlaying the cadastral maps on the satellite imageries harmonsing the two datasets. Gujarat, Maharashtra, Karnataka have attempted. We have Karnataka’s web portal; in Gujarat, BISAG has become the service centre and Rajasthan NIC has done a proof of concept evolving the portal. However I feel it is a long way to go and eventually such portals shall share the data models on cloud and shall be crowd sourced. The rest of the states will have to take this initiativeas early as possible. Adding to the above another challenge here at the State level is that land records available at Sarpanch level is not yet updated and state departments is trying to go for resettlement of land data which amounts to huge cost to the government. Hence we need to follow right administrative processes and re-engineered towards land resettlement and standardization. One of the important issues that come up or may come up while implementing GIS is sharing, duplicity and transparency of datasets available within the state and national agencies for various services and applications such as road information, education, natural disasters etc. let’s take the example of Natural Disasters and calamities occurred recently in our country the J& K floods, the Uttarakhand flood disaster.If the datasets and information on disaster planning are available, then why it is not shared and concentrated on it looking at the 3rd dimension how proper mitigation plan can implemented for rescue operations for the human race and infrastructure. At the same time in developed and advance countries the GIS is operational at the county level. There are lots of challenges for state government to look into these issues follow proper administrative processes have partnerships with related national agencies to build the relevant databases and GIS for their state.
In the recent past we have seen GIS has ultimately shown tremendous potential andhas brought paradigm shift in such a way the IT systems are working, functioning, addressing all kinds of dataset and it has created a new kind of language in IT systems, RDBMS based systems MIS traditionally as we called them talked about the 2nd dimension system tabled but now with GIS visualization 3rd dimension can also be addressed and used to understand exposure data quality geographically. Hence addition of visualization helps in validation and becomes a powerful system. GIS has the potential to visualize of the datasets along with integration and standardization of the multiple datasets thatcan surface various facts giving rise to new visual language. I feel GIS has a main stay and role to play in the Digital India Program (Pillar 5 and e-kranti) and it has become essential in preparing a strong
5.How do you envision the importance of GIS
technology at leveraging the services at all levels?
In Conversation with
(contnd. on page No. 20)
18
EV
EN
T C
OV
ER
AG
E
sri International User Conference(UC) kicked off in San Diego, California with much Eenergy— new technology, inspirational user
stories, big-name speakers, and clear direction for the future. Esri UC is where you find solutions to local, global, and industry problems. A place to learn latest in spatial analysis, web and mobile apps, location analytics, big data, open data, and the ArcGIS platform.
Addressing the 2014 Esri UC Plenary Session, Jack Dangermond said “We try to predict the future every day. You think about what the weather might be like. You think about what might happen with your favorite sports team. You think about what the future might hold for you. Beyond prediction, some of us are actually engaged professionally in creating the future.” Because as Peter Drucker said, “The best way to predict the future is to create the future.”
Plenary address talked about the changing pattern in the GIS technology moving into the platform regime. GIS itself continues to evolve, and as a result your individual systems are now becoming part of a larger interconnected platform. Your servers are connecting, your desktops are connecting, and your apps are being fed by shared community content. This web GIS is a new pattern that’s coevolving with faster machines, web services, open environments, open policies, and networks.
Web GIS is bringing together all of our data, technologies, and people. It lets you share your own focused work in the form of web maps and web services, throughout your organizations as well as on the web to the world. This creates a framework where we can collaboratively work to address the complex challenges facing our world.Web GIS is also leveraging advancing technologies—the world of measurement, the world of computing, and the world of networks, and layering on top of that infrastructure. This “nervous system of the planet” brings our world’s information to life.
In addition, the app revolution is making this web GIS, and all of its content, available everywhere. Anyone can now access this new medium of web services and web maps anytime, anywhere, on any device, bringing GIS to life in whole new ways and transforming how GIS professionals work.
Jack also mentioned, the mission of creating a better future depends heavily on GIS professionals. It is you who can envision what’s possible, understand and embrace and fully leverage these new web GIS and geodesign tools, show leadership, and do the
19
EV
EN
T C
OV
ER
AG
E
Esri
International
User Conference
2014
difficult work we have ahead of us. The user conference plenary introduced new features in the ArcGIS product and bringing them to one single PLATFORM ArcGIS. Introducing ArcGIS Pro the complete new product that gave an insight to learn the power capabilities to expand the ability to author content in 2D and 3D, creating 3D web scenes and web maps and exploring the industries that will be using ArcGIS Pro a premier application for visualizing, editing, and analysis and creating the future of GIS. The technology
vision gave a complete s ight through the various updates and new capabilities of ArcGIS like expansion of f l e e t a p p s , n e w dimensions in ArcMAP, 3D webscenes, Open Access with ArcGIS Open Data, Geoplanner for ArcGIS, mining for Space time patterns and creating awareness through story map.
Esri President Jack Dangermond gave special shout outs to all GIS users for impressive and innovative work. Roya l Dutch She l l received the Enterprise
GIS Award, and the City of Rancho Cucamonga earned the Esri President’s Award.
Esri celebrated more than 170 organizations during the Special Achievement in GIS (SAG) Awards ceremony at the Esri UC. The SAG Awards highlight users that have shown vision, leadership, hard work, and innovation in their use of Esri's geographic information system (GIS) technology. Organizations from around the world were honored at the Esri UC span i n d u s t r i e s i n c l u d i n g environmental management, education, government, health and human services, natural r e s o u r c e s , n o n p r o f i t s , t e l e c o m m u n i c a t i o n s ,
transportation, and utilities.
Successful stories unfold during the Plenary Session Starbucks Coffee showed how they’re using GIS maps to open one new store every day in China. Decisions were made locally to ensure responsible growth. Starbucks one size does not fit all, whether it’s coffee or IT. This means a location strategy that includes everything from web maps to applications, and everything in between. All this have solution in ArcGIS location technology which enabled them to deliver business customers with world-class business intelligence and information products. Whether it’s coffee or IT, the customer is at the center of what they do.
GIS Kids are Super! - Kylie Miller and Rikki Vaughn are fourth graders, but they can drive ArcMap like pros. The two students from Sonora Elementary in Arkansas recently learned how to make GIS maps. They used their newfound skills to pitch a business idea to Walmart, track a weather balloon, and establish a mobile library for their fellow students. Kylie and Rikki were recognized on stage at the Esri UC plenary session, where they spoke about their GIS work and led a demo of their projects.
Awards were given for the innovation – Climate Resilience App Challenge and Story Maps.
A Tribute to Roger Tomlinson-
Plenary finished with a tribute to “The Father of GIS” - Dr.Roger F. Tomlinson. Roger once said “he was “never happier than when surrounded by GIS people.” In a room filled with 16,000 GIS people, Tomlinson’s spirit was profoundly felt, and his legacy grows stronger each day
EV
EN
T C
OV
ER
AG
E
sri India in association with The Economic Times, brought forth the importance of Location Analytics during The Location Intelligence Summit 2014. Held at E
The Trident Hotel, BKC, Mumbai, the intriguing seminar shed light on some amazing insights on how the mere location modification of a company’s store or warehouse led to a key contributing factor in augmenting the business revenues by drastic levels.
Linda Peters, Global Business Development, Esri Inc commenced the summit by stating how every aspect of a business—right from consumers to suppliers, offices to warehouses—has a location attached to it. “With technological advancements, location is now moving digitally. Mobile is bringing in the change and making our location present in the virtual space. Even to order coffee, I no longer have to physically go to the store, I can order online.” She said.
Commencing the panel discussion, Bhavit Desai, Global Retail, Real Estate, and Logistics Consultant stated the importance of technology in location intelligence. “Smartphone apps help in garnering customer information, information on competitor’s behavior, enriching and analysing the data, and eventually, taking action and monitoring the action. Location intelligence, thus, goes beyond site selection. It helps understand where the customer is going, analyse his behavior and further take suitable marketing actions.”
The discussion was moderated by Agendra Kumar, President, Esri India who started by focusing on the answers which location intelligence aims to provide. Milind Deshpande, Senior Vice President, Reliance Jio, opined, “Location intelligence should be able to answer questions like ‘Will I be able to serve my customers better?’ ‘Will I reach my workforce earlier?’ ‘Will I be able to direct my staff to reach my customers earlier,’ etc.” Peeyush Bajpai, COO- Indicus Analytics, linking location to information, added that the single factor which
Location Intelligence Summit 2014
provides relevancy to location is context. “The minute you provide context to data, it becomes information. If you want to analyse your brand’s performance, location gives it the context. At times, changing the location changes the entire perspective—even it is just by a mile or a road,” added Bajpai.
Kaushik Ghate, Vice President and Head—Analytical Marketing, HDFC Bank kept forth a question —How would you use and integrate within your system the possibilities of location intelligence. “People should realise the importance of return on investment when they are spending money on location intelligence. Know what location will work for you and by what figure will it bring changes to your business,” he added. Since markets and consumer preferences evolve daily, you should know where you stand in front of your competition; what works where and where it fails. Thus essential tools to give insights into locations are important. You can use this data not just in your research and market development, but also in marketing. “If you have location insights, you know what location works best and where you should invest. Your real-estate costs can come drastically down by this insight,” added Kumar. Bajpai mentioned how data is now available for every city and block of India. People always feel the need to have data in hand to know how their brand will perform. Satellite imageries, census, demographic insights, etc are all ways to get data about a particular place. “Location analytics can even be used in supply chain and distribution as one knows where exactly a product will work and what time and what kind of manpower will be required to drive its distribution in a particular area,” mentioned Desai.
Taking cue from this, Wolfgang Hall, Global Industry Manager—Logistics and Supply Chain, Esri Inc mentioned the importance of location intelligence in visualisation, analysis and opitimisation in risk mapping and planning in supply chain management. “Supply chain in any business is driven by risk management, which can be tapped by risk mapping. Social media can be used to get real time data, in case of any calamity. By analyzing location data, you can do proper territory analysis and get your sales team to drive tasks efficiently.”
Mapping can also help you with firstly, density analysis, that helps you to know which brand has more customers. Secondly, it helps analyze the buying behavior of the customers by tracking how a customer is behaving in a particular store or area. Companies can prevent and mitigate risks, allocate adequate resources, monitor and augment profits and create effective branding strategies by knowing and realising the power of location analytics. With various tools and technological advancements now available, it is just a matter of time when the power of this intelligence can be fully unleashed
21
CA
SE
STU
DY
20
Managing Hazard with Geospatial TechnologyCase study of Delhi
illions of people live in a brewing crucible of hazards in the city. Delhi is located in seismic zone IV which has fairly high seismicity. Road accidents, M
fires, industrial gas leakages, bomb blasts, train accidents make frequent news headlines. It is prone to floods, heat waves, cold waves, nuclear, biological and chemical disaster as well. Delhi has grown at a breathtaking speed of a 0.20 million per year to accommodate 14 million people in 100 years. Accommodating and housing this annual surge of people is an challenging task, especially when one half of these can be traced to an exodus from rural areas. Delhi attracts large number of migrants. Fleeing deteriorating ecological conditions and crushing poverty, most of these immigrants to Delhi seek shelter in hastily built huts or jhuggies. These homes are unsafe. In Delhi the majority of the industries are small in scale. An index to their condition is the fact that of the 126,000 such units nearly 97,411 are located in the non-conforming zones. This means that 77 percent of the industries violate this legal document and occupy garages, basements, backyard of shops and houses or small sheds in non-industrial areas. Hundreds of these units manufacture plastic or rubber using highly inflammable raw materials. In most factories, electric wires hang carelessly while furnaces, smelters, and machine occupy crowed premises with no exhaust for ventilation. Manned by a low skilled and niggardly paid labour there is no concept of safety in theses cubbyhole industries. The industries in Delhi use and store huge stocks of inflammable raw materials, which are a
lethal, mix for not just fire but also toxic fumes. The combined impact of haphazard growth and anarchic operation of unit at every conceivable space in without recourse to safety explains the reason why hazard in industries are escalating. These are big enough causes to lead to a fire after earthquakes.
Emergency situations require a quick and focused response as human life and property may be involved. It is recognized now that the greater proportion of poor quality housing, inadequate planning, monitoring and control in metropolitan cities, which become overpopulated, lead to a greater number of fires and other urban disasters. Due to the rapid increase in population, industrialization, rapid rise in new colonies, construction of high rise buildings, the fire risk in the cities has been tremendously increasing. With the cities growing in size and complexity day by day they need to be managed more and more efficiently. Aspects like planning and management of fire services should form a part of urban management as a whole. To combat such a dangerous and widespread challenge, technology can become a powerful ally in the fight against fire and can help combat any kind of emergency situation. Therefore, an integrated system will be required sooner or later.
framework for the country defining roles of different agencies addressing the specific needs. Decisions for planning, infrastructure development and meeting the needs of citizens call for extensive use of remote sensing and GIS-based technologies. The GIS data from different agencies like the Remote Sensing Centre, the Survey of India and the Forest Survey of India, among others, would help a paradigm shift from e-governance to g-governance. G-governance leverages the GIS information in decision managing system. Most of the
government departments at the state level, today has understood the importance of GIS. Hence, geospatial web services in e-governance are being envisaged to bring GIS to the mainstream IT. These departments have started successfully leveraging the capabilities of GIS for more accurate data, robust analysis and visualization tools. With this kind of framework coming in place, cross-departmental collaboration being improved for planning and high-level decision making to be leveraged as a platform as well as a service for the benefit of various mission mode projects and eGov initiatives
(contnd. from page No. 17)
CA
SE
STU
DY
23
CA
SE
STU
DY
22
FIRE STATION NAME APRIL MAY JUNE
Connaught Circus 86.33333 104.3333 61.66667
SPM Marg 40.33333 54.66667 39.66667
Moti Nagar 50 76.33333 42
Rani Jhansi Road 52 59.33333 42.33333
Safdar Jung 72.66667 66.66667 59.33333
Mathura Road 72.66667 82.33333 57.66667
Shahdara 38.33333 58.33333 32.66667
Roop Nagar 85.33333 149.3333 112.3333
Shanker Road 23.66667 28.66667 24.33333
Laxmi Nagar 34 56 33
Chanakya Puri 73 74 51.66667
Bhikaiji Cama Palace 93.66667 111.3333 59.66667
Nehru Place 126 149 103.3333
Parshad Nagar 45.66667 58.33333 54
Kirti Nagar 20.66667 24 20.33333
Teliwara 9.666667 10.33333 11
Wazir Pur 38.66667 58.33333 34
Darya Ganj 13.66667 19 11.66667
Geeta Colony 62 96.66667 64.33333
Rakab Ganj 25 15.33333 11.33333
Keshav Puram 69 108.6667 80
Naraina 22.66667 24.66667 16
Janak Puri 98.33333 143.6667 92.33333
Okhla 9 11.33333 7.666667
Narela 24.33333 34 20.33333
Jwala Puri 54 70 40.33333
Rastrapati Bhawan 3.333333 1 0
Sector-16 Rohini 46 60 36.66667
Najafgarh 87.66667 93.66667 55.33333
Sector-5 Rohini 97.66667 119.3333 94
Bhorgarh 59.66667 52.66667 27.66667
Bawana 63.66667 65.33333 24.33333
Jahangir Puri 82.66667 108.6667 61
Gokul Pur 52.33333 58.66667 39.66667
Shastri Park 55.33333 59.33333 47.66667
Paschim Vihar 13.33333 21 17
Paiwalan 33.33333 38 30
Okhla-1 39 55.66667 29
Dwarka 50.66667 63.33333 42.66667
Hari Nagar 34 57.33333 39
DSIDC Bawana 21.33333 24 15.33333
Jwala Heri 6.333333 10 5.666667
Data Collection
The Average data for each month from 2010 to 2013:
FIRE STATION NAME APRIL MAY JUNE
Tikri 10.66667 9.666667 7.666667
Mangol Puri 26 27.66667 18
Tahir Pur 46.66667 46 40.66667
Sarita Vihar 30.66667 37.33333 21.33333
Delhi Secretariat 3.5 5 1.5
CBD Shahdara 25.5 40.5 26
Mayur Palace 17 28.5 19
Kalyan Vas 31 41 28
Udyuog Nagar 3 8 2
Mandawli IP 70 77 68
Badli 1 1 1
Cumulative Analysis and Interpretation for 2010-2013Graphical Plot of the above Data
he above data was graphically plotted for all three months, namely, April, May and June, with no. of fire Toutbreak incidences along x-axis and name of the fire
stations along y-axis. The average data is plotted over the years 2010-2013, for the months in which number of fire outbreaks have been highest, namely April, May and June. After plotting the data we were able to conclude that;
• Fire outbreaks in the month of May were almost 40 percent more than April and June.
• The highest numbers of calls were recorded in the following fire stations, namely, Roop Nagar, Jahangir Puri Janak Puri, Nehru Placee, Rohini Sector-5, Geeta C o l o n y , K e s h a v P u r a m , Najafgarh,Cannaught Place and Bhikaji Cama.
The conclusions from the plot of average data for fire outbreak incidences over the years 2010-2013 were found same as the conclusions of the plot for 2013. Hence the result was cross verified.
From the adjacent plot, the highly risk prone areas were selected and re-plotted in detail to reaffirm the categorical division of the areas on the basis of number of fire outbreak incidences.
The data for the highly prone areas has been re-plotted with names of fire stations along x axis and number of incidences along y axis. From the below
data plotting, we conclude that;
• Roop Nagar, Janak Puri and Nehru Place fire stations have recorded the highest number of fire outbreaks.
CA
SE
STU
DY
25
CA
SE
STU
DY
24
• On the basis of incidences recorded, the above highly incidence prone fire stations can be classified as:
Category 1 (No. of incidents more than 160):- In the average plot over 2010-2013, no fire station comes under this category. However the plot for 2013 showed Roop Nagar under this category.
Category 2 (No. of incidents between 140 to 160):- Roop Nagar, Janak Puri and Nehru Place. However, for the plot of 2013, this category also included Jahangir Puri.
Category 3 (No. of incidents between 140 to 100):- Sector-5Rohini, Bhikaji Cama, Jahangir Puri, Keshav Puram Category 4 (No. of incidents reported less than 100):- Geeta Colony, Najaf Garh and Cannaught Place.
Hence, from the graphical interpretation, it is observed that the above highly risk prone areas need special attention in the
context that their fire handling capacity needs to be improved. Moreover, there is a lot that can be learned from the above data. By assessing the above data, we were able to pin point the risk prone areas. This study can help us take preventive measures from beforehand and be prepared with mitigative strategies. Also, by understanding the main factors causing these fire outbreaks, we can take steps to control those factors. For example, if an area is affected due to shotshort circuits and other such electricity oriented issues, or at industrial places, mock drills and informative sessions can be conducted to help at these places. Moreover, by understanding the traffic situations of an area, the area can be equipped with a greater number of small mobile fire stations at lesser distances. So that in advent of a fire outbreak, the nearest mobile van can reach the place as soon as possible without getting caught in traffic so that it can prevent the fire from becoming serious.
Fire Vulnerability Map
The fire vulnerability map of Delhi was prepared by integrating three attribute maps together. These are Fire stations, Fire incidences and Jurisdiction zones. Each attribute is expressed as a map and then all the attribute maps were integrated to make fire vulnerability maps.
Quantitative Comparison of Incidences
The pie chart shows that most of the areas are moderately vulnerable for fire. Number of highly vulnerable areas are significantly low. The most vulnerable area is Roop Nagar, followed by, Jahangir Puri, Janak Puri and Nehru Place. While the moderately vulnerable areas are, Rohini, Geeta Colony, Keshav Puram and Najafgarh.
Delhi Map along with the highly incidence prone fire stations.
Fig 7: The highly prone fire areas marked in red on Delhi Map.
REFERENCES
A D P C ( n . d . ) “ S a f e t y a f t e r a d i s a s t e r ” , U R L : http://www.ext.vt.edu/pubs/disaster/490.html accessed on 10 October 2007.
ADPC (2004) “Asian Urban Disaster Mitigation News Quarterly Activity Highlights” URL : http://www.adpc.com.au/ accessed on 10 October
Forman, Ernest H. (1998) “Decision by Objectives”, URL: http://mdm.gwu.edu/Forman/DBO.pdf accessed on 03 December 2007.
Federal Emergency Management Agency (FEMA) (1997)” Project impact: Building a disaster resistant community, Government Printing Office”, Washington, D.C.
Florida Dept. of Community Affairs (FDCA) (1997) “The local mitigation strategy: A Guidebook for Florida cities and counties, Vulnerability assessment, supplement, part 1” BRM publications, URL: http://www.dca.state.fl.us/BRM accessed on 14 November 2007.
Fig 8: Quantitative comparison of incidences.
K h a n , I f t e k h a r ( 1 9 9 7 ) “Livability in Old Dhaka: Evolving Residential Patterns in Mahallas”, Anonda publishers, Dhaka.
Lisa, K. Flax, Russell, W. Jackson and David, N. Stein (2002) “Community Vulnerability A s s e s s m e n t T o o l Methodology” Natural Hazards Review Vol. 3 (ISSN 1527-6988), 162-176.
N a t i o n a l O c e a n i c a n d Atmospheric Administration Coastal Services Centre (NOAA CSC) (1999) “Community Vulnerability Assessment Tool” New Hanover County, North Carolina”.
National Tsunami Hazard Mitigation Program (NTHMP) (2001) “Designing for tsunamis: Seven principles for planning and designing for tsunami hazards” Designing for tsunamis, URL: h t t p : / / w w w . p m e l . n o a a . g o v / t s u n a m i -hazard/Desihning_for_Tsunamis.pdf accessed on 1 November 2007.
Risk Management Solutions, INC (1997) “HAZUS: Earthquake Loss estimation Methodology, Users manual, National Institute of Building Sciences Department 5200”, Washington, D.C.
Schellnhuber, H. (2001) “Brainstorming: What is vulnerability and how do we measure it?” Methods and Models of Vulnerability Research, Analysis and Assessment Workshop
Dr. Mukta GirdharAsstt. Professor CDMS, GGSIP University, [email protected] TomerDelhi Fire Service
CA
SE
STU
DY
27
CA
SE
STU
DY
26
Silicon Valley of India Flies High with GIS
Indian Local Government improves Governance and Service Efficiencies
ruhat Bengaluru Mahanagar Palike (BBMP) is the fourth largest Local Government in India. With a population of 9.2 million, spread across an area of 800 B
sq.km, Bengaluru (Bangalore) is India's third most populous city and fifth-most populous urban agglomeration. The city is well known as the hub of India's information technology sector and has shown tremendous growth in the sector, accounting for more than 35 % of India's Software exports. Because of its position as the nation's leading IT exporter, Bengaluru is regarded as the Silicon Valley of India. The city is home to many well-recognized educational and research institutions in India, and is therefore known as the knowledge capital of the country. Bengaluru is also rated amongst the top 10 preferred entrepreneurial locations in the world (Economic Times, April 2012). A demographically diverse city, Bengaluru is a major economic and cultural hub and the second-fastest growing major metropolis in India.
Business Situation
To support the unprecedented urban growth in the city of Bengaluru in recent years, BBMP (the government of Bengaluru), has strived to bring about significant improvements in civic administration, public transportation and connectivity across the city. Over the past many years, the organization has adopted various e-governance initiatives to improve its citizen service efficiencies. Critical governance decisions being largely dependent on geographically spread data, BBMP realized the importance of Geographic Information Systems (GIS) for efficient information collection, management and analysis. The city, having always being a promoter of latest, advanced technology, was looking to leverage the best of GIS technology for its transformation initiative. Esri being the world leader in GIS, CyberTech’s long-standing partnership with Esri, made the “CyberTech-Esri” combination the most preferred choice for BBMP. CyberTech had launched “GeoCivic” - its flagship, GIS-based application suite for local governments in India. BBMP decided to leverage this platform, based on the world leading ArcGIS technology, to drive their GIS transformation initiative.
GIS Solution
The Bengaluru Government identified the following functions as key drivers of the city’s social and economic growth, which were thus chosen as the primary candidates for the GIS transformation drive:
• Road Infrastructure Management
• Optical fiber cable license issue management.
• Property Tax Management
• Citizen Complaint Redressal
• Birth & Death Registration BBMP leveraged GeoCivic, CyberTech’s Spatial Decision Support Engine, based on the latest ArcGIS technology from Esri. The application suite specifically caters to the end-to-end needs of local governments. CyberTech helped BBMP capture the locational intelligence residing in their data, thus providing decision makers with accurate, relevant and timely information.
Property Tax Management
BBMP has geo-enabled all their properties in their jurisdiction. Cybertech is now providing all the necessary tools to efficiently administer and monitor the collection process. The tools and analytical engine will provide the data in a GIS for optimal and efficient management. Through improved records keeping of properties and increased tax compliance, GeoCivic framework will help BBMP maximize coverage a n d t h u s a u g m e n t Government revenues.
One of the major benefits of the system was seen by the significant increase in the realized revenues. In 2007-08, properties covered in tax net were 740,000 with revenue collection of Rs.4.48 billion. In 2012-13, post the GIS transformation, the figures shot to a total of 1.62
million properties identified with revenue collection of a whopping Rs.13.5 billion. This current target is Rs.20.00billions. The system also brings about the much needed transparency in property tax levy and collection. Automated workflows increase process efficiencies while advanced analytics and GIS reporting with detailed dashboards facilitate better-informed decision making. BBMP, with the help of the system, can now also offer advanced services to help citizens view their property
information and pay their property taxes online.
R o a d I n f o r m a t i o n System
T h r o u g h t h e G I S transformation, CyberTech he lped BBMP bet ter manage its huge expanse of road network (nearly 13500 kms), providing a m o r e o r g a n i z e d m a n a g e m e n t o f geographically spread road information. The system provided for centralized, dynamic registration of accurate spatial and linear locations of road assets, t h u s e n a b l i n g e a s y r e c o r d i n g a n d modification of data. These asset attributes can n o w b e v i s u a l l y represented through dynamic, thematic maps for the organizat ion officials, to help them in more efficient planning and p red i c t i ve road maintenance. This not only s a v e s a l o t o f organizational time and effort, it also gives better contro l over pro ject execution and saves a
significant amount of maintenance costs. An important aspect of this transformation was the dynamic Road History Update and Maintenance. It helped BBMP officials keep track of road asset history, including all spatial and non-spatial changes made to the assets so far, thus helping them further ensure accurate and timely planning decisions.
Road Cutting Approval System
BBMP, on a regular basis, also had to manually manage the
permissions and monitoring of road cutting activities carried out by various service providers (telecom, electricity, water supply etc.) and also by private property owners. The move to GeoCivic and the ArcGIS platform, automated and streamlined the entire Road Cutting Approval and Management process. The system, through high-quality vector maps, now gives BBMP an integrated, spatial view of the road work proposed, and helps organization officials approve, monitor and maintain the road cutting activities. Through advanced GIS and MIS reports, the system also helps users analyze pending projects and track them through completion, consequently enabling better-informed planning decisions.
Optical Fiber Cable (OFC) Management
Over the past few years, the city had seen a tremendous increase in the laying of Optical Fiber Cables (OFC) across the city, by various service providers. BBMP engineers and authorities, earlier, faced numerous issues in continuously keeping track of these activities. CybertTech’s solution now helps BBMP officials easily track and monitor such projects, thereby enabling efficient revenue assessment and recognition. The ArcGIS-based OFC Monitoring and Tracking System receives applications from prospective firms, manages approvals, accurately assesses liable revenues, automatically issues demand notices and is also integrated with the organization’s payment gateway, thus taking care of the entire process life-cycle. With minimized revenue losses, this seemed to prove as one of the major benefits of the GIS transformation.
Citizen Complaint Redressal
CyberTech provided an integrated geo-enabled platform for easy and transparent citizen-government engagement. The application enables citizens to report and track service complaints and feedback through an easily accessible web-based portal. The system incorporates the geographic aspect of population spread to enhance and speed-up the process of complaint redressal and service provision. This not only made life more convenient for citizens, it also increased the public trust in the Government of the city.
Birth & Death Registration
The GIS deployment also covered automation of birth and death registration processes with advanced thematic mapping and spatial analysis of the types and distribution of births and deaths across all zones in the city. This proved as a very important set of inputs for better public health administration in the city
Vishal Bargat - Director & Head Of India BU, Cybertech Systems & Software Ltd., Email: [email protected], Address: B-63/64/65 Cybertech House, Road No 21/24, J. B. Sawant Marg Road Number 21, Wagle Industrial Estate, Thane West, Thane, MH 400604,Phone number: 022 - 25834643, Fax: 022 – 25832574, URL: http://www.cybertech.com)
CA
SE
STU
DY
27
CA
SE
STU
DY
26
Silicon Valley of India Flies High with GIS
Indian Local Government improves Governance and Service Efficiencies
ruhat Bengaluru Mahanagar Palike (BBMP) is the fourth largest Local Government in India. With a population of 9.2 million, spread across an area of 800 B
sq.km, Bengaluru (Bangalore) is India's third most populous city and fifth-most populous urban agglomeration. The city is well known as the hub of India's information technology sector and has shown tremendous growth in the sector, accounting for more than 35 % of India's Software exports. Because of its position as the nation's leading IT exporter, Bengaluru is regarded as the Silicon Valley of India. The city is home to many well-recognized educational and research institutions in India, and is therefore known as the knowledge capital of the country. Bengaluru is also rated amongst the top 10 preferred entrepreneurial locations in the world (Economic Times, April 2012). A demographically diverse city, Bengaluru is a major economic and cultural hub and the second-fastest growing major metropolis in India.
Business Situation
To support the unprecedented urban growth in the city of Bengaluru in recent years, BBMP (the government of Bengaluru), has strived to bring about significant improvements in civic administration, public transportation and connectivity across the city. Over the past many years, the organization has adopted various e-governance initiatives to improve its citizen service efficiencies. Critical governance decisions being largely dependent on geographically spread data, BBMP realized the importance of Geographic Information Systems (GIS) for efficient information collection, management and analysis. The city, having always being a promoter of latest, advanced technology, was looking to leverage the best of GIS technology for its transformation initiative. Esri being the world leader in GIS, CyberTech’s long-standing partnership with Esri, made the “CyberTech-Esri” combination the most preferred choice for BBMP. CyberTech had launched “GeoCivic” - its flagship, GIS-based application suite for local governments in India. BBMP decided to leverage this platform, based on the world leading ArcGIS technology, to drive their GIS transformation initiative.
GIS Solution
The Bengaluru Government identified the following functions as key drivers of the city’s social and economic growth, which were thus chosen as the primary candidates for the GIS transformation drive:
• Road Infrastructure Management
• Optical fiber cable license issue management.
• Property Tax Management
• Citizen Complaint Redressal
• Birth & Death Registration BBMP leveraged GeoCivic, CyberTech’s Spatial Decision Support Engine, based on the latest ArcGIS technology from Esri. The application suite specifically caters to the end-to-end needs of local governments. CyberTech helped BBMP capture the locational intelligence residing in their data, thus providing decision makers with accurate, relevant and timely information.
Property Tax Management
BBMP has geo-enabled all their properties in their jurisdiction. Cybertech is now providing all the necessary tools to efficiently administer and monitor the collection process. The tools and analytical engine will provide the data in a GIS for optimal and efficient management. Through improved records keeping of properties and increased tax compliance, GeoCivic framework will help BBMP maximize coverage a n d t h u s a u g m e n t Government revenues.
One of the major benefits of the system was seen by the significant increase in the realized revenues. In 2007-08, properties covered in tax net were 740,000 with revenue collection of Rs.4.48 billion. In 2012-13, post the GIS transformation, the figures shot to a total of 1.62
million properties identified with revenue collection of a whopping Rs.13.5 billion. This current target is Rs.20.00billions. The system also brings about the much needed transparency in property tax levy and collection. Automated workflows increase process efficiencies while advanced analytics and GIS reporting with detailed dashboards facilitate better-informed decision making. BBMP, with the help of the system, can now also offer advanced services to help citizens view their property
information and pay their property taxes online.
R o a d I n f o r m a t i o n System
T h r o u g h t h e G I S transformation, CyberTech he lped BBMP bet ter manage its huge expanse of road network (nearly 13500 kms), providing a m o r e o r g a n i z e d m a n a g e m e n t o f geographically spread road information. The system provided for centralized, dynamic registration of accurate spatial and linear locations of road assets, t h u s e n a b l i n g e a s y r e c o r d i n g a n d modification of data. These asset attributes can n o w b e v i s u a l l y represented through dynamic, thematic maps for the organizat ion officials, to help them in more efficient planning and p red i c t i ve road maintenance. This not only s a v e s a l o t o f organizational time and effort, it also gives better contro l over pro ject execution and saves a
significant amount of maintenance costs. An important aspect of this transformation was the dynamic Road History Update and Maintenance. It helped BBMP officials keep track of road asset history, including all spatial and non-spatial changes made to the assets so far, thus helping them further ensure accurate and timely planning decisions.
Road Cutting Approval System
BBMP, on a regular basis, also had to manually manage the
permissions and monitoring of road cutting activities carried out by various service providers (telecom, electricity, water supply etc.) and also by private property owners. The move to GeoCivic and the ArcGIS platform, automated and streamlined the entire Road Cutting Approval and Management process. The system, through high-quality vector maps, now gives BBMP an integrated, spatial view of the road work proposed, and helps organization officials approve, monitor and maintain the road cutting activities. Through advanced GIS and MIS reports, the system also helps users analyze pending projects and track them through completion, consequently enabling better-informed planning decisions.
Optical Fiber Cable (OFC) Management
Over the past few years, the city had seen a tremendous increase in the laying of Optical Fiber Cables (OFC) across the city, by various service providers. BBMP engineers and authorities, earlier, faced numerous issues in continuously keeping track of these activities. CybertTech’s solution now helps BBMP officials easily track and monitor such projects, thereby enabling efficient revenue assessment and recognition. The ArcGIS-based OFC Monitoring and Tracking System receives applications from prospective firms, manages approvals, accurately assesses liable revenues, automatically issues demand notices and is also integrated with the organization’s payment gateway, thus taking care of the entire process life-cycle. With minimized revenue losses, this seemed to prove as one of the major benefits of the GIS transformation.
Citizen Complaint Redressal
CyberTech provided an integrated geo-enabled platform for easy and transparent citizen-government engagement. The application enables citizens to report and track service complaints and feedback through an easily accessible web-based portal. The system incorporates the geographic aspect of population spread to enhance and speed-up the process of complaint redressal and service provision. This not only made life more convenient for citizens, it also increased the public trust in the Government of the city.
Birth & Death Registration
The GIS deployment also covered automation of birth and death registration processes with advanced thematic mapping and spatial analysis of the types and distribution of births and deaths across all zones in the city. This proved as a very important set of inputs for better public health administration in the city
Vishal Bargat - Director & Head Of India BU, Cybertech Systems & Software Ltd., Email: [email protected], Address: B-63/64/65 Cybertech House, Road No 21/24, J. B. Sawant Marg Road Number 21, Wagle Industrial Estate, Thane West, Thane, MH 400604,Phone number: 022 - 25834643, Fax: 022 – 25832574, URL: http://www.cybertech.com)
29
WO
RLD
OF
AC
AD
EM
ICS
he name of Haryana instantly conjures up the image of a State which combines both-antiquity and plenty. Haryana emerged as a separate state in the federal T
galaxy of the Indian Republic on November 1st 1966. Having just 1.37% of the total geographical area and about 2% of India’s population, Haryana has carved a place of distinction for itself during the past four decades. Whether it is education, agriculture or industry, Haryana has marched towards modernity with leaps and bounds.
The Haryana Agricultural University was established on February 2nd 1970, as a result of bifurcation of the erstwhile Punjab Agricultural University. From 31st October, 1991 it has been renamed as “Chaudhary Charan Singh Haryana Agricultural University (CCS HAU)”. The university is meant for research and education in the field of agriculture. The main campus of the University is situated at Hisar at a distance of 162 km North-West of Delhi on National Highway No. 10. Since its existence, it has been making rapid progress in building construction and has an excellent infrastructure. The University has one of the best developed campuses in India and fulfills academic and extra-curricular needs of the students. The University has its constituent colleges renowned for their academic importance like College of Agriculture, College of Agricultural Engineering and Technology, College of Basic Sciences & Humanities, College of Home Science and a Centre of Food Science & Technology which offer various UG, PG, Ph.D. degrees and many Diploma programmes.
Department of Agricultural Meteorology
The Department of Agricultural Meteorology (HAU) is unit of College of Agriculture and meant for studying meteorological/climatic aspects in relation with agriculture. This department is using these state of the art techniques in its wide range of research projects since a pretty long time. Focused on imparting teaching in the field of Agricultural Meteorology, this department is also fully devoted in researches sponsored by ICAR, DST India, SAC etc. This department has prepared many popular research outputs like ‘Agroclimatic Atlas of Haryana’ and other by using these techniques. Besides the scientists of this department, research
Introduction
CCS Haryana Agricultural University, Hisar
scholars and students of this as well as other departments use these techniques extensively in their researches.
Why the need of Courses on Remote Sensing & GIS at
HAU
Remote sensing and GIS has been relatively young scientific discipline and is an area of fast emerging technology that witnessed phenomenal growth over the recent decades. These technological tools enhanced our capability for exploring, mapping and monitoring resources at local, regional and global scale. To provide vistas to the young generation to learn this technology, HAU a couple of years back, took a step to start a Diploma course and established a full functioning remote sensing and GIS lab equipped with relevant instruments. HAU designed a PG Diploma course of full year duration in the Department of Agricultural Meteorology at College of Agriculture. This post graduate course shall not only provide job avenues for students but also open a field of viable and effective interactions with national establishment related to various aspects of remote sensing and GIS. Main objective of this course is to develop multidimensional teaching and learning in the field of remote sensing and GIS application in agriculture and environmental management.
“PG Diploma Course Curriculum - Remote Sensing and GIS Applications in Agriculture and Environment”
Agricultural Meteorology is the nodal department to carry out all the functions of this course. As to provide a multi disciplinary approach to students for applying these technologies, various departments (Collaborative Departments-Soil Science, Forestry, Soil and Water Engineering) of this university having rich spatial knowledge and experience in their fields have also been associated with this course.
Eligibility to PG Diploma Programme
Bachelor degree in Agricultural Engineering/Computer Science /Civil Engineering /Electronics and Communication Engineering/ Information Technology / Agriculture /Forestry /Horticulture /Ecology/ Basic Sciences/Environmental
WO
RLD
OF
AC
AD
EM
ICS
28
Science/Computer Application/ Arts with Geography subject. Preference will be given to the Master degree in Agriculture / Forestry/ Horticulture / Geography / Environmental Sciences / Geophysics/ Meteorology /Atmospheric Sciences /Earth S c i e n c e s B a s i c S c i e n c e s / C o m p u t e r Science/Mathematics/Statistics/Computer Application. It’s a two semester program with the total intake capacity of 10 students every year. The application process starts in the month of May/June every year./
Faculty of Department
The department is currently headed by Dr. Raj Singh (Sr. Scientist), an eminent Agricultural Meteorologist. There is a great team of eight scientist at department itself and p r o f o u n d s c i e n t i s t / t e a c h e r / e n g i n e e r s o f associating/collaborating departments of the university.
Research Infrastructure
• The department believes in ‘liberty to learn’ and provide open access to all kind of available data and facility of students/scholars. RS and GIS procured data, department has variety of geographical data like climatic and Automatic Weather Station (AWS) data of various locations, agricultural experiments etc. to carry out different and unique quality researches. Air conditioned Smart class rooms are prepared for better teaching and learning process for students.
• The GIS lab at this department has workstations, desktop PCs, Laptops, Kiosks, colour laser printer, scanners and plotters. On software continuum it has six licenses of A r c G I S a n d E R D A S e a c h a n d m a n y agricultural/meteorological analytical softwares. Procurement of more RS GIS licenses is under process. Exposure on GPS and other instruments is given to students during field studies.
• Library Facility - Nehru Library, the hub of academic and research activities of the University, is housed ina centrally located elegant building. It has a large collection of about 3.44 lakh volumes of books & other reading material and 573 current Indian and foreign print journals. A huge range of books/literatures is available on field of RS & GIS.
Job Orientation
Students passing out this course have vast job opportunity. Central government remote sensing organizations, State government remote sensing centers, Agricultural and environmental research institutes / Universities and academic institutes of Remote Sensing and GIS absorb these students. Beside this, huge job opportunities are also available in private sector and overseas as well. The Department of Agricultural Meteorology (HAU) itself advertises posts of Research Associates, Senior Research Fellows time to time
For more details contact: Dr. Raj Singh, Prof. & Head of the Deptt.Department of Agricultural Meteorology,CCS Haryana Agricultural University,Hisar – 125004, Haryana (India)Mobile : +91 9354310691Email : [email protected]
TIP
S &
TR
ICK
S
31
hile I work at the motherland of GIS services and web maps, I don’t have ArcGIS for Server or even a web server installed on my local machine. Chances W
are, many of you don’t either. For me, getting set up with a virtual machine configured with all the right software is completely doable…but not done. Things came to my head recently when I wanted to visualize some Excel data on a web map.
Of course, I could bring the Excel data into ArcMap and visualize it there, but I wanted to make a web map so I could easily share it with coworkers who don’t use ArcGIS in their day to day tasks.
Lacking the ability to publish a map service myself, I opted to go the minimalist route—that is, use the free ArcGIS.com map viewer and ArcGIS Online resources. If your organization has an ArcGIS Online subscription, you can map your data right inside Excel since Esri Maps for Office is included with the subscription.
A viable alternative for those without a subscription is to add a .csv file (text file of comma-separated values) to the ArcGIS.com map viewer and save the map to their ArcGIS Online public account. An Excel spreadsheet is easily saved as a .csv file. To be mapped, the spreadsheet must have fields that store location data - latitude and longitude values, GPX coordinate, or addresses.
I wanted to visualize the locations of individuals in the U.S. who attended the Creating Hosted Map Services with ArcGIS Online live training seminar back in October. Understanding the geographic distribution of our viewers is useful to evaluate seminar broadcast times. All I had to do to create a web map was follow these easy steps.
1.Open the Excel spreadsheet and save it as a .csv file.
2.Go to www.arcgis.com and click the map link at the bottom of the page.
3.In the map viewer, zoom to the data’s extent.
4.Keep the default World Topographic basemap or click the Basemap Gallery button and choose a different basemap.
5.To the left of the Basemap Gallery button, click Add > Add Layer from File, browse to the .csv file, then click Import Layer. (If you’re using Firefox or Chrome, you can
Tips and Tricks
Easy-Button Method to Create a Web Map
just drag and drop a .csv file into the map viewer.) In less than two minutes, I’m visualizing my data as points on a pretty map. I can click each point and see the associated data from the Excel spreadsheet in a pop-up. Easy. Except…
I only want to show certain columns, and I don’t like the names of those columns. I’d also like to symbolize the points by self-reported industry.
I can address all of these issues right in the viewer.1.In the Contents pane to the left of the map, click the arrow next to the layer name and click Change Symbols.
2.Choose Unique Symbols in the drop-down list and specify the field that stores the values you want to symbolize.
3.Choose a color ramp, then click Apply.
In the symbol preview, I notice an industry category named Other. For my purposes, Other is the same as no data. It’s easy to change the Other symbol label.
1.In the Change Symbols panel, click the label next to the Other symbol, then type a new label (No Information is more understandable for this map). If I wanted, I could click Change Symbol and assign a different symbol to distinguish this category.
2.Click OK, and then Apply. Finally, click Done Changing Symbols.
Takeaway #1: Explore your data and decide how you want to present it before putting it on a map. In the map viewer, it’s easy to change the display properties, but you can’t modify the data itself.So, in just a few more minutes, I’ve mapped viewer distribution and self-reported industry. Next, I’ll configure the pop-ups.
1.In the Contents pane, click the arrow next to the layer name again and choose Configure Pop-up.
2.Enter a descriptive pop-up title.
3.Click Configure Attributes and uncheck fields you don’t want to display, then make sure the fields you do want to display are checked. You can also use the arrow buttons to reorder the fields. Be sure to type a friendly alias for each field that will display, then click OK.
4.At the bottom of the Pop-up Properties panel, click Save Pop-up. Now when I click points on the map, I see only the information of interest. I also notice something.
30
TIP
S &
TR
ICK
S
When I zoom in to a large scale, the Topographic basemap gets very detailed. Building footprints and local streets display. Some of my symbol colors blend into the basemap features.
Switching to the Light Gray Canvas basemap is a quick solution. This basemap, with its subdued colors and less detail
at large scales, is a better backdrop for my data. �X
Takeaway #2: Before deciding on a basemap, explore it at large (and small) scales to understand the level of detail and assess its appropriateness for your mapping purpose. It’s important to choose symbol colors that will stand out against the basemap at various scales.
Finally, I want to show time zones on the map. I don’t have a layer of time zones but I’ll search ArcGIS Online content to see if anyone has shared this data.
1.Click Add > Search for Layers.
2.In the Find text box, type time zones, choose to search in ArcGIS Online, then click Go.
3.The search results include several time zone feature services. After adding one of them to the map, I change its symbology to unique values so each zone will have a different color and increase the layer transparency value so the time zone features don’t obscure the other data. In less than 20 minutes, I’ve “mappified” my Excel data and
he Swipe and Spyglass app enables users to interact with two web maps or two layers of a single web map, depending on how you build your story. The app T
enables you to present a single view, or to develop a narrative showing a series of locations or views of the same maps.This app can be an effective way to show before-and-after imagery, such as the aftermath of a storm or flood.
A builder function in the app enables you to choose between the swipe or spyglass options. Although swipe provides a more efficient way for users to compare maps, the spyglass function is fun and engaging.
Step by Step Instructions
Before you make a swipe or spyglass story map, you need to decide if you want to display one web map and have the user swipe or use the spyglass to see through one layer to see the other layers underneath, or if you want to display two web
added context to it. All that’s left is to save the map to my ArcGIS Online account. To generate a link to the map that I can embed in a web page, e-mail, or social media post, I just need to share the map.
Takeaway #3: There are lots of ways to create, save, and share a web map these days. If you don’t have access to software for creating GIS services, you’re not out of luck. Creating a high-performing web map with the ArcGIS.com map viewer really is an easy—and useful—method
App to compare two related mapsmaps and have the user swipe or see through one map to see the second map. To use the first option, you'll create a web map containing the layers you want to use, with the uppermost layer in your map being the one that users will swipe or see through. You'll then share that web map using the Swipe and Spyglass app, which lets you configure your story map.
To use the second option, you'll create two web maps for the same area, each showing the layers you want users to see. You'll then share the first web map using the Swipe and Spyglass app, and you'll be prompted to specify the second web map when you configure your story map.
Step 1
Log in to ArcGIS Online (http://www.arcgis.com/) using either a free public account or an organizational account.
TIP
S &
TR
ICK
S
32
TIP
S &
TR
ICK
S
Step 2
Author the web map, or two web maps, that you want your story map to display. This includes adding the data you want to show, choosing the symbols for the map, and configuring pop-ups for any feature layers that you want users to be able to click to get more information when they use your story map. If your story map will use two web maps, you don't need to make the extents shown in the maps identical because the Swipe a n d S p y g l a s s a p p automatically overlays the two maps together so their extents are the same. Save your web map or web maps.
Step 3
Share your web map, or web maps, publicly.
Step 4
Launch the interactive builder for the Swipe and Spyglass app.
Alternatively, you can launch the builder from within ArcGIS Online. In ArcGIS Online, open your web map (or either of your two web maps), click the Share button, and in the dialog that appears, click the Make a Web Application button. In the gallery of applications that appears (see the image to the right), browse to the Storytelling Swipe app and click Publish. This creates a web app. In the entry for the created app, click the Configure App button, and the builder will launch.
Step 5
In the builder, follow the steps to configure your story map. This is where you choose between the swipe or spyglass style, choose the web map or maps you want to use, and specify the layout of your app, such as whether you want a description panel, a legend, and so on.
On the final panel of the dialog, click the Open the app' button to continue.
Step 6
In the builder, enter the title and subtitle of the app. If you chose to have a description panel in the app, you can also enter and format the text it contains. Click the Settings button to access additional options for your app. For example, the Theme tab in Settings allows you to change the color of the header and side panel, and the Header tab lets you specify a custom logo and links for the top right corner of the application. You can use that option to add your agency or organization logo and a link to your home page.
Step 7
When you finish configuring your app, click the Save button at the top of the builder to save your app. Finally, click the Share button to publish your application and make it publicly accessible. You also have the option, if you're using an ArcGIS organizational account, to share your story map so it's
accessible only within your organization. That option is not available if you're using a free public account.
Congratulations, your swipe or spyglass story map is now operational.
To make changes to your story map, launch it, and click the Switch to builder mode button in the header. (This button is only available when you're signed in to ArcGIS Online, and other people won't see it). You can also access your story map to make modifications to it via its application item page, which is the entry in ArcGIS Online representing your app. You can find a link to your story map's application item page in the Share dialog. You can also access it via your My Contents page in ArcGIS Online. Optionally, you can edit your application item page to add a thumbnail image (such as a screen shot of the app), add additional tags to help people find it, and so on
TIP
S &
TR
ICK
S
32
TIP
S &
TR
ICK
S
Step 2
Author the web map, or two web maps, that you want your story map to display. This includes adding the data you want to show, choosing the symbols for the map, and configuring pop-ups for any feature layers that you want users to be able to click to get more information when they use your story map. If your story map will use two web maps, you don't need to make the extents shown in the maps identical because the Swipe a n d S p y g l a s s a p p automatically overlays the two maps together so their extents are the same. Save your web map or web maps.
Step 3
Share your web map, or web maps, publicly.
Step 4
Launch the interactive builder for the Swipe and Spyglass app.
Alternatively, you can launch the builder from within ArcGIS Online. In ArcGIS Online, open your web map (or either of your two web maps), click the Share button, and in the dialog that appears, click the Make a Web Application button. In the gallery of applications that appears (see the image to the right), browse to the Storytelling Swipe app and click Publish. This creates a web app. In the entry for the created app, click the Configure App button, and the builder will launch.
Step 5
In the builder, follow the steps to configure your story map. This is where you choose between the swipe or spyglass style, choose the web map or maps you want to use, and specify the layout of your app, such as whether you want a description panel, a legend, and so on.
On the final panel of the dialog, click the Open the app' button to continue.
Step 6
In the builder, enter the title and subtitle of the app. If you chose to have a description panel in the app, you can also enter and format the text it contains. Click the Settings button to access additional options for your app. For example, the Theme tab in Settings allows you to change the color of the header and side panel, and the Header tab lets you specify a custom logo and links for the top right corner of the application. You can use that option to add your agency or organization logo and a link to your home page.
Step 7
When you finish configuring your app, click the Save button at the top of the builder to save your app. Finally, click the Share button to publish your application and make it publicly accessible. You also have the option, if you're using an ArcGIS organizational account, to share your story map so it's
accessible only within your organization. That option is not available if you're using a free public account.
Congratulations, your swipe or spyglass story map is now operational.
To make changes to your story map, launch it, and click the Switch to builder mode button in the header. (This button is only available when you're signed in to ArcGIS Online, and other people won't see it). You can also access your story map to make modifications to it via its application item page, which is the entry in ArcGIS Online representing your app. You can find a link to your story map's application item page in the Share dialog. You can also access it via your My Contents page in ArcGIS Online. Optionally, you can edit your application item page to add a thumbnail image (such as a screen shot of the app), add additional tags to help people find it, and so on
(A) Purpose : You can publish your mapservices using Esri Desktop, however, if one would like to develop a code to directly publish a mapservice from command prompt to server, here it is. It needs to be developed in Python and work on Windows platform.
B) Purpose : In 3D data there is an analysis for computing the Aspect and Hill Shade on Raster data. Which means where shadow will fall based on the position of Sun.
Given below is a Python script do the analysis and provide result.
importarcpy
fromarcpy import env
# Set environment settings
env.workspace = "D:\ESRI\wrkSpace"
# Set local variables
inRaster = "RASTERIMAGEPATH"
outRaster = "D:\ESRI\wrkSpace\HillShade"
outAspect = "D:\ESRI\wrkSpace\Aspect"
azimuth = 180
altitude = 75
modelShadows = "SHADOWS"
zFactor = 0.348
# Check out the ArcGIS 3D Analyst extension license
What can I do with the Free Development and Testing
plan?
• Access our awesome hosted services (hosted data storage, analysis, geocoding, directions, maps, etc) provided through the plan
• You can develop and test apps using our developer tools and APIs. If you're going to generate revenue or are using the app for government or business purposes, you'll have to upgrade to a paid subscription when you're ready to make your application available.
• You can also use this plan to build apps for public, non-revenue generating, non-government, non-commercial use.
• You can also sell your apps to anyone to use with their paid ArcGIS Online subscription
• If you are using 3rd Party development tools, you must include attribution acknowledging that your app is using online services provided by Esri
How many credits are included with the Free
Development and Testing Plan?
We are giving you 50 credits per month. If you don't use those credits, they'll expire and we'll give you another 50 credits the next month.
What can I do with 50 credits per month?
• You can use your credits on any of our hosted services. If you spent all your credits on any one of the hosted services, you'd be able to:
• Generate 50,000 map tiles
• Store 208 MB of features
• Store 41 GB of map tiles
• Geocode 1,250 addresses
• Perform 1,250 simple routes
• Perform 100 optimized routes
• Perform 100 drive time calculations
• Perform 100 closest facility calculations
• Perform 25 delivery optimization routes
• Enrich your data with 5,000 variables
• Check out 4,545 Infographic views
• Draw 50,000 demographic maps
• Generate 5 demographic reports
• Perform spatial analysis on 50,000 features
You're also allowed to view 1,000,000 basemaps per month without consuming any credits.
• Sell your apps powered by your paid subscription to anyone
• You can also sell your apps to anyone to use with their Paid ArcGIS Online subscription
• Include for-fee ads with a paid subscription
• Build apps using our developer tools and APIs
• Build apps using 3rd party tools (like leaflet)
What can't I do with an ArcGIS Online Developer
subscription?
• Share access (login credentials) to your ArcGIS Online Developer Subscription
• Remove any logos or other attributions associated with the use of ArcGIS Online services
36
GIS
TR
IVIA
37
GIS
TR
IVIA
What exactly does an ArcGIS Online Developer
subscription allow me to build and launch?
With a paid subscription you can build and sell apps but let's dive into specifics:
• Can I sell my apps in app stores? Yes
• Can I sell my apps to 3rd party companies? Yes
• Can I include for-fee ads? Yes
• Are there royalties? No, you only need to pay your ArcGIS
Online subscription fees.
Can I remove the Esri logo from my maps?
No. If you use our map services, you must keep all logos and other attribution on the maps.
Can I sell or monetize my app while powered by Free
Development and Testing plan?
No. If you want to generate revenue with your app, you need to purchase a paid ArcGIS Online Developer subscription.
However you can sell your application to organizations using ArcGIS Online to use with their credits.
Can I access the basemaps and
services from my own API or a
different API?
Yes you can access our APIs from any other API if you have a paid plan or while you a re tes t ing o r developing an application with the Free Development and Testing plan
Does accessing Esri basemaps
consume credits?
No. Using Esri basemaps in your apps does not consume credits but you are limited to using 1 million basemaps per month.
Are there any limitations on basemap transactions?
Yes. You are entitled to use 1 million basemap transactions per month. If you think you'll need more, contact us.
Does using the geosearch consume credits?
No. Using geosearch in your apps to find a single address does not consume credits but you are limited to using 1 million geosearches per month.
Are there any limitations on geosearch transactions?
Yes. You are entitled to use 1 million geosearch transactions per month. If you think you'll need more, give us a call - http://www.esri.com/about-esri/contact
Is there a limitation on the number of apps I can build or
sell using the ArcGIS Online Developer Subscription?
No. You can build and sell as many as you want.
What if I have 5 members on my team? Do I need 5
ArcGIS Online accounts or can I share my
username/password?
Depends on what kind of ArcGIS Online account you have. Here's the breakdown:
• ArcGIS Online Developer Plan Account: There is only one login. One person can login to the apps and manage the account, create new feature services, generate appIDs, etc. Once the appID and app secrets have been generated, multiple developers can build apps, however.
• ArcGIS Online Organization Plan Account: Each member of the team would need his or her own Named User login credential.
Can I give others access to my account to purchase more
credits with their own credit cards?
No.
Do I need an ArcGIS Online Developer Account
subscription if I have an ArcGIS Online Organization
Account?
N o . T h e O rganizational Account has all of the same capabilities as the Developer Account, plus it allows for sharing and collaboration among a number of users.
How do I get AppIDs?
You can create AppIDs in the "Appl icat ions" sect ion of
developers.arcgis.com (once you're logged in) or from the "My Contents" section of
arcgis.com (once logged in).
What i s the d i f ference
between a commercial and a
non-commercial app?
An app is considered commercial if:
• You license or sell it to others for a fee
• You derive ad-generated revenue from the app
If you want to sell or otherwise monetize your app, you need to have a paid ArcGIS Online Plan subscription.
What happens to my apps when my account runs out of
credits?
If you're using the Free Development and Testing plan, you'll have to either upgrade to a paying subscription, or wait till the next month (when we'll top you up with another 50 credits). If you're using our paid plans, you can decide how you want your account to behave with respect to credit consumption:
You can configure your subscription to allow "overages"
• When your monthly subscription runs out of credits, you will be charged a little more, per credit than you in-plan fee ($.13/credit vs $.10/credit)
• You will be billed when you've spent $520 worth of credits (4000 credits) or at the next billing period, whichever comes first
• You can upgrade your plan at any time, howeverYou can configure your subscription NOT to allow "overages"
• When your monthly subscription runs out of credits, your account will be suspended. You can still log in. But your applications will not be allowed to access services that consume credits such as directions, bulk geocoding, geoenrichment or demographic maps.
• At the next billing cycle, you'll get a new batch of monthly Credits In each of the two scenarios above, you can configure your subscription to notify you at, for example, 75%, 90%, 100% of credit usage.
However, you can upgrade your plan at any time to avoid overages
ne of the fundamental properties that defines how a GIS handles features, objects, and surfaces in space is Oits ability to render in three dimensions (3D). The term
three dimensional is widely misused in that many software applications today store and display data in two and a half dimensions (2.5D). The ArcGIS 3D Analyst extension has the ability to store raster, TIN, terrain dataset, and LAS dataset data as functional surfaces, which are actually 2.5D. A functional surface is continuous, and all locations on the surface can have only one elevation, or z-value, per x,y coordinate. True 3D surfaces are sometimes known as solid model surfaces, and ArcGIS handles these through multipatch features. In contrast to a functional surface, which has surface continuity, are solid model surfaces that can model and store true 3D, or multiple z-values, per x,y coordinate.
Multipatch features, tetrahedral objects, and voxel space are examples of true 3D data. This data is sometimes considered solid model surfaces and can store more than one z-value per x,y position. A telephone pole is an example of a multipatch object. There is a z-value at the top of the pole as well as the bottom. However, if you wanted to measure all the foot rungs on the telephone pole, the result would be one telephone pole in x,y space with many z-values, each representing another rung on the way up the pole.
Tetrahedral objects are essentially three-dimensional TINs. A significant difference is that they form tetrahedrals instead of two-dimensional triangles and can model objects in 3D. The nodes that comprise the tetrahedral object are irregularly spaced, which makes them ideal candidates for complex, varying surface models such as automobiles, buildings, vegetation, and animals. Voxels are volumetric pixels. This type of data is interesting in that it can model a 3D object using a block of cells (voxels) with a homogeneous resolution and pattern.
Surfaces, however, are generally modeled as functional and are 2.5D. This type of data has surface continuity and is different than 3D surfaces, or solid surface models, which can store more than one z-value per x,y location.
Functional surfaces
3D Analyst treats raster, TIN, terrain dataset, and LAS dataset surfaces as functional. Functional surfaces can store a single z-value, as opposed to multiple z-values, for any given x,y location. Probably the most common example of a functional surface is terrestrial surfaces representing the earth's surface. Other examples of terrestrial functional surfaces include bathymetric data, water table depths, and individual geologic strata. Functional surfaces can also be used to represent statistical surfaces describing climatic and demographic data, concentration of resources, and other biologic data. In addition, functional surfaces can be used to represent mathematical surfaces based on arithmetic expressions such
DID YOU KNOW?
What is a functional surface?
as Z = a + bX + cY. Functional surfaces are often referred to as 2.5 dimensional.
Surface continuity (2.5D vs. 3D)
Functional surfaces are considered continuous. That is, if you
approach a given x,y location on a functional surface from any direction, you will discover the same z-value at the location. This can be contrasted with a discontinuous surface, where different z-values could be obtained depending on the approach direction. An example of a discontinuous surface is a vertical fault displacing the surface of the earth.
Depending on whether you approach this vertical fault from the right or left along this discontinuous surface, it's possible to observe different z-values at the same x,y location.
A location at the top of a fault has one elevation, but immediately below this point at the bottom of the fault you can observe another elevation. As you can see, a model capable of storing a discontinuous surface must be able to store more than one z-value for a given x,y location.
Solid model surfaces
Functional surface models can be contrasted with solid model surfaces, which are true 3D models capable of storing multiple z-values for any given x,y location. Solid models are common in computer-aided design (CAD), engineering, and other applications representing solid objects. ArcGIS can render 3D models as features in a multipatch feature class.
Examples of objects suited to solid modeling are machine parts, highway structures, buildings, and other objects placed on the earth's surface. In some cases, it is possible to represent some three-dimensional objects, such as faults and buildings on a functional surface, by slightly offsetting the duplicate x,y coordinates.
As with any geospatial information, surfaces need to be organized and stored on computers for access, management, visualization, and distribution. With ArcGIS, there are two approaches for managing your surface data: geodatabase or file-based. The method you choose is partially your choice but is also limited by the surface type.
Geodatabases are collections of spatial data native to ArcGIS that collate several features or raster datasets all in one place.
Surface formats
38
GIS
TR
IVIA
ArcGIS offers three types of geodatabases: personal, file, and ArcSDE.
File-based formats can be Esri specific (TIN, Grid), open-source and standardized exchange formats (TIFF, JPEG 2000), or third-party formats (IMG, PIX). ArcGIS supports many file-based formats.
Surface types
There are four types of surface models available in ArcGIS: raster, TIN, LAS datasets, and terrain datasets. Each surface type is stored according to its characteristics.
Raster
Surfaces that are raster in nature can be stored in a personal, file, or multiuser geodatabase. There are two methods for storing rasters in a geodatabase. Raster datasets are individual rasters that are a single matrix of rows and columns. A mosaic of imagery is considered a raster dataset. The other method for storage of rasters in a geodatabase
(personal, file, or ArcSDE) is as a raster catalog, which is a collection of several raster datasets.
Raster surfaces can also be stored in file-based solutions. In this format, all the information is stored in a file or series of files that comprise the raster data. A tagged image file format (TIFF) is an example of a file-based surface storage solution. Esri Grid is an Esri-specific format that is not just a single file but a folder with a collection of files that are all interdependent. The bit depth (the number of bits that each cell can store) varies from format to format, so be sure to choose an appropriate file format for your data.
TIN
Triangulated irregular networks (TINs) are the vector equivalent of raster-based surfaces. A series of nodes are joined together by triangular faces that represent the surface for display. Theoretically, any z-value on the face of the triangle can be calculated to a defined degree of accuracy. TINs cannot be stored in any of the three types of geodatabases; they can only be stored in file-based storage solutions. Similar to other ArcGIS file-based storage formats, TINs reside in a folder with a number of interdependent files.
LAS dataset
Page No. 39Inner Back Page
A LAS dataset stores reference to one or more LAS files on disk, as well as to additional surface features. A LAS file is an industry-standard binary format for storing airborne lidar data. The LAS dataset allows you to examine LAS files, in their native format, quickly and easily, providing detailed statistics and area coverage of the lidar data contained in the LAS files.
Terrain dataset
Unique to ArcGIS, the terrain dataset is a collection of participating feature classes that are contained in a feature dataset. Terrains define how multiresolution TIN surfaces are generated on the fly according to a logical indexing of spatially organized source data. The source data is points, breaklines, polygons, and other vector-based measurement data. Since terrains must reside inside a feature dataset, they can only be stored in personal, file, or multiuser geodatabases.
Surface smoothness
Smoothness is described in terms of normals. The term "normal" or "surface normal" to a plane is an imaginary vector line direction which is perpendicular to that plane. Thus, the perpendiculars across surface slopes are the normals to the surface. As you approach changes in slope across a smooth, continuous surface, the direction of the normals change their orientation gradually.
Two surfaces with different levels of smoothness are shown below. The first surface, represented by flat planar facets, is not smooth. The normal to the surface is constant throughout the extent of an individual facet. However, as the normal crosses an edge separating two adjacent facets, the normal abruptly changes.
Contrast this behavior with the surface on the right. The normal to the surface on the right varies continuously across the surface. The normal does not change abruptly as it crosses an edge in the surface.
Terrain surfaces vary in smoothness. Geologically young terrains typically have sharp ridges and valleys, in contrast to older terrains that have been smoothed by prolonged exposure to erosional forces. Statistical surfaces, such as a rainfall or air temperature surface, are generally smooth