In cooperation with the U.S. Environmental Protection Agency Geochemical Data from Groundwater at the Proposed Dewey Burdock Uranium In-Situ Recovery Mine, Edgemont, South Dakota By Raymond H. Johnson Open-File Report 2012–1070 U.S. Department of the Interior U.S. Geological Survey
Transcript
In cooperation with the U.S. Environmental Protection Agency
Geochemical Data from Groundwater at the Proposed Dewey Burdock Uranium In-Situ Recovery Mine, Edgemont, South Dakota
By Raymond H. Johnson
Open-File Report 2012–1070
U.S. Department of the Interior U.S. Geological Survey
U.S. Department of the Interior KEN SALAZAR, Secretary
U.S. Geological Survey Marcia K. McNutt, Director
U.S. Geological Survey, Reston, Virginia: 2012
For product and ordering information: World Wide Web: http://www.usgs.gov/pubprod Telephone: 1-888-ASK-USGS
For more information on the USGS—the Federal source for science about the Earth, its natural and living resources, natural hazards, and the environment: World Wide Web: http://www.usgs.gov Telephone: 1-888-ASK-USGS
Suggested citation: Johnson, R.H., 2012, Geochemical data from groundwater at the proposed Dewey Burdock uranium in-situ recovery mine, Edgemont, South Dakota: U.S. Geological Survey, Open-File Report 2012–1070, 11 p.
Any use of trade, product, or firm names is for descriptive purposes only and does not imply endorsement by the U.S. Government.
Although this report is in the public domain, permission must be secured from the individual copyright owners to reproduce any copyrighted material contained within this report.
Figures 1. Location of study area ............................................................................................................................................. 6 2. Map showing satellite imagery overlain with monitoring well locations ................................................................... 7 3. Expanded view of Dewey area ................................................................................................................................ 8 4. Expanded view of Burdock area.............................................................................................................................. 9 5. Typical wellhead control valves ..............................................................................................................................10 6. "T-valve" used for sampling....................................................................................................................................11
Tables [Click on title to view in Excel or PDF format] 1. Bottle type and size, rinsing, filtration, and preservation for analytes ...................................................................... 3 2. Locations and geochemical data for groundwater samples.................................................................................. link 3. Geochemical data for duplicates and blanks ........................................................................................................ link
Appendixes [Click on title to view in Excel or PDF format] A. EPA-DOC.xlsx ..................................................................................................................................................... link B. EPA-anions.xls .................................................................................................................................................... link C. EPA-O&D.xls ....................................................................................................................................................... link D. EPA-ICPOES.xls ................................................................................................................................................. link E. EPA-ICPMS.xls.................................................................................................................................................... link F. U isotopes Ketterer.pdf ........................................................................................................................................ link
Geochemical Data from Groundwater at the Proposed Dewey Burdock Uranium In-Situ Recovery Mine, Edgemont, South Dakota
By Raymond H. Johnson
Abstract This report releases groundwater geochemistry data from samples that were collected in
June 2011 at the Dewey Burdock proposed uranium in-situ recovery site near Edgemont, South Dakota. The sampling and analytical methods are summarized, and all of the data, including quality assurance/quality control information are provided in data tables.
Introduction Powertech Uranium Corporation (Powertech) has proposed to mine uranium at the Dewey
Burdock site using in-situ recovery methods. The Dewey Burdock site is located in the southwestern region of the Black Hills of South Dakota (fig. 1). The uranium recovery license application by Powertech to the United States Nuclear Regulatory Commission (NRC) is publicly available and contains background information about the site along with technical details and baseline sampling data. The NRC application Web site is: http://www.nrc.gov/materials/uranium-recovery/license-apps/dewey-burdock.html (with detailed application documents under the “application documents” link). A brief summary of the site history is provided by Powertech at http://www.powertechuranium.com/s/DeweyBurdock.asp.
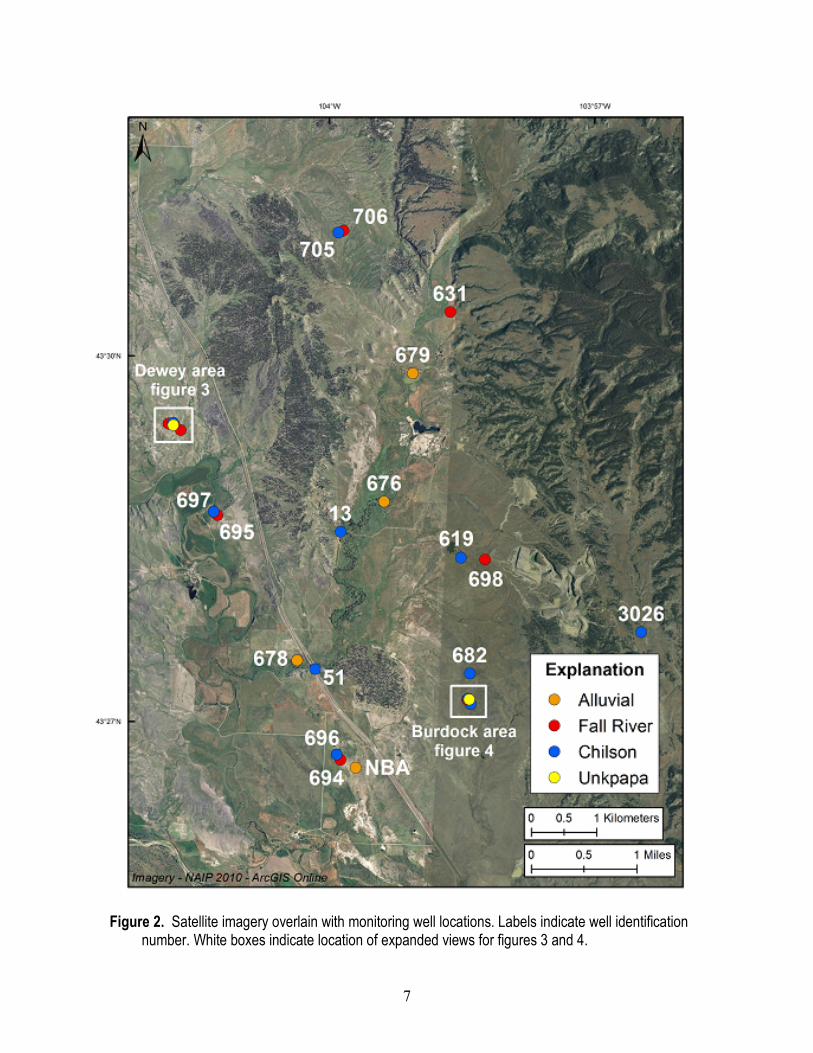
At the Dewey Burdock site, uranium occurs as roll-front ore bodies in several sandstone units of the Inyan Kara Group of Early Cretaceous Age. The Late Jurassic Morrison Formation underlies the Inyan Kara Group. In the vicinity of the mine site, the Inyan Kara Group is comprised of the Fall River Formation (upper unit) and the Lakota Formation (lower unit). The Lakota Formation is comprised of the Chilson and the Fuson Members, with the Fuson Member occurring between the Fall River and Lakota Formations. Uranium roll-front deposits occur in the Fall River Formation and the Chilson Member of the Lakota Formation. Other geologic units of interest for the study area are the surface alluvial aquifers and the Unkpapa aquifer underlying the Morrison Formation. The well location symbols on the maps in figures 2 through 4 are color coded to indicate the aquifer screened interval for each well.
The U.S. Geological Survey (USGS) collected 28 groundwater samples from monitoring wells (figs. 2 through 4) in and around the Dewey Burdock site during the last two weeks of June 2011. This sampling was completed with funding from the U.S. Environmental Protection Agency (USEPA) Region 8’s Regional Applied Research Effort (RARE) Program. USEPA is responsible for evaluating the site through its underground injection control program
(http://www.epa.gov/region8/water/uic) and Powertech has submitted a separate permit application to USEPA (see documentation in a link within the above USEPA Web site). While these new samples provide data on major ion and metal concentrations that overlap with Powertech’s baseline sampling, the main intent of this sampling is to get isotopic measurements that will be used to better understand the hydrogeologic system.
Sampling Methods Groundwater samples were collected using either a peristaltic pump (used in shallow wells),
a bailer (used when access problems were encountered), installed pump, or using a low-flow, submersible, stainless steel pump. Many of the wells are under artesian pressure and are flowing, with a valve assembly attached at the surface to control the flow (fig. 5). This same valve assembly was present in all wells with installed pumps. For wells with installed pumps or that were flowing, approximately three well bore volumes were purged prior to sampling.
A peristaltic pump was used in shallow 2-inch diameter wells where the water table was less than 27 feet below the top of the well casing. The sample tubing was placed approximately 1 foot above the bottom of the well and groundwater was purged until field parameters stabilized, which usually occurred within a few minutes. New polyethylene sample tubing was used for each well.
The submersible pump was a Geotech SS Geosub model by Geotech Environmental. The stainless pump was placed at approximately 50 feet below the water table and a drop tube assembling was lowered ahead of the pump to the bottom of the well (http://www.geotechenv.com/pdf/ground_water_sampling_equipment/ss_geosub_wcontroller.pdf ). The tubing and pump were then pulled back so the intake was one foot from the bottom of the well. This allowed for direct sampling within the well screen and within the active groundwater flow zone using micropurge sampling. Groundwater was purged until field parameters stabilized, which usually occurred within a few minutes and was generally a function of meter stabilization (partially because of added pumping pressure) and not a change in groundwater conditions. New polyethylene sample tubing was used for each well.
A bailer was used in well 680 when the installed pump in the well failed after having purged three casing volumes. The well head was opened and the bailer was used to get water within the casing. A bailer was also used for well NBA, a newly installed well with a 2-inch diameter casing where the water table was below the limit of the peristaltic pump. A bailer was used to purge the well of three casing volumes before sampling. Sampling was completed using the peristaltic pump with new sample tubing to get water out of the bailer and through an inline filter.
For all samples, groundwater sampling was completed through a “T-valve” apparatus that split the flow into a flow through cell for field parameter measurement and a separate line for filling sample bottles (fig. 6). The sample line included an inline 0.45 micron filter that was used for all bottles except for tritium (sample NBA was filtered for tritium also, as the sediment load was high). Field parameter measurements of pH, specific conductance, temperature, dissolved oxygen, and oxidation/reduction potential were all done using a YSI 556 multiparameter meter that screwed directly into the flow through cell (see cover photograph), thereby eliminating any contact with the atmosphere.
Nine aliquots of water provided samples for (1) cations/metals, (2) 234U/238U activity ratios, (3) anions, (4) dissolved organic carbon, (5) iron pairs (Fe3+/Fe2+), (6) tritium, (7) stable isotopes (18O and deuterium), (8) sulfur isotopes (34S), and (9) carbon isotopes (14C). Details on bottle type,
bottle size, rinsing, filtration, and preservative methods are listed in table 1. Any acids used for preservatives were ultra pure and made specifically for sample preservation. For bottles that were rinsed, rinsing was completed three times prior to filling the bottle.
Table 1. Bottle type and size, rinsing, filtration, and preservation for analytes. [HDPE, high density polyethylene; mL, milliliter; L, liter; µm, micrometer; HNO3, nitric acid; HPO4, phosphoric acid; HCl, hydrochloric acid]
Analytes Bottle Type Bottle Size Rinsing Filtration Preservative
Cations and dissolved metals
HDPE 30 mL New bottle, rinse with sample water 0.45-µm 5 drops HNO3 or
to pH less than 2
234U/238U HDPE 30 mL New bottles, rinse with sample water 0.45-µm 5 drops HNO3 or
to pH less than 2
Anions HDPE 30 mL New bottle, rinse with sample water 0.45-µm Keep cool
Dissolved organic carbon Amber glass 125 mL
New bottles, cleaned and burned, do not rinse with sample water
0.45-µm 5 drops HPO4 or to pH less than 2, keep cool
Dissolved iron species
Amber polyethylene 60 mL New bottle, rinse
with sample water 0.45-µm 5 drops HCl or to pH less than 2, keep cool
Tritium HDPE 500 mL New bottles, rinse with sample water None None
Water Isotopes: 18O and Deuterium
Borosilicate glass 60 mL New bottles, rinse
with sample water 0.45-µm None
34S HDPE 125 mL New bottles, rinse with sample water 0.45-µm
2 drops of HNO3 to reduce biotic activity
14C Amber glass 1 L
New bottles, cleaned and burned, do not rinse with sample water
0.45-µm Keep cool
Analytical Methods This section describes the analytical procedures completed on each of the nine water sample
aliquots. The cations/metals sample was analyzed at the USEPA (Ada, Oklahoma) and at the USGS laboratories (Denver, Colorado). USEPA analyses were made using inductively coupled plasma – optical emission spectrometry (ICP-OES, Perkin-Elmer Optima 3300DV) using EPA Method 200.7 and inductively coupled plasma – mass spectrometry (ICP-MS, PQExcell, Thermo Elemental) using USEPA Method 6020. USGS analyses were made using ICP-MS at the USGS Mineral Resources Laboratory (Denver, Colorado) following the method described in Lamothe and others (2002).
4
The 234U/238U activity ratios were analyzed by Michael Ketterer at the Northern Arizona University in Flagstaff, Arizona using a sector field Thermo X Series II quadrupole ICP-MS unit. Details on the analytical method can be found in file Appendix F.
Dissolved anions were analyzed by the USEPA laboratories (Ada, Oklahoma) using capillary electrophoresis with ultraviolent (UV) detection (USEPA Method 6500). Capillary ion electrophoresis is a free-zone electrophoretic technique optimized for the analysis of anions with molecular weights of less than 200 grams/mole. The anions migrate and are separated according to their mobility in the electrolyte when an electrical field is applied through the open tubular fused silica capillary.
Concentrations of dissolved inorganic carbon were measured by the USEPA laboratories (Ada, Oklahoma) with a Dohrmann DC-80 Carbon Analyzer (USEPA Method 9060A). Iron pairs (Fe3+/Fe2+) were completed by David Fey at the USGS Mineral Resources Laboratory (Denver, Colorado) using the ferrozine method for iron species discussed in Bangthanh To and others (1999). Tritium analyses were completed by Robert Michel at the USGS Isotope Laboratory in Menlo Park, California using liquid scintillation counting with a detection limit of approximately 0.6 tritium units (TU) (similar to USEPA method 906.0). Oxygen- and hydrogen-isotopic ratios of water were analyzed using a high temperature conversion elemental analyzer linked to a continuous flow isotope ratio mass spectrometer (Finnigan Delta plus XP). These analyses followed the methods presented by Lu (2009). Sulfur isotopes (34S) were analyzed by Christopher Eastoe at the University of Arizona following the method of Coleman and Moore (1978). Additional analytical procedures for that laboratory can be found at http://www.geo.arizona.edu/research/iso_analytical.html.
Data All of the resulting data are provided in table 2. Sample identification numbers in table 2
match the well identification numbers used in Powertech permit application documents. Original labeling included “B” and “D” in the sample name for ease of sample identification (found in appendix files) by area, “B” for Burdock and “D” for Dewey, but were not included in the final data table (table 2).
The samples in table 2 have been organized by categories to reflect geologic units that the wells are screened in along with general area locations. These are purely initial categories used by the author for later use in interpretations.
Quality Assurance/Quality Control For all USEPA solution measurements, quality assurance tests involved duplicate samples,
blanks, sample matrix spikes, calibration check standards, and second-source quality control samples. Data for the laboratory quality assurance/quality control (QA/QC) checks are included in the original data that can be found in the appendixes. Uranium isotope data also included internal laboratory checks that can be found in Appendix F. All other laboratories used typical internal reference standards for the appropriate analyses and QA/QC information is available upon request. No internal laboratory QA/QC issues were found.
In addition to the internal laboratory checks, three duplicate samples and five blanks were submitted as part of the QA/QC process. Data from these duplicates and blanks are reported in table 3. No QA/QC issues were found in any of the duplicate samples. Blanks for all of the different sampling conditions are represented (Geosub pump, peristaltic pump, and bailer
sampling). For metals, cations, and anions, a few blanks did show values above the detection limits, but generally these values were well below any sample results. Only one blank had an iron concentration that was high enough compared to the groundwater samples to be of concern. Iron in the bailer blank (B-VS4) was 3.72 µg/L, which is likely because of incomplete cleaning of the bailer. Cleaning the bailer was difficult because of limited access inside the bailer in addition to sample NBA (well sampled prior to blank) having a high silt content. As a result, any measured iron values below 4 µg/L, may not be accurate, especially for samples using a bailer. Sample data were not blank corrected.
Acknowledgments Funding from the US EPA made this data collection possible. Special thanks go to Richard
Wilkin (USEPA, Ada, Oklahoma) for managing the USEPA contract and organizing the sample submittals to the appropriate USEPA laboratories. We are grateful for well access provided by individual land owners and through arrangements made by Powertech. Powertech employees, Wyatt Van Eaton and Mike Beshore provided invaluable assistance in accessing the wells and assisting with equipment logistics. Facilities for equipment storage and a convenient staging area were provided by Mark Hollenbeck. In addition, the groundwater sampling included assistance from Brian Zimmerman, Andrew Mahan, Valois Shea, Tanya Gallegos, and John Horton.
References Cited Bangthanh To, T., Nordstrom, D.K., Cunningham, K.M., Ball, J.W., and McCleskey, R.B., 1999,
New method for the direct determination of dissolved Fe(III) concentration in acid mine waters: Environmental Science and Technology, v. 33, p. 807–813.
Coleman, M. L., and Moore, M.P., 1978, Direct reduction of sulfates to sulfur dioxide for isotopic analysis. Analaytical Chemistry, v. 50, p. 1594-1598.
Lamothe, P.J., Meier, A.L., and Wilson, S.A., 2002, The determination of forty-four elements in aqueous samples by inductively coupled plasma–mass spectrometry, in Taggart, J.E., ed., chap. H, Analytical methods for chemical analysis of geologic and other materials, U.S. Geological Survey: U.S. Geological Survey Open-File Report 02-223-H, 11 p., available at http://pubs.usgs.gov/of/2002/ofr-02-0223/H21&23OFR99-151_M.pdf.
Lu, F.H., 2009, Online high-precision δ2H and δ18O analysis in water by pyrolysis: Rapid Communications in Mass Spectrometry, v. 23, p. 3144-3150.
Figure 2. Satellite imagery overlain with monitoring well locations. Labels indicate well identification number. White boxes indicate location of expanded views for figures 3 and 4.
8
Figure 3. Expanded view of Dewey area. Labels indicate well identification number.
9
Figure 4. Expanded view of Burdock area. Labels indicate well identification number.