Page 1
ORIGINAL ARTICLE
Geochemical study of pottery sherds from an archaeological sitenear Mosnje (Slovenia)
Nastja Rogan Smuc • Matej Dolenec •
Judita Lux • Sabina Kramar
Received: 4 October 2012 / Accepted: 16 October 2013
� Springer-Verlag Berlin Heidelberg 2013
Abstract This study is a geochemical analytical
approach to the characterization of pottery samples from an
archaeological site near Mosnje (Slovenia). Inductively
coupled plasma–mass spectrometry and statistical analyses
were used to determine detailed geochemical properties of
the pottery sherds and to identify potentially individual
groups among the samples studied. The geochemical
results indicated the existence of four major groups of the
pottery sherds: the first and second groups are assembled
from eight samples, all generally characterized by their
high CaO and TOT/C content; the third group comprised
the samples with the highest SiO2 concentrations; and the
fourth group is represented by the samples K3, K5 and
K13. The principal component analysis and cluster analysis
validated the existing groups and revealed a high degree of
chemical similarity between these groups. The geochemi-
cal and statistical data confirmed the archaeologists’
hypothesis and interpretation of a similar origin/alteration
of source material/probable local ceramic production for
the majority of the pottery sherds; the imported origin of
samples K3 and K13 was recognized, while sample K5 had
been intentionally imported as a sample for comparative
purposes.
Keywords Geochemical composition � ICP–MS �Statistical analysis � Pottery sherds � Mosnje �Slovenia
Introduction
Pottery was probably the first synthetic material made by
humans, and pottery production is one of the oldest and
extensive of human activities in all civilizations. Pottery
fragments are usually found at numerous archaeological
sites around the world and consequently comprise the
material most often studied by scientists (Barone et al.
2002; Barrios-Neira et al. 2009; Belfiore et al. 2007, 2010;
Comodi et al. 2006; De Clercq and Degryse 2008; Iorda-
nidis et al. 2009; Mangone et al. 2009; Rathossi et al. 2004;
Riederer 1992, 2004). The analytical techniques commonly
used to study the chemical properties of pottery samples
are inductively coupled plasma spectroscopy (ICP), X-ray
fluorescence (XRF), neutron activation analysis (NAA),
etc. (Iordanidis et al. 2009; Aldrabee and Wriekat 2011;
Glascock et al. 2004; Maniatis and Tsirtsoni 2002;
Mommsen et al. 2002; Polvorinos del Rıo et al. 2005;
Sanchez Ramos et al. 2002). ICP–MS is a very important
mass spectrometric analytical technique for the multi-ele-
mental chemical analysis of solid samples in materials
science. This technique has excellent analytical character-
istics such as high precision, selectivity and sensitivity
(Becker 2002).
The variation in the chemical composition of pottery
either defines its origin from different production sites or
reflects the natural inhomogeneity of local clay deposits
N. Rogan Smuc (&) � M. Dolenec � S. Kramar
Department of Geology, Faculty of Natural Sciences
and Engineering, University of Ljubljana, Askerceva 12,
1000 Ljubljana, Slovenia
e-mail: [email protected]
J. Lux
Preventive Archaeology Department, Institute for the Protection
of the Cultural Heritage of Slovenia, Tomsiceva 7, 4000 Kranj,
Slovenia
S. Kramar
Slovenian National Building and Civil Engineering Institute,
Dimiceva 12, 1000 Ljubljana, Slovenia
123
Environ Earth Sci
DOI 10.1007/s12665-013-2874-1
Page 2
and denotes manufacturing processes in local workshops
(Belfiore et al. 2007; Glascock et al. 2004; Barone et al.
2005; Bruno et al. 2000; Fermo et al. 2008; Mannino and
Orecchio 2011; Tandoh et al. 2009; Zhu et al. 2004).
Additionally, it is important to employ different multivar-
iate statistical methods in analysing the correlation between
elemental concentrations, as well as with absolute con-
centrations, to establish the various sources of pottery
samples. Many examples of the application of principal
component analysis and cluster analysis methods, includ-
ing cluster analysis (CA), principal component analysis
(PCA) and discriminant analysis (DA), are present in the
literature (Belfiore et al. 2007; Glascock et al. 2004;
Barone et al. 2005; Bruno et al. 2000; Fermo et al. 2008;
Mannino and Orecchio 2011; Tandoh et al. 2009; Zhu et al.
2004; Baxter 1994; Baxter and Buck 2000).
In Slovenia, there are only a few studies concerning
Roman ceramics (Daszkiewicz and Schneider 1999, 2008a, b;
Zupancic 2006; Zupancic and Bole 1997; Zupancic and
Munda 2006; Kramar et al. 2012). A recently uncovered
archaeological site near the village of Mosnje is located in the
NW part of Slovenia and encompasses a Roman country villa
(villa rustica), which could also have been used as a road
station (mansion) (Sagadin and Lux 2010). The articles dis-
covered there (pottery fragments, coins, jewellery, elements
of costume, etc.) suggested that the Roman villa rustica dates
back to the period between the first and fourth centuries
(Sagadin and Lux 2010). Kramar et al. (2012), Sagadin and
Lux (2010), Lux (2008) and Kramar et al. (2008) report on
the basic archaeological, mineralogical and chemical study of
the chosen pottery sherds, but a detailed geochemical and
statistical analysis has still not been conducted.
Therefore, the main objectives of this study were to
determine the detailed elemental composition of the pottery
fragments from the Mosnje archaeological site, using the
multivariate statistical methods, CA and PCA, to identify data
structures and potentially to distinguish individual groups of
samples and to verify if the chemical differences reflect the
archaeologists’ classification of the objects studied.
Materials and methods
Study area
The Mosnje archaeological site is situated on the river Sava
terrace between the communities of Mosnje and Globoko.
The archaeological research was accomplished in
November 2006 and from January to April 2007. A total of
11,600 m2 of the area, including the Roman villa itself, was
studied during this period. The familiar analogies and small
articles discovered indicated the existence of a Roman
country villa (villa rustica), which could also have been
used as a road station (mansion). This view is also sup-
ported by the route of the old road, which is defined by the
lie of the land to the west of the study area. The villa
rustica consisted of five masonry buildings incorporated
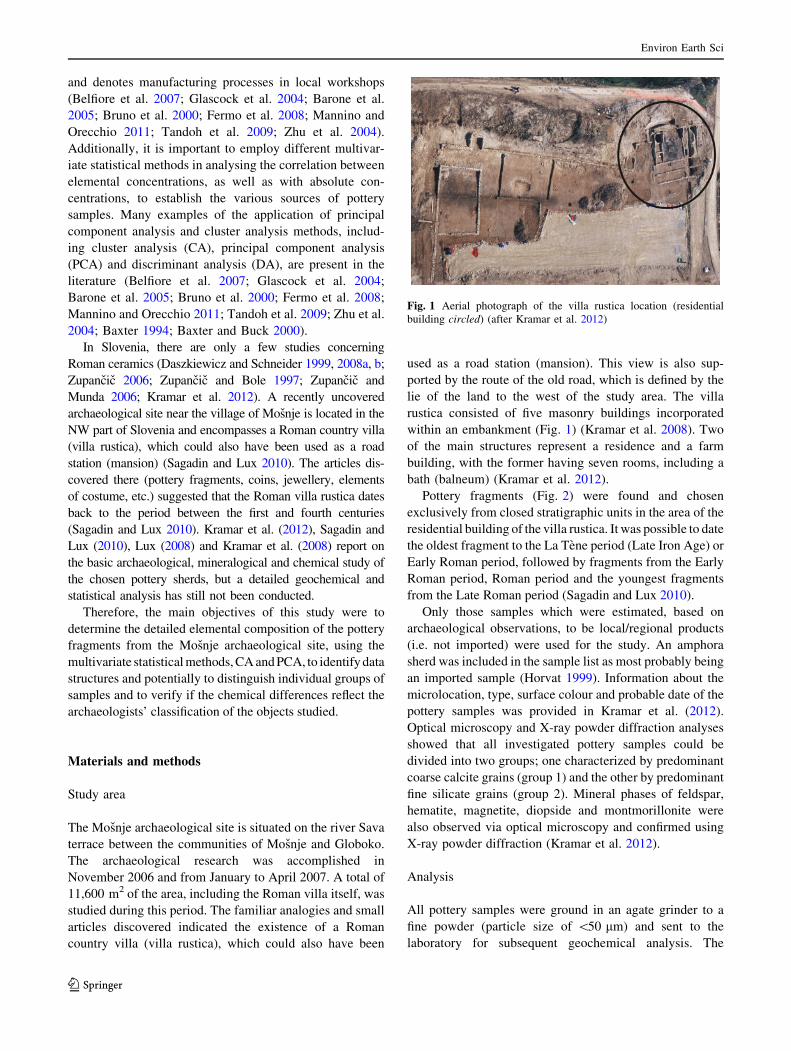
within an embankment (Fig. 1) (Kramar et al. 2008). Two
of the main structures represent a residence and a farm
building, with the former having seven rooms, including a
bath (balneum) (Kramar et al. 2012).
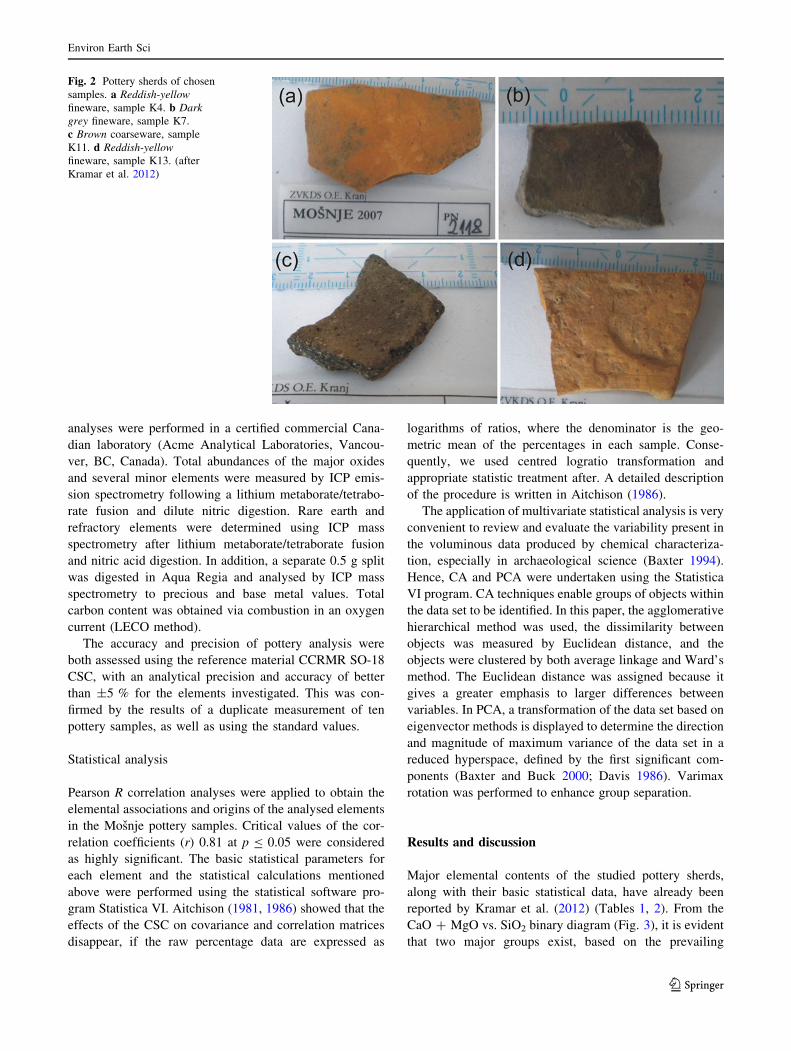
Pottery fragments (Fig. 2) were found and chosen
exclusively from closed stratigraphic units in the area of the
residential building of the villa rustica. It was possible to date
the oldest fragment to the La Tene period (Late Iron Age) or
Early Roman period, followed by fragments from the Early
Roman period, Roman period and the youngest fragments
from the Late Roman period (Sagadin and Lux 2010).
Only those samples which were estimated, based on
archaeological observations, to be local/regional products
(i.e. not imported) were used for the study. An amphora
sherd was included in the sample list as most probably being
an imported sample (Horvat 1999). Information about the
microlocation, type, surface colour and probable date of the
pottery samples was provided in Kramar et al. (2012).
Optical microscopy and X-ray powder diffraction analyses
showed that all investigated pottery samples could be
divided into two groups; one characterized by predominant
coarse calcite grains (group 1) and the other by predominant
fine silicate grains (group 2). Mineral phases of feldspar,
hematite, magnetite, diopside and montmorillonite were
also observed via optical microscopy and confirmed using
X-ray powder diffraction (Kramar et al. 2012).
Analysis
All pottery samples were ground in an agate grinder to a
fine powder (particle size of \50 lm) and sent to the
laboratory for subsequent geochemical analysis. The
Fig. 1 Aerial photograph of the villa rustica location (residential
building circled) (after Kramar et al. 2012)
Environ Earth Sci
123
Page 3
analyses were performed in a certified commercial Cana-
dian laboratory (Acme Analytical Laboratories, Vancou-
ver, BC, Canada). Total abundances of the major oxides
and several minor elements were measured by ICP emis-
sion spectrometry following a lithium metaborate/tetrabo-
rate fusion and dilute nitric digestion. Rare earth and
refractory elements were determined using ICP mass
spectrometry after lithium metaborate/tetraborate fusion
and nitric acid digestion. In addition, a separate 0.5 g split
was digested in Aqua Regia and analysed by ICP mass
spectrometry to precious and base metal values. Total
carbon content was obtained via combustion in an oxygen
current (LECO method).
The accuracy and precision of pottery analysis were
both assessed using the reference material CCRMR SO-18
CSC, with an analytical precision and accuracy of better
than ±5 % for the elements investigated. This was con-
firmed by the results of a duplicate measurement of ten
pottery samples, as well as using the standard values.
Statistical analysis
Pearson R correlation analyses were applied to obtain the
elemental associations and origins of the analysed elements
in the Mosnje pottery samples. Critical values of the cor-
relation coefficients (r) 0.81 at p B 0.05 were considered
as highly significant. The basic statistical parameters for
each element and the statistical calculations mentioned
above were performed using the statistical software pro-
gram Statistica VI. Aitchison (1981, 1986) showed that the
effects of the CSC on covariance and correlation matrices
disappear, if the raw percentage data are expressed as
logarithms of ratios, where the denominator is the geo-
metric mean of the percentages in each sample. Conse-
quently, we used centred logratio transformation and
appropriate statistic treatment after. A detailed description
of the procedure is written in Aitchison (1986).
The application of multivariate statistical analysis is very
convenient to review and evaluate the variability present in
the voluminous data produced by chemical characteriza-
tion, especially in archaeological science (Baxter 1994).
Hence, CA and PCA were undertaken using the Statistica
VI program. CA techniques enable groups of objects within
the data set to be identified. In this paper, the agglomerative
hierarchical method was used, the dissimilarity between
objects was measured by Euclidean distance, and the
objects were clustered by both average linkage and Ward’s
method. The Euclidean distance was assigned because it
gives a greater emphasis to larger differences between
variables. In PCA, a transformation of the data set based on
eigenvector methods is displayed to determine the direction
and magnitude of maximum variance of the data set in a
reduced hyperspace, defined by the first significant com-
ponents (Baxter and Buck 2000; Davis 1986). Varimax
rotation was performed to enhance group separation.
Results and discussion
Major elemental contents of the studied pottery sherds,
along with their basic statistical data, have already been
reported by Kramar et al. (2012) (Tables 1, 2). From the
CaO ? MgO vs. SiO2 binary diagram (Fig. 3), it is evident
that two major groups exist, based on the prevailing
Fig. 2 Pottery sherds of chosen
samples. a Reddish-yellow
fineware, sample K4. b Dark
grey fineware, sample K7.
c Brown coarseware, sample
K11. d Reddish-yellow
fineware, sample K13. (after
Kramar et al. 2012)
Environ Earth Sci
123
Page 4
mineralogical component: either carbonate (K1, K2, K6,
K8, K10, K11 and K14) or silicate (K4, K7, K9, K12 and
K15). The application of a silicious or calcareous raw
material is probably related to the specific usage of each
pottery sherd in Roman times (Iordanidis et al. 2009). The
third group is very diverse, consisting of samples K3, K5,
K13 and K16, where K13 and K16 did not contain a
prominent carbonate or silicate component. On the other
hand, samples K3 and K5 were identified as imported
pieces; K3 could be recognized as an imported ceramic
piece and K5, the amphora sherd, was originally added as
an imported sample for comparative purposes (Kramar
et al. 2012). In the K2O ? Na2O vs. CaO ? MgO binary
diagram (Fig. 4), samples K4, K3, K5, K7, K9 and K13 are
clearly distinguishable by their higher K2O ? Na2O con-
tents, while the same differences are also detected for
samples K13 and K16. Binary diagrams also reflect and
validate the results of the mineralogical analysis of the
pottery samples (Kramar et al. 2012). Investigated pottery
described above does not contain phosphate aggregates,
they were not identified under an optical microscope and
XRD method. The absence of phosphate aggregates indi-
cates that the potsherds were not extensively contaminated
during burial. A high phosphorus concentration in ancient
pottery is commonly interpreted as a contamination effect
(Walter and Besnus 1989; Maritan 2004).
The Pearson correlation analysis (Table 3) highlighted
the significantly positive correlations between SiO2, Al2O3,
Fe2O3, K2O, TiO2 and Na2O, indicating that Si, Al, Fe, K,
Ti and Na minerals are associated with feldspars and illite/
muscovite minerals. A highly significant negative correla-
tion between CaO and other oxides (SiO2, Al2O3, Fe2O3,
K2O, TiO2 and Na2O) demonstrated either that these
elements have no affinity to Ca and/or their removal from
carbonate phases during weathering and/or a special mode
of pottery production. Highly positive correlations of MnO
with Fe2O3, MgO and Na2O, and of MgO with Na2O and
MnO, suggested similar input sources and/or a very close
mineral association between these oxides. Additionally, the
highly positive correlation of Fe2O3 with MnO revealed the
presence of Fe/Mn compounds in the investigated pottery
sherds. Negative correlations of P2O5 with all major oxides
illustrated that there were no preferred connections of P2O5
with other elements in the pottery samples (Table 3).
Trace and rare earth element (REE) concentrations,
together with mean, minimum, maximum and standard
deviation values in the pottery sherds, are summarized in
Table 2. Trace elements can be defined as geochemical
‘‘fingerprints’’, because they are usually associated with
specific petrological/mineralogical types (Aitchison 1986).
The results of analysis of the trace elemental abundances
displayed the following interesting facts. (1) The highest
contents of Cr, Ni, Co and Cu were found in imported
pottery samples K3 and K5 (Table 1) and this enrichment
could be attributed to the geochemical affinity of these
elements with ultramafic rocks in the raw material used
(Iordanidis et al. 2009). (2) Nb, Rb, Sc and V concentra-
tions were enhanced (Table 1) in pottery samples with a
predominant SiO2 content: K3, K4, K5, K7, K9, K12, K13,
K15 and K16. (3) Zn values were the highest
(115–186 ppm) in samples K3, K10, K13 and K16. (4)
Group of samples K2, K6, K10, K11 and K13 with pre-
valent CaO content had highly increased Sr concentrations
(100.6–240.4 ppm). This confirms the fact that Sr can
substitute for Ca. (5) Extremely high Zr values (up to
345.9 ppm) were determined in almost all samples, except
Table 1 Major oxides chemical composition of pottery samples (in %) (after Kramar et al. 2012)
Sample SiO2 Al2O3 Fe2O3 MgO CaO Na2O K2O TiO2 P2O5 MnO
K1 17.90 7.52 2.28 1.07 35.48 0.12 0.68 0.31 0.39 0.03
K2 14.30 9.04 2.64 0.76 34.66 0.07 0.83 0.21 0.92 0.02
K3 51.83 16.86 7.99 2.57 1.57 0.74 1.81 0.97 1.68 0.11
K4 58.08 22.21 4.71 0.54 0.73 0.25 2.25 1.26 0.66 0.01
K5 53.24 16.25 7.30 2.22 5.31 0.60 2.04 0.93 0.63 0.16
K6 18.87 9.39 3.22 1.24 32.71 0.09 1.27 0.39 1.09 0.04
K7 63.75 19.90 4.83 0.80 0.61 0.32 2.36 1.21 0.26 0.01
K8 25.55 10.12 3.27 1.35 28.72 0.15 1.64 0.43 0.35 0.02
K9 57.32 21.62 5.66 1.29 0.76 0.69 3.02 1.03 0.32 0.07
K10 23.28 9.36 3.07 1.15 31.65 0.11 0.90 0.41 0.19 0.03
K11 25.63 8.98 2.12 2.58 28.20 0.52 1.09 0.35 0.44 0.03
K12 58.27 19.70 6.08 1.01 1.32 0.70 1.65 0.93 0.94 0.05
K13 47.48 14.31 6.03 2.64 10.32 0.75 2.30 0.68 0.83 0.12
K14 24.01 9.29 2.82 1.09 31.40 0.12 0.88 0.40 0.17 0.03
K16 38.31 12.95 2.71 1.74 18.52 0.59 1.94 0.46 0.38 0.03
Environ Earth Sci
123
Page 5
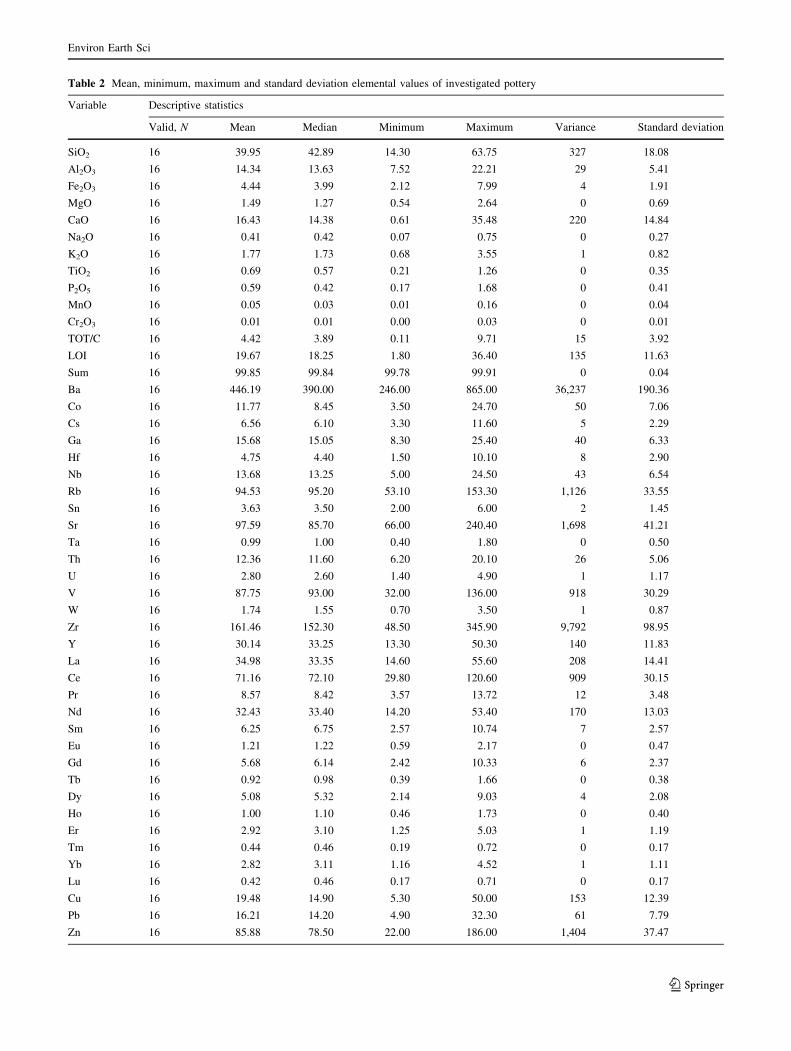
Table 2 Mean, minimum, maximum and standard deviation elemental values of investigated pottery
Variable Descriptive statistics
Valid, N Mean Median Minimum Maximum Variance Standard deviation
SiO2 16 39.95 42.89 14.30 63.75 327 18.08
Al2O3 16 14.34 13.63 7.52 22.21 29 5.41
Fe2O3 16 4.44 3.99 2.12 7.99 4 1.91
MgO 16 1.49 1.27 0.54 2.64 0 0.69
CaO 16 16.43 14.38 0.61 35.48 220 14.84
Na2O 16 0.41 0.42 0.07 0.75 0 0.27
K2O 16 1.77 1.73 0.68 3.55 1 0.82
TiO2 16 0.69 0.57 0.21 1.26 0 0.35
P2O5 16 0.59 0.42 0.17 1.68 0 0.41
MnO 16 0.05 0.03 0.01 0.16 0 0.04
Cr2O3 16 0.01 0.01 0.00 0.03 0 0.01
TOT/C 16 4.42 3.89 0.11 9.71 15 3.92
LOI 16 19.67 18.25 1.80 36.40 135 11.63
Sum 16 99.85 99.84 99.78 99.91 0 0.04
Ba 16 446.19 390.00 246.00 865.00 36,237 190.36
Co 16 11.77 8.45 3.50 24.70 50 7.06
Cs 16 6.56 6.10 3.30 11.60 5 2.29
Ga 16 15.68 15.05 8.30 25.40 40 6.33
Hf 16 4.75 4.40 1.50 10.10 8 2.90
Nb 16 13.68 13.25 5.00 24.50 43 6.54
Rb 16 94.53 95.20 53.10 153.30 1,126 33.55
Sn 16 3.63 3.50 2.00 6.00 2 1.45
Sr 16 97.59 85.70 66.00 240.40 1,698 41.21
Ta 16 0.99 1.00 0.40 1.80 0 0.50
Th 16 12.36 11.60 6.20 20.10 26 5.06
U 16 2.80 2.60 1.40 4.90 1 1.17
V 16 87.75 93.00 32.00 136.00 918 30.29
W 16 1.74 1.55 0.70 3.50 1 0.87
Zr 16 161.46 152.30 48.50 345.90 9,792 98.95
Y 16 30.14 33.25 13.30 50.30 140 11.83
La 16 34.98 33.35 14.60 55.60 208 14.41
Ce 16 71.16 72.10 29.80 120.60 909 30.15
Pr 16 8.57 8.42 3.57 13.72 12 3.48
Nd 16 32.43 33.40 14.20 53.40 170 13.03
Sm 16 6.25 6.75 2.57 10.74 7 2.57
Eu 16 1.21 1.22 0.59 2.17 0 0.47
Gd 16 5.68 6.14 2.42 10.33 6 2.37
Tb 16 0.92 0.98 0.39 1.66 0 0.38
Dy 16 5.08 5.32 2.14 9.03 4 2.08
Ho 16 1.00 1.10 0.46 1.73 0 0.40
Er 16 2.92 3.10 1.25 5.03 1 1.19
Tm 16 0.44 0.46 0.19 0.72 0 0.17
Yb 16 2.82 3.11 1.16 4.52 1 1.11
Lu 16 0.42 0.46 0.17 0.71 0 0.17
Cu 16 19.48 14.90 5.30 50.00 153 12.39
Pb 16 16.21 14.20 4.90 32.30 61 7.79
Zn 16 85.88 78.50 22.00 186.00 1,404 37.47
Environ Earth Sci
123
Page 6
for K1, K2, K6, K8, K10 and K14. The Zr content in
studied pottery sherds is probably linked to the presence of
felsic igneous or sedimentary grains (detrital grains) in the
raw material (Iordanidis et al. 2009). (6) Highly elevated
concentrations of Ba were found in pottery sherds with
prevailing SiO2 content. Ba has been noted as particularly
susceptible to uptake from the burial environment, but
increased concentration of barium can also occur as dif-
ferent results (Picon 1985; Golitko et al. 2011).
In the Ni vs. Cr binary diagram (Fig. 5), we observed
the first group of samples (black circles) to have the lowest
Ni/Cr content. The second group (squares) showed higher
Cr values and the corresponding samples also had the
highest SiO2 concentrations. Pottery sherds K13, K3 and
K5 possessed the highest Ni (from around 70 to 130 ppm)
and Cr (from around 300 to 440 ppm) abundances, sug-
gesting that they were chemically distinct from the other
samples, especially as imported sherds (Barone et al.
2002). For example, pottery originating from Greece is
characterized by a greater quantity of Cr/Ni: 200–300 ppm
(Barone et al. 2002).
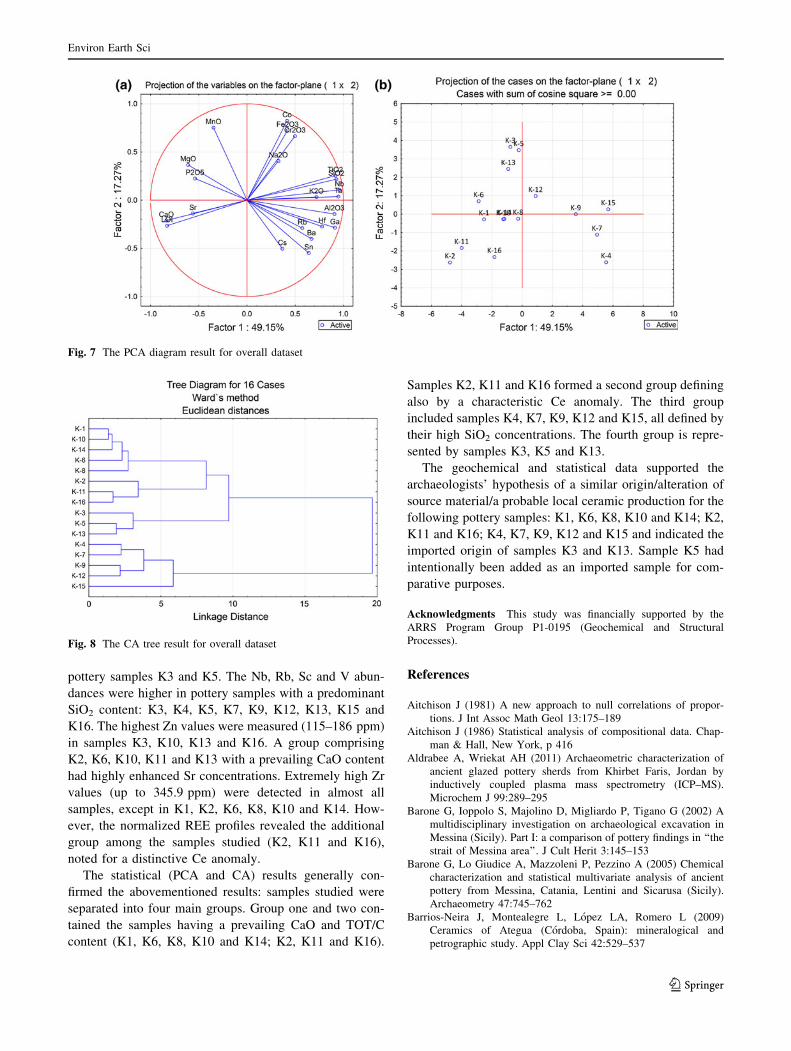
The Pearson correlation matrix (Table 4) represents a
positive correlation between heavy metals: Co with Ni, Cu
with Cd, Ni with Zn, Ni with Zn and Zn with Cd. Highly
significant correlations were detected between Nb and Zr
with other trace and rare earth elements (except heavy
metals), Rb and V with trace elements (except heavy
metals) and Ba with Cs, Ga, Hf, Nb, Rb, Sn, Ta, Th, U and
V. Conversely, no or negative correlations were noted
between Sr and the other elements.
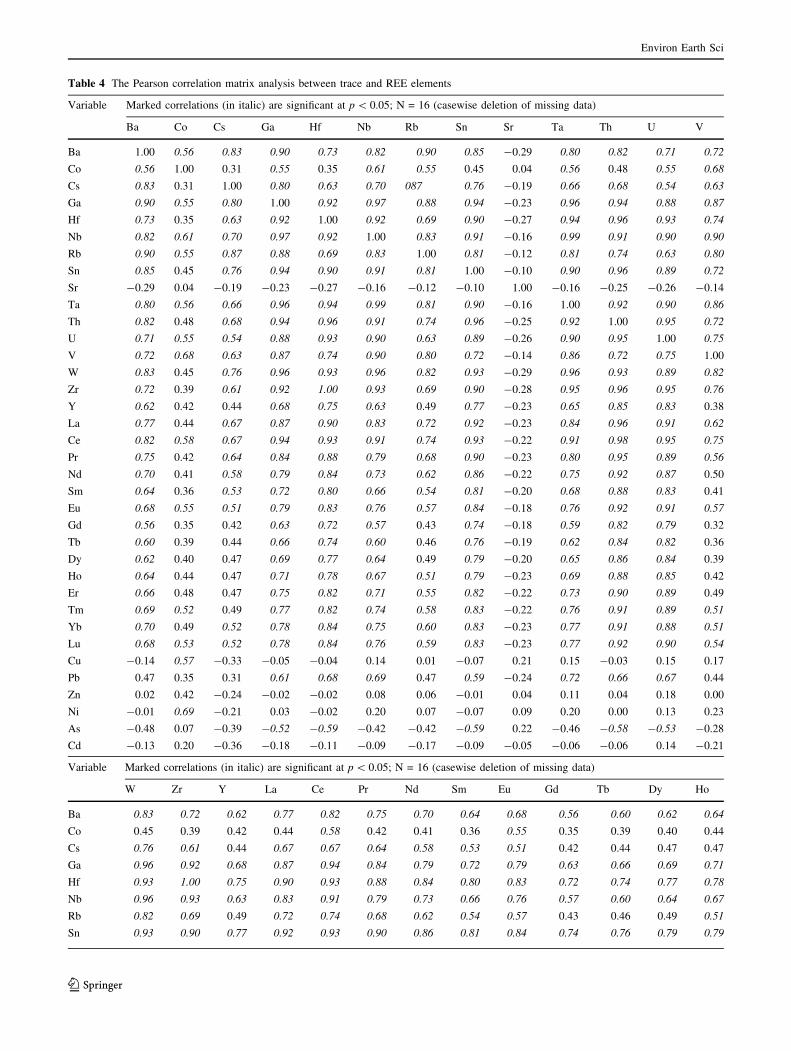
A plot of the REE profiles normalized against chondrite
values is shown in Fig. 6 and the rare earth data from
pottery samples are presented in Tables 1 and 2. Pottery
sherds revealed fairly high concentrations for all REEs and
a distinctive grouping into four major groups (see Fig. 6).
All the REE profiles discussed above displayed a signifi-
cant negative Eu anomaly and a minor, but characteristic,
Ce anomaly was noted in pottery samples from group B.
The REE analysis mostly confirmed the outcome of the
previous discussion; however, on the other hand, there was
another group detected from the investigated samples,
group B (K2, K11 and K16). This is also associated with
the fact that in the fourth century the source material has
been changed (Kramar et al. 2012).
The correlation analysis (Table 4) between REEs in the
selected pottery samples exhibited highly significant cor-
relations between elements from the light and heavy rare
Table 2 continued
Variable Descriptive statistics
Valid, N Mean Median Minimum Maximum Variance Standard deviation
Ni 16 38.21 28.50 3.00 128.60 1,218 34.91
As 16 6.25 5.40 1.60 13.70 10 3.19
Cd 16 0.63 0.55 0.10 2.00 0 0.44
Fig. 3 CaO ? MgO vs. SiO2 binary diagram
Fig. 4 K2O ? Na2O vs. CaO ? MgO binary diagram
Environ Earth Sci
123
Page 7
earth element (LREE and HREE) groups. These findings
supported the common geochemical characteristics of the
REE elements.
PCA and CA were applied to identify the data structures
and to validate whether the chemical differences reflected
the archaeologists’ classification of the objects studied. The
results of PCA for the overall dataset are reported in
Fig. 7a, b. The first two principal components (PCs)
accounted for 66.42 % of the total variance in the dataset;
these PCs were retained as significant and are therefore
considered in the following discussion. The projection of
the variables on the factor-plane showed highly significant
positive correlations between SiO2, K2O, TiO2, Nb and Ta,
MgO and MnO; Cr2O3, Fe2O3 and Co; CaO and Sr. A
highly negative correlation was again confirmed between
CaO and SiO2. The projection of the cases on the factor-
plane clearly differentiated four major distinct groups of
samples. The first group is comprised by three samples
(K2, K11 and K16) with a characteristic Ce anomaly and
the second group assembles the following samples K1, K6,
K8, K10 and K14. These samples (first and second group)
are all characterized by their high CaO and TOT/C content
compared to samples assembling the third group. The third
group is very dispersed and included samples (K4, K7, K9,
K12 and K15) that had the highest SiO2 levels; and the
fourth group consisted of the samples K3, K5 and K13. The
amphora sherd K5 was originally intentionally added as an
imported sample for comparative purposes and it is pos-
sible that samples K3 and K13 were also segments of an
imported ceramic sherd. The PCA statistical results sug-
gested a high degree of chemical similarity between these
groups. Furthermore, this conclusion was confirmed by the
CA built on the basis of the overall data matrix.
The clustering result (CA, overall data) (Fig. 8) reveals
the separation of the studied samples also into four main
groups. Cluster one (group 1) and two contained the sam-
ples having a prevailing CaO and TOT/C content (K1, K2,
K6, K8, K10, K11, K14 and K16). Samples K2, K11 and
K16 (group 2) formed a second cluster defining a distinc-
tive Ce anomaly. The third cluster (group 4) is represented
by samples K3, K5 and K13. The fourth cluster (group 3)
included samples K4, K7, K9, K12 and K15, all defined by
their high SiO2 concentrations.
The results were in good agreement with the hypothesis
formulated by archaeologists of a probable local origin for
the ceramics; conversely, they did not identify the stylistic
characteristics of samples K3 and K13. Samples K3 and
Table 3 The Pearson correlation matrix analysis between major oxides
Variable Marked correlations (in bold) are significant at p \ 0.05; N = 16 (casewise deletion of missing data)
SiO2 Al2O3 Fe2O3 MgO CaO Na2O K2O TiO2 P2O5 MnO Cr2O3 TOT/C
SiO2 1.00 0.96 0.81 0.12 20.99 0.72 0.84 0.96 0.07 0.41 0.75 20.98
Al2O3 0.96 1.00 0.74 -0.05 20.96 0.61 0.86 0.96 006 0.29 0.67 20.95
Fe2O3 0.81 0.74 1.00 0.39 20.85 0.73 0.66 0.77 0.45 0.78 0.93 20.88
MgO 0.12 -0.05 0.39 1.00 -0.16 0.66 0.20 -0.03 0.30 0.71 0.34 -0.17
CaO 20.99 20.96 20.85 -0.16 1.00 20.75 20.83 20.95 -0.18 -0.45 20.79 0.99
Na2O 0.72 0.61 0.73 0.66 20.75 1.00 0.66 0.53 0.26 0.68 0.58 20.74
K2O 0.84 0.86 0.66 0.20 20.83 0.66 1.00 0.78 -010 0.42 0.54 20.82
TiO2 0.96 0.96 0.77 -0.03 20.95 0.53 0.78 1.00 0.10 0.30 0.78 20.95
P2O5 0.07 0.06 0.45 0.30 -0.18 0.26 -0.10 0.10 1.00 0.35 0.42 -0.17
MnO 0.41 0.29 0.78 0.71 -0.45 0.68 0.42 0.30 0.35 1.00 0.71 20.52
Cr2O3 0.75 0.67 0.93 0.34 20.79 0.58 0.54 0.78 0.42 0.71 1.00 20.83
TOT/C 20.98 20.95 20.88 -0.17 0.99 20.74 20.82 20.95 -0.17 20.52 20.83 1.00
Fig. 5 Ni vs. Cr binary diagram
Environ Earth Sci
123
Page 8
Table 4 The Pearson correlation matrix analysis between trace and REE elements
Variable Marked correlations (in italic) are significant at p \ 0.05; N = 16 (casewise deletion of missing data)
Ba Co Cs Ga Hf Nb Rb Sn Sr Ta Th U V
Ba 1.00 0.56 0.83 0.90 0.73 0.82 0.90 0.85 -0.29 0.80 0.82 0.71 0.72
Co 0.56 1.00 0.31 0.55 0.35 0.61 0.55 0.45 0.04 0.56 0.48 0.55 0.68
Cs 0.83 0.31 1.00 0.80 0.63 0.70 087 0.76 -0.19 0.66 0.68 0.54 0.63
Ga 0.90 0.55 0.80 1.00 0.92 0.97 0.88 0.94 -0.23 0.96 0.94 0.88 0.87
Hf 0.73 0.35 0.63 0.92 1.00 0.92 0.69 0.90 -0.27 0.94 0.96 0.93 0.74
Nb 0.82 0.61 0.70 0.97 0.92 1.00 0.83 0.91 -0.16 0.99 0.91 0.90 0.90
Rb 0.90 0.55 0.87 0.88 0.69 0.83 1.00 0.81 -0.12 0.81 0.74 0.63 0.80
Sn 0.85 0.45 0.76 0.94 0.90 0.91 0.81 1.00 -0.10 0.90 0.96 0.89 0.72
Sr -0.29 0.04 -0.19 -0.23 -0.27 -0.16 -0.12 -0.10 1.00 -0.16 -0.25 -0.26 -0.14
Ta 0.80 0.56 0.66 0.96 0.94 0.99 0.81 0.90 -0.16 1.00 0.92 0.90 0.86
Th 0.82 0.48 0.68 0.94 0.96 0.91 0.74 0.96 -0.25 0.92 1.00 0.95 0.72
U 0.71 0.55 0.54 0.88 0.93 0.90 0.63 0.89 -0.26 0.90 0.95 1.00 0.75
V 0.72 0.68 0.63 0.87 0.74 0.90 0.80 0.72 -0.14 0.86 0.72 0.75 1.00
W 0.83 0.45 0.76 0.96 0.93 0.96 0.82 0.93 -0.29 0.96 0.93 0.89 0.82
Zr 0.72 0.39 0.61 0.92 1.00 0.93 0.69 0.90 -0.28 0.95 0.96 0.95 0.76
Y 0.62 0.42 0.44 0.68 0.75 0.63 0.49 0.77 -0.23 0.65 0.85 0.83 0.38
La 0.77 0.44 0.67 0.87 0.90 0.83 0.72 0.92 -0.23 0.84 0.96 0.91 0.62
Ce 0.82 0.58 0.67 0.94 0.93 0.91 0.74 0.93 -0.22 0.91 0.98 0.95 0.75
Pr 0.75 0.42 0.64 0.84 0.88 0.79 0.68 0.90 -0.23 0.80 0.95 0.89 0.56
Nd 0.70 0.41 0.58 0.79 0.84 0.73 0.62 0.86 -0.22 0.75 0.92 0.87 0.50
Sm 0.64 0.36 0.53 0.72 0.80 0.66 0.54 0.81 -0.20 0.68 0.88 0.83 0.41
Eu 0.68 0.55 0.51 0.79 0.83 0.76 0.57 0.84 -0.18 0.76 0.92 0.91 0.57
Gd 0.56 0.35 0.42 0.63 0.72 0.57 0.43 0.74 -0.18 0.59 0.82 0.79 0.32
Tb 0.60 0.39 0.44 0.66 0.74 0.60 0.46 0.76 -0.19 0.62 0.84 0.82 0.36
Dy 0.62 0.40 0.47 0.69 0.77 0.64 0.49 0.79 -0.20 0.65 0.86 0.84 0.39
Ho 0.64 0.44 0.47 0.71 0.78 0.67 0.51 0.79 -0.23 0.69 0.88 0.85 0.42
Er 0.66 0.48 0.47 0.75 0.82 0.71 0.55 0.82 -0.22 0.73 0.90 0.89 0.49
Tm 0.69 0.52 0.49 0.77 0.82 0.74 0.58 0.83 -0.22 0.76 0.91 0.89 0.51
Yb 0.70 0.49 0.52 0.78 0.84 0.75 0.60 0.83 -0.23 0.77 0.91 0.88 0.51
Lu 0.68 0.53 0.52 0.78 0.84 0.76 0.59 0.83 -0.23 0.77 0.92 0.90 0.54
Cu -0.14 0.57 -0.33 -0.05 -0.04 0.14 0.01 -0.07 0.21 0.15 -0.03 0.15 0.17
Pb 0.47 0.35 0.31 0.61 0.68 0.69 0.47 0.59 -0.24 0.72 0.66 0.67 0.44
Zn 0.02 0.42 -0.24 -0.02 -0.02 0.08 0.06 -0.01 0.04 0.11 0.04 0.18 0.00
Ni -0.01 0.69 -0.21 0.03 -0.02 0.20 0.07 -0.07 0.09 0.20 0.00 0.13 0.23
As -0.48 0.07 -0.39 -0.52 -0.59 -0.42 -0.42 -0.59 0.22 -0.46 -0.58 -0.53 -0.28
Cd -0.13 0.20 -0.36 -0.18 -0.11 -0.09 -0.17 -0.09 -0.05 -0.06 -0.06 0.14 -0.21
Variable Marked correlations (in italic) are significant at p \ 0.05; N = 16 (casewise deletion of missing data)
W Zr Y La Ce Pr Nd Sm Eu Gd Tb Dy Ho
Ba 0.83 0.72 0.62 0.77 0.82 0.75 0.70 0.64 0.68 0.56 0.60 0.62 0.64
Co 0.45 0.39 0.42 0.44 0.58 0.42 0.41 0.36 0.55 0.35 0.39 0.40 0.44
Cs 0.76 0.61 0.44 0.67 0.67 0.64 0.58 0.53 0.51 0.42 0.44 0.47 0.47
Ga 0.96 0.92 0.68 0.87 0.94 0.84 0.79 0.72 0.79 0.63 0.66 0.69 0.71
Hf 0.93 1.00 0.75 0.90 0.93 0.88 0.84 0.80 0.83 0.72 0.74 0.77 0.78
Nb 0.96 0.93 0.63 0.83 0.91 0.79 0.73 0.66 0.76 0.57 0.60 0.64 0.67
Rb 0.82 0.69 0.49 0.72 0.74 0.68 0.62 0.54 0.57 0.43 0.46 0.49 0.51
Sn 0.93 0.90 0.77 0.92 0.93 0.90 0.86 0.81 0.84 0.74 0.76 0.79 0.79
Environ Earth Sci
123
Page 9
Table 4 continued
Variable Marked correlations (in italic) are significant at p \ 0.05; N = 16 (casewise deletion of missing data)
W Zr Y La Ce Pr Nd Sm Eu Gd Tb Dy Ho
Sr -0.29 -0.28 -0.23 -0.23 -0.22 -0.23 -0.22 -0.20 -0.18 -0.18 -0.19 -0.20 -0.23
Ta 0.96 0.95 0.65 0.84 0.91 0.80 0.75 0.68 0.76 0.59 0.62 0.65 0.69
Th 0.93 0.96 0.85 0.96 0.98 0.95 0.92 0.88 0.92 0.82 0.84 0.86 0.88
U 0.89 0.95 0.83 0.91 0.95 0.89 0.87 0.83 0.91 0.79 0.82 0.84 0.85
V 0.82 0.76 0.38 0.62 0.75 0.56 0.50 0.41 0.57 0.32 0.36 0.39 0.42
W 1.00 0.94 0.65 0.86 0.90 0.82 0.77 0.69 0.75 0.59 0.62 0.66 0.68
Zr 0.94 1.00 0.76 0.90 0.93 0.87 0.84 0.79 0.83 0.72 0.74 0.77 0.78
Y 0.65 0.76 1.00 0.93 0.87 0.95 0.97 0.99 0.96 0.99 0.99 0.99 1.00
La 0.86 0.90 0.93 1.00 0.97 1.00 0.98 0.96 0.95 0.91 0.92 0.94 0.94
Ce 0.90 0.93 0.87 0.97 1.00 0.95 0.93 0.90 0.95 0.85 0.87 0.89 0.90
Pr 0.82 0.87 0.95 1.00 0.95 1.00 0.99 0.98 0.96 0.94 0.95 0.96 0.96
Nd 0.77 0.84 0.97 0.98 0.93 0.99 1.00 0.99 0.97 0.97 0.97 0.98 0.98
Sm 0.69 0.79 0.99 0.96 0.90 0.98 0.99 1.00 0.96 0.99 0.99 0.99 0.99
Eu 0.75 0.83 0.96 0.95 0.95 0.96 0.97 0.96 1.00 0.95 0.97 0.97 0.98
Gd 0.59 0.72 0.99 0.91 0.85 0.94 0.97 0.99 0.95 1.00 1.00 1.00 0.99
Tb 0.62 0.74 0.99 0.92 0.87 0.95 0.97 0.99 0.97 1.00 1.00 1.00 0.99
Dy 0.66 0.77 0.99 0.94 0.89 0.96 0.98 0.99 0.97 1.00 1.00 1.00 1.00
Ho 0.68 0.78 1.00 0.94 0.90 0.96 0.98 0.99 0.98 0.99 0.99 1.00 1.00
Er 0.71 0.82 0.99 0.95 0.92 0.97 0.98 0.98 0.99 0.97 0.98 0.99 0.99
Tm 0.74 0.83 0.99 0.96 0.93 0.97 0.98 0.97 0.98 0,96 0,97 0.98 0.99
Yb 0.75 0.84 0.98 0.96 0.93 0.97 0.98 0.97 0.97 0,95 0,96 0.97 0.99
Lu 0.75 0.84 0.98 0.96 0.94 0.97 0.98 0.97 0.98 0,95 0,96 0.97 0.98
Cu -0.01 0.02 0.06 0.00 0.04 -0.01 0.00 -0.02 0.09 -0.01 0.01 0.01 0.06
Pb 0.72 0.68 0.53 0.62 0.63 0.59 0.59 0.52 0.56 0.47 0.49 0.50 0.55
Zn 0.05 0.01 0.21 0.12 0.10 0.13 0.16 0.14 0.20 0.18 0.18 0.17 0.21
Ni 0.04 0.02 0.05 -0.00 0.08 -0.02 0.00 -0.04 0.10 -0.03 -0.01 -0.01 0.06
As -0.51 -0.59 -0.55 -0.59 -0.52 -0.60 -0.59 -0.59 -0.54 -0.56 -0.56 -0.57 -0.56
Cd -0.08 -0.06 0.21 0.03 -0.02 0.06 0.09 0.11 0.12 0.17 0.17 0.17 0.18
Variable Marked correlations are significant at p \ 0.05; N = 16 (casewise deletion of missing data)
Er Tm Yb Lu Cu Pb Zn Ni As Cd
Ba 0.66 0.69 0.70 0.68 -0.14 0.47 0.02 -0.01 -0.48 -0.13
Co 0.48 0.52 0.49 0.53 0.57 0.35 0.42 0.69 0.07 0.20
Cs 0.47 0.49 0.52 0.52 -0.33 0.31 -0.24 -0.21 -0.39 -0.36
Ga 0.75 0.77 0.78 0.78 -0.05 0.61 -0.02 0.03 -0.52 -0.18
Hf 0.82 0.82 0.84 0.84 -0.04 0.68 -0.02 -0.02 -0.59 -0.11
Nb 0.71 0.74 0.75 0.76 0.14 0.69 0.08 0.20 -0.42 -0.09
Rb 0.55 0.58 0.60 0.59 0.01 0.47 0.06 0.07 -0.42 -0.17
Sn 0.82 0.83 0.83 0.83 -0.07 0.59 -0.01 -0.07 -0.59 -0.09
Sr -0.22 -0.22 -0.23 -0.23 0.21 -0.24 0.04 0.09 0.22 -0.05
Ta 0.73 0.76 0.77 0.77 0.15 0.72 0.11 0.20 -0.46 -0.06
Th 0.90 0.91 0.91 0.92 -0.03 0.66 0.04 0.00 -0.58 -0.06
U 0.89 0.89 0.88 0.90 0.15 0.67 0.18 0.13 -0.53 0.14
V 0.49 0.51 0.51 0.54 0.17 0.44 0.00 0.23 -0.28 -0.21
W 0.71 0.74 0.75 0.75 -0.01 0.72 0.05 0.04 -0.51 -0.08
Zr 0.82 0.83 0.84 0.84 0.02 0.68 0.01 0.02 -0.59 -0.06
Y 0.99 0.99 0.98 0.98 0.06 0.53 0.21 0.05 -0.55 0.21
Environ Earth Sci
123
Page 10
K13 differed chemically from the other samples and indi-
cated that the objects had probably been imported (K5 was
already marked as an imported sample). The normalized
REE profiles recognized another group within the studied
samples (K2, K11 and K16), with a characteristic Ce
anomaly as well. The statistical analyses generally reflec-
ted the differences and affinities observed by chemical
analysis and indicated the similar origin/alteration of
source material/a probable local ceramic production for the
following pottery samples: K1, K6, K8, K10 and K14; K2,
K11 and K16; K4, K7, K9, K12 and K15; and imported
properties of samples K3, K5 and K13.
It should also be noted, however, that pottery compo-
sition depends on both the clay source and the recipe used
to prepare the clay paste (Davis 1986). Thus, the abun-
dance ratios of some elements may have been slightly
altered as a result of the mixing of several materials (Ior-
danidis et al. 2009).
Conclusions
In this study, we thoroughly examined detailed geochem-
ical properties and statistical characteristics of the pottery
fragments from the Mosnje archaeological location. The
geochemical results (major, trace and rare earth elements)
revealed the existence of four major groups of the samples
studied.
According to major oxide contents, the first group was
assembled from seven samples (K1, K2, K6, K8, K10, K11
and K14), all characterized by their high CaO content; the
second group included samples (K4, K7, K9, K12, K15 and
K16) with the highest SiO2 levels; and the third group was
composed of the samples K3, K5 and K13. The highest
concentrations of Cr, Ni, Co and Cu were found in the
Table 4 continued
Variable Marked correlations are significant at p \ 0.05; N = 16 (casewise deletion of missing data)
Er Tm Yb Lu Cu Pb Zn Ni As Cd
La 0.95 0.96 0.96 0.96 0.00 0.62 0.12 -0.00 -0.59 0.03
Ce 0.92 0.93 0.93 0.94 0.04 0.63 0.10 0.08 -0.52 -0.02
Pr 0.97 0.97 0.97 0.97 -0.01 0.59 0.13 -0.02 -0.60 0.06
Nd 0.98 0.98 0.98 0.98 0.00 0.59 0.16 0.00 -0.59 0.09
Sm 0.98 0.97 0.97 0.97 -0.02 0.52 0.14 -0.04 -0.59 0.11
Eu 0.99 0.98 0.97 0.98 0.09 0.56 0.20 0.10 -0.54 0.12
Gd 0.97 0.96 0.95 0.95 -0.01 0.47 0.18 -0.03 -0.56 0.17
Tb 0.98 0.97 0.96 0.96 0.01 0.49 0.18 -0.01 -0.56 0.17
Dy 0.99 0.98 0.97 0.97 0.01 0.50 0.17 -0.01 -0.57 0.17
Ho 0.99 0.99 0.99 0.98 0.06 0.55 0.21 0.06 -0.56 0.18
Er 1.00 1.00 0.99 0.99 0.09 0.56 0.20 0.08 -0.56 0.16
Tm 1.00 1.00 0.99 0.99 0.12 0.60 0.24 0.13 -0.54 0.18
Yb 0.99 0.99 1.00 1.00 0.11 0.61 0.20 0.14 -0.52 0.13
Lu 0.99 0.99 1.00 1.00 0.13 0.61 0.20 0.16 -0.51 0.14
Cu 0.09 0.12 0.11 0.13 1.00 0.33 0.75 0.88 0.33 0.62
Pb 0.56 0.60 0.61 0.61 0.33 1.00 0.52 0.39 -0.29 0.29
Zn 0.20 0.24 0.20 0.20 0.75 0.52 1.00 0.65 -0.04 0.81
Ni 0.08 0.13 0.14 0.16 0.88 0.39 0.65 1.00 0.42 0.44
As -0.56 -0.54 -0.52 -0.51 0.33 -0.29 -0.04 0.42 1.00 -0.07
Cd 0.16 0.18 0.13 0.14 0.62 0.29 0.81 0.44 -0.07 1.00
Fig. 6 A plot of the REE profiles normalized against chondrite
values
Environ Earth Sci
123
Page 11
pottery samples K3 and K5. The Nb, Rb, Sc and V abun-
dances were higher in pottery samples with a predominant
SiO2 content: K3, K4, K5, K7, K9, K12, K13, K15 and
K16. The highest Zn values were measured (115–186 ppm)
in samples K3, K10, K13 and K16. A group comprising
K2, K6, K10, K11 and K13 with a prevailing CaO content
had highly enhanced Sr concentrations. Extremely high Zr
values (up to 345.9 ppm) were detected in almost all
samples, except in K1, K2, K6, K8, K10 and K14. How-
ever, the normalized REE profiles revealed the additional
group among the samples studied (K2, K11 and K16),
noted for a distinctive Ce anomaly.
The statistical (PCA and CA) results generally con-
firmed the abovementioned results: samples studied were
separated into four main groups. Group one and two con-
tained the samples having a prevailing CaO and TOT/C
content (K1, K6, K8, K10 and K14; K2, K11 and K16).
Samples K2, K11 and K16 formed a second group defining
also by a characteristic Ce anomaly. The third group
included samples K4, K7, K9, K12 and K15, all defined by
their high SiO2 concentrations. The fourth group is repre-
sented by samples K3, K5 and K13.
The geochemical and statistical data supported the
archaeologists’ hypothesis of a similar origin/alteration of
source material/a probable local ceramic production for the
following pottery samples: K1, K6, K8, K10 and K14; K2,
K11 and K16; K4, K7, K9, K12 and K15 and indicated the
imported origin of samples K3 and K13. Sample K5 had
intentionally been added as an imported sample for com-
parative purposes.
Acknowledgments This study was financially supported by the
ARRS Program Group P1-0195 (Geochemical and Structural
Processes).
References
Aitchison J (1981) A new approach to null correlations of propor-
tions. J Int Assoc Math Geol 13:175–189
Aitchison J (1986) Statistical analysis of compositional data. Chap-
man & Hall, New York, p 416
Aldrabee A, Wriekat AH (2011) Archaeometric characterization of
ancient glazed pottery sherds from Khirbet Faris, Jordan by
inductively coupled plasma mass spectrometry (ICP–MS).
Microchem J 99:289–295
Barone G, Ioppolo S, Majolino D, Migliardo P, Tigano G (2002) A
multidisciplinary investigation on archaeological excavation in
Messina (Sicily). Part I: a comparison of pottery findings in ‘‘the
strait of Messina area’’. J Cult Herit 3:145–153
Barone G, Lo Giudice A, Mazzoleni P, Pezzino A (2005) Chemical
characterization and statistical multivariate analysis of ancient
pottery from Messina, Catania, Lentini and Sicarusa (Sicily).
Archaeometry 47:745–762
Barrios-Neira J, Montealegre L, Lopez LA, Romero L (2009)
Ceramics of Ategua (Cordoba, Spain): mineralogical and
petrographic study. Appl Clay Sci 42:529–537
Fig. 7 The PCA diagram result for overall dataset
Fig. 8 The CA tree result for overall dataset
Environ Earth Sci
123
Page 12
Baxter MJ (1994) Exploratory multivariate analysis in archaeology.
Edinburgh University Press, Edinburgh
Baxter MJ, Buck CE (2000) Data handling and statistical analysis. In:
Ciliberto E, Spoto G (eds) Modern analytical methods in art and
archaeology. Wiley Interscience, New York, pp 681–742
Becker JS (2002) Applications of inductively coupled mass spec-
trometry and laser ablation inductively coupled plasma mass
spectrometry in materials science. Spectrochim Acta B
57:1805–1820
Belfiore CM, Day MD, Hein A, Kilikoglou V, La Rosa V, Mazzoleni
P, Pezzion A (2007) Petrographic and chemical characterization
of pottery production of the Late Minoan I kiln at Hagia Triada,
Crete. Archaeometry 49:621–653
Belfiore CM, di Bella M, Triscari M, Viccaro M (2010) Production
technology and provenance study of archaeological ceramics
from relevant sites in the Acantary River Valley (North-eastern
Sicily). Mater Charact 61:440–451
Bruno P, Caselli M, Curri ML, Genga A, Striccoli R, Traini A (2000)
Chemical characterisation of ancient pottery from south of Italy
by Inductively coupled plasma atomic emission spectroscopy
(ICP–AES): statistical multivariate analysis of data. Anal Chim
Acta 410:193–202
Comodi P, Nazzareni S, Perugini D, Bergamini M (2006) Technology
and provenance of roman ceramics from Scoppieto, Italy: a
mineralogical and petrological study. Per Mineral 75:95–112
Daszkiewicz M, Schneider G (1999) Chemical, mineralogical and
technological studies of fabrics of Roman vessels and lamps
from Poetovio. In: Istenic J (ed) Poetovio: the Western
Cemeteries I. Ljubljana, pp 173–190
Daszkiewicz M, Schneider G (2008a) Bericht zu den Untersuchungen
der Keramik. In: Savel I, Kerman B (eds) Gornje njive pri Dolgi
vasi. Ljubljana, pp 114–126
Daszkiewicz M, Schneider G (2008b) Chemical and mineralogical-
petrographic composition of pottery samples from Ivancna
Gorica (Slowenia). In: Svoljsak D (ed) Mrzlo Polje pri Ivancni
Gorici. Ljubljana, pp 175–179
Davis JC (1986) Statistical and data analysis in geology, 2nd edn.
Wiley, New York
De Clercq W, Degryse P (2008) The mineralogy and petrography of
low lands ware 1 (Roman lower Rhine-Meuse-Scheldt basin; the
Netherlands, Belgium, Germany). J Archaeol Sci 35:448–458
Fermo P, Delnevo E, Lasagni M, Polla S, de Vos M (2008)
Application of chemical and chemometric analytical techniques
to the study of ancient ceramics from Dougga (Tunisia).
Microchem J 88:150–159
Glascock MD, Neff H, Vaughn KJ (2004) Instrumental neutron
activation analysis and multivariate statistics for pottery prov-
enance. Hyperfine Interact 154:95–105
Golitko M, Dudgeon JV, Neff H, Terrell JE (2011) Identification of
post-depositional chemical alteration of ceramics from the north
coast of Papua new Guinea (Sanduan Province) by time-of-
flight-laser ablation-inductively coupled plasma-mass spectrom-
etry (TOF-LA–ICP–MS). Archaeometry 54:80–100
Horvat J (1999) Roman provincial archaeology in Slovenia following
the year 1965: settlement and small finds. Arheoloski Vestnik
50:215–257
Iordanidis A, Garcia-Guinea J, Karamitrou-Mentessidi G (2009)
Analytical study of ancient pottery from the archaeological site
of Ariani, northern Greece. Mater Charact 60:292–302
Kramar S, Lux J, Mirtic B (2008) Analiza izbranih vzorcev malt in
drugih gradbenih materialov iz objekta 2 rimske vile pri
Mosnjah/Analysis of selected samples of mortars and other
construction materials from object 2 of the Roman villa near
Mosnje. Varstvo Spomenikov 44:170–189
Kramar S, Lux J, Mladenovic A, Pristacz H, Mirtic B, Sagadin M,
Rogan-Smuc N (2012) Mineralogical and geochemical
characteristics of Roman pottery from an archaeological site
near Mosnje (Slovenia). Appl Clay Sci 57:39–48
Lux J (2008) Mosnje-rimska naselbina pod Cesto, Varstvo
spomenikov
Mangone A, Giannossa LC, Laviano R, Fiorello CS, Traini A
(2009) Investigation by various analytical techniques to the
correct classification of archaeological finds and delineation
of technological features: Late Roman Lamps from Egna-
tia: from imports to local production. Microchem J
91:214–221
Maniatis Y, Tsirtsoni Z (2002) Characterization of a black residue in
a decorated Neolithic pot from Dikili Tash, Greece: an
unexpected result. Archaeometry 44:229–239
Mannino MR, Orecchio S (2011) Chemical characterization of
ancient potteries from Himera and Pestavecchia necropolis
(Sicily, Italy) by inductively coupled pasma–optical emission
spectrometry (ICP–OES). Microchem J 97:165–172
Maritan L (2004) Archaeometric study of Etruscan-Padan type
pottery from the Veneto region: petrographic, mineralogical
and geochemical-physical characterization. Eur J Mineral
16:297–411
Mommsen H, Beier Th, Hein A (2002) A complete chemical
grouping of the Berkeley neutron activation analysis data on
Mycenaean pottery. J Archaeol Sci 29:613–637
Picon M (1985) Un exemple de pollution aux dimensions kilometr-
iques: la fixation du barium par les ceramiques. Revue d’
Archeometrie 9:27–29
Polvorinos del Rıo A, Sanjuan LG, Perez VH, Arnedo MJH (2005)
Bronze Age ceramics in southwest Spain: an exploratory
archaeometric study of technology and function. Geoarchaeol-
ogy 20:63–84
Rathossi C, Tsolis-Katagas P, Katagas C (2004) Technology and
composition of Roman pottery in northwestern Peloponnese,
Greece. Appl Clay Sci 24:313–326
Riederer J (1992) The microscopic analysis of calcite-tempered
pottery from Nishat Abu Omar. Cahiers de la Ceramique
Egyptienne 3:34–37
Riederer J (2004) Thin section microscopy applied to the study of
archaeological ceramics. Hyperfine Interact 154:143–158
Sagadin M, Lux J (2010) Poskus casovne umestitve objekta 2 rimske
vile rustike pri Mosnjah/an attempt to chronologically determine
building 2 of the Roman villa rustica near Mosnje, Symposium
Emona med Akvilejo in Panonijo Simpozij v spomin dr.
Ljudmile Plesnicar Gec, Ljubljana, 2010
Sanchez Ramos S, Bosch Reig F, Gimeno Adelantado JV, Yusa
Marco DJ, Domenech Carbo A (2002) Study and dating of
medieval ceramic tiles by analysis of enamels with atomic
absorption spectroscopy, X-ray fluorescence and electron
probe microanalysis. Spectrochim Acta B 57:689–700
Tandoh JB, Bredwa-Mensah Y, Dampare SB, Akaho EHK, Nyarko
BJB (2009) Chemical characterization of ancient pottery from
the greater Accra region of Ghana using neutron activation
analysis. Nucl Instrum Meth B 267:1924–1930
Walter V, Besnus Y (1989) Un exemple de pollution en phosphore et
en manganese de ceramiques anciennes. Revue d’ Archeometrie
13:55–64
Zhu J, Shan J, Qiu P, Qin Y, Wang C, He D, Sun B, Tong P, Wu S
(2004) The multivariate statistical analysis and XRD analysis of
pottery at Xigongqiao site. J Archaeol Sci 31:1685–1691
Zupancic N (2006) Analiza gline in opek. In: Lazar I, Vidrih-Perko V,
Zupancic N, Music B, Djuric B, Josipovic D, Eric M (eds)
Ilovica pri Vranskem, Arheologija na avtocestah Slovenije 1.
pp 253–264
Zupancic N, Bole M (1997) Kemicne in mineraloske raziskave
keramike amfor/The chemical and mineralogical analyses of the
amphorae. In: Horvat J (ed) Sermin. Prazgodovinska in
Environ Earth Sci
123
Page 13
zgodnjerimska naselbina v severozahodni Istri/Sermin. A Prehis-
toric and Early Roman Settlement in Northwestern Istria, Opera
Instituti Archaeologici Sloveniae 3:83–99
Zupancic N, Munda M (2006) Izvorna surovina in nacin zganja
neolitske keramike iz Srmina. RMZ Mater Geoenviron 53:49–64
(in Slovene)
Environ Earth Sci
123