Successive, large mass-transport deposits in the south Kermadec fore-arc basin, New Zealand: The Matakaoa Submarine Instability Complex Geoffroy Lamarche National Institute of Water and Atmospheric Research (NIWA) Ltd, Private Bag 14-901, Wellington 6241, New Zealand ([email protected]) Cathy Joanne and Jean-Yves Collot Ge ´osciences Azur, Universite ´ de Nice Sophia-Antipolis, Institut de Recherche pour le De ´veloppement (IRD), Universite ´ Pierre et Marie Curie, Centre National de la Recherche Scientifique (CNRS), Observatoire de la Co ˆte d’Azur, B.P. 48, F-06235 Villefranche-sur-Mer Ce ´dex, France [1] Four >100 km 3 mass-transport deposits (MTDs) identified from their morphology and seismic facies across the Matakaoa Margin and Raukumara fore-arc basin, NE New Zealand, constitute the Matakaoa Submarine Instability Complex (MSIC). MSIC originates from a 45-km-wide, 1100-m-high reentrant in the continental slope. The deposits resulted from three mass-failure events: (1) The Raukumara Slump is identified from the collapsed NW flank of an anticline at the northern end of the reentrant and imbricate structures at its distal end, overlying a flat de ´collement over a >50-km distance. The slump age is roughly estimated between upper Miocene and lower Pleistocene. (2) The Matakaoa Debris Avalanche (MDA) is subdivided into a 260-km 3 blocky unit and a 170-km 3 weakly reflective unit, overlying a high- amplitude seismic reflector truncating the underlying sedimentary units. The MDA is dated 600 ± 150 ka. It originated as a slump, as indicated by back-tilted blocks overlying a rotational failure surface, and evolved during transport as a debris avalanche. The failure of sedimentary basement blocks released Plio- Pleistocene shelf-basin infill, thus producing the blocky and weakly reflective units. Fore-arc basin sediments deformed in front of the MDA for approximately 20 km. (3) The Matakaoa Debris Flow (MDF) occurred 38 – 100 ka ago and extends 200 km northward from the reentrant headwall and consists of a 150- m-thick layer with a chaotic seismic facies. Scouring beneath the MDF and a <250-m-high east bounding scarp indicate basal and lateral erosion associated with the flow displacement. Incorporation of eroded material into the debris flow accounts for >30% of the flow’s 1250 km 3 volume. Factors facilitating failures include the following: slope oversteepening associated with margin uplift and fore-arc subsidence, large-scale folding related to shortening between the Pacific and Australia plates, high-discharge rivers draining the region, and rapid sediment accumulation on the margin. Large to great earthquakes along the plate interface are a likely trigger mechanism controlling the recurrence of large margin failures. Unlike other MTDs along plate boundaries, which are destined to be consumed into the subduction factory, the MSIC provides an opportunity to investigate mega-instabilities at an active margin over million year timescales. Components: 15,353 words, 15 figures, 4 tables. Keywords: submarine landslide; debris flow; slump; debris avalanche; Raukumara Basin; Hikurangi Margin. Index Terms: 3070 Marine Geology and Geophysics: Submarine landslides; 3002 Marine Geology and Geophysics: Continental shelf and slope processes (4219); 8175 Tectonophysics: Tectonics and landscape evolution. G 3 G 3 Geochemistry Geophysics Geosystems Published by AGU and the Geochemical Society AN ELECTRONIC JOURNAL OF THE EARTH SCIENCES Geochemistry Geophysics Geosystems Article Volume 9, Number 4 1 April 2008 Q04001, doi:10.1029/2007GC001843 ISSN: 1525-2027 Copyright 2008 by the American Geophysical Union 1 of 30
Transcript
Successive, large mass-transport deposits in the southKermadec fore-arc basin, New Zealand: The MatakaoaSubmarine Instability Complex
Geoffroy LamarcheNational Institute of Water and Atmospheric Research (NIWA) Ltd, Private Bag 14-901, Wellington 6241, NewZealand ([email protected])
Cathy Joanne and Jean-Yves CollotGeosciences Azur, Universite de Nice Sophia-Antipolis, Institut de Recherche pour le Developpement (IRD), UniversitePierre et Marie Curie, Centre National de la Recherche Scientifique (CNRS), Observatoire de la Cote d’Azur, B.P. 48,F-06235 Villefranche-sur-Mer Cedex, France
[1] Four >100 km3 mass-transport deposits (MTDs) identified from their morphology and seismic faciesacross the Matakaoa Margin and Raukumara fore-arc basin, NE New Zealand, constitute the MatakaoaSubmarine Instability Complex (MSIC). MSIC originates from a 45-km-wide, 1100-m-high reentrant inthe continental slope. The deposits resulted from three mass-failure events: (1) The Raukumara Slump isidentified from the collapsed NW flank of an anticline at the northern end of the reentrant and imbricatestructures at its distal end, overlying a flat decollement over a >50-km distance. The slump age is roughlyestimated between upper Miocene and lower Pleistocene. (2) The Matakaoa Debris Avalanche (MDA) issubdivided into a �260-km3 blocky unit and a �170-km3 weakly reflective unit, overlying a high-amplitude seismic reflector truncating the underlying sedimentary units. The MDA is dated 600 ± 150 ka.It originated as a slump, as indicated by back-tilted blocks overlying a rotational failure surface, andevolved during transport as a debris avalanche. The failure of sedimentary basement blocks released Plio-Pleistocene shelf-basin infill, thus producing the blocky and weakly reflective units. Fore-arc basinsediments deformed in front of the MDA for approximately 20 km. (3) The Matakaoa Debris Flow (MDF)occurred 38–100 ka ago and extends 200 km northward from the reentrant headwall and consists of a 150-m-thick layer with a chaotic seismic facies. Scouring beneath the MDF and a <250-m-high east boundingscarp indicate basal and lateral erosion associated with the flow displacement. Incorporation of erodedmaterial into the debris flow accounts for >30% of the flow’s 1250 km3 volume. Factors facilitatingfailures include the following: slope oversteepening associated with margin uplift and fore-arc subsidence,large-scale folding related to shortening between the Pacific and Australia plates, high-discharge riversdraining the region, and rapid sediment accumulation on the margin. Large to great earthquakes along theplate interface are a likely trigger mechanism controlling the recurrence of large margin failures. Unlikeother MTDs along plate boundaries, which are destined to be consumed into the subduction factory, theMSIC provides an opportunity to investigate mega-instabilities at an active margin over million yeartimescales.
Index Terms: 3070 Marine Geology and Geophysics: Submarine landslides; 3002 Marine Geology and Geophysics:
Continental shelf and slope processes (4219); 8175 Tectonophysics: Tectonics and landscape evolution.
G3G3GeochemistryGeophysics
Geosystems
Published by AGU and the Geochemical Society
AN ELECTRONIC JOURNAL OF THE EARTH SCIENCES
GeochemistryGeophysics
Geosystems
Article
Volume 9, Number 4
1 April 2008
Q04001, doi:10.1029/2007GC001843
ISSN: 1525-2027
Copyright 2008 by the American Geophysical Union 1 of 30
Received 3 October 2007; Revised 15 January 2008; Accepted 28 January 2008; Published 1 April 2008.
Lamarche, G., C. Joanne, and J.-Y. Collot (2008), Successive, large mass-transport deposits in the south Kermadec fore-arc
basin, New Zealand: The Matakaoa Submarine Instability Complex, Geochem. Geophys. Geosyst., 9, Q04001,
doi:10.1029/2007GC001843.
1. Introduction
[2] ‘‘Mass-transport deposit’’ (MTD) is a genericterm referring to geological material that is rapidlyremobilized from and redeposited on the seafloorand typically implies slope failure and gravitationaldeformation in the form of downslope mass move-ments and flows. ‘‘Submarine landslides’’ and‘‘seafloor failures’’ are generic terms used in theliterature to refer to processes that lead to MTDs[Canals et al., 2004; Coleman and Prior, 1988;Hampton et al., 1996; Mulder and Cochonat,1996; Nardin et al., 1979], and these terms areused interchangeably in this study. Processes lead-ing to MTDs can be simplified in three classes[Hampton et al., 1996; McHugh et al., 2002;Nardin et al., 1979; Schwartz, 1982; Mulder andCochonat, 1996]: (1) rockfalls, including debrisavalanches, characterized by individual blocks[e.g., Masson et al., 2002]; (2) slides and slumps,where shear failure occurs along a discrete slidingsurface with little internal deformation; and (3) massflows, including mud and debris flows, whereinternal deformation resulting from laminar fluid-like motion is extensive [Dasgupta, 2003; Prior etal., 1984]. Turbidites also originate from subma-rine instabilities and are controlled by gravitationalmovement to form sediment deposits. Turbidites,however, are not mass transport deposits as theyare generated by fluid flows where motion issupported by turbulence. Different types of MTDscan occur in the same environment to form masstransport complexes, and examples of avalanche/slump complexes [Masson et al., 2002], debris ava-lanches and debris flows [e.g., Collot et al., 2001],slumps and debris flows [Jenner et al., 2007; Piper etal., 1999; Piper and McCall, 2003] and multipledeposits [Moscardelli et al., 2006] are numerous.Several transport and depositional processes mayoccur simultaneously or sequentially [Nardin et al.,1979]. Therefore, mass movements evolve duringtransport from their initial failure, and consequently,similar deposits can originate from different failureand transport mechanisms, e.g., debris flows evolv-ing into turbidity currents [Felix and Peakall, 2006;Mohrig and Marr, 2003], slides evolving into debris
flows [Masson et al., 1998; Prior et al., 1984], andslumps evolving into debris avalanches (this study).
[3] The seismic characters of MTDs provide sub-stantial information regarding their mode of failureand transport. Indeed, there is a continuum in theseismic character of MTDs [Nardin et al., 1979].The spatial dimensions of MTDs in the marineenvironment spans several orders of magnitude inarea (up to 1010 m2), and volume (103–1012 m3),which suits the use of seismic reflection imagingtechniques for their identification. Runout distan-ces of MTDs may be several hundred kilometers.Submarine MTDs therefore, represent major dy-namic responses of the seafloor to tectonic (e.g.,earthquakes, uplift/subsidence), and sedimentary orclimatic forcings. Their study can provide criticalconstraints for establishing global sediment budg-ets along continental margins, understanding themechanisms of sediment redistribution and land-scape evolution as well as improving our knowl-edge of geological hazards.
[4] Large submarine MTDs have been observed inmany different environments, including along vol-canoes flanks [Moore et al., 1989, 1994] andsubmarine fans [Maslin et al., 1998; Piper et al.,1997], but most commonly occur along continentalslopes [Canals et al., 2004]. A number of factorsare required to generate mass transport in themarine environment and these commonly combineon continental slopes of active convergent margins[e.g., Collot et al., 2001; McAdoo et al., 2000].Here, tectonic erosion, high fluid pressures and theoccurrence of gas hydrates, large earthquakes andhigh sedimentation rates all contribute to slope insta-bility. On timescales greater than approximately500 ka, however, the study of large landslides atconvergent margins is hindered by the subductionprocess, whereby the remobilized masses are des-tined to disappear either through subduction or ac-cretion processes, and examples of MTDs are notoften preserved in the sedimentary record [Collot etal., 2001].
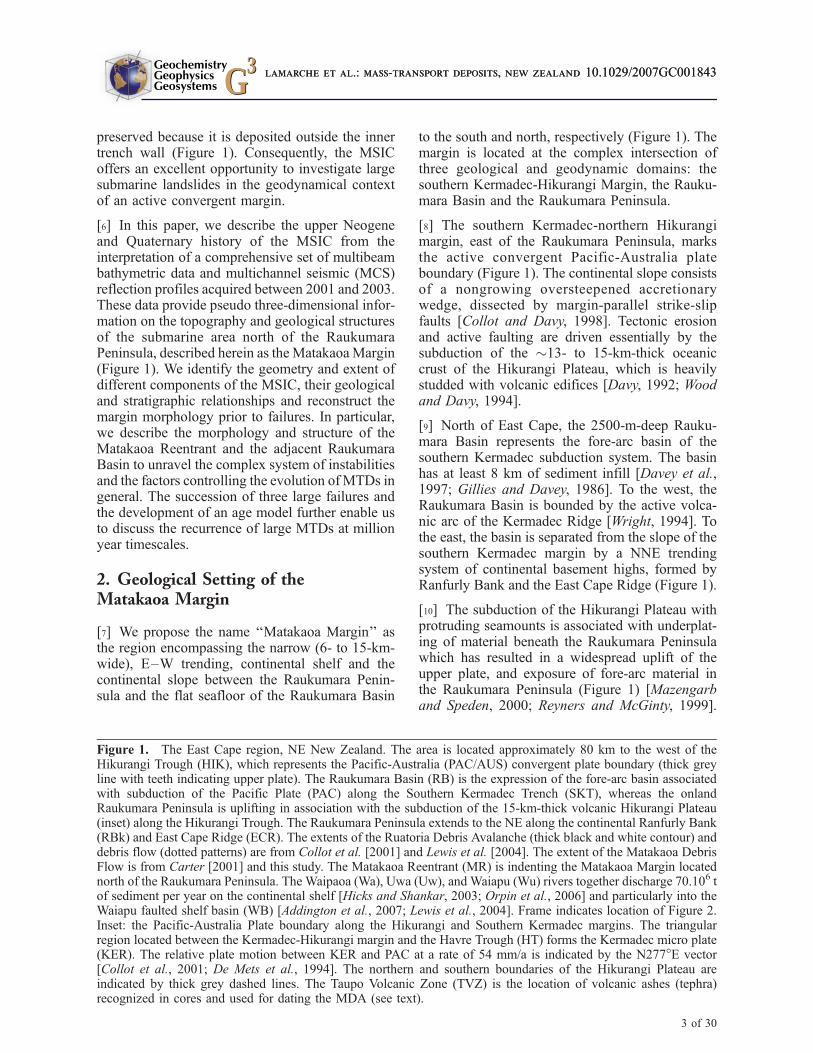
[5] The Matakaoa Submarine Instability Complex(MSIC), however, has developed along the north-east active margin of New Zealand and has been
GeochemistryGeophysicsGeosystems G3G3
lamarche et al.: mass-transport deposits, new zealand 10.1029/2007GC001843
2 of 30
preserved because it is deposited outside the innertrench wall (Figure 1). Consequently, the MSICoffers an excellent opportunity to investigate largesubmarine landslides in the geodynamical contextof an active convergent margin.
[6] In this paper, we describe the upper Neogeneand Quaternary history of the MSIC from theinterpretation of a comprehensive set of multibeambathymetric data and multichannel seismic (MCS)reflection profiles acquired between 2001 and 2003.These data provide pseudo three-dimensional infor-mation on the topography and geological structuresof the submarine area north of the RaukumaraPeninsula, described herein as the MatakaoaMargin(Figure 1). We identify the geometry and extent ofdifferent components of the MSIC, their geologicaland stratigraphic relationships and reconstruct themargin morphology prior to failures. In particular,we describe the morphology and structure of theMatakaoa Reentrant and the adjacent RaukumaraBasin to unravel the complex system of instabilitiesand the factors controlling the evolution of MTDs ingeneral. The succession of three large failures andthe development of an age model further enable usto discuss the recurrence of large MTDs at millionyear timescales.
2. Geological Setting of theMatakaoa Margin
[7] We propose the name ‘‘Matakaoa Margin’’ asthe region encompassing the narrow (6- to 15-km-wide), E–W trending, continental shelf and thecontinental slope between the Raukumara Penin-sula and the flat seafloor of the Raukumara Basin
to the south and north, respectively (Figure 1). Themargin is located at the complex intersection ofthree geological and geodynamic domains: thesouthern Kermadec-Hikurangi Margin, the Rauku-mara Basin and the Raukumara Peninsula.
[8] The southern Kermadec-northern Hikurangimargin, east of the Raukumara Peninsula, marksthe active convergent Pacific-Australia plateboundary (Figure 1). The continental slope consistsof a nongrowing oversteepened accretionarywedge, dissected by margin-parallel strike-slipfaults [Collot and Davy, 1998]. Tectonic erosionand active faulting are driven essentially by thesubduction of the �13- to 15-km-thick oceaniccrust of the Hikurangi Plateau, which is heavilystudded with volcanic edifices [Davy, 1992; Woodand Davy, 1994].
[9] North of East Cape, the 2500-m-deep Rauku-mara Basin represents the fore-arc basin of thesouthern Kermadec subduction system. The basinhas at least 8 km of sediment infill [Davey et al.,1997; Gillies and Davey, 1986]. To the west, theRaukumara Basin is bounded by the active volca-nic arc of the Kermadec Ridge [Wright, 1994]. Tothe east, the basin is separated from the slope of thesouthern Kermadec margin by a NNE trendingsystem of continental basement highs, formed byRanfurly Bank and the East Cape Ridge (Figure 1).
[10] The subduction of the Hikurangi Plateau withprotruding seamounts is associated with underplat-ing of material beneath the Raukumara Peninsulawhich has resulted in a widespread uplift of theupper plate, and exposure of fore-arc material inthe Raukumara Peninsula (Figure 1) [Mazengarband Speden, 2000; Reyners and McGinty, 1999].
Figure 1. The East Cape region, NE New Zealand. The area is located approximately 80 km to the west of theHikurangi Trough (HIK), which represents the Pacific-Australia (PAC/AUS) convergent plate boundary (thick greyline with teeth indicating upper plate). The Raukumara Basin (RB) is the expression of the fore-arc basin associatedwith subduction of the Pacific Plate (PAC) along the Southern Kermadec Trench (SKT), whereas the onlandRaukumara Peninsula is uplifting in association with the subduction of the 15-km-thick volcanic Hikurangi Plateau(inset) along the Hikurangi Trough. The Raukumara Peninsula extends to the NE along the continental Ranfurly Bank(RBk) and East Cape Ridge (ECR). The extents of the Ruatoria Debris Avalanche (thick black and white contour) anddebris flow (dotted patterns) are from Collot et al. [2001] and Lewis et al. [2004]. The extent of the Matakaoa DebrisFlow is from Carter [2001] and this study. The Matakaoa Reentrant (MR) is indenting the Matakaoa Margin locatednorth of the Raukumara Peninsula. The Waipaoa (Wa), Uwa (Uw), and Waiapu (Wu) rivers together discharge 70.106 tof sediment per year on the continental shelf [Hicks and Shankar, 2003; Orpin et al., 2006] and particularly into theWaiapu faulted shelf basin (WB) [Addington et al., 2007; Lewis et al., 2004]. Frame indicates location of Figure 2.Inset: the Pacific-Australia Plate boundary along the Hikurangi and Southern Kermadec margins. The triangularregion located between the Kermadec-Hikurangi margin and the Havre Trough (HT) forms the Kermadec micro plate(KER). The relative plate motion between KER and PAC at a rate of 54 mm/a is indicated by the N277�E vector[Collot et al., 2001; De Mets et al., 1994]. The northern and southern boundaries of the Hikurangi Plateau areindicated by thick grey dashed lines. The Taupo Volcanic Zone (TVZ) is the location of volcanic ashes (tephra)recognized in cores and used for dating the MDA (see text).
GeochemistryGeophysicsGeosystems G3G3
lamarche et al.: mass-transport deposits, new zealand 10.1029/2007GC001843lamarche et al.: mass-transport deposits, new zealand 10.1029/2007GC001843
3 of 30
Elevated marine terraces and river cuttings indicategradual uplift along the east coast of the peninsulato its axis, with a maximum rate of 2.6 mm/a at thenorthern coast (Figure 1) [Gibb, 1981; Wilson etal., 2007a, 2007b] and 3.3. mm/a along the Rau-kumara Axial Ranges [Lewis et al., 2004]. Geo-physical modeling suggests that the subducted
Hikurangi Plateau lies approximately 20 km be-neath East Cape [Reyners and McGinty, 1999].
[11] The Matakaoa Margin is subject to high seis-mic activity. However, because of the weak inter-plate coupling in the region Reyners [1998] andReyners and McGinty [1999] estimate the maxi-
Figure 1
GeochemistryGeophysicsGeosystems G3G3
lamarche et al.: mass-transport deposits, new zealand 10.1029/2007GC001843
4 of 30
mum possible magnitude of a subduction thrustevent in the region is MW 6.9. Paleoseismicitystudies in the Hawkes Bay region, �100 km to thesouth, indicate likely MW 7.9 earthquakes on thesubduction interface at �7100 and 5550 years B.P.[Cochran et al., 2006], whereas elastic-dislocationmodels suggest that rupture of the entire 500 kmplate boundary along the North Island would pro-duce a MW 8.3 earthquake (U. A. Cochran, personalcommunication, 2007).
[12] The basic stratigraphy and structure of theupper margin consists of a succession of well-bedded, highly reflective sequences, separated bybasal unconformities which correspond to induratedMesozoic greywackes and autochthonous Paleo-gene strata, together with early Miocene slidesheets of the East Coast Allochthon [Field et al.,1997]. These units were tectonically faulted andfolded during the Quaternary, so that shelf andslope basins are filled with Neogene and Quater-nary sediment. Fault-controlled shelf and slopebasins are observed elsewhere along the NorthIsland east coast continental shelf [Lewis et al.,2004; Orpin, 2004]. Seismic reflection profilesindicate that very high sedimentation rates persistedthrough most of the Quaternary, with �1 km ofsediment fill accumulating in the Waiapu shelfbasin immediately east of East Cape (Figure 1)[Lewis et al., 2004].
[13] Late Quaternary sedimentation rates of 0.1–0.2 mm/a were estimated offshore in the Rauku-mara Basin [Carter, 2001; Kohn and Glasby,1978]. On the continental shelf, sedimentation ratesin the order of 0.5 mm/a are estimated from post–last glacial sediment thickness in the Waiapu shelfbasin [Lewis et al., 2004]. This basin is located atthe head of the Ruatoria and the Matakaoa reen-trants, to the east and north. Collapse and trans-verse structures in the Waiapu shelf basin (locationon Figure 1) [Lewis et al., 2004] are interpreted asevidence for the passage of a large subductingseamount beneath the continental shelf landward
of the head of the Ruatoria reentrant and supportthe hypothesis that the Ruatoria debris avalanchewas formed in the wake of an obliquely subductingseamount [Collot et al., 2001]. Holocene sedimen-tation rates reflect the high terrestrial input from therapidly rising onshore Raukumara Ranges deliv-ered to the continental shelf by the Waiapu River,New Zealand’s largest fluvial supply of suspendedload with 36 106 t of sediment discharged per year[Hicks and Shankar, 2003].
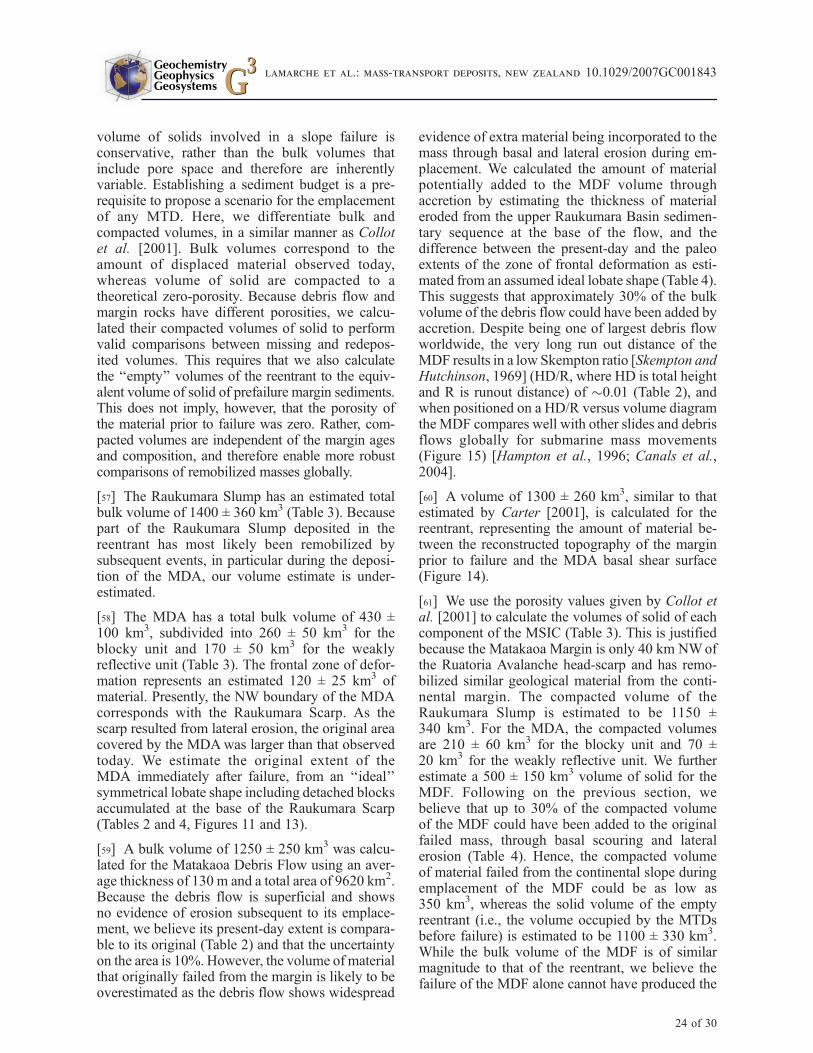
3. Data Sets
[14] We utilized a combination ofmultibeam bathym-etry and MCS reflection data acquired during threeoceanographic surveys (August 2001, April 2002,April 2003) on board R/V Tangaroa, over the Mata-kaoa Margin and the Raukumara Basin (Figure 2).The multibeam bathymetry was acquired using aSIMRAD EM300 and covers approximately 14000km2. Approximately 1100 km of MCS reflectiondata were acquired with 16 profiles acquired in 2001(Mat101 to Mat116), and 10 profiles acquired in2003 (Mat301 to Mat310) (Figure 2). The MCSequipment comprised one GI air gun operating inharmonic mode (45–105 in3 chambers), and a48-channel, 600-m-long analogue seismic streamer.Seismic processing included time domain filtering,predictive deconvolution, 12-fold stack, and timemigration using velocity obtained from stackingvelocity (NMO) analysis. The 10–250 Hz frequencyrange of the seismic system provides information toapproximately 1.5 km beneath the seafloor with aresolution of less than �5 m at depth shallower than500 ms (note: all seismic reflection times areexpressed in two-way travel-time). We also usearchived seismic reflection data, essentially single-channel air-gun profiles, and several deep MCS oilindustry profiles. A series of short gravity cores(<6 m) and dredge samples were acquired at specifictargets with the aim of constraining the age ofthe various remobilized masses. High-resolution
Figure 2. Multibeam seafloor topography of the Matakaoa Margin and Raukumara Basin, with locations of seismicreflection profiles, core (star), and dredge (arrow) sites. The Digital Terrain Model (DTM) constructed from EM300multibeam data is superimposed on contour lines from the regional bathymetry with contour lines providing a depthscale. White bold numbers indicate multichannel seismic profiles shown in subsequent figures (prefix Mat for seismiclines omitted for clarity). OGS Explora [Davey et al., 1997] multichannel and Geodynz [Collot et al., 1996] single-channel seismic reflection profiles were acquired for academic purposes and included in this interpretation, alongwith Mobil (Mob) and NZ Ministry of Economic Development (MED) deep industrial multichannel seismicreflection profiles. A number of other minor seismic reflection profiles were utilized [see Carter, 2001]. High-resolution 3.5 kHz profiles are not shown although they were systematically acquired along multibeam ship tracks.Inset: single-channel air gun profile over the toe of the Matakaoa Debris Flow (with location on main DTM) [fromCarter, 2001].
GeochemistryGeophysicsGeosystems G3G3
lamarche et al.: mass-transport deposits, new zealand 10.1029/2007GC001843
5 of 30
Figure 2
GeochemistryGeophysicsGeosystems G3G3
lamarche et al.: mass-transport deposits, new zealand 10.1029/2007GC001843
6 of 30
(3.5 kHz) seismic reflection data were acquiredsimultaneously with MCS and multibeam data.
4. Geomorphic Elements of theContinental Slope
[15] The Matakaoa Reentrant was first recognizedfrom regional bathymetry and limited single-channel seismic reflection profiles [Carter, 2001;Lewis and Marshall, 1996]. The reentrant is aconspicuous 45-km-long, �30-km-wide ellipticindentation of the Matakaoa Margin, which coversan area of �1000 km2 (Table 2), and divides intomorphologically distinct eastern and westernhalves (Figure 3). The reentrant is delimited tothe west by an 1100-m-high, NE trending, rectilin-ear wall and to the east by a 300-m-high, N trendingscarp, concave to the west. Along its southern wall,the top of the head scarp lies in less than 250 m ofwater depth, less than 10 km from the coast of theRaukumara Peninsula. The reentrant is partlyclosed to the north and northeast by a zone ofrugged terrain that rises up to �1200 m waterdepth, and is called the Tokata Dome. To the west,the reentrant opens into the Raukumara Basinthrough a 2000-m-deep, 10-km-wide zone of flat-lying seafloor, herein named the Raukumara Corri-dor. The irregular continental slope east of theMatakaoa Reentrant descends from �100 m at thetop of Ranfurly Bank into the �2300-m-deepRaukumara Basin.
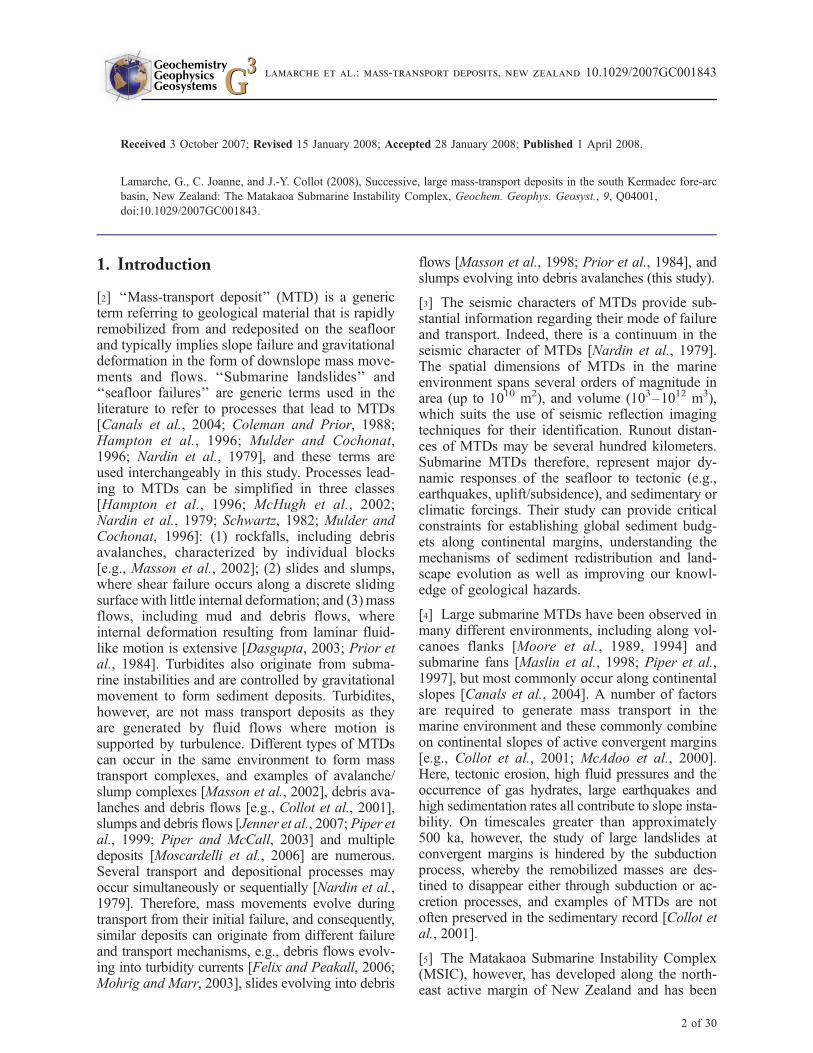
[16] The reentrant’s eastern half is characterized bya 1200-m-deep, �300 km2 area of smooth seafloor,cut by the meandering Matakaoa Channel. Thechannel terminates in the south at the linear,�300-m-deep, 1-km-wide Matakaoa Canyon thatincises the top of the continental slope (Figure 3).The southern wall of the eastern half of thereentrant is dissected by fan-valleys divergingdownslope. The centre of the reentrant is dominat-ed by several kilometer-wide hummocks, knollsand ridges. The largest ridge is the MatakaoaRidge, a prominent 2-km-wide, �10-km-long easttrending ridge. Smaller ridges to the north, typically2–3 km long, have a general E–W trend. Thewestern half of the reentrant is characterized by theRaukumara Corridor to the north, and a steepsouthern wall, dissected by a pervasive networkof slope canyons that radially converge downslopeinto the corridor. The average slope of the southernhead wall is 7� (Figure 4).
[17] West of the Matakaoa Reentrant the uppercontinental slope has not been affected by large
slope failures and can therefore be considered as areference for prefailure slope morphology (Figure 3and profile 1 on Figure 4a). The slope here has aconcave-downward profile, with an average slope of4�, whereas the lower slope has a gradient of lessthan 1� and merges progressively with the seafloorof the Raukumara Basin (Figure 4a, profile 1).
[18] North of the reentrant, the Raukumara Basinshows a very smooth and flat, approximately2300-m-deep, seafloor extending at least 200 kmto the north and north-west. Awell-defined, 250-m-high, NNE trending scarp, herein called the Rau-kumara Scarp, straddles the seafloor of the Rauku-mara Basin, from immediately north of the reentrantfor about 70 km (Figure 2). At the base of the scarp(west), the seafloor is scattered with blocks andridges up to 800-m-long (e.g., 37�050S/178�390E,Figure 3) that trend parallel to the scarp. Furtherto the west, the seafloor is largely featureless,except for a cluster of about 60 large hummocks(up to 2.5 km long and 200 m high, e.g., 36�580S/178�330E, Figures 2 and 3) which arrange in mapview to form a 40-km-long, pear-shaped fieldpointing southward named herein the RaukumaraBlocks (Figure 2).
5. Continental Slope and RaukumaraBasin Sedimentary Sequence andStructure
5.1. Basal Sedimentary Sequence
[19] A series of anticlines, with E–Waxes (Figure 3)and controlled by steep reverse faults are visiblebeneath the continental slope of Ranfurly Bank(CDPs 3000, 5000 and 7000, Figure 5), the north-ernmost of which is called Tokata Anticline (CDP2800 Figure 6). The Tokata Dome is the morpho-logical expression of the outcropping summit of theanticline. Several seismically transparent lensesalong the northern flanks of these anticlines areinterpreted as small-scale MTDs (length <10 km;thickness <100 m).
[20] The sedimentary sequence beneath the conti-nental slope and the Raukumara Basin is imagedon MCS profiles to approximately 2 s (2–2.5 km)beneath the seafloor. We recognize upper andlower sedimentary units and an acoustic basement(Table 1, Figures 5 to 10). Both sedimentary unitshave comparable seismic character, consisting ofhighly coherent, high-amplitude reflectors. Thebase of the upper sedimentary unit is an unconfor-mity identified as a series of onlaps in the core of
GeochemistryGeophysicsGeosystems G3G3
lamarche et al.: mass-transport deposits, new zealand 10.1029/2007GC001843
7 of 30
the Tokata Anticline (CDP2800, Figure 6) indicat-ing that tectonic deformation initiated prior to thedeposition of the upper sedimentary unit. Foldingwithin the upper sedimentary unit indicates syn-deformation sedimentation. In the reentrant, theupper and lower sedimentary units have �500 msand �1100 ms minimum thicknesses, respectively,
and the tops of both units are truncated (Figure 6).Both units extend northward into the RaukumaraBasin where the top of the upper unit is truncated.
[21] Both sedimentary units rise beneath the reen-trant eastern wall (Figures 7 and 8a). The promi-nent folds of the sedimentary sequence observed
Figure 3. EM300 multibeam bathymetry over the region of the Matakaoa Reentrant. The 25-m grid is shaded fromthe north and superimposed on the contoured regional bathymetry. Multichannel seismic reflection profiles areindicated by thick lines with CDP numbers, line numbers (prefix Mat omitted), and figure numbers only for profilesshown in subsequent figures, and in thin, light grey for those not shown in this paper. Double arrows indicateanticline axes as interpreted from seismic reflection profiles. Main topographic features discussed in text includeMatakaoa Ridge (MR), Ranfurly Bank (RBk), and Te Aroha shelf Basin (TAB). The Tokata Dome (TD) is themorphologic expression of the Tokata Anticline. Horoera Bay (HB) is the location of inferred 2.6 mm/a Holoceneuplift [Wilson et al., 2007a]. Onshore data are derived from Eagle Technology Ltd.’s EagleDataTM, which is aderivative of the 1:50,000 Digital Vector Topographic Land Information New Zealand data set.
GeochemistryGeophysicsGeosystems G3G3
lamarche et al.: mass-transport deposits, new zealand 10.1029/2007GC001843
8 of 30
beneath the reentrant and Ranfurly Bank attest to acompressional tectonic environment. Beneath thereentrant’s headwall, both upper and lower sedi-mentary units are sharply truncated subverticallyover �700 ms beneath the southern rim of thereentrant (CDP 7800, Figure 6), �500 ms to theeast (CDP 1500 Figure 7), and 200 ms to the west(CDP 1600, Figure 10).
5.2. Quaternary Sequences
[22] The top of the continental slope is character-ized by subhorizontal reflectors that progradenorthward (Postavalanche Sediment Wedge(PSW), Figure 5c) and unconformably overlie aslope basin. The eastern scarp of the reentrant has aslope of 18� and truncates the Ranfurly Banksedimentary sequence (profile E, Figure 4b).
[23] The eastern part of the reentrant is underlainby a <300-ms-thick seismic unit characterized byinterfingering, high-amplitude, low-frequency, co-herent reflectors, interpreted as turbidite depositswith typical levees on both sides of the Matakaoa
Channel (Figures 3 and 7). A wedge of sediment isensconced within the southern wall of the reen-trant, and tapers northward with an average surfaceslope of 4.5� (PSW on Figures 6 and 7). In crosssection, the sediment wedge consists of a packageof high-frequency, conformable reflectors uncon-formably overlying the underlying units.
6. Morphology and Structures of theMatakaoa Submarine InstabilityComplex
[24] From the seafloor morphology (Figures 2and 3), and seismic facies, we identify five distinctlarge MTDs (i.e., >100 km3, Table 1) along theMatakaoa Margin and in the Raukumara Basin,which together make the Matakaoa SubmarineInstability Complex (MSIC). From their geometri-cal relationships, we demonstrate that the fiveMTDs originate from three distinct major submarinemass-failure events: (1) the Raukumara Slump;(2) the Matakaoa Debris Avalanche (MDA); and(3) the Matakaoa Debris Flow (MDF).
Figure 4. Bathymetric profiles across the margin and the reentrant. (a) The Matakaoa Margin includes thecontinental slope on either side of the reentrant (profiles 1 and 5, i.e., along the nonfailed parts of the margin) andwithin the reentrant (profiles 2, 3, and 4). (b) Western and eastern reentrant walls. (c) Map showing profile locations.(d) Sketch of the various morphometric parameters used in text and Tables 2 and 3.
GeochemistryGeophysicsGeosystems G3G3
lamarche et al.: mass-transport deposits, new zealand 10.1029/2007GC001843
9 of 30
6.1. Raukumara Slump
[25] The Raukumara Slump is best imaged in theRaukumara Basin between 300 and 700 ms belowseafloor as a distinctive seismic unit consisting ofpatches of coherent sediments conformably over-lying a high-amplitude, remarkably coherent, sub-horizontal basal reflector (Figure 9). The coherentreflections are disrupted by numerous ramps thatdevelop from the basal reflector to create a series ofwell-defined imbricate structures, with reflectionterminations visible at the downslope end. Theimbricate structures are observed between �40and 110 km north of reentrant wall (northward ofCDP 12000 Figure 9), and terminate along afrontal ramp that marks the transition with theotherwise uniform and undeformed sedimentarysequence of the Raukumara Basin (CDP 2100,Figures 9a and 9b). The imbricate structures aretherefore buttressed against the undisturbed strataof the Raukumara Basin. The imbricate structures
cumulate an estimated 30% shortening throughthrusting and thickening, with a limited amountof displacement in the more distal frontal region.Although the unit is thickened and deformed, thesimilarity between the stratigraphic sequencesacross the frontal ramp, together with packages ofundeformed sediments conformable with the basinsequence beneath the decollement observed be-tween the imbricate structures, strongly suggeststhat the imbricate structures consist of remobilizedbasin sediments with a limited amount of displace-ment in the frontal region. The geometry andseismic character of the slump are very similar tofeatures described offshore Israel by Frey-Martinezet al. [2006], and therefore the unit is interpreted asa frontally confined landslide. Upward, the seismiccharacter of the unit progressively loses coherencyand becomes chaotic and featureless, suggesting adifferent mechanical behavior than at the base ofthe unit. Although the lateral terminations of theimbricate structures to the east and west are only
Figure 5. MCS reflection profile Mat301 along the eastern edge of the Matakaoa Reentrant and southern part of theRaukumara Basin. (a) Interpreted profile. (b) Enlargement of uninterpreted fully processed seismic data over thedistal part of the Matakaoa Debris Avalanche (MDA). (c) Enlargement of uninterpreted fully processed seismic dataover the upper part of the margin. See (d) inset and Figure 2 for location of seismic profiles. All seismic data wereprocessed using Globe ClaritasTM from GNS Science, Lower Hutt, NZ. Slope gradients are calculated usingsound velocities of 1800 m/s in the Matakaoa Debris Avalanche and 2000 m/s in underlying units. MDF,Matakaoa Debris Flow; WRU, Weakly Reflective Unit; LSU, Lower Sedimentary Unit, USU, UpperSedimentary Unit, PSW, Postavalanche Sedimentary Wedge. Black lines are geological faults. Crossingswith other seismic reflection profiles are indicated by line numbers and vertical arrows. Note that onlymajor faults are interpreted; minor faults, especially in the upper part of the margin, have not been the focusof these interpretations. Inferred faults are dashed.
GeochemistryGeophysicsGeosystems G3G3
lamarche et al.: mass-transport deposits, new zealand 10.1029/2007GC001843
10 of 30
constrained by five seismic lines, the observedsharp boundaries of the slump reveal a well con-strained area.
[26] Southward along Mat105 and Mat106, the unitthins out, and the basal shear surface onlaps ontothe northern flank of the Tokata Anticline (�CDP2000–2100, Figure 6). Most of the RaukumaraSlump is sandwiched within the upper sedimentaryunit, which indicates that tectonic deformationcontinued subsequently to the slumping, as theupper sedimentary unit deposited during tectonicactivity. The imbricate structures are identified tothe west of the anticline along Mat302 (Figures 8aand 8b). On Mat111, the NW flank of the TokataAnticline is characterized by a >600-m-thick(650 ms), undulating coherent reflectors overlyinga concave-upward basal surface that truncates thecoherent well-stratified upper and lower sedimen-tary units (Mat 111, CDP 2000–4000 Figures 8cand 8d). This facies is interpreted as faulted andback-tilted blocks indicating that the flank of the
anticline has collapsed on a rotational surface, as aslump. This seismic character extends further south-ward along Mat303 (not shown) and Mat116(Figure 7), but the coherency of the sedimentarysequence weakens dramatically into a chaotic facies.Beneath the Raukumara Corridor, the basal surfaceramps up to the west and truncates the upper andlower sedimentary units in the same manner as onMat111 (Figures 8c and 8d) and Mat116 (Figure 7),which suggests lateral confinement of the MTD.The upper part of the anticline corresponds to theproximal facies of the slump, whereas the imbricatestructures, which it connects with to the north,correspond to the distal part of the deposit. TheRaukumara Slump covers an area of �4000 km2
(Table 2 and Figure 11).
6.2. Matakaoa Debris Avalanche
[27] The MDA consists of two remobilized sedi-mentary masses identified from the seafloor mor-phology and seismic facies: a weakly reflective
Figure 6. MCS reflection profile Mat106 across the Matakaoa Reentrant. (a) Interpreted profile and (b) uninterpretedprocessed data. (c) Enlargement on the weakly reflective unit, showing the strong negative reflector indicating thebasal shear surface, and the overlying Postavalanche Sedimentary Wedge. (d) Location of profile. See Figure 5 for fullcaption and color legend and Figure 2 for location of seismic profiles.
GeochemistryGeophysicsGeosystems G3G3
lamarche et al.: mass-transport deposits, new zealand 10.1029/2007GC001843
11 of 30
Table 1. Seismic Reflection Character and Relationships With Underlying Units of the Four Mass-TransportDeposits and the Frontal Deformation Zone Forming the Matakaoa Submarine Instability Complex
Name of MTD AbbrevaMorphology andSeismic Facies
Relation toUnderlying Unit Figure
Turbiditic flow Very high amplitudes,subhorizontal,extreme coherencyand continuityassociated withMatakaoa channel.Uppermost unit inreentrant.
Raukumara Blocks - Hummocky seafloor.Discontinuous fromMDF. Internal coherent,high-amplitudereflectors, often tilted.
Embedded in MDF, reachesthe MDF basal surfacein places.
10
Matakaoa Debris Avalanche (MDA)Weakly Reflective Unit WRU Coherent, low-amplitude,
undulating reflectors +patches of low-frequency,high-amplitude reflectorsoften tilted upslope.
Highly unconformable onUSU and LSU. Basalreflector characterized byhigh, negative amplitude,and truncations. Onlappingon the blocky unit.
6 and 7
Blocky Unit BU Hummocky seafloor, largeridges and hummocks.Blocks and ridges withtilted, high-amplitude,coherent reflectors, lyingunconformably over basalnegative amplitude reflector.Ridges and hummocksimbricated with contactsmerging withbasal surface.
Unconformably overlyingUSU and LSU. Basalreflector characterizedby high, negative amplitude,and truncations.
6, 7, and 8
Frontal zone of deformation FZD Chaotic reflectors, subhorizontal,imbricated structures mergingon a horizontal, high-amplitudecoherent reflector. Approximately200–250 m thick (230 ms).
Highly coherent, high-amplitude basal reflector.Facies is consistent for>30 km.
5 and 9
Raukumara Slump RS Distal part: irregular and patchyseismic facies, �450 ms thick(<500 m); series of flats andramps over >50 km, withweakly reflective, incoherentcover. Proximal part: highlyincoherent facies along theN and NW flank of TokataAnticline.
MDA basal shear surface - High amplitude, highly coherentand continuous. Negativepolarity with respect to theseafloor.
Truncated underlying units(USU and LSU) andonlapping overlyingunits (WRU, BU).
5 to 8
GeochemistryGeophysicsGeosystems G3G3
lamarche et al.: mass-transport deposits, new zealand 10.1029/2007GC001843
12 of 30
unit essentially occupying the eastern half of thereentrant, and a blocky unit in the centre of thereentrant and its northern approaches. The MDAcovers a maximum area of �1600 km2 (Table 2and Figure 11).
[28] The weakly reflective unit is characterizedseismically by coherent, faint, undulating reflectors(Figures 6 and 7 and Table 1) with a maximumthickness of 1 s (800 m). The unit truncatessubvertically the continental slope sedimentary se-quence beneath the reentrant’s southern (CDP7800,Figure 6) and eastern walls (CDP 1400, Figure 7).The conspicuous seismic character of the weaklyreflective unit is well recognized on several seismic
profiles in the eastern half of the reentrant, where itshows a maximum thickness of 1000 ms (>900 m).A unit with comparable seismic character, in asimilar stratigraphic position and truncating theunderlying upper and lower sedimentary units, isrecognized beneath the western corner of the reen-trant onMat310 (Figure 10) andMat308 (not shown[see Joanne, 2008]) (Figure 11). However, the lackof traceable correlation between the two units acrossthe centre of the reentrant and beneath the southernwall does not allow us to make an unambiguousconnection of the weakly reflective unit over theentire reentrant. This suggests, however, that theweakly reflective unit likely occupies most of thereentrant with a maximum present-day extent of
Table 1. (continued)
Name of MTD AbbrevaMorphology andSeismic Facies
Relation toUnderlying Unit Figure
Upper sedimentary sequence USU Highly coherent, low amplitudesubhorizontal beneath continentalslope.
aAbbrev: abbreviations used in figures and subsequent tables.
Figure 7. MCS reflection profile Mat116 across the Matakaoa Reentrant. (a) Interpreted profile and (b) uninterpretedprocessed data. (c) Enlargement on the failed western flank of the Tokata Anticline, and erosional basal surface of theMDF. (d) Enlargement on WRU showing back-tilted reflectors. Curved arrows indicate interpreted back-tilted blocks.See Figure 5 for full caption and color legend and Figure 2 for location of seismic profiles.
GeochemistryGeophysicsGeosystems G3G3
lamarche et al.: mass-transport deposits, new zealand 10.1029/2007GC001843
13 of 30
�460 km2 (Table 2). A minimum area of 290 km2 isgiven by the well defined weakly reflective unit inthe eastern half of the reentrant.
[29] The basal surface of the weakly reflective unitis an obvious high-amplitude, negative polarityreflector (Figure 6c) with a concave-upward geom-etry (Figure 7), which we interpret as the basalshear (or sliding) surface. It dips WNW on Mat116(Figure 7), and is subhorizontal on Mat106(Figure 6), which indicates an average NW dip.The basal shear surface connects with the subvert-ical truncation surface that outcrops at the seafloorin �800 m water-depth along the reentrant’s east-ern wall (�CDP1400, Figure 7), and is buriedbeneath �400 m of material along the southernwall (CDP7800, Figure 6). Toplaps immediatelybeneath the basal shear surface indicate erosionprocesses. Patches of south dipping coherentreflectors within the weakly reflective unit areinterpreted as back-tilted blocks of possibly differ-ent rheology (Figure 7a and Line Mat305 (notshown [see Joanne, 2008]). The occurrences ofback-tilted blocks, together with the rotationalbasal shear surface, demonstrate the processes of
slump emplacement. The basal shear surfaceextends northward in the centre of the reentrant.
[30] The blocky unit consists of kilometer-widehummocks, knolls and ridges (Figure 3) whichhave high-amplitude, well-stratified seismic char-acteristics. This is best exemplified by theMatakaoaRidge that culminates �800 ms (�800–1000 m)above the basal shear surface (Figures 6 and 7). OnMat116 and Mat106, large blocks have reflectorstilted to the east and south, respectively, whichindicate that blocks are back-tilted to the southeastthus corroborating a failure mechanism of a slump.The blocks are arranged in a stacking pattern withnorthward-verging ramps branching from the basalreflector suggesting a zone of accumulation whereblocks are piled up. The basal surface extendsfurther to the east of the Tokata Anticline and tothe north into the Raukumara Basin (Figures 5 and8), where isolated blocks are imaged scattered onthe seafloor. Overall the blocky unit covers an areaof 1100 km2 encompassing the eastern half of thereentrant as well as its eastern and northernapproaches (Figure 11).
Figure 8. Parts of MCS reflection profiles (a) Mat302 and (c) Mat111 over the NW flank of the Tokata Anticline.Enlargements of uninterpreted seismic reflection profiles (b) Mat302 and (d) Mat111 showing the extension of theRaukumara Slump to the south and the collapsed flank of the anticline. (e) Inset shows the location of seismicprofiles. See Figure 5 for full caption and color legend and Figure 2 for location of seismic profiles.
GeochemistryGeophysicsGeosystems G3G3
lamarche et al.: mass-transport deposits, new zealand 10.1029/2007GC001843
14 of 30
[31] The northern boundary of the blocky unit isinterpreted at the slope break (Figure 9a, CDP12500) that also corresponds with a change fromrugged seafloor in the south to smoother seafloor inthe north, and appears to be associated with a faint,northward verging reflector (Figure 9, CDP12000). This geometry implies that the blocky unitslightly ramped over the Raukumara basin sedi-ments near latitude 36�500S (Figure 11).
[32] Immediately north of the MDA boundary, theseafloor is underlain by weakly deformed basinsediments with patches of high-amplitude, coher-ent reflectors with a uniform thickness of �200 ms
conformably overlying the sedimentary sequenceof the Raukumara Basin (Figure 9). The deforma-tion is expressed by small-offset reverse faults,soling out on a 0.5� northward dipping, planar,continuous reflector (Figure 9), corresponding tothe basal shear surface of the MDA in the reentrant.The weakly thrust basin sediments, together withthe conformity between the reflectors and the basalshear surface, as well as the absence of rotationalfeatures within the unit, define a zone of compres-sional deformation in front of the blocky unit. Thedeformation is observed for approximately 20 km
Figure 9. (a) MCS reflection profile Mat105 in the Raukumara Basin, showing the frontally confined landslideassociated with the tail end of the Raukumara Slump (see Figure 5 for color legend). Because the line runs veryoblique to the transition from the zone of frontal deformation of the Matakaoa Debris Avalanche (MDA) to theMatakaoa Debris Flow (MDF), it is poorly defined on this profile. Lateral erosion of the Raukumara Basin sedimentsduring emplacement of the MDF also contributes to smearing of the transition on seismic profiles. (b) Enlargementof the seismic data over the tail end of the Raukumara Slump. Half-arrows indicate the imbricate structures.(c) Enlargement over the transition from the blocky unit to the zone of frontal deformation. Half-arrows indicateweakly developed thrusts, while black and white arrows indicate the faint transition from the blocky unit to the frontalzone of deformation. Slope gradients are calculated using velocities of 1800 m/s in the upper part of the basinsediment and 2000 m/s in underlying units. Dashed arrows indicate vertical incoherent thin patches across thesedimentary units interpreted as evidence of dewatering. (d) Interpreted section over the tail end of the RaukumaraSlump. Color codes and full caption on Figure 5. Location of seismic profiles on Figure 2.
GeochemistryGeophysicsGeosystems G3G3
lamarche et al.: mass-transport deposits, new zealand 10.1029/2007GC001843
15 of 30
Table 2. Morphometric Parameters of the Matakaoa Submarine Instability Complexa
NamePresent
Extent, km2Paleo
Extent, km2
HeadwallLength, km
HeadwallHeight, m
RunoutDist., km
HeightDrop, m
HD/RRatio(�100) a, deg
HLmin HLmax HHmin HHmax R HDmin HDmax min max min max
aMSIC, Matakaoa Submarine Instability Complex. We estimated the present-day (Present Extent) extents of the remobilized masses and that at
the time of emplacement (Paleo Extent). All morphometric parameters are explained on Figure 4c. HD/R is also known as Skempton ratio[Skempton and Hutchinson, 1969] (Figure 15).
bMinimum height drop calculated assuming a 25% uncertainty on maximum drop.
cMinimum area is that identified in the eastern half of the reentrant; maximum area includes a likely continuity with the unit beneath the SW
corner of the reentrant (see text and Figure 11).
Figure 10. MCS reflection profile Mat310 along the Raukumara Corridor and into the southern part of theRaukumara Basin. The profile shows the Matakaoa Debris Flow (MDF) [Carter, 2001] in the upper 250 ms and aseries of remobilized units at depth in the basin. Inset shows the base of the MDF with strong scouring of theunderlying sedimentary unit. Slope gradient is calculated using a velocity of 1800 m/s in debris flow and 2000 m/s inunderlying units. The MTD south of CDP 1000 is interpreted as the westernmost expression of the weakly reflectiveunit of the Matakaoa Debris Avalanche, but no conclusive ties were found with the facies identified in the eastern halfof the reentrant (see text). The dashed arrows indicate vertical incoherent thin patches across the sedimentarysequence interpreted as evidence of dewatering. See Figure 5 for full caption and color legend and Figure 2 forlocation of seismic profiles.
GeochemistryGeophysicsGeosystems G3G3
lamarche et al.: mass-transport deposits, new zealand 10.1029/2007GC001843
16 of 30
north of the blocky unit (CDP 12000 Figure 9c andFigure 11).
[33] The weakly reflective unit, blocky unit, andthe zone of frontal deformation lie on a commonshear surface, are continuous in space and overlapeach other northward, which together suggest that
they formed synchronously. The differing seismicfacies imply geologically distinctive components,but the large number of individual blocks identifiedin the reentrant and in the Raukumara Basinjustifies the term ‘‘debris avalanche’’ to describethe deposit complex, in agreement with previousdefinitions and descriptions of similar features
Figure 11. Present-day extents of the mass transport deposits of the Matakaoa Submarine Instability Complex(MSIC), as identified along the Matakaoa Margin and in the Raukumara Basin. Grey dash lines indicate seismicreflection profiles (see Figure 2).
GeochemistryGeophysicsGeosystems G3G3
lamarche et al.: mass-transport deposits, new zealand 10.1029/2007GC001843
17 of 30
elsewhere [e.g., Hampton et al., 1996; Collot et al.,2001; Masson et al., 2002].
6.3. Matakaoa Debris Flow andRaukumara Blocks
[34] The Matakaoa Debris Flow (MDF) is charac-terized by a chaotic, weakly reflective seismic faciesand a strongly reflective, basal surface (Mat310,Figure 10) that extends �200 km northward of theMatakaoa Reentrant wall. A >40-m-high toe marksthe northern termination of the MDF [Carter, 2001](Figure 2b). MDF covers an area of�9600 km2, hasan average thickness of 130 m (Table 2), and amaximum thickness of 340 m (380 ms) in theRaukumara Corridor (Figures 7 and 11). It is cov-ered by a thin veneer (<30 m) of turbiditic andhemipelagic sediments [Joanne, 2008].
[35] The basal surface of the MDF truncates un-derlying strata (Figures 7, 8, and 10c), and at itssouthern termination, MDF covers a scarp in thecontinental slope sedimentary unit (CDP1500,Figure 10). The Raukumara Scarp marks the east-ern boundary of the MDF, where seismic reflectorswithin the MDA are truncated (Mat301, Figure 5).The scarp is not connected with geological faults atdepth, and is therefore interpreted as an erosionfeature. At the toe of the scarp, blocks and ridges thattrend parallel to the scarp (e.g., 36�55S, Figure 3)are embedded into the debris flow, suggesting thatthey detached from the scarp during the emplace-ment of the flow. The basal truncation surface,together with the buried scarp to the south, andthe Raukumara Scarp to the east imply that the MDFeroded the preexisting sedimentary sequence duringits emplacement.
[36] The Raukumara Blocks consist of individualkilometer-long blocks with internal stratification.The block bases either correspond with or areshallower than the MDF basal surface (Figures 2and 10), with evidence, albeit weak, of debris flowmaterial between the basal surface and the blocks(e.g., line Mat 310, Figure 10). In map view, thepear-shaped distribution of the Raukumara Blockspoints southward, suggesting the blocks originatedfrom the centre of the reentrant (Figure 2).
7. Age Control
[37] Core #10 acquired during the 2001 voyage ofR/V Tangaora is a 2.76-m-long gravity core re-covered in a 85- to 115-m-thick sediment-pondedbasin on the MDA in the centre of the reentrant(location on Figure 2). Core #10 consists of silty to
clayey hemipelagic sediments with thin interbed-ded turbidites and tephra layers, which we consideras representative of the postavalanche sedimenta-tion. Tephrochronology, carbonate content and sta-ble isotope analyses allow us to develop amultiproxy age model for the timing of avalancheemplacement (Figure 12). Glass shards in twomacroscopic tephra layers at 70 cm and 226 cmdepth are chemically finger-printed to the 5.5 kaWhakatane, and 13.7 ka Waiohau volcanic erup-tions, respectively [Lowe et al., 2008], in agree-ment with the placement of the Marine IsotopeStage (MIS) 1/2 boundary close to 220 cm basedon the d18O isotope curves. From these results, apostglacial sedimentation rate of�0.17 ± 0.02mm/acan be estimated. As a first approximation, andusing this sedimentation rate since emplacement ofthe MDA, we derive an age of 600 ± 150 ka for themass failure. We believe that this represents amaximum age, because of the likelihood for in-creased sediment supply during glacial periods, asnoted on the nearby east coast margin [Carter andMcCave, 2002; Collot et al., 2001; Lewis et al.,2004]. Furthermore, turbidites deposited in thereentrant could give erroneous sedimentation ratesusing the simple model presented above. As amatterof comparison, Orpin et al. [2006] give sedimenta-tion rates of 1mm/a in slope basins and 0.5 mm/a forthe Holocene, along the Hikurangi Margin, 120 kmsouth of East Cape, in a region with lower sedimentsupply than that of the Waiapu River. Such sedi-mentation rates would result in an age potentiallyas young as 120 ka for the emplacement of theMDA. This absolute minimum age of 120 kasuggests a possible synchronicity of occurrence ofthe MDA and the Ruatoria Avalanche, which ifverified would imply a relationship between thetriggering of both events, and have implications onthe immediate geomorphological response of themargin to two giant submarine mass failures.
[38] We have no further constraints on the age ofthe Matakaoa Debris Flow than that provided byCarter [2001], who based his estimate of 38–100 ka from a core collected in the RaukumaraBasin, 16 m above the top of the debris flow and a0.13 mm/a sedimentation rate derived from a corecollected on the continental slope.
[39] We assume a Pleistocene age for the Postava-lanche Sediment Wedge deposited within and onboth sides of the reentrant. In the reentrant, thesediments deposited over the MDA headwall lieunconformably on the weakly reflective unit, and
GeochemistryGeophysicsGeosystems G3G3
lamarche et al.: mass-transport deposits, new zealand 10.1029/2007GC001843
18 of 30
were therefore deposited after the emplacement ofthe MDA, i.e., since mid to upper Pleistocene.
[40] An unconstrained Pliocene age for the em-placement of the Raukumara Slump can be derivedfrom the 350- to 400-m-thick sedimentary sequenceobserved above the slump in the Raukumara Basin,using estimated Pleistocene sedimentation ratesranging from 0.1 to 0.7 mm/a [e.g., Carter, 2001;Collot et al., 2001], because geologically oldersedimentation rates are not known from the basin.Long piston cores acquired in January 2006 in theRaukumara Basin may help better constrain the ageof the slump [Proust et al., 2006].
8. Discussion
[41] Because the MSIC includes slumps, debrisavalanche and debris flows, it is best described asa submarine instability deposit complex. In order topropose a semiquantitative scenario of the modesof emplacement within the MSIC, we combineresults from the age model developed above withestimates of remobilized volumes, together withinterpretations of the geographical and stratigraphic
origins of each component of the deposit complex.This approach allows us to clarify the mechanismsof failure and transport processes involved duringdifferent phases of MSIC emplacement.
8.1. Origin and Transport of MSICDeposits
8.1.1. Raukumara Slump
[42] We interpret the imbricate structures in theRaukumara Basin as a frontally confined landsliderepresenting the distal part of the RaukumaraSlump, and the collapsed NW flank of the TokataAnticline as a portion of the proximal part of theslump.
[43] The imbricate structures clearly indicate com-pressional deformation and displacement of com-petent sediments on a single decollement. Themore chaotic and weakly reflective seismic faciesoverlying the imbricate structures (Figure 9) sug-gests material of different rheology and mechanicalbehavior. The gradual transition from the imbricatestructures to the chaotic seismic facies indicates acommon origin. The facies of the superficial layer
Figure 12. Multiproxy age model for the emplacement of the Matakaoa Debris Avalanche, including variations incarbonate content and d18O isotope in core #10. Tephra layers are identified as the Whakatane (Wh) and Waiohau(Wai) events at 70 and 226 cm, respectively. Ages of the volcanic events are indicated. All values of isotope analysisare relative to vPDB, where d13C and d18O have values of +1.95% and �2.20% for NBS19 calcite, respectively.Samples were analyzed using an individual-carbonate reaction (Kiel) device coupled with a Finnigan MAT252 massspectrometer. The transition from Marine Isotope Stage (MIS) 1 to 2 is interpreted at �220 m (thick dotted grey line),and a less likely alterative is interpreted at �100 cm.
GeochemistryGeophysicsGeosystems G3G3
lamarche et al.: mass-transport deposits, new zealand 10.1029/2007GC001843
19 of 30
possibly reflects the lower shear strength of poorlyconsolidated sediments, submitted to mass transport.
[44] Assuming that the toe of the slump is pinnedas a no-deformation point, unfolding by 30% theimbricate structures suggests that the deformedsediments could not originate from as far southas the present-day reentrant headwall, and that thematerial involved in the imbricate structures doesnot originate from the reentrant.
[45] The proximal part, which relates to the slumpdepletion zone, is difficult to identify for two mainreasons; first, because the MDA postdates theRaukumara Slump and therefore substantial partsof the scar and material have been eroded by theMDA (Figure 13, T3); and second, because foldingcontinued after deposition of the upper sedimentaryunit so that the present-day slope of the westernflank of the Tokata anticline is not necessarilyrepresentative of the geometry of the margin atthe time the emplacement of the slump, during thePliocene.
[46] However, we recognize the imbricate struc-tures as far south as Mat302 and a segment of therotational basal surface of the slump farther southon Mat111 (Figures 8 and 11). These structuressuggest that the slump scar and depletion zonewere located in the close vicinity of the Tokataanticline. Furthermore, the slump mass is inter-preted beneath the Raukumara Corridor as farsouth as Mat116 indicating that the slump mayhave originated from farther south than the Tokataanticline. The very narrow width (�12 km) of theslump in the Raukumara Corridor (Figure 11)contrasts with the �35 km width to the north,suggesting that the depletion zone was likely largerthan that interpreted in the southernmost part of theslump (Figure 13, T1).
[47] Hence we propose that the Raukumara Slumpinitiated within the northern half of the reentrant bythe failure and slip of the Raukumara Basin sedi-mentary sequence that propagated northward, thusforming the distal imbricate structures (Figure 13,T1). Because of the MDA, the depletion zone waspartially destroyed.
8.1.2. Matakaoa Debris Avalanche
[48] The MDA consists of two remobilized unitsemplaced synchronously: the weakly reflective unitand the blocky unit. Reconstruction of the geometryof the basal shear surface indicates it dips NWbeneath the eastern part of the reentrant (Figure 14),and connects southward and southeastward with the
avalanche headwalls. The nature of the basal shearsurface varies laterally. Within the reentrant, theshear surface lies conformably over the NW dippingstratigraphic sequence (Mat116, Figure 7), and istherefore interpreted as a decollement, whereas it isa truncation surface beneath the headwall. The shearsurface projects beneath the margin along the un-conformity between the upper to lower sedimentaryunits, suggesting this stratigraphic layer acted as aweakness plane along which the failure initiated andpropagated. This evidence, together with the occur-rence of back-tilted blocks in both the weaklyreflective and blocky units, suggest that the marginfailure process was that of a slump originating fromthe SE corner of the reentrant, and that the slumpformed a debris avalanche deposit. The wellmarked scarp in the southeast corner of the reen-trant (Figure 3) can therefore be interpreted as theorigin of the Matakaoa Ridge, which indicates thatthe ridge slid �15 km along the basal shear surface.
[49] The MDA remobilized material of differentrheologies, all originating from within the Mata-kaoa Margin. On the continental shelf, the de-formed sedimentary basement and the overlyingshelf basins have distinctive seismic characteristics[Lewis et al., 2004]. The sedimentary basement hasa well-stratified, high-amplitude seismic character,associated with Mio-Pliocene indurated sediments,whereas the shelf-basin reveals weaker reflectivityassociated with Quaternary sediments, probablywith higher porosity and water content. Theseseismic characters closely resemble those of theblocky and weakly reflective units. The relativegeographic positions of the two remobilized units,i.e., the weakly reflective unit upslope and theblocky unit downslope, corroborate our interpreta-tion that the blocky unit represents an originalbasement high on the edge of the continental shelf.Failure of the basement high along Ranfurly Bankreleased the Quaternary sediments trapped in ashelf basin, similar to the modern Waiapu or TeAroha basins (Figures 1 and 2), thus forming theweakly reflective unit.
[50] The tectonic activity associated with the Pacific-Australia convergent plate boundary is likely tohave played a major role in generating repetitiveslope instabilities in the region. Margins with sea-ward dipping strata, like the Matakaoa Margin,naturally offer weakness planes where dip-slipmay require less energy to initiate failure than thosewith landward dipping strata. Along the MatakaoaMargin, compressional tectonics further increasedthe seaward dip of the strata (7–10�, Figure 7)
GeochemistryGeophysicsGeosystems G3G3
lamarche et al.: mass-transport deposits, new zealand 10.1029/2007GC001843
20 of 30
compared with the average seafloor slope of 3–4�westward of the reentrant (Figure 4a). The combi-nation of high Quaternary uplift rates [Wilson et al.,2007b] and the inferred subsidence in the Rauku-
mara Basin, resulted in the continuous northwardtilting of the north dipping continental slope. There-fore uplift and compressional tectonics are consid-ered to be a major factor of slope instability in the
Figure 13. Sketches of the scenario for the implementation of the Matakaoa Submarine Instability Complex.Estimates of timing (see text) are T0, Mio-Pliocene; T1, Pliocene; T2, Plio-Pleistocene; T3, 600 ± 150 ka; and T4,100 � 38 ka. The maps on the right side show the extents of the MTDs immediately after emplacement. Straight linesare approximate locations of the cross-section sketches. Dashed lines indicate paleo extent. Dashed blue lines(ellipsoid) indicate the location of Tokata Anticline. The thick black line indicates extent of the Matakaoa Reentrant(MR). Thick vertical arrows suggest uplift and subsidence.
GeochemistryGeophysicsGeosystems G3G3
lamarche et al.: mass-transport deposits, new zealand 10.1029/2007GC001843
21 of 30
Figure 14
GeochemistryGeophysicsGeosystems G3G3
lamarche et al.: mass-transport deposits, new zealand 10.1029/2007GC001843
22 of 30
region, since at least the upper Miocene. Variationsin uplift rates may have also contributed to therecurrence of large slope instabilities.
[51] The compressional regional tectonic activityhas further consequences on the subsequent trans-port and deposition of the MDA. In particular, thedeformation associated with the Tokata Anticlinehas clearly impacted on the spatial arrangement ofthe MDA. The rafted blocks to the south and eastof the Tokata Anticline demonstrate that the anti-cline deflected the MDA during its emplacement,and resulted in the concentration of the largestblocks (i.e., the Matakaoa Ridge) in the proximalregion within the reentrant. It has been recognizedthat large rafted blocks often acquire the maximumkinetic energy and consequently travel farthest[Collot et al., 2001; Haflidason et al., 2005;Hampton et al., 1996]. In the MDA, the blocksstacked up against each others because they wererestrained from sliding further north by theTokata Anticline that acted as a natural dam.This stacking pattern necessarily required hightransport energy, and indicates that the blocksfailed catastrophically.
[52] In its most distal part, the MDA destabilizedthe recent sedimentary sequence of the RaukumaraBasin and formed a zone of compressional defor-mation in front of the blocky unit for approximately20 km. The minor thrusts resulted in small offsetsin the sedimentary sequence associated with lowseafloor reliefs, which indicates a small amount ofdisplacement over the planar basal shear surface.The relative preservation of the basin stratigraphyin the frontal deformation zone, conformably over-lying the Raukumara Basin sequence, together withpatches of continuous and high-amplitude reflec-tors argue against this zone being interpreted as adebris flow. The overlapping contact between theblocky unit and the frontal zone of deformation(CDP12500, Figure 9c), which have a commonsliding surface, suggests that the compressionresulted from stress transfer from the toe of theblocky unit to the basin sediments.
8.1.3. Matakaoa Debris Flow
[53] The MDF originated from the western part ofthe reentrant [Carter, 2001], and left a 1100-m-high scarp implying high potential energy of theoriginal failure. The 200 km runout distance of theMDF on very gentle slope gradient (<1� and downto 0.05� at deposition) suggests high mobility [DeBlasio et al., 2006]. Long runout distances aresuggestive of either high fluid content or a rela-tively low clay/sand ratio (0.2 to 0.3) [Ilstad et al.,2004], as both conditions result in low yieldstrength, which favors mobility and high speed ofthe flow [e.g., De Blasio et al., 2006; Marr et al.,2001].
[54] The flow shows evidence of powerful basaland lateral erosion. Basal erosion is particularlywell imaged within, and immediately north of, theRaukumara Corridor, where the flow truncates theunderlying sedimentary units (Figure 10). We sug-gest that the Raukumara Scarp formed by lateralerosion of MDA and basin sediments by the MDF.Powerful erosion is more likely to occur in asso-ciation with strongly coherent debris-flows [Marret al., 2001;Mohrig et al., 1999]. The debris flow’smaximum energy occurred at the base of thecontinental slope where the potential energywas converted into kinetic energy. The maximumenergy of the flow was possibly increased throughthe constriction of the debris flow in the Rauku-mara Corridor, thus accounting for more significanterosion in the proximal region of the flow.
[55] In the Raukumara Basin, the pear-shapeddistribution of the Raukumara Blocks in map view(Figures 3 and 11) suggests that they were remo-bilized from the western edge of the MDA in thereentrant and transported with the MDF during itsemplacement. This would have required substantialerosional energy from the debris flow duringtransport.
8.2. Volume Budget
[56] Sediment budgets require balancing volumesor masses of solid particles because the total
Figure 14. Reconstructed topography of the Matakaoa Margin. (a) Topography with all material above the basalshear surface of the MDA and MDF removed using an average velocity of 2000 m/s. Subtraction of both DTMs usingGIS software provides a volume of material removed of 1300 km3. TD, Tokata Dome (the morphological expressionof the Tokata Anticline); RC, Raukumara Corridor; RBk, Ranfurly Bank; RB, Raukumara Basin. (b) Interpretedmargin topography before failure of the Matakaoa Debris Avalanche and creation of the reentrant. The contour lineswere extended from either side of the indentation, assuming the Tokata Anticline was outcropping at the seafloor atthe time. Seismic lines are shown in light grey and give an indication of the constraints available for interpreting thepaleotopography.
GeochemistryGeophysicsGeosystems G3G3
lamarche et al.: mass-transport deposits, new zealand 10.1029/2007GC001843
23 of 30
volume of solids involved in a slope failure isconservative, rather than the bulk volumes thatinclude pore space and therefore are inherentlyvariable. Establishing a sediment budget is a pre-requisite to propose a scenario for the emplacementof any MTD. Here, we differentiate bulk andcompacted volumes, in a similar manner as Collotet al. [2001]. Bulk volumes correspond to theamount of displaced material observed today,whereas volume of solid are compacted to atheoretical zero-porosity. Because debris flow andmargin rocks have different porosities, we calcu-lated their compacted volumes of solid to performvalid comparisons between missing and redepos-ited volumes. This requires that we also calculatethe ‘‘empty’’ volumes of the reentrant to the equiv-alent volume of solid of prefailure margin sediments.This does not imply, however, that the porosity ofthe material prior to failure was zero. Rather, com-pacted volumes are independent of the margin agesand composition, and therefore enable more robustcomparisons of remobilized masses globally.
[57] The Raukumara Slump has an estimated totalbulk volume of 1400 ± 360 km3 (Table 3). Becausepart of the Raukumara Slump deposited in thereentrant has most likely been remobilized bysubsequent events, in particular during the deposi-tion of the MDA, our volume estimate is under-estimated.
[58] The MDA has a total bulk volume of 430 ±100 km3, subdivided into 260 ± 50 km3 for theblocky unit and 170 ± 50 km3 for the weaklyreflective unit (Table 3). The frontal zone of defor-mation represents an estimated 120 ± 25 km3 ofmaterial. Presently, the NW boundary of the MDAcorresponds with the Raukumara Scarp. As thescarp resulted from lateral erosion, the original areacovered by the MDAwas larger than that observedtoday. We estimate the original extent of theMDA immediately after failure, from an ‘‘ideal’’symmetrical lobate shape including detached blocksaccumulated at the base of the Raukumara Scarp(Tables 2 and 4, Figures 11 and 13).
[59] A bulk volume of 1250 ± 250 km3 was calcu-lated for the Matakaoa Debris Flow using an aver-age thickness of 130 m and a total area of 9620 km2.Because the debris flow is superficial and showsno evidence of erosion subsequent to its emplace-ment, we believe its present-day extent is compara-ble to its original (Table 2) and that the uncertaintyon the area is 10%. However, the volume of materialthat originally failed from the margin is likely to beoverestimated as the debris flow shows widespread
evidence of extra material being incorporated to themass through basal and lateral erosion during em-placement. We calculated the amount of materialpotentially added to the MDF volume throughaccretion by estimating the thickness of materialeroded from the upper Raukumara Basin sedimen-tary sequence at the base of the flow, and thedifference between the present-day and the paleoextents of the zone of frontal deformation as esti-mated from an assumed ideal lobate shape (Table 4).This suggests that approximately 30% of the bulkvolume of the debris flow could have been added byaccretion. Despite being one of largest debris flowworldwide, the very long run out distance of theMDF results in a low Skempton ratio [Skempton andHutchinson, 1969] (HD/R, where HD is total heightand R is runout distance) of �0.01 (Table 2), andwhen positioned on a HD/R versus volume diagramthe MDF compares well with other slides and debrisflows globally for submarine mass movements(Figure 15) [Hampton et al., 1996; Canals et al.,2004].
[60] A volume of 1300 ± 260 km3, similar to thatestimated by Carter [2001], is calculated for thereentrant, representing the amount of material be-tween the reconstructed topography of the marginprior to failure and the MDA basal shear surface(Figure 14).
[61] We use the porosity values given by Collot etal. [2001] to calculate the volumes of solid of eachcomponent of the MSIC (Table 3). This is justifiedbecause the Matakaoa Margin is only 40 km NWofthe Ruatoria Avalanche head-scarp and has remo-bilized similar geological material from the conti-nental margin. The compacted volume of theRaukumara Slump is estimated to be 1150 ±340 km3. For the MDA, the compacted volumesare 210 ± 60 km3 for the blocky unit and 70 ±20 km3 for the weakly reflective unit. We furtherestimate a 500 ± 150 km3 volume of solid for theMDF. Following on the previous section, webelieve that up to 30% of the compacted volumeof the MDF could have been added to the originalfailed mass, through basal scouring and lateralerosion (Table 4). Hence, the compacted volumeof material failed from the continental slope duringemplacement of the MDF could be as low as350 km3, whereas the solid volume of the emptyreentrant (i.e., the volume occupied by the MTDsbefore failure) is estimated to be 1100 ± 330 km3.While the bulk volume of the MDF is of similarmagnitude to that of the reentrant, we believe thefailure of the MDF alone cannot have produced the
GeochemistryGeophysicsGeosystems G3G3
lamarche et al.: mass-transport deposits, new zealand 10.1029/2007GC001843
24 of 30
reentrant since their compacted volumes are signif-icantly different.
[62] We do not include the volumes of the frontalzone of deformation and Raukumara Slump in thecomparison with the empty volume of the reentrantas the former represents material of the RaukumaraBasin, and the part of the latter that originatesfrom the reentrant is unknown. We note howeverthat a subdued reentrant may have remained follow-ing the failure of the Raukumara Slump as suggestedby the reconstruction of the margin topography priorto the failure of the MDA (Figure 14). Together,the weakly reflective and blocky units of theMDA and the MDF represent a bulk volume of1680 ± 350 km3 and a compacted volume of 780 ±260 km3 (Table 3). The cumulative bulk volume of
remobilized material originating from the reentrant(1680 km3) is therefore markedly larger than thebulk volume of the reentrant (1300 km3), while thecompacted volume (630 km3) ismarkedly smaller thanthat of the reentrant (1100 km3). It is unlikely that theblocky and weakly reflective units of the MDA alonerepresent the entire content of the reentrant, since theircompacted volume (280 km3) is conclusively smallerthan the volume of the reentrant (1100 km3). Post-failure processes of retrogressive erosion associatedwith the activity of slope-confined canyons musthave played an important part in the excavation ofthe reentrant [Joanne, 2008]. We also believe that thediscrepancy between the compacted volumes ofthe reentrant and that of MDF+MDA confirms thatan indentation was created in the margin by the
Table 3. Volumes Calculated for the Matakaoa Submarine Instability Complex and the Matakaoa Reentranta
aVelocities (Vel.) are P wave velocities used for time-to-depth conversions in the estimation of maximum (Max) and average (Av.) thickness of
remobilized masses. Bulk Vol. is present-day bulk volume of the remobilized masses without compaction of material. Method is that used tocalculate the bulk volumes: (1) Subtraction of upper and lower reconstructed surfaces from Digital Terrain Models (DTMs) generated frominterpretation of seismic profiles and multibeam bathymetry (Figure 14). (2) Remobilized mass is divided in polygons of regular thickness; volumecalculated as the sum of individual polygon volumes. (3) Product of the average thickness of remobilized masses by paleo extents (Table 2). Weused the estimated extent of the remobilized masses at the time of implementation, i.e., before any subsequent erosion occurs. Por. is estimatedporosity used to calculate the compacted volumes of solid [from Collot et al., 2001]. Compacted Vol. are calculated as Bulk Volume*(100-Porosity)/100. The ‘‘empty volume’’ of the reentrant is also compacted to an equivalent volume of solid of margin material for valid volume budget. SeeFigure 4c for explanation of h and hmax. A/V2/3 is used to estimate the flow efficiency of slides [Dade and Huppert, 1998; Haflidason et al., 2005].A minimum error of 20% in the volume calculations is estimated as the sum of uncertainties of velocities (10%) and seismic interpretation errors(10%). A 30% error is estimated for the compacted volume. Abbreviations spelled out in Table 1.
Table 4. Estimate of Material Added to Matakaoa Debris Flow During Emplacement Through Basal Scouring andLateral Erosiona
aExtent of Raukumara blocks is the cumulated area of individual blocks (Figure 2). We use the same method as in Table 3 to calculate the
compacted volumes of solid. The ratios of the eroded volumes over that of the MDF are given in the last two columns. A total of up to 30% of thecompacted volume of the MDF (Table 3) may have been added during emplacement.
GeochemistryGeophysicsGeosystems G3G3
lamarche et al.: mass-transport deposits, new zealand 10.1029/2007GC001843
25 of 30
Raukumara Slump and had not been completelyfilled before the failing of the MDA.
8.3. Sediment Loading From the WaiapuRiver as Factor of Slope Instability
[63] One of the most remarkable characteristics ofthe sedimentary environment of the East Caperegion is the very high supply delivered from thelocal rivers. It is therefore important to evaluate thesignificance of this high sedimentation supply onthe recurrence of large mass failures, which includethe Ruatoria avalanche and MSIC, to the east andnorth of East Cape, respectively. The Waiapu Riveralone discharges an average of 36 106 t of sedimentper year on the continental shelf and slope. TheMotu River, on the west coast of the RaukumaraPeninsula delivers an estimated 3.5 106 t of sedi-ment per year on the continental shelf [Hicks andShankar, 2003]. Currents offshore and inshore ofthe 1000 m isobath flow in opposite directions[Carter, 2001; Carter and McCave, 2002; Chiswelland Roemmich, 1998] so that both rivers couldcontribute to sediment accumulation over the Mat-akaoa Margin. These values are all postdeforesta-tion subsequent to human settlement in NewZealand and therefore largely exceed the averagesediment discharge for the Holocene. Orpin et al.[2006] estimate that the total sediment budget for
the Holocene in the Poverty Bay region, �120 kmsouth of East Cape, is �1 106 t/a, and Lewis et al.[2004] mapped thick accumulation of post–lastglacial sediments in the Waiapu shelf basin (Figure1). At the shelf break, slumping and hyperpycnaldeposition of river sediments attest to the highinstability of the recent sediment [Lewis et al.,2004]. Hyperpycnal flows are guided by subtleshelf relief into the Matakaoa Channel to the northand similar well defined channels on the HikurangiMargin to the east, thus transporting sediments intobasins that are forming behind blocks of theMatakaoa and Ruatoria avalanches. We infer thatthe Waiapu River contributes to the source regionsof both Matakaoa and Ruatoria avalanche com-plexes during highstands, but the MSIC may be thepreferred depocenter during lowstands judging bythe presence of a canyon head that incises theheadwall scarp (Figures 2 and 3). However, becausethere is no published sedimentation rate for thePleistocene, we used a constant Holocene sedimen-tation rate to estimate the age of the MDA, whichresults in a large uncertainty and prevents fromrelating the MDA event to the eustatic cycles. Thehigh supply of sediment from local rivers maycontribute to healing mass-failure scars by rapidlyreconstructing the margin sedimentary architecture,thus preparing for the next major failure. Furthermass balance relating river inputs to prefailuresediment volumes may help constrain the minimumrecurrence of large failures.
8.4. Scenario of MSIC Emplacement
[64] The spatial organization of the four remobilizedmasses that constitute the MSIC, together with theage model developed in this study are used topropose a relative chronology of the events and ascenario of the modes of implementation of theMSIC in five stages T0 to T4 (Figure 13, T0 to T4).
[65] T0 (Mio-Pliocene), is a period of continentalslope and basin sedimentation across the MatakaoaMargin and in the Raukumara Basin which pre-ceded the emplacement of the Raukumara Slump.The region was under a compressional tectonicregime which resulted in the folding and faultingof the sedimentary sequence beneath the continen-tal slope, but the Tokata Anticline remained asubdued structural and topographic feature at thisstage. The continental slope was located up to30 km north of the present reentrant headwalland its toe corresponded to the northern flank ofthe Tokata Anticline.
Figure 15. Skempton ratio (total drop (HD) overrunout distance (R)) as a function of volume for theMatakaoa Debris Flow (MDF) superimposed on aglobal data set for large MTDs from Canals et al.[2004] and upper bound for submarine landslides (blackline) from Hampton et al. [1996]. See Figure 4d forexplanation of HD and R.
GeochemistryGeophysicsGeosystems G3G3
lamarche et al.: mass-transport deposits, new zealand 10.1029/2007GC001843
26 of 30
[66] At T1 (Pliocene), the failure of the upper partof the continental slope as the Raukumara Slump,was likely related to tectonic activity as indicatedby the then growing Tokata anticline and thefailure of its north-western flank. The RaukumaraSlump remobilized material for > than 50 km intothe Raukumara Basin and terminated against theotherwise gentle basin sedimentary sequence as afrontally confined landslide.
[67] T2 (Plio-Pleistocene), corresponds to a periodof hemipelagic and turbiditic sedimentation in theRaukumara Basin and over the continental slope.Sedimentation on the continental slope partlyhealed the scarp formed during the emplacementof the Raukumara Slump. Continuing regionalcompressional deformation resulted in furtherfaulting and tilting of sedimentary basement blockson the continental shelf and in the growth of theTokata Anticline as a prominent morphologicalfeature. The combined effect of uplift of theRaukumara Peninsula and Ranfurly Bank andsubsidence in the Raukumara Basin resulted in acontinuous increase of the north-westward dip ofthe continental slope. High terrestrial sedimenta-tion generated from high onland erosion filled shelfand slope basins.
[68] At T3 (600 ± 150 ka) the emplacement of theMatakaoa Debris Avalanche followed the collapseof a kilometer-wide Mio-Pliocene sedimentarybasement block at the edge of the continentalshelf as a large slump that also released the Plio-Pleistocene sediment infills of the shelf basins. Theindurated Mio-Pliocene sediments were trans-ported as a series of blocks that piled up againstthe buttress formed by the outcropping TokataAnticline. The younger, less compacted shelf-basinsediments filled the depression left by the slumpedmaterial. The distal part of the MDAwas deflectednorthward around the Tokata Anticline, and desta-bilized the superficial sediments of the RaukumaraBasin deposited over the northern flank of theanticline over a distance of �20 km.
[69] At T4 (100-38 ka), the sediment accumulatedin the western part of the reentrant during thePleistocene failed and formed the Matakaoa DebrisFlow (MDF). The Raukumara Corridor guided theMDF toward the Raukumara Basin, and during itsemplacement the MDF eroded part of the MDA toform the Raukumara Scarp.
[70] Continued sedimentation from high-yield riv-ers since deposition of the MDF contributed to thegradual healing of the reentrant, but also led to the
delivery of unstable material that has built intothe continental slope. Today, a turbidite plain isdeveloping in the eastern part of the reentrant and achannel is forming as a result of continuous sedi-mentary delivery from the local rivers of theRaukumara Peninsula [Joanne, 2008].
9. Conclusion
[71] The Matakaoa Submarine Instability Complex(MSIC) is a system of four MTDs (Mass TransportDeposits) with a total bulk volume of 3200 km3.The MTDs were emplaced during three failureevents: (1) the Raukumara Slump; (2) the MatakaoaDebris Avalanche (MDA); and (3) the MatakaoaDebris Flow (MDF), all occurring along the Mata-kaoa Margin, approximately 50–70 km west ofthe northern Hikurangi-southern Kermadec subduc-tion margin, NE New Zealand. The successive fail-ures resulted in the formation of the 45-km-wide,1100-m-high Matakaoa Reentrant which conspicu-ously cuts the continental slope north of the Rauku-mara Peninsula. A volume budget shows theimportance of using compacted volumes of solidrather than bulk volumes when comparing events ofvarious origins, ages and natures globally. Com-pacted volumes indicate that the three componentsof the MSIC contributed to the formation of thereentrant, and that the reentrant was not completelyhealed before the subsequent mass failure.
[72] The occurrence of the Raukumara Slump isroughly dated during the Pliocene. The slumpformed as the result of the collapse of the northernpart of the margin. The distal part of the slumpextends at least 50 km into the Raukumara Basin andforms a series of imbricate structures that deformedbasin sediments into a locally confined landslide. Asmost of the proximal structures of the RaukumaraSlump was eroded by subsequent events, the1150 km3 compacted volume is underestimated.
[73] The Matakaoa Debris Avalanche (MDA) wasemplaced 600 ± 150 ka ago. It consists of blockyand weakly reflective seismic units with a com-pacted volume of 280 km3 that infill the eastern halfof the reentrant. The avalanche overlies a flatdecollement characterized by a distinctive high-amplitude, negative-polarity seismic reflector whichtruncates the underlying sedimentary units, whereasrotational geometries and overlying back-tiltedblocks indicate a mechanism of slump failure.During emplacement, the indurated Mio-Pliocenesedimentary basement blocks, piled up against theTokata Anticline outcropping in the sliding path,
GeochemistryGeophysicsGeosystems G3G3
lamarche et al.: mass-transport deposits, new zealand 10.1029/2007GC001843
27 of 30
and resulted in the blocks thrusting onto each other.The MDA partly ran over or around the anticlineand extended northward into the Raukumara Basin.Weakly developed deformation in front of thedebris avalanche suggests that deformation propa-gated over the decollement for �20 km into thesediments of the Raukumara Basin, but resulted ina very small amount of translational movement.
[74] The Matakaoa Debris Flow (MDF) occurredbetween 38 and 100 ka. It extends 200 km from thehead scarp of the Matakaoa Margin and is charac-terized by a chaotic, low-amplitude seismic facies,covering an area of 9600 km2 essentially in theRaukumara Basin. The 500 km3 compacted volumeof the MDF includes up to 30% of the transportedmaterial that was accreted during emplacementthrough basal and lateral erosion. The emplacementof the MDF was associated with intense basalerosion in its proximal part.
[75] The emplacement of the MSIC was controlledby compressional tectonic and sedimentary pro-cesses associated with (1) shortening and intenseseismic activity along the Pacific-Australia plateboundary, (2) uplift of the Raukumara Peninsula,(3) subsidence in the Raukumara Basin, and (4) veryhigh sedimentation rates on the shelf and slope.These factors enabled the generation of successivelarge, potentially catastrophic submarine landslidesover the last 5 Ma. Such mass-failure events wereassociated with high-energy emplacement in afore-arc basin, and occurred in a tectonically activeenvironment.
Acknowledgments
[76] We are thankful for the professional attitude and dedi-
cation of the crew and officers of R/V Tangaroa during the
three 2001, 2003, and 2004 surveys. Phil Shane (University of
Auckland) identified the age of the sampled tephra. Helen Neil
(NIWA) undertook work on stable isotope curves, using
NIWA Keil III facilities. Lisa Northcote (NIWA) sorted
foraminifera for the d18O isotope study and undertook carbon-
ate content and granulometry analyses. MCS data were pro-
cessed using Globe Claritas1
, a software of the Institute of
Geological and Nuclear Sciences (Lower Hutt, NZ). Miles
Dunkin, Andrew Goh, and Arne Pallentin (NIWA) helped with
figures and GIS databases. Lionel Carter and Alan Orpin
(NIWA) and Sebastien Migeon (Geosciences Azur) contributed
to this work through insightful discussions. Homa Lee and
David Piper provided extremely valuable reviews of an initial
version of this manuscript, and Scott Nodder undertook an
internal review of the final manuscript. This project was
funded by the NZ Foundation for Research Science and
Technology (FRST, contract CO1X0203). This is a contribu-
tion of the French Groupement de Recherche (GDR)
‘‘Marges’’ and of the Unite Mixte de Recherche (UMR)
Geosciences Azur (6526).
References
Addington, L. D., S. A. Kuehl, and J. E. McNinch (2007),Contrasting modes of shelf sediment dispersal off a high-yield river: Waiapu River, New Zealand, Mar. Geol.,243(1–4), 18–30, doi:10.1016/j.margeo.2007.04.018.
Canals, M., et al. (2004), Slope failure dynamics and impactsfrom seafloor and shallow sub-seafloor geophysical data:Case studies from the COSTA project, Mar. Geol., 213,9–72, doi:10.1016/j.margeo.2004.10.001.
Carter, L. (2001), A large submarine debris flow in the path ofthe Pacific deep western boundary current off New Zealand,Geo Mar. Lett., 21, 42–50.
Carter, L., and I. N. McCave (2002), Eastern New Zealanddrifts: Miocene to recent, in Deep-Water Contourites: Mod-ern Drifts and Ancient Series, Seismic and SedimentaryCharacteristics, Geol. Soc. Mem., vol. 22, edited by D. A.V. Stow et al., pp. 101–103, Geol. Soc., London.
Chiswell, S. M., and D. Roemmich (1998), The East Capecurrent and two eddies: A mechanism for larval retention?,N. Z. J. Mar. Freshwater Res., 32(3), 385–397.
Cochran, U. A., et al. (2006), Paleoecological insights intosubduction zone earthquake occurrence, eastern North Is-land, New Zealand, Geol. Soc. Am. Bull., 118(9/10),1051–1074, doi:10.1130/B55761.1.
Coleman, J. M., and D. B. Prior (1988), Mass wasting oncontinental margins, Annu. Rev. Earth Planet. Sci., 16,101–119.
Collot, J.-Y., and B. W. Davy (1998), Forearc structures andtectonics regimes at the oblique subduction zone between theHikurangi Plateau and the southern Kermadec margin,J. Geophys. Res., 103(B1), 623–650.
Collot, J.-Y., et al. (1996), From oblique subduction to intra-continental transpression: Structures of the southernKermadec-Hikurangi margin from multibeam bathymetry, side scansonar and seismic reflection, Mar. Geophys. Res., 18, 357–381.
Collot, J.-Y., K. B. Lewis, G. Lamarche, and S. Lallemand(2001), The giant Ruatoria debris avalanche on the NorthernHikurangi Margin, New Zealand: Result of oblique sea-mount subduction, J. Geophys. Res., 106(B9), 19,271–19,297.
Dade, W. B., and H. E. Huppert (1998), Long-runout rockfalls,Geology, 26(9), 803–806.
Davey, F. J., S. Henrys, and E. Lodolo (1997), A seismiccrustal section across the East Cape convergent margin,New Zealand, Tectonophysics, 269(3–4), 199–215.
Davy, B. W. (1992), The influence of subducting plate buoyancyon subduction of the Hikurangi-Chatham Plateau beneathNorth Island, New Zealand, in Geology and Geophysics ofContinental Margins, edited by J. S. Watkins, F. Zhiqiang,and K. J. McMillen, AAPG Mem., 53, 75–91.
De Blasio, F. V., A. Elverhøi, L. E. Engvik, D. Issler, P. Gauer,and C. Harbitz (2006), Understanding the high mobility ofsubaqueous debris flows, Nor. Geol. Tidsskr., 86(3), 275–284.
De Mets, C., R. G. Gordon, D. F. Argus, and S. Stein (1994),Effect of recent revisions to the geomagnetic reversal timescale on estimates of current plate motions, Geophys. Res.Lett., 21(20), 2191–2194.
GeochemistryGeophysicsGeosystems G3G3
lamarche et al.: mass-transport deposits, new zealand 10.1029/2007GC001843
28 of 30
Felix, M., and J. Peakall (2006), Transformation of debrisflows into turbidity currents: Mechanisms inferred from la-boratory experiments, Sedimentology, 53(1), 107–123.
Field, B. D., et al. (1997), Cretaceous-Cenozoic geology andpetroleum systems of the East Coast region, New Zealand,301 pp., Inst. of Geol. and Nucl. Sci., Lower Hutt, NewZealand.
Frey-Martinez, J., J. A. Cartwright, and D. James (2006), Fron-tally confined versus frontally emergent submarine land-slides: A 3D seismic characterisation, Mar. Pet. Geol., 23,585–604, doi:10.1016/j.marpetgeo.2006.04.002.
Gibb, J. G. (1981), Coastal hazard mapping as a planningtechnique for Waiapu County, East Coast, North Island,New Zealand, Water Soil Tech. Publ., 21, p. 63, Natl. Waterand Soil Conserv. Organ., Wellington, New Zealand.
Gillies, P. N., and F. J. Davey (1986), Seismic reflectionand refraction studies of the Raukumara forearc basin,New Zealand, N. Z. J. Geol. Geophys., 29, 391–403.
Haflidason, H., R. Lien, H. P. Sejrup, C. F. Forsberg, andP. Bryn (2005), The dating and morphometry of the Stor-egga Slide, Mar. Pet. Geol., 22, 123–136, doi:10.1016/j.marpetgeo.2004.10.008.
Hampton, M. A., H. J. Lee, and J. Locat (1996), Submarinelandslides, Rev. Geophys., 34(1), 33–60.
Hicks, D. M., and U. Shankar (2003), Sediment yield fromNew Zealand rivers, NIWA chart, Misc. Ser. 79, Natl. Waterand Soil Conserv. Organ., Wellington, New Zealand.
Ilstad, T., A. Elverhøi, D. Issler, and J. G. Marr (2004), Sub-aqueous debris flow behavior and its dependence on thesand/clay ratio: A laboratory study using particle tracking,Mar. Geol., 213(1–4), 415–438.
Jenner, K. A., D. J. W. Piper, D. C. Campbell, and D. C.Mosher (2007), Lithofacies and origin of late Quaternarymass transport deposits in submarine canyons, central Sco-tian Slope, Canada, Sedimentology, 54(1), 19 – 38,doi:10.1111/j.1365-3091.2006.00819.x.
Joanne, C. (2008), Le complexe d’instabilities sous-marines deMatakaoa, au large d’East Cape, Nouvelle-Zelande. Proces-sus de transport en masse et impact des mega-instabilites surl’architecture de l’evolution de la marge continentale, Ph.D.thesis, Univ. of Nice-Sophia Antipolis, Nice, France.
Kohn, B. P., and G. P. Glasby (1978), Tephra distribution andsedimentation rates in the Bay of Plenty, New Zealand, N. Z.J. Geol. Geophys., 21, 49–70.
Lewis, K. B., and B. A. Marshall (1996), Seep faunas andother indicators of methane-rich dewatering on New Zealandconvergent margins, N. Z. J. Geol. Geophys., 39, 181–200.
Lewis, K. B., S. Lallemand, and L. Carter (2004), Collapse in aQuaternary shelf basin off East Cape, New Zealand: Evi-dence for passage of a subducted seamount inboard of theRuatoria giant avalanche, N. Z. J. Geol. Geophys., 47(3),415–429.
Lowe, D. J., P. R. Shane, B. V. Alloway, and R. M. Newnham(2008), Fingerprints and age models for widespread NewZealand tephra marker beds erupted since 30,000 yearsago: A framework for NZ-INTIMATE, Quat. Sci. Rev., 27,95–126, doi:10.1016/j.quascirev.2007.01.013.
Marr, J. G., G. Shanmugam, and G. Parker (2001), Experi-ments on subaqueous sandy gravity flows: The role of clayand water content in flow dynamics and depositional struc-tures, Geol. Soc. Am. Bull., 113(11), 1377–1386.
Maslin, M., N. Mikkelsen, C. Vilela, and B. Haq (1998), Sea-level- and gas-hydrate-controlled catastrophic sediment fail-ures of the Amazon Fan, Geology, 26(12), 1107–1110.
Masson, D. G., M. Canals, B. Alonso, R. Urgeles, andV. Huhnerbach (1998), The Canary Debris Flow: Source
area morphology and failure mechanisms, Sedimentology,45(2), 411–432.
Masson, D. G., A. B. Watts, M. J. R. Gee, R. Urgeles, N. C.Mitchell, T. P. Le Bas, and M. Canals (2002), Slope failureson the flanks of the western Canary Islands, Earth Sci. Rev.,57, 1–35.
Mazengarb, C., and I. G. Speden (2000), Geology of the Rau-kumara Area, Geol. Map 6, scale 1:250,000, 1 sheet + 60pp., Inst. of Geol. and Nucl. Sci. Ltd., Lower Hutt, NewZealand.
McAdoo, B. G., L. F. Pratson, and D. L. Orange (2000), Sub-marine landslide geomorphology, US continental slope, Mar.Geol., 169, 103–136.
McHugh, C. M. G., J. E. Damuth, and G. S. Mountain (2002),Cenozoic mass-transport facies and their correlation withrelative sea-level change, New Jersey continental margin,Mar. Geol., 184(3–4), 295–334.
Mohrig, D., and J. G. Marr (2003), Constraining the efficiencyof turbidity current generation from submarine debris flowsand slides using laboratory experiments, Mar. Pet. Geol.,20(6–8), 883–899, doi:10.1016/j.marpetgeo.2003.03.002.
Mohrig, D., A. Elverhøi, and G. Parker (1999), Experimentson the relative mobility of muddy subaqueous and subaerialdebris flows, and their capacity to remobilize antecedentdeposits, Mar. Geol., 154(1–4), 117–129.
Moore, J. G., D. A. Clague, R. T. Holcomb, P. W. Lipman,W. R. Normark, and M. E. Torresan (1989), Prodigious sub-marine landslides on the Hawaiian Ridge, J. Geophys. Res.,94(B12), 17,465–17,484.
Moore, J. G., W. R. Normark, and R. T. Holcomb (1994),Giant Hawaiian underwater landslides, Science, 264, 46–47.
Moscardelli, L., L. Wood, and P. Mann (2006), Mass-transportcomplexes and associated processes in the offshore area ofTrinidad and Venezuela, AAPG Bull., 90(7), 1059–1088,doi:10.1306/02210605052.
Mulder, T., and P. Cochonat (1996), Classification of offshoremass movements, J. Sediment. Res., Sect. A, 66(1), 43–57.
Nardin, T. R., F. J. Hein, D. S. Gorsline, and B. D. Edwards(1979), A review of mass movements processes, sedimentand acoustic characteristics, and contrasts in slope and base-of-slope systems versus canyon-fan-basin floor system, inGeology of Continental Slopes, edited by L. J. Doyle andO. H. Pilkey Jr., Spec. Publ. Soc. Econ. Paleontol. Mineral.,27, 67–73.
Orpin, A. R. (2004), Holocene sediment deposition on thePoverty-slope margin by the muddy Waipaoa River, EastCoast New Zealand, Mar. Geol., 209, 69–90, doi:10.1016/j.margeo.2004.06.001.
Orpin, A. R., C. Alexander, L. Carter, S. Kuehl, and J. P. Walsh(2006), Temporal and spatial complexity in post-glacial se-dimentation on the tectonically active, Poverty Bay continen-tal margin of New Zealand, Cont. Shelf Res., 26, 2205–2224, doi:10.1016/j.csr.2006.07.029.
Piper, D. J. W., and C. McCall (2003), A synthesis of thedistribution of submarine mass movements on the easternCanadian margin, in Submarine Mass Movements andTheir Consequences, 1st International Symposium, editedby J. Locat and J. Mienert, pp. 291–298, Kluwer Acad.,New York.
Piper, D. J. W., C. Pirmez, P. L. Manley, D. Long, R. D. Flood,W. R. Normark, and W. Showers (1997), Mass transportdeposits of the Amazon fan, Proc. Ocean Drill. ProgramSci. Results, 155, 109–146.
Piper, D. J. W., P. Cochonat, and M. L. Morrison (1999), Thesequence of events around the epicentre of the 1929 GrandBanks earthquake: Initiation of debris flows and turbidity
GeochemistryGeophysicsGeosystems G3G3
lamarche et al.: mass-transport deposits, new zealand 10.1029/2007GC001843
29 of 30
current inferred from sidescan sonar, Sedimentology, 46(1),79–97.
Prior, D. B., B. D. Bornhold, and M. W. Johns (1984), Deposi-tional characteristics of submarine debris flow, J. Geol., 92,707–727.
Proust, J.-N., G. Lamarche, S. Migeon, and H. Neil (2006),Campagne GEOSCIENCES: MD152 (24 January –7 February 2006) on R/V Marion-Dufresne, ‘‘Tectonic andclimatic controls on sediment budget,’’ Cruise Report, 108pp., Inst. Paul Emile Victor, Brest, France.
Reyners, M. (1998), Plate coupling and the hazard of largesubduction thrust earthquakes at the Hikurangi subductionzone, New Zealand, N. Z. J. Geol. Geophys., 41, 343–354.
Reyners, M., and P. McGinty (1999), Shallow subduction tec-tonics in the Raukumara Peninsula, New Zealand, as illumi-nated by earthquake focal mechanisms, J. Geophys. Res.,104(B2), 3025–3034.
Schwartz, H.-U. (1982), Subaqueous slope failures—Experimentand modern occurrences, in Contributions to N. 242 of theJoint Programme 95 Interaction Sea-Sea Bottom, Kiel Univ.,Germany, edited by H. Fuchtbauer et al., pp. 1–103, KielUniv., Kiel, Germany.
Skempton, A. W., and J. N. Hutchinson (1969), Stability ofnatural slope and embankment foundations, state of the artreport, in 7th International Conference on Soil Mechanics andFoundation Engineering, Proceedings, Mexico City, vol. 2,pp. 291–335, Soc. Mex. de Mec. de Suelos, Mexico City.
Wilson, K., K. Berryman, U. Cochran, and T. Little (2007a),Holocene coastal evolution and uplift mechanisms of the north-eastern Raukumara Peninsula, North Island, New Zealand,Quat. Sci. Rev., 26(7–8), 1106–1128.
Wilson, K. J., K. R. Berryman, N. J. Litchfield, and T. A. Little(2007b), Distribution, age and uplift patterns of Pleistocenemarine terraces of the northern Raukumara Peninsula, NorthIsland, New Zealand, N. Z. J. Geol. Geophys., 50(3), 181–191.
Wood, R., and B. Davy (1994), The Hikurangi Plateau, Mar.Geol., 118, 153–173.
Wright, I. C. (1994), Nature and tectonic setting of the south-ern Kermadec submarine arc volcanoes: An overview, Mar.Geol., 118, 217–236.
GeochemistryGeophysicsGeosystems G3G3
lamarche et al.: mass-transport deposits, new zealand 10.1029/2007GC001843