Geochemistry of Major and Trace Elements in Sediments of the Ria de Vigo (NW Spain): an Assessment of Metal Pollution q B. RUBIO*, M. A. NOMBELA and F. VILAS Departamento Geociencias Marinas y Ordenaci on del Territorio, Facultad de Ciencias, Universidad de Vigo, 36200 Vigo (Pontevedra), Spain Ria de Vigo is a funnel-shaped, fault-bounded coastal embayment in Galicia, NW Spain. There are a number of important centres of population and industrial activity along its margins, which serve as sources of pollution. Sixty-six subtidal sediment samples have been collected in the Ria. The samples have been subjected to a total di- gestion technique and analysed for major and trace ele- ments (Al, Fe,Ti, Mn, Cu, Pb, Cr, Zn, Co, As, Ni, Cd and Sr). Variations of absolute metal concentrations reflected variations in textural and/or carbonate and organic mat- ter content. Geoaccumulation indexes and enrichment factors have been calculated to assess whether the con- centrations observed represent background or contami- nated levels. It is proved that the choice of the background plays an important role in the interpretation of the geo- chemical data. PCA was a very useful tool to define background values for metals in the Ria de Vigo area. These values were similar to regional values given by other authors. It is concluded that the Ria is slightly to mod- erately polluted for some of the studied metals. The spatial extent of pollution was examined, and it was found that the most polluted area is located in the inner and southern parts of the Ria. Ó 2000 Elsevier Science Ltd. All rights reserved. Keywords: heavy metals; Ria de Vigo; pollution; subtidal sediments; normalization; principal component analysis. Introduction In Galicia, 40% of the population live in or near Rias, and the principal industrialized areas are also located nearby, thus leading to a high risk of contamination. The city of Vigo is the biggest human settlement in Galicia (287000 inhabitants, INE, Padron, 1996) and also one of the most important harbours. The Rias of north-west Spain are coastal ecosystems of high bio- logical productivity and great economic importance. They are intensively exploited by man for fish and shellfish. Mariculture represents the most significant human impact in the past 20 years or so and has un- doubtedly changed the nature of sedimentation in some parts of the Rias (Nombela et al., 1995). Filter feeding mussels have led to a dramatic increase in biological production of sediment, changes to sediment type and increased sedimentation rates. Over the last 5–7 years, construction of hotels, urban and recreation areas has also produced changes to coastal sedimentary processes. However, the industrial waste reaching the sea through atmospheric precipitation and dumping of urban and rural waste is mostly responsible for the input of trace metals into the marine environment which are subse- quently incorporated into the sediments. In recent years, increasing interest has been shown in the level of heavy metals in sediments of the Galician Rias (Barreiro et al., 1988; Carral et al., 1992, 1995; Carballeira et al., 1997). Most of these papers have only concerned intertidal sediments, probably due to the simplicity of collecting the samples. Although in some of these studies (e.g., Carballeira et al., 1997), sampling distribution was extensive and appropriate for tidal flats and intertidal areas, there is a scarcity of data for subtidal areas. The main objectives of the study reported here were: 1. To determine the total content of heavy metals in surface sediments of the Ria de Vigo, and to pro- duce geochemical maps for the Ria, based on an appropiate sampling density (1 km 2 ), that can be used by other disciplines. 2. To evaluate the sedimentological and geochemical factors that control the distribution pattern of ma- jor and trace elements. 3. To estimate the anthropogenic input and to assess the pollution status on the area. Marine Pollution Bulletin Vol. 40, No. 11, pp. 968–980, 2000 Ó 2000 Elsevier Science Ltd. All rights reserved Printed in Great Britain 0025-326X/00 $ - see front matter PII: S0025-326X(00)00039-4 q Contribution to MAR95-1953 and MAR97-0626 CICYT projects. *Corresponding author. Tel.: +34-86-812649; fax: +34-86-812556. E-mail address: [email protected] (B. Rubio). 968
Transcript
Geochemistry of Major and TraceElements in Sediments of the Ria deVigo (NW Spain): an Assessment ofMetal Pollutionq
B. RUBIO*, M. A. NOMBELA and F. VILASDepartamento Geociencias Marinas y Ordenaci�on del Territorio, Facultad de Ciencias, Universidad de Vigo, 36200 Vigo(Pontevedra), Spain
Ria de Vigo is a funnel-shaped, fault-bounded coastalembayment in Galicia, NW Spain. There are a number ofimportant centres of population and industrial activityalong its margins, which serve as sources of pollution.Sixty-six subtidal sediment samples have been collected inthe Ria. The samples have been subjected to a total di-gestion technique and analysed for major and trace ele-ments (Al, Fe,Ti, Mn, Cu, Pb, Cr, Zn, Co, As, Ni, Cd andSr). Variations of absolute metal concentrations re¯ectedvariations in textural and/or carbonate and organic mat-ter content. Geoaccumulation indexes and enrichmentfactors have been calculated to assess whether the con-centrations observed represent background or contami-nated levels. It is proved that the choice of the backgroundplays an important role in the interpretation of the geo-chemical data. PCA was a very useful tool to de®nebackground values for metals in the Ria de Vigo area.These values were similar to regional values given by otherauthors. It is concluded that the Ria is slightly to mod-erately polluted for some of the studied metals. The spatialextent of pollution was examined, and it was found thatthe most polluted area is located in the inner and southernparts of the Ria. Ó 2000 Elsevier Science Ltd. All rightsreserved.
Keywords: heavy metals; Ria de Vigo; pollution; subtidalsediments; normalization; principal component analysis.
Introduction
In Galicia, 40% of the population live in or near Rias,and the principal industrialized areas are also locatednearby, thus leading to a high risk of contamination.The city of Vigo is the biggest human settlement in
Galicia (287000 inhabitants, INE, Padr�on, 1996) andalso one of the most important harbours. The Rias ofnorth-west Spain are coastal ecosystems of high bio-logical productivity and great economic importance.They are intensively exploited by man for ®sh andshell®sh. Mariculture represents the most signi®canthuman impact in the past 20 years or so and has un-doubtedly changed the nature of sedimentation in someparts of the Rias (Nombela et al., 1995). Filter feedingmussels have led to a dramatic increase in biologicalproduction of sediment, changes to sediment type andincreased sedimentation rates. Over the last 5±7 years,construction of hotels, urban and recreation areas hasalso produced changes to coastal sedimentary processes.However, the industrial waste reaching the sea throughatmospheric precipitation and dumping of urban andrural waste is mostly responsible for the input of tracemetals into the marine environment which are subse-quently incorporated into the sediments.
In recent years, increasing interest has been shown inthe level of heavymetals in sediments of theGalician Rias(Barreiro et al., 1988; Carral et al., 1992, 1995; Carballeiraet al., 1997). Most of these papers have only concernedintertidal sediments, probably due to the simplicity ofcollecting the samples. Although in some of these studies(e.g., Carballeira et al., 1997), sampling distribution wasextensive and appropriate for tidal ¯ats and intertidalareas, there is a scarcity of data for subtidal areas.
The main objectives of the study reported here were:1. To determine the total content of heavy metals in
surface sediments of the Ria de Vigo, and to pro-duce geochemical maps for the Ria, based on anappropiate sampling density (1 km2), that can beused by other disciplines.
2. To evaluate the sedimentological and geochemicalfactors that control the distribution pattern of ma-jor and trace elements.
3. To estimate the anthropogenic input and to assessthe pollution status on the area.
Marine Pollution Bulletin Vol. 40, No. 11, pp. 968±980, 2000
Ó 2000 Elsevier Science Ltd. All rights reserved
Printed in Great Britain
0025-326X/00 $ - see front matterPII: S0025-326X(00)00039-4
qContribution to MAR95-1953 and MAR97-0626 CICYT projects.*Corresponding author. Tel.: +34-86-812649; fax: +34-86-812556.E-mail address: [email protected] (B. Rubio).
968
Study Area
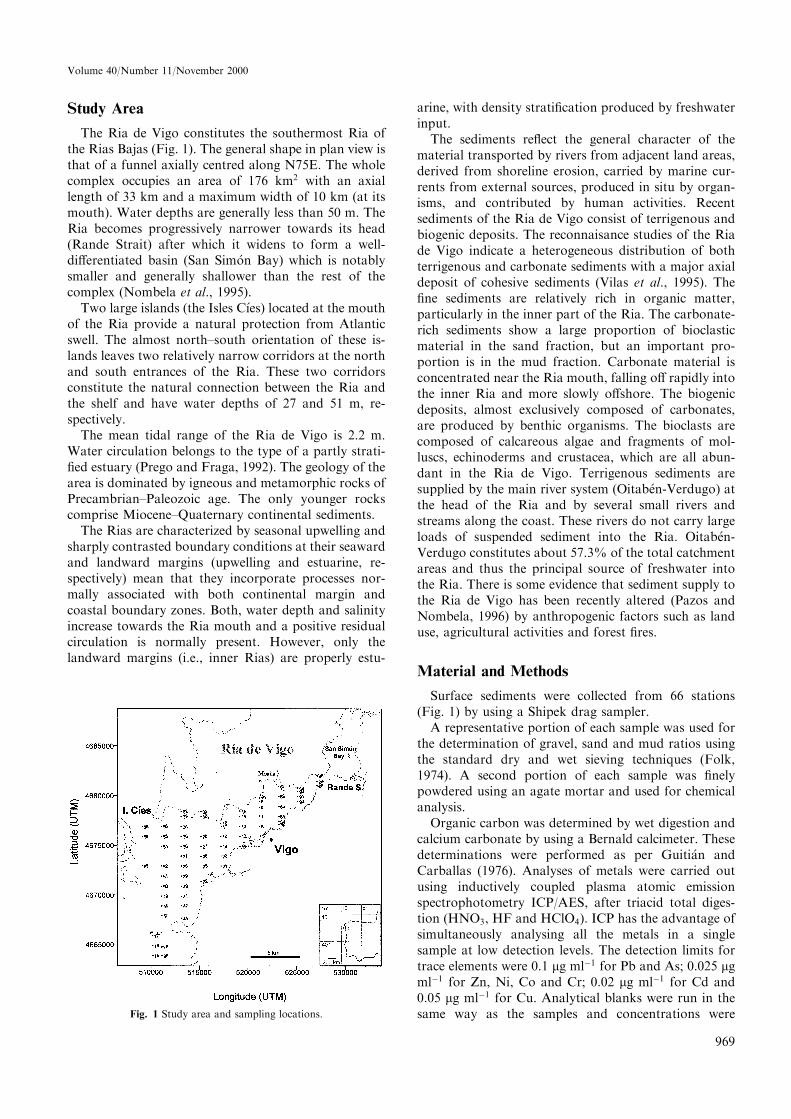
The Ria de Vigo constitutes the southermost Ria ofthe Rias Bajas (Fig. 1). The general shape in plan view isthat of a funnel axially centred along N75E. The wholecomplex occupies an area of 176 km2 with an axiallength of 33 km and a maximum width of 10 km (at itsmouth). Water depths are generally less than 50 m. TheRia becomes progressively narrower towards its head(Rande Strait) after which it widens to form a well-di�erentiated basin (San Sim�on Bay) which is notablysmaller and generally shallower than the rest of thecomplex (Nombela et al., 1995).
Two large islands (the Isles C�ões) located at the mouthof the Ria provide a natural protection from Atlanticswell. The almost north±south orientation of these is-lands leaves two relatively narrow corridors at the northand south entrances of the Ria. These two corridorsconstitute the natural connection between the Ria andthe shelf and have water depths of 27 and 51 m, re-spectively.
The mean tidal range of the Ria de Vigo is 2.2 m.Water circulation belongs to the type of a partly strati-®ed estuary (Prego and Fraga, 1992). The geology of thearea is dominated by igneous and metamorphic rocks ofPrecambrian±Paleozoic age. The only younger rockscomprise Miocene±Quaternary continental sediments.
The Rias are characterized by seasonal upwelling andsharply contrasted boundary conditions at their seawardand landward margins (upwelling and estuarine, re-spectively) mean that they incorporate processes nor-mally associated with both continental margin andcoastal boundary zones. Both, water depth and salinityincrease towards the Ria mouth and a positive residualcirculation is normally present. However, only thelandward margins (i.e., inner Rias) are properly estu-
arine, with density strati®cation produced by freshwaterinput.
The sediments re¯ect the general character of thematerial transported by rivers from adjacent land areas,derived from shoreline erosion, carried by marine cur-rents from external sources, produced in situ by organ-isms, and contributed by human activities. Recentsediments of the Ria de Vigo consist of terrigenous andbiogenic deposits. The reconnaisance studies of the Riade Vigo indicate a heterogeneous distribution of bothterrigenous and carbonate sediments with a major axialdeposit of cohesive sediments (Vilas et al., 1995). The®ne sediments are relatively rich in organic matter,particularly in the inner part of the Ria. The carbonate-rich sediments show a large proportion of bioclasticmaterial in the sand fraction, but an important pro-portion is in the mud fraction. Carbonate material isconcentrated near the Ria mouth, falling o� rapidly intothe inner Ria and more slowly o�shore. The biogenicdeposits, almost exclusively composed of carbonates,are produced by benthic organisms. The bioclasts arecomposed of calcareous algae and fragments of mol-luscs, echinoderms and crustacea, which are all abun-dant in the Ria de Vigo. Terrigenous sediments aresupplied by the main river system (Oitab�en-Verdugo) atthe head of the Ria and by several small rivers andstreams along the coast. These rivers do not carry largeloads of suspended sediment into the Ria. Oitab�en-Verdugo constitutes about 57.3% of the total catchmentareas and thus the principal source of freshwater intothe Ria. There is some evidence that sediment supply tothe Ria de Vigo has been recently altered (Pazos andNombela, 1996) by anthropogenic factors such as landuse, agricultural activities and forest ®res.
Material and Methods
Surface sediments were collected from 66 stations(Fig. 1) by using a Shipek drag sampler.
A representative portion of each sample was used forthe determination of gravel, sand and mud ratios usingthe standard dry and wet sieving techniques (Folk,1974). A second portion of each sample was ®nelypowdered using an agate mortar and used for chemicalanalysis.
Organic carbon was determined by wet digestion andcalcium carbonate by using a Bernald calcimeter. Thesedeterminations were performed as per Guiti�an andCarballas (1976). Analyses of metals were carried outusing inductively coupled plasma atomic emissionspectrophotometry ICP/AES, after triacid total diges-tion (HNO3, HF and HClO4). ICP has the advantage ofsimultaneously analysing all the metals in a singlesample at low detection levels. The detection limits fortrace elements were 0.1 lg mlÿ1 for Pb and As; 0.025 lgmlÿ1 for Zn, Ni, Co and Cr; 0.02 lg mlÿ1 for Cd and0.05 lg mlÿ1 for Cu. Analytical blanks were run in thesame way as the samples and concentrations wereFig. 1 Study area and sampling locations.
969
Volume 40/Number 11/November 2000
determined using standard solutions prepared in thesame acid matrix. Suspensions were duplicated withresults as mean values. Results are expressed in lg gÿ1
dry sediment. The accuracy and precision of our resultswere checked by analysing sediment reference material(CRM 277). The results indicate good agreement be-tween the certi®ed and the analytical values (Table 1),the recovery of elements being practically complete formost of them. Only in the case of Ni the recovery wasapprox. 83%.
Results and Discussion
Sediment typeFig. 2 shows a box and wisker plot for the more rel-
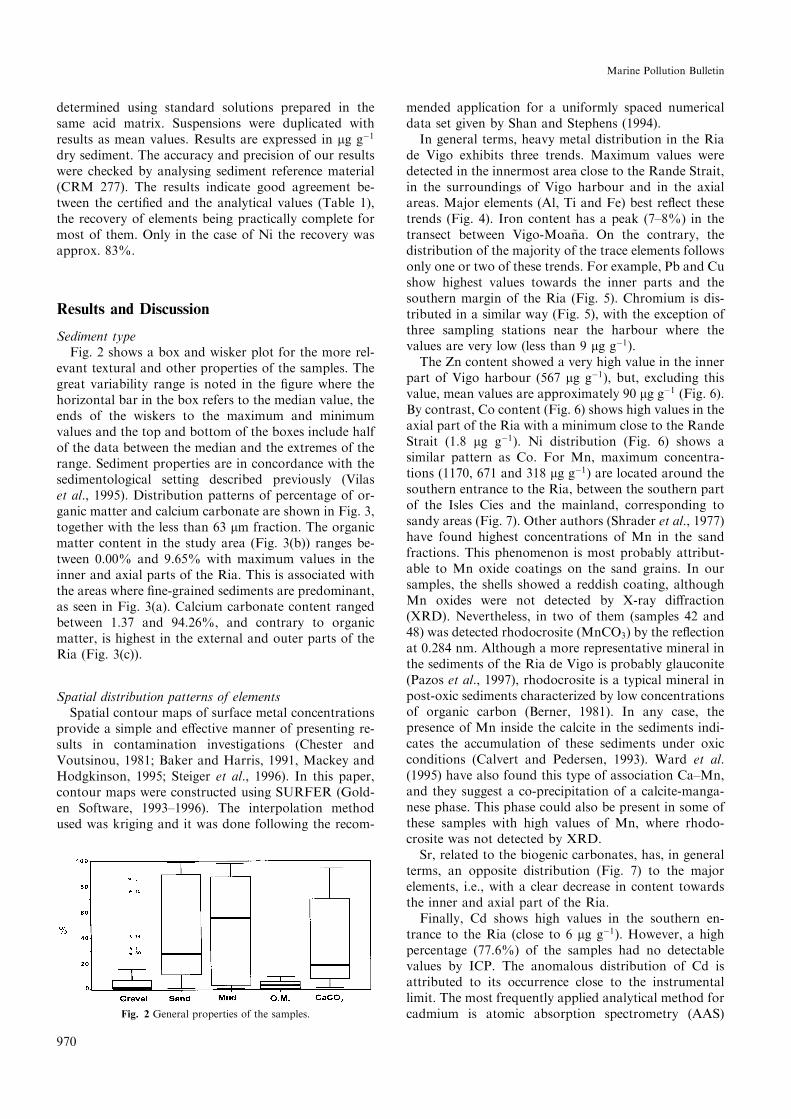
evant textural and other properties of the samples. Thegreat variability range is noted in the ®gure where thehorizontal bar in the box refers to the median value, theends of the wiskers to the maximum and minimumvalues and the top and bottom of the boxes include halfof the data between the median and the extremes of therange. Sediment properties are in concordance with thesedimentological setting described previously (Vilaset al., 1995). Distribution patterns of percentage of or-ganic matter and calcium carbonate are shown in Fig. 3,together with the less than 63 lm fraction. The organicmatter content in the study area (Fig. 3(b)) ranges be-tween 0.00% and 9.65% with maximum values in theinner and axial parts of the Ria. This is associated withthe areas where ®ne-grained sediments are predominant,as seen in Fig. 3(a). Calcium carbonate content rangedbetween 1.37 and 94.26%, and contrary to organicmatter, is highest in the external and outer parts of theRia (Fig. 3(c)).
Spatial distribution patterns of elementsSpatial contour maps of surface metal concentrations
provide a simple and e�ective manner of presenting re-sults in contamination investigations (Chester andVoutsinou, 1981; Baker and Harris, 1991, Mackey andHodgkinson, 1995; Steiger et al., 1996). In this paper,contour maps were constructed using SURFER (Gold-en Software, 1993±1996). The interpolation methodused was kriging and it was done following the recom-
mended application for a uniformly spaced numericaldata set given by Shan and Stephens (1994).
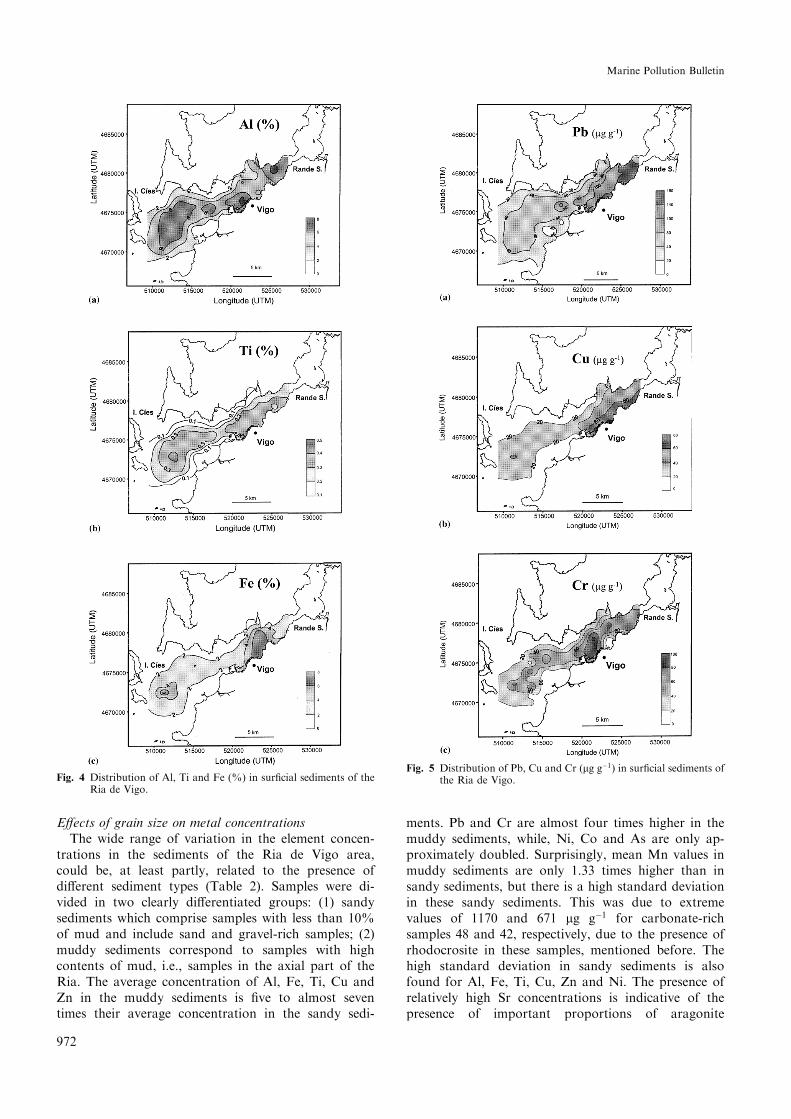
In general terms, heavy metal distribution in the Riade Vigo exhibits three trends. Maximum values weredetected in the innermost area close to the Rande Strait,in the surroundings of Vigo harbour and in the axialareas. Major elements (Al, Ti and Fe) best re¯ect thesetrends (Fig. 4). Iron content has a peak (7±8%) in thetransect between Vigo-Moa~na. On the contrary, thedistribution of the majority of the trace elements followsonly one or two of these trends. For example, Pb and Cushow highest values towards the inner parts and thesouthern margin of the Ria (Fig. 5). Chromium is dis-tributed in a similar way (Fig. 5), with the exception ofthree sampling stations near the harbour where thevalues are very low (less than 9 lg gÿ1).The Zn content showed a very high value in the inner
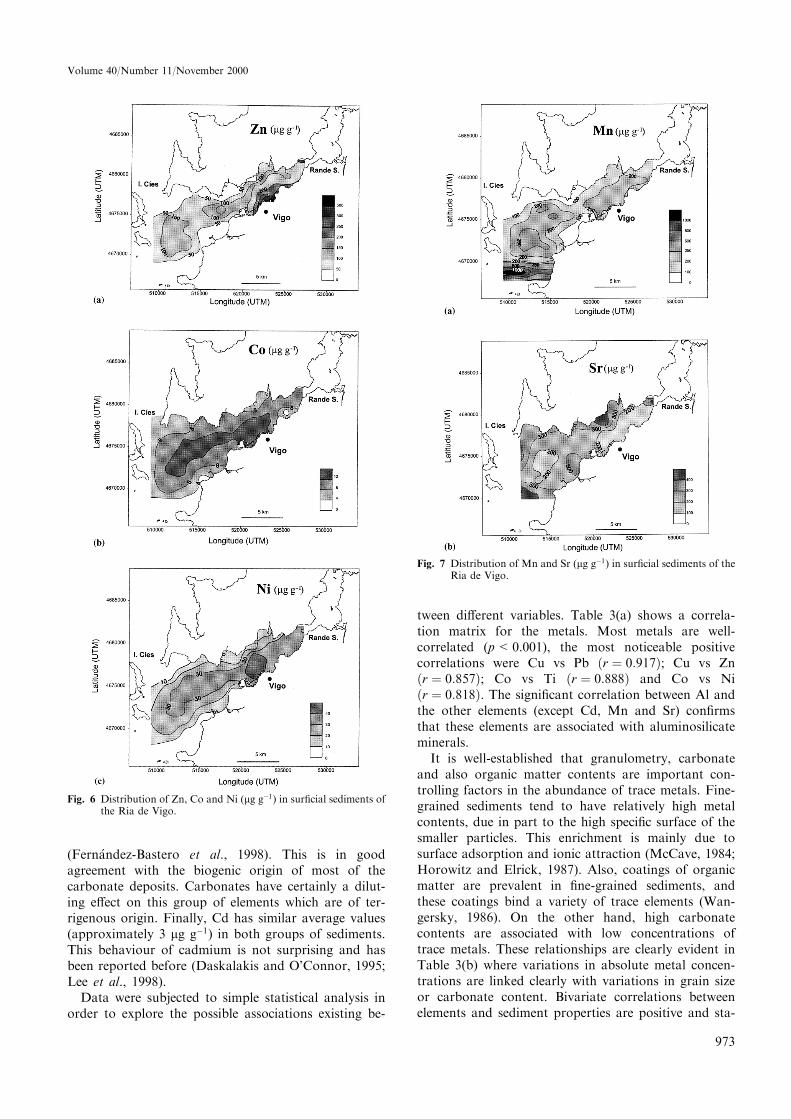
part of Vigo harbour (567 lg gÿ1), but, excluding thisvalue, mean values are approximately 90 lg gÿ1 (Fig. 6).By contrast, Co content (Fig. 6) shows high values in theaxial part of the Ria with a minimum close to the RandeStrait (1.8 lg gÿ1). Ni distribution (Fig. 6) shows asimilar pattern as Co. For Mn, maximum concentra-tions (1170, 671 and 318 lg gÿ1) are located around thesouthern entrance to the Ria, between the southern partof the Isles Cies and the mainland, corresponding tosandy areas (Fig. 7). Other authors (Shrader et al., 1977)have found highest concentrations of Mn in the sandfractions. This phenomenon is most probably attribut-able to Mn oxide coatings on the sand grains. In oursamples, the shells showed a reddish coating, althoughMn oxides were not detected by X-ray di�raction(XRD). Nevertheless, in two of them (samples 42 and48) was detected rhodocrosite (MnCO3) by the re¯ectionat 0.284 nm. Although a more representative mineral inthe sediments of the Ria de Vigo is probably glauconite(Pazos et al., 1997), rhodocrosite is a typical mineral inpost-oxic sediments characterized by low concentrationsof organic carbon (Berner, 1981). In any case, thepresence of Mn inside the calcite in the sediments indi-cates the accumulation of these sediments under oxicconditions (Calvert and Pedersen, 1993). Ward et al.(1995) have also found this type of association Ca±Mn,and they suggest a co-precipitation of a calcite-manga-nese phase. This phase could also be present in some ofthese samples with high values of Mn, where rhodo-crosite was not detected by XRD.
Sr, related to the biogenic carbonates, has, in generalterms, an opposite distribution (Fig. 7) to the majorelements, i.e., with a clear decrease in content towardsthe inner and axial part of the Ria.
Finally, Cd shows high values in the southern en-trance to the Ria (close to 6 lg gÿ1). However, a highpercentage (77.6%) of the samples had no detectablevalues by ICP. The anomalous distribution of Cd isattributed to its occurrence close to the instrumentallimit. The most frequently applied analytical method forcadmium is atomic absorption spectrometry (AAS)Fig. 2 General properties of the samples.
970
Marine Pollution Bulletin
using ¯ame and graphite furnace (Stoeppler, 1992).Other researchers have also criticized the e�ciency ofICP for the determination of this element (Schramelet al., 1982). Also, As was not detected in 58.2% of thesamples and maximum concentrations were located inthe surroundings of the harbour area.
TABLE
1
Comparisonoftheanalyticalresultsofthereference
estuarinematerial(C
RM
277)withthecerti®ed
data.a
Metal
As(m
gkgÿ1)
Cd(m
gkgÿ1)
Cr(m
gkgÿ1)
Cu(m
gkgÿ1)
Ni(m
gkgÿ1)
Pb(m
gkgÿ1)
Zn(m
gkgÿ1)Al(m
ggÿ1)
Co(lggÿ1)
Fe(m
ggÿ1)
Mn(m
ggÿ1)
Sr(m
ggÿ1)
Certi®ed
value
47.3�
1.6
11.9�
0.4
192�
7101.7�
1.6
43.4�
1.6
146�
3547�
12
(48)
(17)
(45.5)
1.5
)Measuredvalue
53.9�
1.2
10.85�
2.5
188�
0.62
99.08�
0.49
36.16�
2.1
160.1�
1.2
546�
1.6
)23.04�
0.94
))
310.8�
0.5
aValues
inparentheses
are
notcerti®ed.
Fig. 3 Distribution of mud fraction (<63 lm) (a), organic matter(OM) (b) and carbonate contents (c) in sur®cial sediments ofthe Ria de Vigo.
971
Volume 40/Number 11/November 2000
E�ects of grain size on metal concentrationsThe wide range of variation in the element concen-
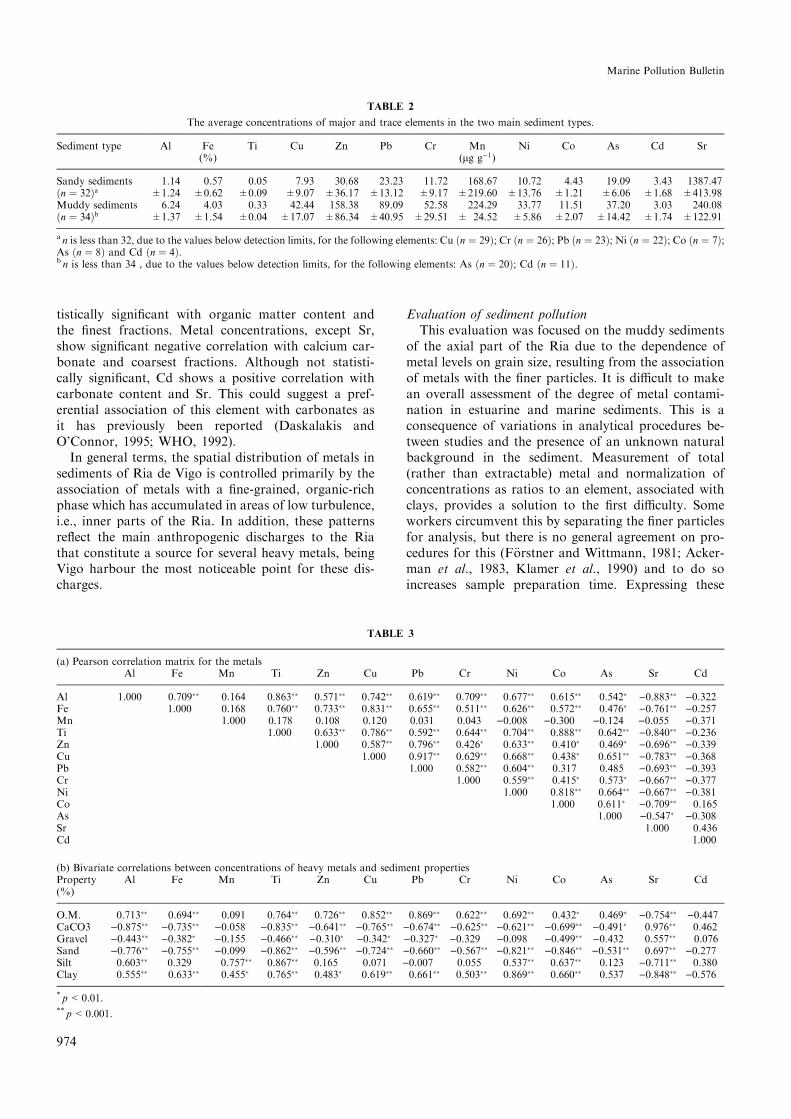
trations in the sediments of the Ria de Vigo area,could be, at least partly, related to the presence ofdi�erent sediment types (Table 2). Samples were di-vided in two clearly di�erentiated groups: (1) sandysediments which comprise samples with less than 10%of mud and include sand and gravel-rich samples; (2)muddy sediments correspond to samples with highcontents of mud, i.e., samples in the axial part of theRia. The average concentration of Al, Fe, Ti, Cu andZn in the muddy sediments is ®ve to almost seventimes their average concentration in the sandy sedi-
ments. Pb and Cr are almost four times higher in themuddy sediments, while, Ni, Co and As are only ap-proximately doubled. Surprisingly, mean Mn values inmuddy sediments are only 1.33 times higher than insandy sediments, but there is a high standard deviationin these sandy sediments. This was due to extremevalues of 1170 and 671 lg gÿ1 for carbonate-richsamples 48 and 42, respectively, due to the presence ofrhodocrosite in these samples, mentioned before. Thehigh standard deviation in sandy sediments is alsofound for Al, Fe, Ti, Cu, Zn and Ni. The presence ofrelatively high Sr concentrations is indicative of thepresence of important proportions of aragonite
Fig. 4 Distribution of Al, Ti and Fe (%) in sur®cial sediments of theRia de Vigo.
Fig. 5 Distribution of Pb, Cu and Cr (lg gÿ1) in sur®cial sediments ofthe Ria de Vigo.
972
Marine Pollution Bulletin
(Fern�andez-Bastero et al., 1998). This is in goodagreement with the biogenic origin of most of thecarbonate deposits. Carbonates have certainly a dilut-ing e�ect on this group of elements which are of ter-rigenous origin. Finally, Cd has similar average values(approximately 3 lg gÿ1) in both groups of sediments.This behaviour of cadmium is not surprising and hasbeen reported before (Daskalakis and O'Connor, 1995;Lee et al., 1998).
Data were subjected to simple statistical analysis inorder to explore the possible associations existing be-
tween di�erent variables. Table 3(a) shows a correla-tion matrix for the metals. Most metals are well-correlated (p<0.001), the most noticeable positivecorrelations were Cu vs Pb �r � 0:917�; Cu vs Zn�r � 0:857�; Co vs Ti �r � 0:888� and Co vs Ni�r � 0:818�. The signi®cant correlation between Al andthe other elements (except Cd, Mn and Sr) con®rmsthat these elements are associated with aluminosilicateminerals.
It is well-established that granulometry, carbonateand also organic matter contents are important con-trolling factors in the abundance of trace metals. Fine-grained sediments tend to have relatively high metalcontents, due in part to the high speci®c surface of thesmaller particles. This enrichment is mainly due tosurface adsorption and ionic attraction (McCave, 1984;Horowitz and Elrick, 1987). Also, coatings of organicmatter are prevalent in ®ne-grained sediments, andthese coatings bind a variety of trace elements (Wan-gersky, 1986). On the other hand, high carbonatecontents are associated with low concentrations oftrace metals. These relationships are clearly evident inTable 3(b) where variations in absolute metal concen-trations are linked clearly with variations in grain sizeor carbonate content. Bivariate correlations betweenelements and sediment properties are positive and sta-
Fig. 6 Distribution of Zn, Co and Ni (lg gÿ1) in sur®cial sediments ofthe Ria de Vigo.
Fig. 7 Distribution of Mn and Sr (lg gÿ1) in sur®cial sediments of theRia de Vigo.
973
Volume 40/Number 11/November 2000
tistically signi®cant with organic matter content andthe ®nest fractions. Metal concentrations, except Sr,show signi®cant negative correlation with calcium car-bonate and coarsest fractions. Although not statisti-cally signi®cant, Cd shows a positive correlation withcarbonate content and Sr. This could suggest a pref-erential association of this element with carbonates asit has previously been reported (Daskalakis andO'Connor, 1995; WHO, 1992).
In general terms, the spatial distribution of metals insediments of Ria de Vigo is controlled primarily by theassociation of metals with a ®ne-grained, organic-richphase which has accumulated in areas of low turbulence,i.e., inner parts of the Ria. In addition, these patternsre¯ect the main anthropogenic discharges to the Riathat constitute a source for several heavy metals, beingVigo harbour the most noticeable point for these dis-charges.
Evaluation of sediment pollutionThis evaluation was focused on the muddy sediments
of the axial part of the Ria due to the dependence ofmetal levels on grain size, resulting from the associationof metals with the ®ner particles. It is di�cult to makean overall assessment of the degree of metal contami-nation in estuarine and marine sediments. This is aconsequence of variations in analytical procedures be-tween studies and the presence of an unknown naturalbackground in the sediment. Measurement of total(rather than extractable) metal and normalization ofconcentrations as ratios to an element, associated withclays, provides a solution to the ®rst di�culty. Someworkers circumvent this by separating the ®ner particlesfor analysis, but there is no general agreement on pro-cedures for this (F�orstner and Wittmann, 1981; Acker-man et al., 1983, Klamer et al., 1990) and to do soincreases sample preparation time. Expressing these
TABLE 3
(a) Pearson correlation matrix for the metalsAl Fe Mn Ti Zn Cu Pb Cr Ni Co As Sr Cd
a n is less than 32, due to the values below detection limits, for the following elements: Cu �n � 29�; Cr �n � 26�; Pb �n � 23�; Ni �n � 22�; Co �n � 7�;As �n � 8� and Cd �n � 4�.b n is less than 34 , due to the values below detection limits, for the following elements: As �n � 20�; Cd �n � 11�.
974
Marine Pollution Bulletin
values as geoaccumulation indexes (Igeo) or enrichmentfactors (EF), relative to pre-industrial sediments fromthe same environment, solves the second; although it isnot always easy to reach these pre-industrial sedimentsdata. Many authors (Angelidis and Aloupi, 1995) usethese kinds of approaches, however, their calculationposes several problems. Both, Igeo and EF, depend onthe ÔbackgroundÕ data used. For the total metal contentof the sediments, these data can be provided by theaverage metal concentration of texturally and mineral-ogically equivalent sediments, either reported in the lit-erature or measured by the authors in a known pristineregion (Loring and Rantala, 1992). The world averageshale and the world average soil are among the materialsoften used to provide background metal levels. How-ever, these metal levels tend to be very general and maymislead in a speci®c coastal area (Gibbs, 1993). Thelatest author recommends the use of regional back-ground values. We suspect that the obtained informa-tion of pollution status can be more dependent on thebackground used than the index/factor chosen.
Index of geoaccumulation. The geoaccumulation in-dex (Igeo) was originally de®ned by M�uller (1979) formetal concentrations in the <2 lm fraction and devel-oped for the global standard shale values, which is ex-pressed as follows:
Igeo � log2
Cn
1:5 � Bn;
where Cn is the measured concentration in the sedimentfor the metal n, Bn the background value for the metal nand the factor 1.5 is used because of possible variationsof the background data due to lithological variations.
However, several researchers (Subramanian andMohanachandran, 1990; Barreiro, 1991; Sahu andBhosale, 1991) have used the previous expression usingregional backgrounds and on the less than 63±65 lmsediment fraction.
In this paper, Igeo has been calculated using threebackground values, two of them regional values and thethird the global average shale data from Turekian andWedepohl, 1961 (Igeo Sh). For the regional backgroundvalues we have taken the data from Carral et al. (1995)± Igeo Ca ± and the data from Barreiro (1991) ± IgeoBa ± Carral et al. (1995) determined (by modal anal-ysis) background metal levels in intertidal sediments ofGalician estuaries for watersheds over granite and/orover schist/gneiss. We have calculated the percent of thesurface of the watershed Ria de Vigo that is granite(83.5%) and schist/gneiss (16.7%) and we have recal-culated the background values having account of thislithology (Table 4). Barreiro (1991) established a back-ground value for Galician Rias, obtained from Riasediments, using similar digestion procedures to thoseused in our study.
The index of geoaccumulation consists of sevengrades or classes, with Igeo of 6 indicating almost a 100-
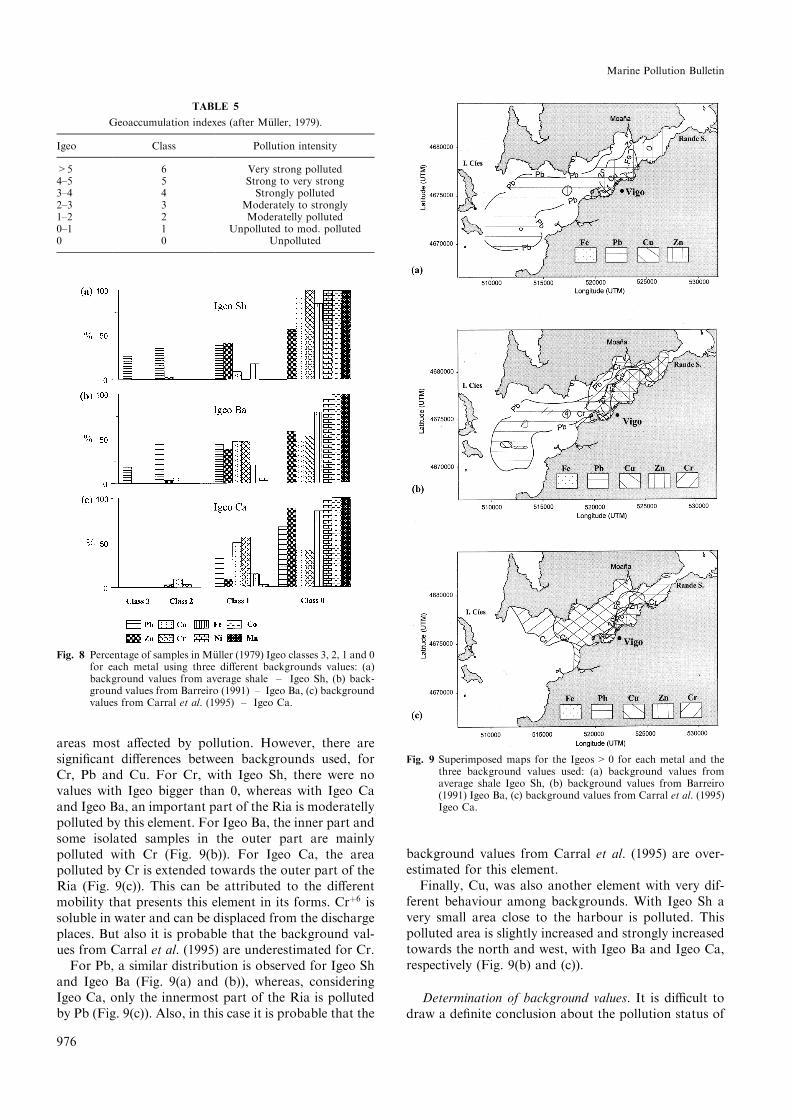
fold enrichment above background values (M�uller,1979) (Table 5). In Fig. 8, the histograms represent thepercent of samples for each metal in Classes 3, 2, 1 and 0for the three background values used. The ®gure re¯ectsthat, independent of the background used, 100% of thesamples fall in Class 0 (background concentrations) forthe metals Mn, Co and practically Ni, i.e., it leads us toconclude that the Ria de Vigo is not polluted for any ofthese metals. The same could be infered for Cr if we usethe Igeo Sh. However, if we use the background regionalvalues, di�erent inferences can be made. Approximately50% of the samples fall in Class 1 (up to double thebackground values) using background values fromBarreiro (Igeo Ba) and more than a 50% using thevalues from Carral et al. (Igeo Ca). A small percentageof the samples is included in Class 2 for this element,using the regional background values. Similar behaviourwas found for Cu, i.e., practically 90% of the samplesfall in Class 0 for Igeo Sh, whereas for Igeo Ba and IgeoCa, more than 50% of the samples are indicative of amoderate pollution status. For Fe, the three backgroundvalues used gave similar information, a small number ofsamples are moderately polluted. These samples aremainly corresponding to the transect Vigo-Moa~na. Pbpresented the highest values of Igeo, about 25% of thesamples are in Class 3 using background values for av-erage shale (Igeo Sh), and close to 12% for Igeo Ba.Also, Pb was the metal more signi®cant in Class 2 forthese two backgrounds (approximately 40% of thesamples), and none of the samples were in Class 0. Asigni®cant di�erence was found for this element usingIgeo Ca. This di�erence between backgrounds was alsonoted for Zn, mainly in % of samples in Class 1 (lessthan 10% for Igeo Ca, vs approximately 40% for IgeoBa and Igeo Sh).
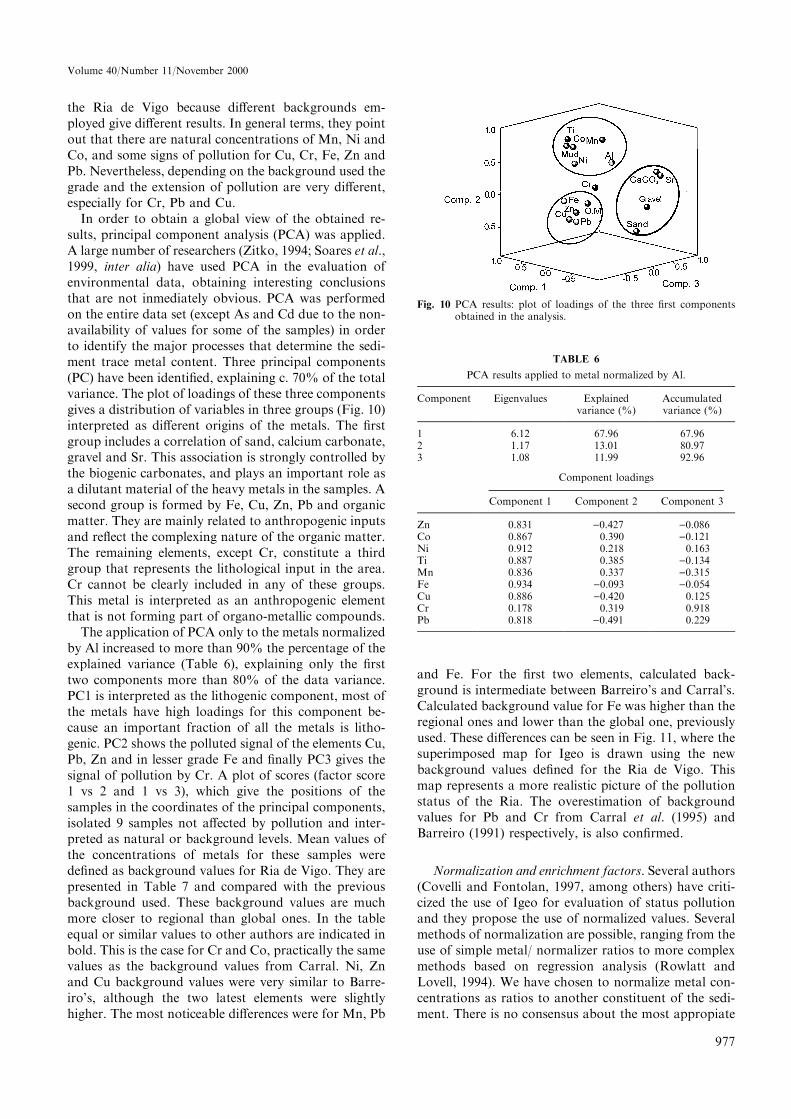
This index allows us to deduce that, in general terms,the Ria de Vigo is moderately polluted for some of thestudied metals. In order to synthesize the data set and toassess the areal extension of this pollution, superim-posed maps has been prepared (Fig. 9) for the Igeos>0for each metal and background. In general terms, theinner and southern parts of the Ria are generally the
TABLE 4
Background concentrations of heavy metals from Carral et al. (1995),modi®ed according the lithology for the Ria de Vigo watershed.
aRecalculated according the lithology of the watershed.
975
Volume 40/Number 11/November 2000
areas most a�ected by pollution. However, there aresigni®cant di�erences between backgrounds used, forCr, Pb and Cu. For Cr, with Igeo Sh, there were novalues with Igeo bigger than 0, whereas with Igeo Caand Igeo Ba, an important part of the Ria is moderatellypolluted by this element. For Igeo Ba, the inner part andsome isolated samples in the outer part are mainlypolluted with Cr (Fig. 9(b)). For Igeo Ca, the areapolluted by Cr is extended towards the outer part of theRia (Fig. 9(c)). This can be attributed to the di�erentmobility that presents this element in its forms. Cr�6 issoluble in water and can be displaced from the dischargeplaces. But also it is probable that the background val-ues from Carral et al. (1995) are underestimated for Cr.
For Pb, a similar distribution is observed for Igeo Shand Igeo Ba (Fig. 9(a) and (b)), whereas, consideringIgeo Ca, only the innermost part of the Ria is pollutedby Pb (Fig. 9(c)). Also, in this case it is probable that the
background values from Carral et al. (1995) are over-estimated for this element.
Finally, Cu, was also another element with very dif-ferent behaviour among backgrounds. With Igeo Sh avery small area close to the harbour is polluted. Thispolluted area is slightly increased and strongly increasedtowards the north and west, with Igeo Ba and Igeo Ca,respectively (Fig. 9(b) and (c)).
Determination of background values. It is di�cult todraw a de®nite conclusion about the pollution status of
Fig. 8 Percentage of samples in M�uller (1979) Igeo classes 3, 2, 1 and 0for each metal using three di�erent backgrounds values: (a)background values from average shale ± Igeo Sh, (b) back-ground values from Barreiro (1991) ± Igeo Ba, (c) backgroundvalues from Carral et al. (1995) ± Igeo Ca.
TABLE 5
Geoaccumulation indexes (after M�uller, 1979).
Igeo Class Pollution intensity
>5 6 Very strong polluted4±5 5 Strong to very strong3±4 4 Strongly polluted2±3 3 Moderately to strongly1±2 2 Moderatelly polluted0±1 1 Unpolluted to mod. polluted0 0 Unpolluted
Fig. 9 Superimposed maps for the Igeos>0 for each metal and thethree background values used: (a) background values fromaverage shale Igeo Sh, (b) background values from Barreiro(1991) Igeo Ba, (c) background values from Carral et al. (1995)Igeo Ca.
976
Marine Pollution Bulletin
the Ria de Vigo because di�erent backgrounds em-ployed give di�erent results. In general terms, they pointout that there are natural concentrations of Mn, Ni andCo, and some signs of pollution for Cu, Cr, Fe, Zn andPb. Nevertheless, depending on the background used thegrade and the extension of pollution are very di�erent,especially for Cr, Pb and Cu.
In order to obtain a global view of the obtained re-sults, principal component analysis (PCA) was applied.A large number of researchers (Zitko, 1994; Soares et al.,1999, inter alia) have used PCA in the evaluation ofenvironmental data, obtaining interesting conclusionsthat are not inmediately obvious. PCA was performedon the entire data set (except As and Cd due to the non-availability of values for some of the samples) in orderto identify the major processes that determine the sedi-ment trace metal content. Three principal components(PC) have been identi®ed, explaining c. 70% of the totalvariance. The plot of loadings of these three componentsgives a distribution of variables in three groups (Fig. 10)interpreted as di�erent origins of the metals. The ®rstgroup includes a correlation of sand, calcium carbonate,gravel and Sr. This association is strongly controlled bythe biogenic carbonates, and plays an important role asa dilutant material of the heavy metals in the samples. Asecond group is formed by Fe, Cu, Zn, Pb and organicmatter. They are mainly related to anthropogenic inputsand re¯ect the complexing nature of the organic matter.The remaining elements, except Cr, constitute a thirdgroup that represents the lithological input in the area.Cr cannot be clearly included in any of these groups.This metal is interpreted as an anthropogenic elementthat is not forming part of organo-metallic compounds.
The application of PCA only to the metals normalizedby Al increased to more than 90% the percentage of theexplained variance (Table 6), explaining only the ®rsttwo components more than 80% of the data variance.PC1 is interpreted as the lithogenic component, most ofthe metals have high loadings for this component be-cause an important fraction of all the metals is litho-genic. PC2 shows the polluted signal of the elements Cu,Pb, Zn and in lesser grade Fe and ®nally PC3 gives thesignal of pollution by Cr. A plot of scores (factor score1 vs 2 and 1 vs 3), which give the positions of thesamples in the coordinates of the principal components,isolated 9 samples not a�ected by pollution and inter-preted as natural or background levels. Mean values ofthe concentrations of metals for these samples werede®ned as background values for Ria de Vigo. They arepresented in Table 7 and compared with the previousbackground used. These background values are muchmore closer to regional than global ones. In the tableequal or similar values to other authors are indicated inbold. This is the case for Cr and Co, practically the samevalues as the background values from Carral. Ni, Znand Cu background values were very similar to Barre-iro's, although the two latest elements were slightlyhigher. The most noticeable di�erences were for Mn, Pb
and Fe. For the ®rst two elements, calculated back-ground is intermediate between Barreiro's and Carral's.Calculated background value for Fe was higher than theregional ones and lower than the global one, previouslyused. These di�erences can be seen in Fig. 11, where thesuperimposed map for Igeo is drawn using the newbackground values de®ned for the Ria de Vigo. Thismap represents a more realistic picture of the pollutionstatus of the Ria. The overestimation of backgroundvalues for Pb and Cr from Carral et al. (1995) andBarreiro (1991) respectively, is also con®rmed.
Normalization and enrichment factors. Several authors(Covelli and Fontolan, 1997, among others) have criti-cized the use of Igeo for evaluation of status pollutionand they propose the use of normalized values. Severalmethods of normalization are possible, ranging from theuse of simple metal/ normalizer ratios to more complexmethods based on regression analysis (Rowlatt andLovell, 1994). We have chosen to normalize metal con-centrations as ratios to another constituent of the sedi-ment. There is no consensus about the most appropiate
Fig. 10 PCA results: plot of loadings of the three ®rst componentsobtained in the analysis.
sediment constituent to be used for normalization.Among those used have been Al, Fe, total organic car-bon and grain size. The constituent chosen for thispurpose should also be associated with ®ner particles(related to grain size) and its concentration should notbe anthropogenically altered (Ackerman, 1980). Al is aconservative element and a major constituent of clayminerals, and has been used successfully by severalworkers (Ryan and Windom, 1988; Sinex and Wright,1988; Balls et al., 1997). In addition, its distribution inthe Ria de Vigo shows no evidence of anthropogenicenrichment (Fig. 3). After Al, the next most consistentcandidates are Fe and total organic carbon, althoughother elements such as Cs, Rb and Li have been used(Ackerman, 1980; Allen and Rae, 1987; Loring, 1990;Loring et al., 1995).
Normalization to Fe has been used previously as agrain size proxy by a number of authors working onmarine and estuarine sediments (Ackerman, 1980;Emmerson et al., 1997; Lee et al., 1998). Iron is not amatrix element, like aluminium, but is like trace ele-ments in being associated with surfaces. Iron geochem-istry is similar to that of many trace metals both in oxicand anoxic environments. This association argues for itsuse as a normalizer. A potential di�culty with using Feis that in certain circumstances this element can bemobile during diagenesis (Finney and Huh, 1989). Avery real di�culty with using Fe in this case is that theRia de Vigo is presumably contaminated with this ele-ment (Fig. 3). Other authors (Din, 1992) have cited ac-cumulation of Fe compounds in coastal sediments.
Organic carbon has also been used (Daskalakis andO'Connor, 1995; Zwolsman et al., 1996). However, or-ganic carbon itself can be considered as a contaminantand the normalization approach has no geochemicalbasis (Kersten et al., 1994).
For the exposed reasons, in this study, we have chosento normalize metal concentration using aluminium as agrain-size proxy. The method employed was calculatingEF as follows:
EF � �Metal=Al� Sediment
�Metal=Al� Background:
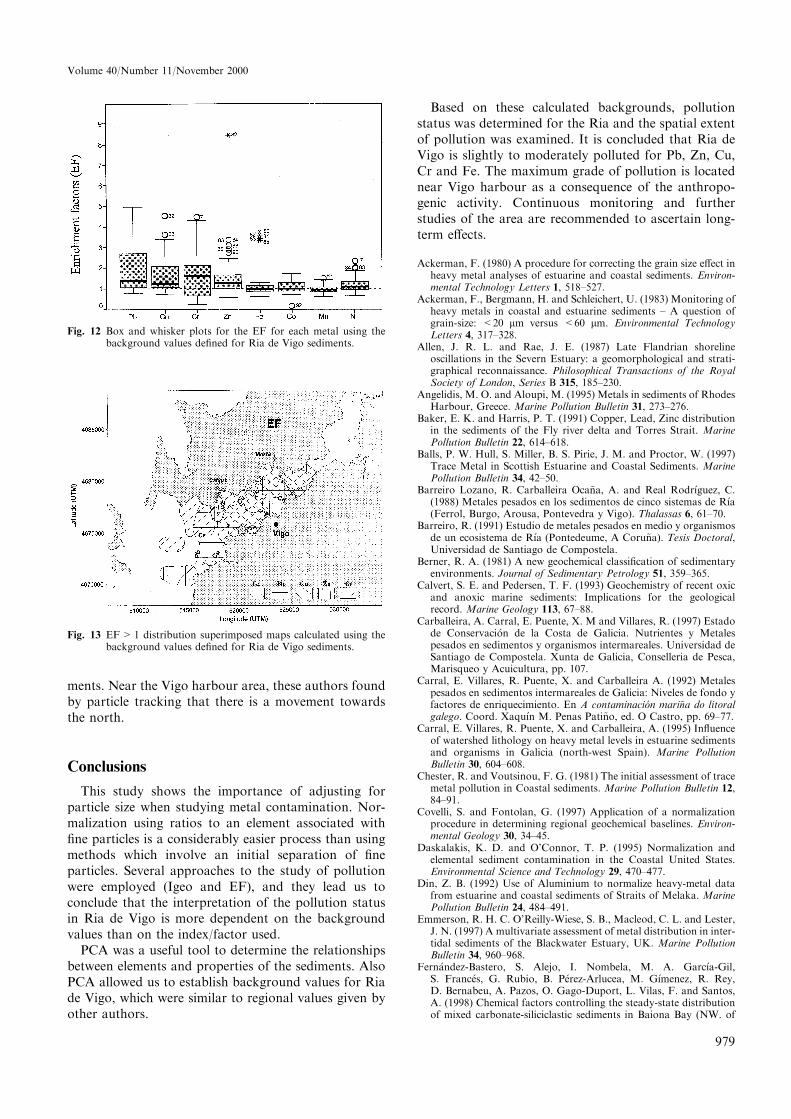
As we have seen previously with the Igeo index an ob-jective evaluation on the degree of heavy-metal con-tamination depends on the choice of an appropriatebackground as a reference level. EF was calculated usingthe previous background values de®ned for the Ria(Table 7). The EF gives similar information as Igeo. Onaverage, no enrichment is noted for Mn, Ni, Co and Fe.Nevertheless, for Fe the samples located along thetransect Vigo-Moa~na are clearly enriched in this elementas was reported in previous paragraphs. On the con-trary, clear signs of enrichment are present for Pb, Cu,Cr and Zn, with maximum values of EF close to 5 (Fig.12). On drawing the superimposed maps for the EF>1(Fig. 13) and comparing with the distribution map forthe Igeo (Fig. 11) we can say that the obtained resultswith both indexes are quite similar between them andthey show the pollution status for the Ria. They con®rmthat inner and southern parts of the Ria are the mosta�ected areas of pollution by Zn, Cu, Cr, Pb and Fe.The transect Vigo-Moa~na is clearly the most a�ectedarea by pollution for these ®ve metals. The urban e�ectof other small villages, such as Cangas, is also noted forZn, Cr and Pb. In comparison with other estuarinesystems (Balls et al., 1997) grade of pollution in Ria deVigo is not very high.
This approach leads us to classify the Ria de Vigo asbeing in a moderate state of contamination for Pb, Cu,Cr, Zn and Fe, especially in the area near Rande Straitand in the surroundings of Vigo harbour. These resultsare consistent with the studies recently carried out byG�omez-Gesteira et al. (1999). In a study of pollutiondispersion in the Ria de Vigo, these authors found thatthe particles coming from the river tend to accumulatearound the Rande Strait despite the existence of strongtidal currents in that area. This is due to low river dis-charge and to the narrowing of the Rande Strait, whichprevents the creation of large gyres in the area. In thisarea ¯occulation processes must be important andtherefore heavy metal accumulation occurs in the sedi-
Fig. 11 Igeo>0 distribution superimposed maps calculated using thebackground values de®ned for Ria de Vigo sediments.
TABLE 7
Comparison between background values for heavy metals given byother authors and calculated for the Ria de Vigo sediments.
ments. Near the Vigo harbour area, these authors foundby particle tracking that there is a movement towardsthe north.
Conclusions
This study shows the importance of adjusting forparticle size when studying metal contamination. Nor-malization using ratios to an element associated with®ne particles is a considerably easier process than usingmethods which involve an initial separation of ®neparticles. Several approaches to the study of pollutionwere employed (Igeo and EF), and they lead us toconclude that the interpretation of the pollution statusin Ria de Vigo is more dependent on the backgroundvalues than on the index/factor used.
PCA was a useful tool to determine the relationshipsbetween elements and properties of the sediments. AlsoPCA allowed us to establish background values for Riade Vigo, which were similar to regional values given byother authors.
Based on these calculated backgrounds, pollutionstatus was determined for the Ria and the spatial extentof pollution was examined. It is concluded that Ria deVigo is slightly to moderately polluted for Pb, Zn, Cu,Cr and Fe. The maximum grade of pollution is locatednear Vigo harbour as a consequence of the anthropo-genic activity. Continuous monitoring and furtherstudies of the area are recommended to ascertain long-term e�ects.
Ackerman, F. (1980) A procedure for correcting the grain size e�ect inheavy metal analyses of estuarine and coastal sediments. Environ-mental Technology Letters 1, 518±527.
Ackerman, F., Bergmann, H. and Schleichert, U. (1983) Monitoring ofheavy metals in coastal and estuarine sediments ± A question ofgrain-size: <20 lm versus <60 lm. Environmental TechnologyLetters 4, 317±328.
Allen, J. R. L. and Rae, J. E. (1987) Late Flandrian shorelineoscillations in the Severn Estuary: a geomorphological and strati-graphical reconnaissance. Philosophical Transactions of the RoyalSociety of London, Series B 315, 185±230.
Angelidis, M. O. and Aloupi, M. (1995) Metals in sediments of RhodesHarbour, Greece. Marine Pollution Bulletin 31, 273±276.
Baker, E. K. and Harris, P. T. (1991) Copper, Lead, Zinc distributionin the sediments of the Fly river delta and Torres Strait. MarinePollution Bulletin 22, 614±618.
Balls, P. W. Hull, S. Miller, B. S. Pirie, J. M. and Proctor, W. (1997)Trace Metal in Scottish Estuarine and Coastal Sediments. MarinePollution Bulletin 34, 42±50.
Barreiro Lozano, R. Carballeira Oca~na, A. and Real Rodr�õguez, C.(1988) Metales pesados en los sedimentos de cinco sistemas de R�õa(Ferrol, Burgo, Arousa, Pontevedra y Vigo). Thalassas 6, 61±70.
Barreiro, R. (1991) Estudio de metales pesados en medio y organismosde un ecosistema de R�õa (Pontedeume, A Coru~na). Tesis Doctoral,Universidad de Santiago de Compostela.
Berner, R. A. (1981) A new geochemical classi®cation of sedimentaryenvironments. Journal of Sedimentary Petrology 51, 359±365.
Calvert, S. E. and Pedersen, T. F. (1993) Geochemistry of recent oxicand anoxic marine sediments: Implications for the geologicalrecord. Marine Geology 113, 67±88.
Carballeira, A. Carral, E. Puente, X. M and Villares, R. (1997) Estadode Conservaci�on de la Costa de Galicia. Nutrientes y Metalespesados en sedimentos y organismos intermareales. Universidad deSantiago de Compostela. Xunta de Galicia, Conselleria de Pesca,Marisqueo y Acuicultura, pp. 107.
Carral, E. Villares, R. Puente, X. and Carballeira A. (1992) Metalespesados en sedimentos intermareales de Galicia: Niveles de fondo yfactores de enriquecimiento. En A contaminaci�on mari~na do litoralgalego. Coord. Xaqu�õn M. Penas Pati~no, ed. O Castro, pp. 69±77.
Carral, E. Villares, R. Puente, X. and Carballeira, A. (1995) In¯uenceof watershed lithology on heavy metal levels in estuarine sedimentsand organisms in Galicia (north-west Spain). Marine PollutionBulletin 30, 604±608.
Chester, R. and Voutsinou, F. G. (1981) The initial assessment of tracemetal pollution in Coastal sediments. Marine Pollution Bulletin 12,84±91.
Covelli, S. and Fontolan, G. (1997) Application of a normalizationprocedure in determining regional geochemical baselines. Environ-mental Geology 30, 34±45.
Daskalakis, K. D. and O'Connor, T. P. (1995) Normalization andelemental sediment contamination in the Coastal United States.Environmental Science and Technology 29, 470±477.
Din, Z. B. (1992) Use of Aluminium to normalize heavy-metal datafrom estuarine and coastal sediments of Straits of Melaka. MarinePollution Bulletin 24, 484±491.
Emmerson, R. H. C. O'Reilly-Wiese, S. B., Macleod, C. L. and Lester,J. N. (1997) A multivariate assessment of metal distribution in inter-tidal sediments of the Blackwater Estuary, UK. Marine PollutionBulletin 34, 960±968.
Fern�andez-Bastero, S. Alejo, I. Nombela, M. A. Garc�õa-Gil,S. Franc�es, G. Rubio, B. P�erez-Arlucea, M. G�õmenez, R. Rey,D. Bernabeu, A. Pazos, O. Gago-Duport, L. Vilas, F. and Santos,A. (1998) Chemical factors controlling the steady-state distributionof mixed carbonate-siliciclastic sediments in Baiona Bay (NW. of
Fig. 12 Box and whisker plots for the EF for each metal using thebackground values de®ned for Ria de Vigo sediments.
Fig. 13 EF>1 distribution superimposed maps calculated using thebackground values de®ned for Ria de Vigo sediments.
979
Volume 40/Number 11/November 2000
Spain). In Proceedings of the 15th International SedimentologicalCongress, pp. 327±328. Alicante.
Finney, B. P. and Huh, C. A. (1989) History of metal pollution in thesouthern California Bight: an update. Environmental Science andTechnology 23, 294±303.
Folk, R. L. (1974) Petrology of Sedimentary Rocks. HemphillPublishing, Austin, Texas, 182 pp.
F�orstner, U. and Wittmann, G. T. (1981) Metal Pollution in theAquatic Environment. Springer, London 486 pp.
Gibbs, R. J. (1993) Metals of the bottom muds in townsville harbor,Australia. Environmental Pollution 81, 297±300.
Guiti�an, F. and Carballas, T. (1976) T�ecnicas de an�alisis de suelos. Ed.Picro Sacro, Santiago.
G�omez-Gesteira, M. Montero, P. Prego, R. Taboada, J. J. Leitao, P. Ruiz-Villareal, M. Neves, R. and P�erez-Villar, V. (1999) A two-dimensionalparticle tracking model for pollution dispersion in A Coru~na and VigoRias (north-west Spain). Oceanologica Acta 22, 167±177.
Horowitz, A. J. and Elrick, K. A. (1987) The relation of streamsediment surface area, grain size and composition to trace elementchemistry. Applied Geochemistry 2, 437±451.
I.N.E. Instituto Nacional de Estad�õstica (1996). Padr�on Municipal dehabitantes a 1 de Mayo de 1996.
Kersten, M. Balls, P. W. van Enk, R. J. Green, N. Kramer, K. J. M.Krievs, M. Monteny, F. and Zwolsman, J. J. G. (1994) Backgroundconcentrations for metals in the north sea: sediment, water, mussels,and atmosphere. In Circulation and Contaminant Fluxes in the NorthSea, ed. J. Sundermann, pp. 290±316. Springer, Berlin.
Klamer, H. J. C. Hegeman, W. J. M. and Smedes, F. (1990)Comparison of grain size correction procedures from organicmicropollutants and heavy metals in marine sediments. Hydrobio-logia 208, 123±220.
Lee, C. L. Fang, M. D. and Hsieh, M. T. (1998) Characterization anddistribution of metals in sur®cial sediments in SouthwesternTaiwan. Marine Pollution Bulletin 36, 464±471.
Loring, D. H. (1990) Lithium-a new approach for the granulometricalnormalization of trace metal data. Marine Chemistry 29, 156±168.
Loring, D. H. and Rantala, R.T.T. (1992) Manual for the geochemicalanalyses of marine sediments and suspended particulate matter.Earth-Sciences Review 32, 235±283.
Loring, D. H., Naes, K. Dahle, S. Matishow, G. G. and Illin, G. (1995)Arsenic, trace metals, and organic micro contaminants in sedimentsfrom the Pechora Sea, Russia. Marine Geology 128, 153±167.
Mackey, A. P. and Hodgkinson, M. (1995) Concentrations and spatialdistribution of trace metals in mangrove sediments from theBrisbane River, Australia. Environmental Pollution 90, 181±186.
McCave, I. N. (1984) Size spectra and aggregation of suspendedparticles in the deep ocean. Deep Sea Research 31, 329±352.
M�uller, G. (1979) Schwermetalle in den sedimenten des Rheins-Ver�anderungen seitt 1971. Umschan 79, 778±783.
Nombela, M. A. Vilas, F. and Evans, G. (1995) Sedimentation in themesotidal Rias Bajas of Galicia (nort-western Spain): Ensenada deSan Sim�on, Inner Ria de Vigo. Special Publications InternationalAssociation of Sedimentologists 24, 133±149.
Pazos, O. Gago-Duport, L. Rey, D. Rubio, B. and F�ernandez-S�anchez, S. (1997) Formaci�on de �oxidos de hierro y glauconita encarbonatos en las Rias Bajas. In Proceedings of the Second Simposiosobre el Margen Continental Ib�erico Atl�antico, pp. 189±190. C�adiz.
Pazos, O. and Nombela, M. A. (1996) Material s�olido en suspensi�on deprocedencia continental en la Ria de Vigo. In Proceedings of theVIII Seminario Ib�erico de Qu�õmica Marina, Vigo.
Prego, R. and Fraga, F. (1992). A simple model to calculatethe residual ¯ows in a Spanish ria. Hydrographic consequencesin the Ria of Vigo. Estuarine, Coastal and Shelf Science 34,603±615.
Rowlatt, S. M. and Lovell, D. R. (1994) Lead, Zinc and Chromium inSediments around England and Wales.Marine Pollution Bulletin 28,324±329.
Ryan, J. D. and Windom, H. L. (1988) A geochemical and statisticalapproach for assessing metal pollution in coastal sediments. InMetals in Coastal environments of LatinAmerica, ed. U. Seeliger, pp.47±58. Springer, Berlin.
Sahu, K. C. and Bhosale, U. (1991) Heavy metal pollution around theisland city of Bombay, India. Part I: quanti®cation of heavy metalpollution of aquatic sediments and recognition of environmentaldiscriminants. Chemical Geology 91, 263±283.
Schramel, P. Klose, B. J. and Hasse, S. (1982) E�ciency of ICPEmission Spectroscopy for the determination of trace elements inBio-medical and environmental samples. Fresenius Zeitschrift fuerAnalytische Chemie 310, 209±216.
Shan, C. and Stephens, D. B. (1994) Recommendations for usageof SURFER to Gridding Model Results. Ground Water 32,503±506.
Shrader Jr., E. L. Rule, J. H. and Furbish W. J. (1977) Trace metalgeochemistry of a ¯uvial system in eastern Tennessee afected bycoal mining. Southeastern Geology 18, 157±172.
Sinex, S. A. and Wright, D. A. (1988) Distribution of trace metals inthe sediments and biota of Chesapake Bay. Marine PollutionBulletin 19, 425±431.
Soares, H. M. V. M. Boaventura, R. A. R. Machado, A. A. S. C. andEsteves da Silva J.C. G. (1999) Sediments as monitors of heavymetal contamination in the Ave river basin (Portugal): multivariateanalysis of data. Environmental Pollution 105, 311±323.
Steiger, B. Webster, R. Shulin, R. and Lehmann, R. (1996) Mappingheavy metals in polluted soil by disjunctive kriging. EnvironmentalPollution 94, 205±215.
Stoeppler, M. (1992) Hazardous Metals in the Environment. Elsevier,Amsterdam, London, pp. 541.
Subramanian, V. and Mohanachandran, G. (1990) Heavy metalsdistribution and enrichment in the sediments of Southern EastCoast of India. Marine Pollution Bulletin 2, 324±330.
Turekian, K. K. and Wedepohl, K. H. (1961) Distribution of theelements in some major units of the Earth's Crust. GeologicalSociety American Bulletin 72, 175±192.
Vilas, F. Nombela, M. A. Garc�õa-Gil, E. Garc�õa-Gil, S. Alejo, I.Rubio, B. and Pazos, O. (1995) Cartograf�õa de sedimentossubmarinos, R�õa de Vigo. E: 1:50.000. Xunta de Galicia, 40 pp.
Wangersky, P. J. (1986) Biological control of trace metal residencetime and speciation: A review and synthesis. Marine Chemistry 18,269±297.
Ward, I. A. K. Larcombe, P. and Cu�, C. (1995) Stratigraphic controlof the geochemistry of Holocene inner-shelf facies, Great BarrierReef. Marine Geology 129, 47±62.
WHO-World Health Organization. (1992) Cadmium: environmentalaspects. Environmental Health Criteria: 135, Geneva, pp. 156.
Zitko, V. (1994) Principal component analysis in the evaluation ofenvironmental data. Marine Pollution Bulletin 28, 718±722.
Zwolsman, J. J. G. van Eck, G. T. M. and Berger, G. (1996) Spatialand temporal distribution of trace metals in sediments from theScheldt Estuary, south-west Netherlands. Estuarine, Coastal andShelf Science 43, 55±79.


![Sandstone-Shale Geochemistry of Miocene Surma Group in ...article.esjournal.org › pdf › 10.11648.j.earth.20200901.15.pdf · 3]. Hence, the geochemistry of clastic sediments represents](https://static.documents.pub/doc/80x56/5ed930046714ca7f47694ec3/sandstone-shale-geochemistry-of-miocene-surma-group-in-a-pdf-a-1011648jearth2020090115pdf.jpg)


